 Bin Qi1†
 Guo-Xiong Deng
 Liu Miao
94% of researchers rate our articles as excellent or good
Learn more about the work of our research integrity team to safeguard the quality of each article we publish.
Find out more
ORIGINAL RESEARCH article
Front. Genet., 26 January 2021
Sec. Computational Genomics
Volume 11 - 2020 | https://doi.org/10.3389/fgene.2020.613744
This article is part of the Research TopicBioinformatics Analysis of Omics Data for Biomarker Identification in Clinical ResearchView all 45 articles
The current research attempted to identify possible hub genes and pathways of coronary artery disease (CAD) and to detect the possible mechanisms. Array data from GSE90074 were downloaded from the Gene Expression Omnibus (GEO) database. Integrated weighted gene co-expression network analysis (WGCNA) was performed to analyze the gene module and clinical characteristics. Gene Ontology annotation (GO), Disease Ontology (DO) and the Kyoto Encyclopedia of Genes and Genomes (KEGG) pathway enrichment analyses were performed by clusterProfiler and the DOSE package in R. A protein-protein interaction (PPI) network was established using Cytoscape software, and significant modules were analyzed using Molecular Complex Detection (MCODE) to identify hub genes. Then, further functional validation of hub genes in other microarrays and population samples was performed, and survival analysis was performed to investigate the prognosis. A total of 660 genes were located in three modules and associated with CAD. GO functions identified 484 biological processes, 39 cellular components, and 22 molecular functions with an adjusted P < 0.05. In total, 38 pathways were enriched in KEGG pathway analysis, and 147 DO items were identified with an adjusted P < 0.05 (false discovery rate, FDR set at < 0.05). There was a total of four modules with a score > 10 after PPI network analysis using the MCODE app, and two hub genes (TLR2 and CD14) were identified. Then, we validated the information from the GSE60993 dataset using the GSE59867 dataset and population samples, and we found that these two genes were associated with plaque vulnerability. These two genes varied at different time points after myocardial infarction, and both of them had the lowest prognosis of heart failure when they were expressed at low levels. We performed an integrated WGCNA and validated that TLR2 and CD14 were closely associated with the severity of coronary artery disease, plaque instability and the prognosis of heart failure after myocardial infarction.
With the continuous improvement of living standards, the incidence of coronary artery disease (CAD) is also increasing. According to the latest epidemiological studies, the number of CAD patients will increase rapidly in the next 10 years (Chen et al., 2018). As a multifactorial and complex disorder, many genetic complications and environmental exposures, including early family history, unhealthy life habits (such as smoking and excessive drinking), hypertension, dyslipidemia, obesity and diabetes, can result in CAD (Yamada et al., 2015; Abram et al., 2017; Chiu et al., 2018; Madhavan et al., 2018). At the same time, improvements in science and technology have provided us with a new understanding of CAD that abnormal gene expression plays an important role in the pathogenesis of CAD (Malakar et al., 2019).
With the remarkable evolution of bioinformatics, numerous microarray data can be used to identify hub genes, interaction networks and pathways of CAD. However, detection of these characteristics remains challenging. Weighted gene co-expression network analysis (WGCNA) (Miao et al., 2019a) is a highly used systems biology method that enables integrated analysis of gene expression and clinical traits. We constructed an mRNA expression profile of CAD samples to screen gene modules that are closely related and highly coregulated with CAD to show the potential molecular mechanisms.
Here, our current study analyzed CAD gene expression profile datasets from the Gene Expression Omnibus (GEO) database by constructing an integrated WGCNA strategy to consult the molecular mechanisms of CAD and to identify hub genes as theoretical prognostic molecules. Then, we further validated the selected hub genes in another dataset to determine whether hub genes play a role in plaque stability. Finally, we validated the relationship between the expression of hub genes and heart failure after myocardial infarction.
A total of three datasets were downloaded from GEO (https://www.ncbi.nlm.nih.gov/geo/). GSE90074 (Ravi et al., 2017) was based on the platform of GPL6480 Agilent-014850 Whole Human Genome Microarray 4x44K G4112F and contained 143 samples (93 obstructive CAD samples and 50 controls). We used a numerical scale (from 0 to 4) to identify the degree of stenosis in the coronary arteries, with higher numbers indicating more severe stenosis. A coronary artery is defined as 0 when all major coronary arteries have <10% stenosis, 1 when any one coronary artery except the left main coronary artery has 10–70% stenosis, 2 when only one coronary artery has more than 70% stenosis, 3 when two coronary arteries have more than 70% stenosis, 3 when three vessels have more than 70% stenosis and 4 when the left main has more than 50%. GSE60993 (Park et al., 2015) was based on the platform of the Illumina HumanWG-6 v3.0 expression bead chip. This dataset included nine unstable angina (UA) samples, 10 non-ST-segment elevation acute myocardial infarction (NSTEMI) samples, seven ST-segment elevation acute myocardial infarction (STEMI) samples and seven normal controls. We used the GSE60993 dataset to verify the relationship between changes in hub gene expression and plaque vulnerability. GSE59867 (Maciejak et al., 2015) was based on the platform of GPL6244 Affymetrix Human Gene 1.0 ST Array and collected peripheral blood samples from patients (n = 111) with STEMI at four time points (admission, discharge, 1 month after MI, and 6 months after MI). We used the GSE59867 dataset to verify the relationship between the changes in hub gene expression and the incidence of heart failure after myocardial infarction. The CEL file in the microarray was annotated into an expression value matrix by using the Affy package in R, and then, the probe information in the microarray was annotated into gene names. This step was done using the Bioconductor package (hgu133plus2, illuminaHumanv3 and hugene10sttranscriptcluster) in R software (Miao et al., 2018). If the expression value of multiple probe information corresponded to a gene with the same name, the average value was selected as the expression level of that gene. The flowchart can be found in Supplementary Figure 1.
WGCNA, which constructs a scale-free network by correlating gene expression levels with clinical features, is often used for a variety of systematic biological analyses. To ensure that the results of network construction were reliable, we normalized the samples first and then removed the outlier samples. The soft threshold power must be selected according to the standard scale-free networks, and all differential genes were calculated by a power function. Subsequently, the adjacency matrix was transformed into a topological overlap matrix (TOM), and the corresponding dissimilarity (1-TOM) was calculated. The dynamic tree cut method was performed to identify the module by hierarchically clustering genes. A deepSplit value of 2 and a minimum size cutoff of 30 were selected as the distance measure for the resulting dendrogram. A height cutoff of 0.25 was used as the standard to merge highly similar modules. Then, we used the WGCNA package (Langfelder and Horvath, 2008) to run the module preservation function.
We performed Pearson's correlation tests to assess the correlation between clinical characteristics and modules and to identify the meaningful modules. Subsequently, we defined the correlation of the gene expression profile with module eigengenes (Mes) as a module membership (MM), and the correlation (the absolute value) between outer features and gene expression profiles were defined as the gene significance (GS). Then, we performed further analyses for the genes located in the modules of interest with the highest MM and highest GS values.
Gene Ontology (GO), Kyoto Encyclopedia of Genes and Genomes (KEGG) pathway enrichment and Disease Ontology (DO) analyses are three very important components, so we employed clusterProfiler and the DOSE package in R (Yu et al., 2012) to analyze all genes in the modules of interest and to determine the possible mechanisms by which module genes play a role in the correlative clinical features. The cutoff criteria were set at P-value < 0.05 and false discovery rate (FDR) < 0.1. Cytoscape software was employed to visualize and construct a protein-protein interaction (PPI) network, and molecular complex detection (MCODE) (Bader and Hogue, 2003; Shannon et al., 2003) was used to analyze the most notable clustering module. An MCODE score > 8 was a threshold for the next analysis. Subsequently, we selected two genes with the highest semantic similarity value for verification in the GoSemSim package (Yu et al., 2010) in R.
First, to further understand the relationship between hub genes and plaque vulnerability, we downloaded GSE60993 and used it as the training dataset. Then, we compared the expression differences of hub genes among different groups and showed the results in the ggplot2 package (Miao et al., 2019b) in R. Subsequently, the “survival” package (Zhu et al., 2019) in R was used to perform overall survival (heart failure) and disease-free survival analyses for all hub genes. Patients were divided into four groups (high vs. low) based on the hub gene expression level in comparison to the mean expression level of that hub gene. Furthermore, dataset GSE59867, which includes 111 acute myocardial infarction (AMI) samples in which survival time was provided, was used to test the significance of hub genes for heart failure survival. A Kaplan-Meier survival plot was also constructed.
In total, we collected clinical information from 1,029 patients who presented to Liuzhou People's Hospital from June 1, 2018, to May 5, 2019, with acute chest pain and were admitted for coronary angiography. CAD, UA and AMI were diagnosed based on the Fourth Universal Definition of Myocardial Infarction (2018) (Zhuo et al., 2019). Exclusion criteria included subjects with contrast agent sensitivity, incomplete clinical data, poor compliance, obvious surgical contraindications and autoimmune diseases. Biochemical measurements, diagnostic criteria and collected clinical data can be found in our previous manuscript (Miao et al., 2017). Consent was obtained from all subjects for this study, and the Ethics Committee of Liuzhou People's Hospital approved this study (No: Lunshen-2018-KY; Jan. 06, 2018). The study adhered to the Declaration of Helsinki of 1975 (http://www.wma.net/en/30publications/10policies/b3/) and its revision in 2008.
The procedures of blood sample collection, RNA isolation, reverse transcription cDNA and RT-qPCR were the same as those in our previous studies and were carried out in strict accordance with the product instructions and laboratory operating procedures (Miao et al., 2019c). Specific divergent primers were designed to amplify the transcripts and are shown in Supplementary Table 1. The statistical software packages SPSS 22.0 (SPSS Inc., Chicago, IL, USA) and R software (version 3.6.0) were used for statistical analyses. According to the statistical specification, quantitative variables were presented according to the means ± standard deviations, and since TG did not conform to a normal distribution, we used the Wilcoxon-Mann-Whitney test for analysis. Comparisons of percentages between groups were performed by means of the chi-square test. All P-values were two-sided and considered statistically significant according to P < 0.05.
When analyzing GSE90074, we first judged the sample quality. After controlling for quality, all of the samples were well normalized (Supplementary Figure 2). After removing duplicate values and annotating probes, a total of 54,560 expression probes obtained in our expression microarray yielded a matrix of 19,537 gene expression values.
Before constructing the weighted co-expression network, we chose the soft-threshold β parameter as the suitable weighted parameter of the adjacency function. After calculation, we set soft-threshold β as 23 and selected a correlation coefficient close to 0.85 to construct gene modules (Figure 1A). In accordance with the basic idea of WGCNA, we determined the correlation matrix and adjacency matrix of the gene expression profile of all samples with the clinical features, and then converted them to a topological overlap matrix (TOM), which produced a system clustering tree of genes according to gene-gene non-ω similarity. Along with TOM, we performed hierarchical average linkage clustering to distinguish the gene modules of each gene network (deep split = 2, cut height = 0.25) (Figure 1C). In all samples, approximately eight gene modules were recognized in total by the dynamic tree cut (Figure 1B). The genes whose expression levels could not be correlated with clinical features were assigned to the gray module. Therefore, the genes within the gray module were not further analyzed. A heatmap of the topological overlap in the gene network is shown in Figure 1D.
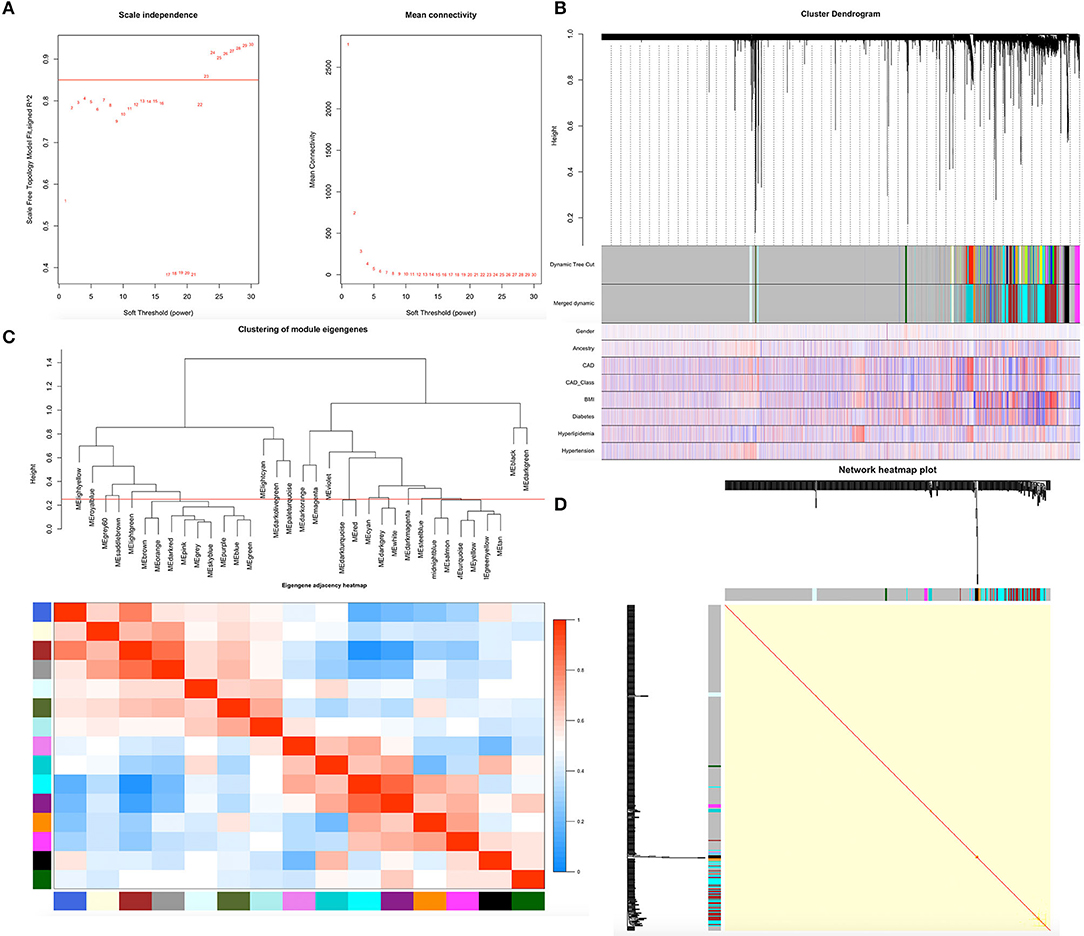
Figure 1. Demonstration of the WGCNA process. (A) Analysis of network topology for various soft-thresholding powers. (B) Clustering dendrogram of genes. Gene clustering tree (dendrogram) obtained by hierarchical clustering of adjacency-based dissimilarity. (C) Relationship among all the modules. (D) Heatmap of the topological overlap in the gene network.
The heatmap showed numerous valued biological significance to identify modules with the most significant and associated clinical characteristics. As shown in Figure 2A, the most interesting associations in the module-feature relationship were the dark turquoise module and CAD (r2 = 0.22, P = 0.007) and the dark turquoise module and CAD_class (r2 = 0.2, P = 0.02). The dark turquoise module membership and gene significance were significantly negatively correlated (r2 = −0.52, P = 2.7E-09) (Figure 2D). Subsequently, we analyzed the relationship between the module and CAD class and found that the brown module and class 0 (r2 = −0.17, P = 0.04) and the yellow module and class 3 (r2 = −0.18, P = 0.03) had the most interesting associations (Figure 2B). The brown and yellow module membership and gene significance were significantly positively correlated (r2 = 0.25, P = 0.0014; r2 = 0.53, P = 8.6E-09, respectively) (Figures 2E,F). From the dark turquoise module, we identified 316 genes in total, and the brown and yellow modules had 244 genes in total. The details of the module genes are shown in Supplementary Tables 2, 3, and a Venn diagram is shown in Figure 2C. The other module did not have enough relationships or statistical significance for further consideration.
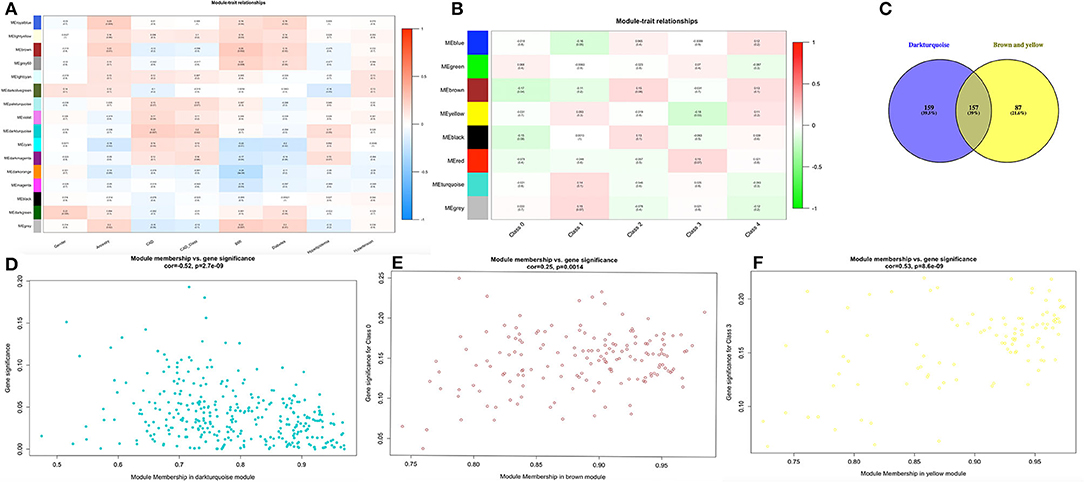
Figure 2. Finding module of interest. (A,B) Module-feature associations. Each row corresponds to a module eigengene, and each column corresponds to a clinical feature. Each cell contains the corresponding correlation in the first line and the P-value in the second line. The table is color-coded by correlation according to the color legend. (C) Venn diagram for these three modules. (D–F) Scatter plot of eigengene modules.
To detect the biological relevance of module genes and function, all three module genes were subjected to GO functional, KEGG pathway and DO enrichment analyses. The results are shown in Figure 3. When analyzing GO functions, we identified 484 biological processes, 39 cellular components, and 22 molecular functions with an adjusted P < 0.05. Table 1 shows the top 10 items. In total, 38 pathways were enriched in KEGG pathway analysis, and 147 DO items with an adjusted P < 0.05 (false discovery rate, FDR set at < 0.05) were identified. Table 2 shows the top 15 items.
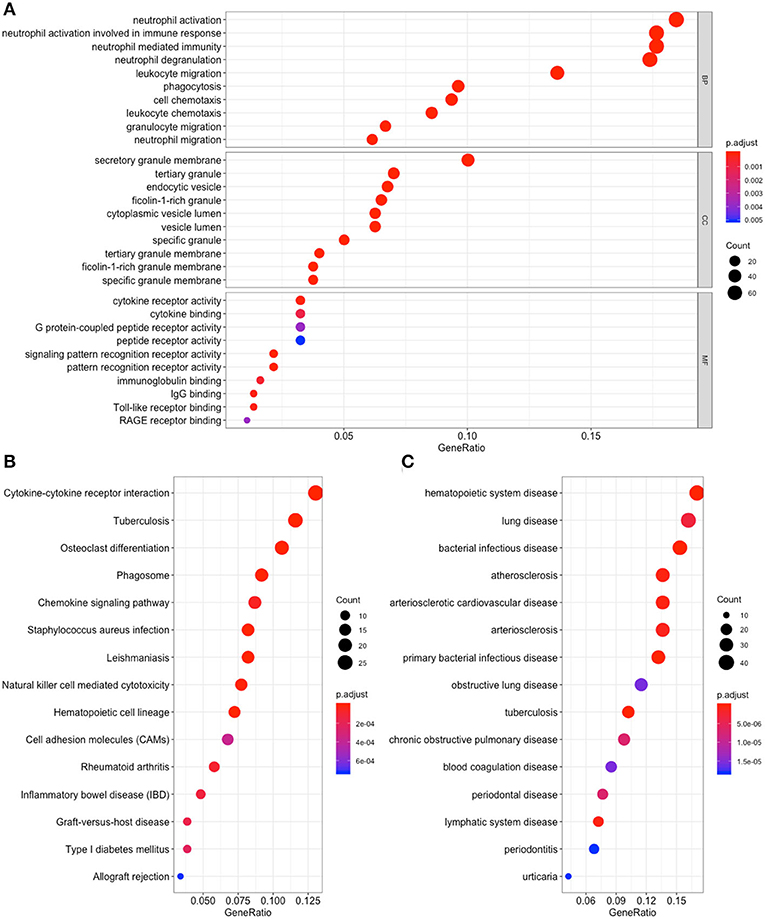
Figure 3. Functional enrichment for genes in the object module. The x-axis shows the ratio number of genes, and the y-axis shows the pathway terms. The –log10 (P-value) of each term is colored according to the legend. (A) Gene Ontology analysis; (B) Kyoto Encyclopedia of Genes and Genomes (KEGG) pathway analysis; (C) Disease Ontology analysis.
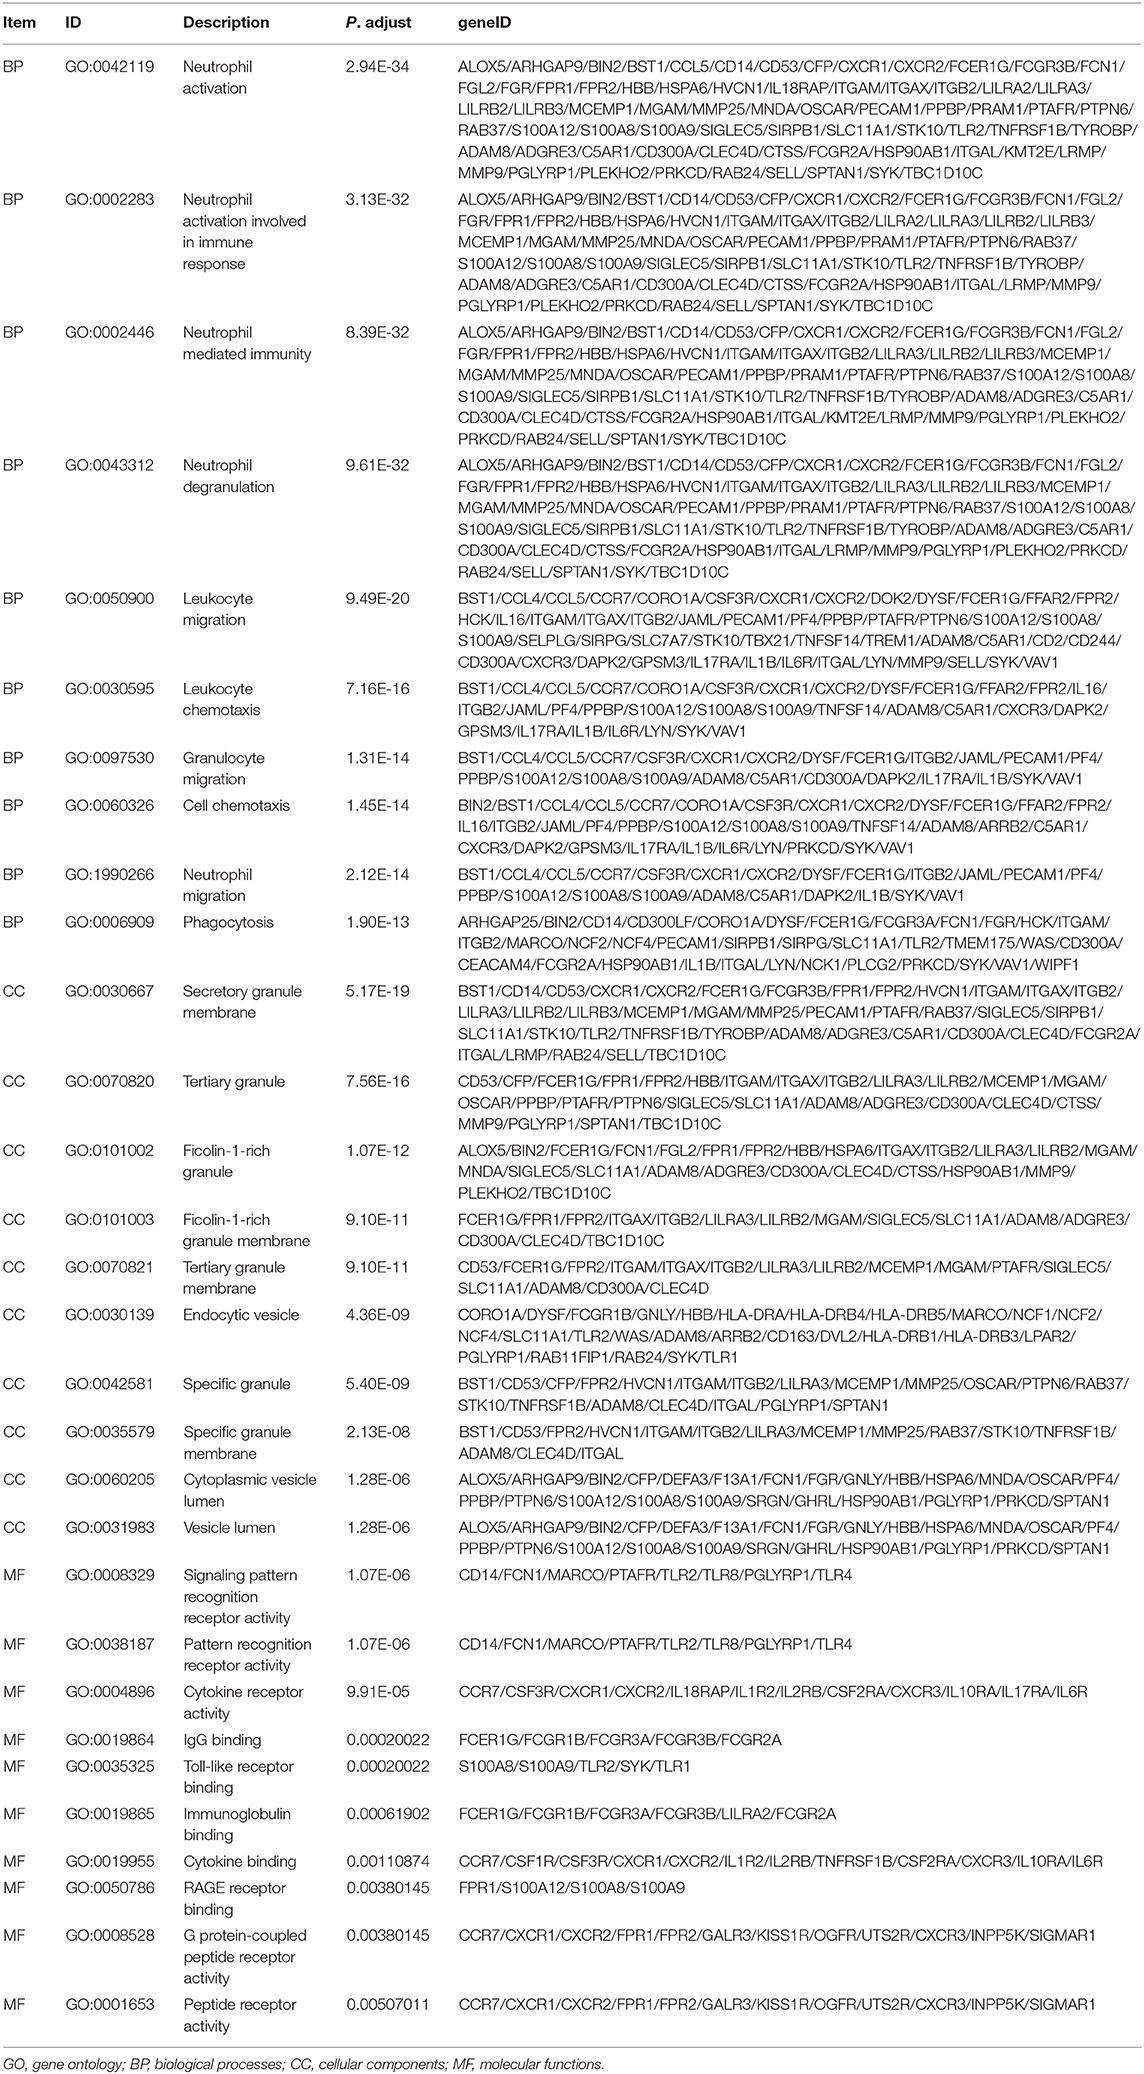
Table 1. GO analysis for genes (top 10 significantly enriched terms).
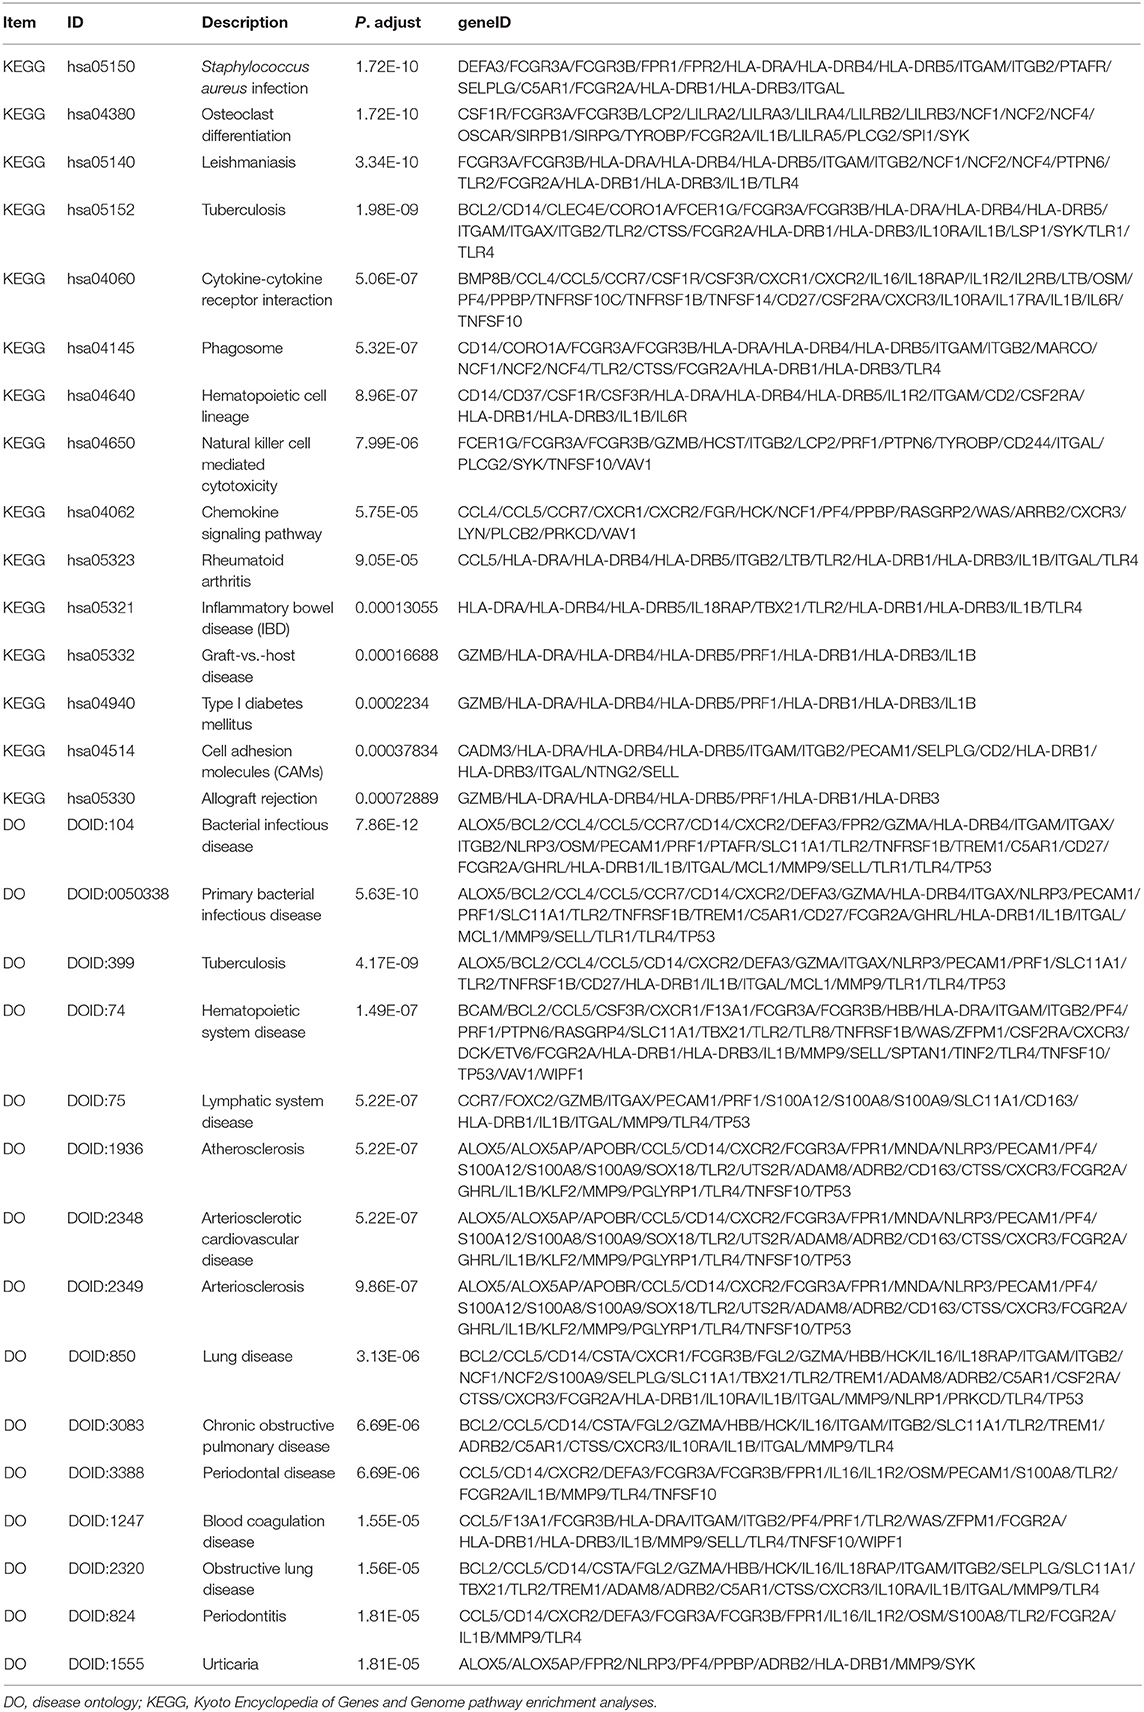
Table 2. KEGG and DO analysis for genes (top 15 significantly enriched terms).
Among these results, several items have been confirmed in previous studies that were associated with CAD, and these included Neutrophil degranulation (GO:0043312); regulation of MAP kinase activity (GO:0043405); Neutrophil activation involved in immune response (GO:0002283); Neutrophil mediated immunity (GO:0002446); Neutrophil activation (GO:0042119); Atherosclerosis (DOID:2349); Atherosclerosis (DOID:1936); Atherosclerotic cardiovascular disease (DOID:2348); Cell adhesion molecules (CAMs) (hsa04514); Cytokine -cytokine receptor interaction (hsa04060); Fluid shear stress and atherosclerosis (hsa05418); Rheumatoid arthritis (hsa05323); and NF-kappa B signaling pathway (hsa04064). The genes located in these items were selected for further analysis.
To elucidate the PPI network of these selected genes, we used the STRING database to perform the analysis. When the cutoff was set as a combined score > 0.9, in total, 3,218 protein pairs and 285 nodes were included. Figure 4A shows the net analysis from Cytoscape. Four modules with a score > 10 were found and are presented in Figures 4B–E for detection using the Molecular Complex Detection (MCODE) app.
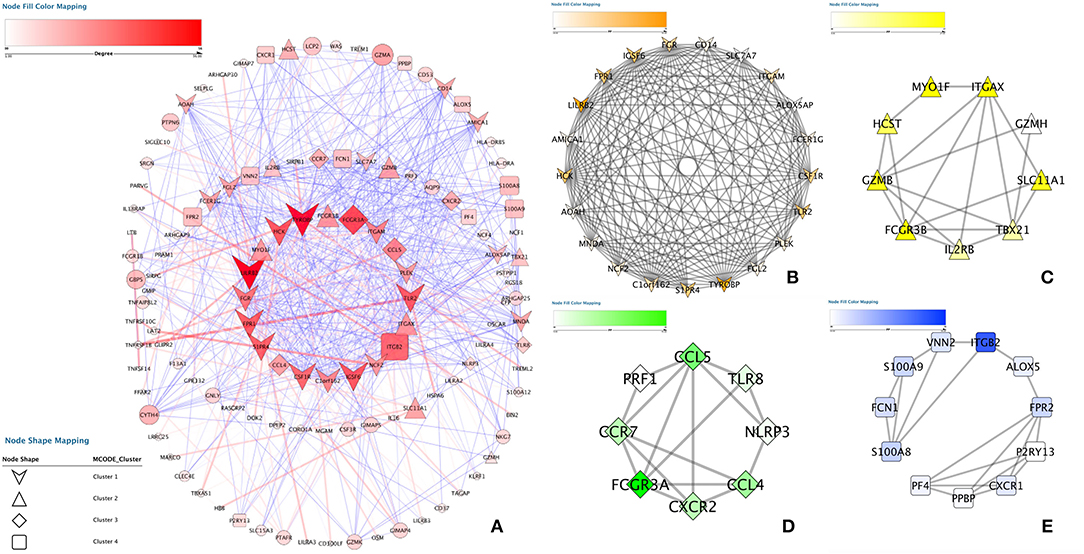
Figure 4. Protein-protein interaction analysis. (A) Protein–protein interaction network of the module genes. Edges represent the interaction between two genes. A degree was used to describe the importance of protein nodes in the network; red shows a high degree, and green presents a low degree. (B–E) The significant modules identified from the protein-protein interaction network using the molecular complex detection method with a score of > 8.0. MCODEB score = 12.537, MCODEc score = 11.4486, MCODED score = 9.301 and MCODEE score = 8.671.
These four modules included 49 genes in total. Finally, approximately six genes demonstrated a high degree of association simultaneously in the submodule analysis and were screened with GO, DO, and KEGG data. These six genes were toll-like receptor 2 (TLR2), CD14 molecule (CD14), NLR family pyrin domain containing 3 (NLRP3), C-X-C motif chemokine receptor 2 (CXCR2), C-C motif chemokine ligand 5 (CCL5) and platelet factor 4 (PF4).
We employed the GoSemSim package in R to analyze the interactions between the proteins and scored them according to their average functional similarity. Proteins with higher scores had higher functional interactions and warranted further investigation. TLR2 and CD14 were the two top-ranked proteins potentially playing central roles in the interaction (Figure 5).
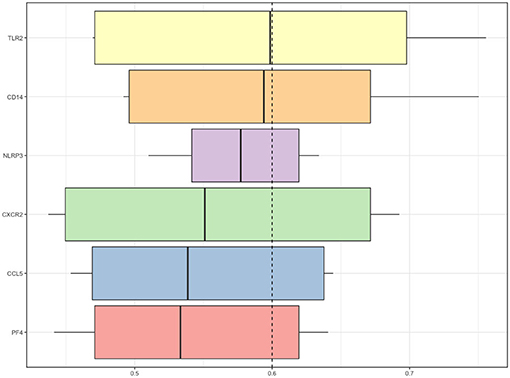
Figure 5. Summary of functional similarities. The distributions of functional similarities are summarized as boxplots. The boxes represent the middle 50% of the similarities. The lines in the boxes indicate the mean of the functional similarities. Proteins with a higher average functional similarity were defined as party proteins, which are considered central proteins. The dashed line represents the cutoff value.
At the same time, we found that the expression of TLR2 was higher in different classes of coronary artery lesions than in class 0, while the expression of CD14 was higher only in class 4 than in class 0. The expression of the other genes was not significantly different in all groups (Figure 6A). This result suggests that TLR2 and CD14 may be related to the severity of coronary atherosclerosis.
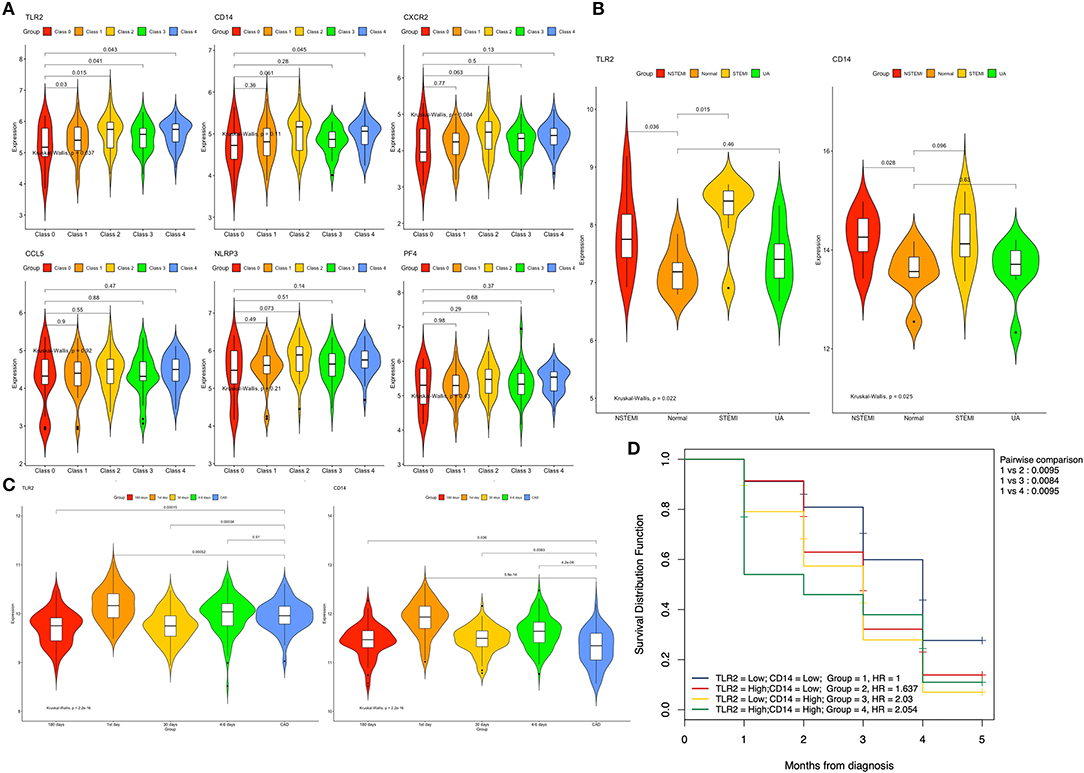
Figure 6. Expression of the hub genes in different datasets. (A) Expression of the six genes among different classes of coronary arteries in GSE90074. (B) Expression of the TLR2 and CD14 genes between patients with different types of acute coronary syndrome and normal controls in GSE60993. (C) Expression of the TLR2 and CD14 genes between different time points after myocardial infarction and stable coronary artery disease in GSE59867. (D) Overall survival curves using combinations of TLR2 and CD14 expression levels in GSE59867. Univariate Cox regression was used to determine the HR, and the log rank P-values is reported; Bonferroni multiple testing adjustment was used for pairwise comparisons (P = 0.05/5 = 0.01). HR, Hazard ratio.
The training data set (GSE60993) was used to verify the correlation between two hub genes (TLR2 and CD14) and atherosclerotic plaque vulnerability. We compared the expression of each candidate hub gene during the development of CAD (including stable CAD, unstable angina, NSTEMI and STEMI) (Table 3). One-way analysis of variance test results showed that the expression of TLR2 was closely related to NSTEMI and STEMI, whereas the expression of CD14 was only closely related to NSTEMI. Patients with acute myocardial infarction had a high level of gene expression (Figure 6B).
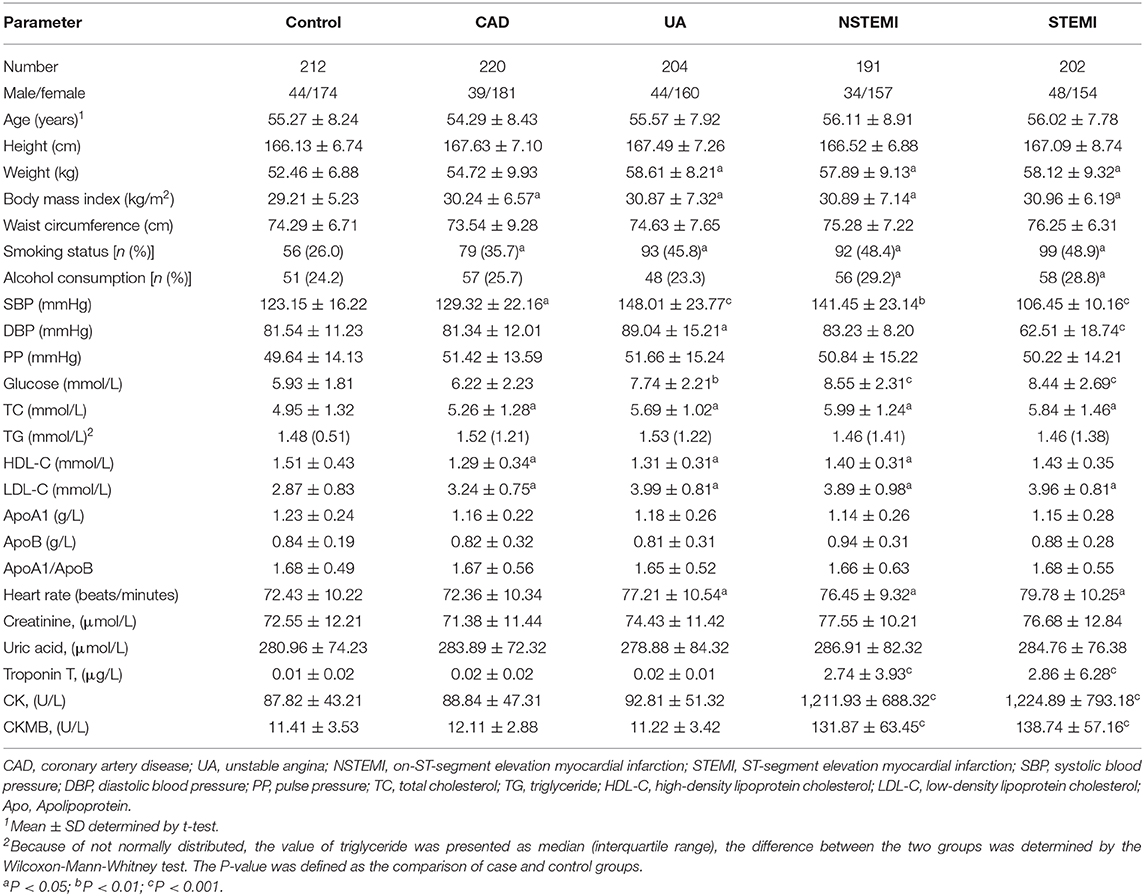
Table 3. Comparison of demographic, lifestyle characteristics and serum lipid levels among different groups.
Subsequently, we compared the gene expression levels of these two genes at different times (1, 4–6, 30, and 180 days) after myocardial infarction. We found that in the TLR2 group, the expression of TLR2 increased significantly in AMI (1 and 4–6 days after MI) but decreased in the convalescent period (30 and 180 days after MI). Similar results were found in the CD14 group, but the expression level of CD14 in convalescence was still higher than that in the stable coronary heart disease group (Figure 6C).
To further explore these two genes and the occurrence of heart failure after myocardial infarction, we performed a two-factor survival analysis on GSE59867. According to the expression of TLR2 and CD14, the patients were divided into four groups according to the median value of TLR2 and CD14. Survival analysis of heart failure events after myocardial infarction was calculated. As shown in Figure 6D, we found that the incidence of heart failure events was the lowest when the expression levels of these two genes were both decreased, which was statistically significant compared with the other three groups (P < 0.01 for all).
As shown in Figure 7, we validated these data in a population sample and came to the same conclusion as the previous microarray data. Both expression levels of TLR2 and CD14 were lowest in the normal group and were high in the population with coronary artery disease and acute coronary syndrome.
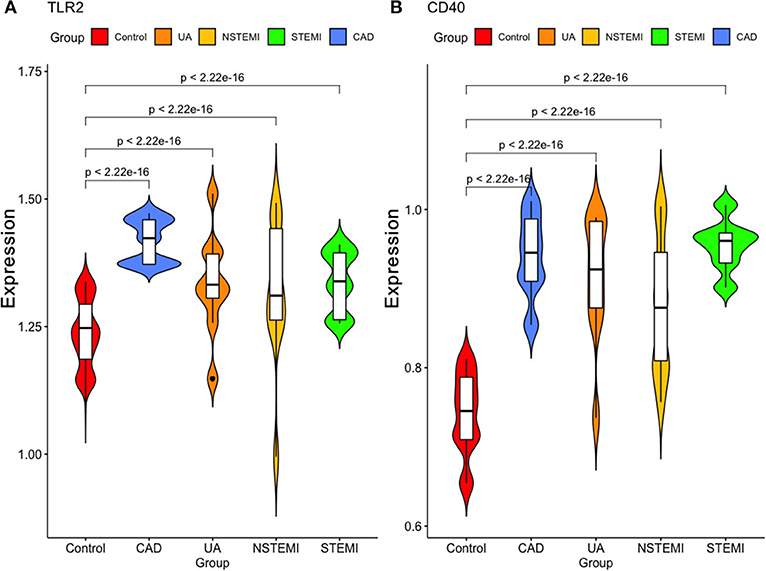
Figure 7. Validation of the expression of these two hub genes in our study sample. (A) TLR2 (B) CD40.
Currently, CAD remains one of the leading causes of death worldwide, and the high morbidity and mortality have become a burden in all countries worldwide, which has gradually attracted people's attention (Benjamin et al., 2018). CAD and gene expression changes are inseparable, and with the continuous progress of technology, the increasing maturity of high-throughput sequencing technology provides a new theoretical basis for our understanding of the pathogenesis of CAD. In the current study, we used integrated WGCNA methods to analyze the dataset and identify two hub genes (TLR2 and CD14) that were positively correlated with the severity of coronary atherosclerosis. Subsequently, we validated these two genes through other datasets and found that they are related to atherosclerotic plaque vulnerability. Increased gene expression is directly related to the onset of AMI and is positively related to heart failure after myocardial infarction.
Toll-like receptors, as a part of the interleukin-1 receptor/toll-like receptor superfamily, are expressed on cell surfaces, where they bind endosomally (TLR11, TLR12, and TLR13), have microbial membrane components (TLR1, TLR2, TLR4, TLR5, and TLR6), or recognize microbial nucleic acids (TLR3, TLR7, TLR8, and TLR9) (Kawai and Akira, 2009). According to previous research, TLR2 and TLR4 can be expressed by macrophages, neutrophils, and dendritic cells and activate NF-κB pathways to lead to CAD (Cole et al., 2010). Schoneveld et al. showed that TLR2 activation increases atherosclerotic plaque formation by using ApoE−/− atherosclerotic mouse molding. In addition, TLR2 can participate in not only initial intimal lesion formation but also occlusive disease development (Schoneveld et al., 2005). Furthermore, in an IL-6-dependent manner, TLR2 can promote vascular smooth muscle cell migration from the tunica media to the intima (Lee et al., 2012). Beyond participating in atheroma development, many studies have demonstrated that TLR2 can activate neutrophils and that free radical production results in coronary endothelial dysfunction after ischemia/reperfusion. This finding suggests that TLR2 may be associated with new dysfunction after myocardial infarction (Favre et al., 2007; Yu and Feng, 2018). In our current study, we found that TLR2 is related not only to the severity of coronary atherosclerosis but also to the vulnerability of plaques. TLR2 is also directly related to heart failure after myocardial infarction. This is consistent with previous research results. This shows that TLR2 is significantly correlated with the development and severity of CAD.
CD14, as an important mediator of inflammatory reactions (Rajasuriar et al., 2015), plays an important role in the process of immunity, inflammation, vascular endothelial dysfunction and atherosclerosis, which have a high risk of contributing to CAD (Hohda et al., 2003). Recent studies on single nucleotide polymorphisms (SNPs) have found that several SNPs of CD14 are associated with CAD and AMI (Shimada et al., 2000; Raza et al., 2018). Lee et al. found that urinary CD14 levels were significantly higher in CAD patients than in normal controls, which may be a potential marker of CAD (Lee et al., 2015). However, the specific pathogenesis has not been systematically elucidated. We speculate that inflammation may be induced by CD14, resulting in immune dysfunction and endothelial dysfunction leading to atherosclerosis. In our current research, we also found that CD14 is related to the severity of coronary atherosclerosis and the vulnerability of plaques. In addition, CD14 could also be directly related to heart failure after myocardial infarction.
First, our data results are only derived from microarray analysis. Although the roles of these two hub genes in the pathogenesis of CAD are described from different dimensions, there is still a lack of further verification. Second, we found that these two hub genes play an important role in the pathogenesis of CAD, but we lack detailed in vivo and in vitro experiments to verify this hypothesis, which is the next step we need to improve.
In conclusion, 143 sample microarray datasets from the GEO database were systematically analyzed. After finishing integrated weighted gene coexpression network analysis, we found that 560 genes may be associated with CAD or a CAD class. Then, we performed GO, DO functional, KEGG pathway enrichment and protein-protein interaction analyses for these genes, and two genes (TLR2 and CD14) were finally identified. When validated with another microarray dataset and population samples, we found that the alteration in the expression of these two genes is related not only to the severity of CAD but also to acute myocardial infarction caused by the vulnerability of arterial plaque and is also directly related to the occurrence of postinfarction heart failure. The specific mechanism may be related to inflammation and immune dysfunction caused by these two genes, but further large-scale experiments are needed to verify and elaborate the specific mechanism.
The original contributions presented in the study are included in the Supplementary Material, further inquiries can be directed to the corresponding author.
The studies involving human participants were reviewed and approved by consent was obtained from all subjects for this study, and the Ethics Committee of Liuzhou People's Hospital approved this study (No: Lunshen-2018-KY; Jan. 06, 2018). The ethics committee waived the requirement of written informed consent for participation.
BQ and J-HC conceived the study, participated in the design, performed the statistical analyses, and drafted the manuscript. LM conceived the study, participated in the design, and helped to draft the manuscript. C-MZ and G-XD drafted the paper. YW and LT revised the paper. All authors contributed to the article and approved the submitted version.
The authors acknowledge the essential role of the funding of National Natural Science Foundation of China (NSFC: 82060072), National Natural Science Foundation of Guangxi (2020JJA140129), Guangxi self-financing research projects (Z20190025, Z20201226, and Z20200165), the project of Liuzhou people's Hospital (LRY202007), Project of Liuzhou Science and Technology (2020NBAB0818), and Guangxi Medical and health key discipline construction project.
The authors declare that the research was conducted in the absence of any commercial or financial relationships that could be construed as a potential conflict of interest.
The Supplementary Material for this article can be found online at: https://www.frontiersin.org/articles/10.3389/fgene.2020.613744/full#supplementary-material
Apo, apolipoprotein; BMI, body mass index; ACS, acute coronary syndrome; CAD, coronary artery disease; CAMs, Cell adhesion molecules; DO, disease ontology; GAPDH, glyceraldehyde-3-phosphate dehydrogenase; GEO, Gene Expression Omnibus; GO, gene ontology; HDL-C, high-density lipoprotein cholesterol; KEGG, Kyoto Encyclopedia of Genes and genomes; LDL-C, low-density lipoprotein cholesterol; MAPK, Mitogen activated protein kinase; MCODE, molecular complex detection; MI, myocardial infarction; PPI, protein-protein interaction; qRT-PCR, quantitative real-time PCR; TC, total cholesterol; TG, triglyceride.
Abram, S., Arruda-Olson, A. M., Scott, C. G., Pellikka, P. A., Nkomo, V. T., Oh, J. K., et al. (2017). Frequency, predictors, and implications of abnormal blood pressure responses during dobutamine stress echocardiography. Circ. Cardiovasc. Imaging 10:e005444. doi: 10.1161/CIRCIMAGING.116.005444
Bader, G. D., and Hogue, C. W. (2003). An automated method for finding molecular complexes in large protein interaction networks. BMC Bioinformatics 4:2. doi: 10.1186/1471-2105-4-2
Benjamin, E. J., Virani, S. S., Callaway, C. W., Chamberlain, A. M., Chang, A. R., Cheng, S., et al. (2018). Heart disease and stroke statistics-2018 update: A Report From the American Heart Association. Circulation 137, e67–e492. doi: 10.1161/CIR.0000000000000558
Chen, Z. H., Zhang, M., Li, Y. C., Zhao, Z. P., Zhang, X., Huang, Z. J., et al. (2018). Study on relationship between prevalence or co-prevalence of risk factors for cardiovascular disease and blood pressure level in adults in China. Zhonghua Liu Xing Bing Xue Za Zhi 39, 640–645. doi: 10.3760/cma.j.issn.0254-6450.2018.05.019
Chiu, M. H., Heydari, B., Batulan, Z., Maarouf, N., Subramanya, V., Schenck-Gustafsson, K., et al. (2018). Coronary artery disease in post-menopausal women: are there appropriate means of assessment? Clin. Sci. 132, 1937–1952. doi: 10.1042/CS20180067
Cole, J. E., Georgiou, E., and Monaco, C. (2010). The expression and functions of toll-like receptors in atherosclerosis. Mediat. Inflamm. 2010:393946. doi: 10.1155/2010/393946
Favre, J., Musette, P., Douin-Echinard, V., Laude, K., Henry, J. P., Arnal, J. F., et al. (2007). Toll-like receptors 2-deficient mice are protected against postischemic coronary endothelial dysfunction. Arterioscler. Thromb. Vasc. Biol. 27, 1064–1071. doi: 10.1161/ATVBAHA.107.140723
Hohda, S., Kimura, A., Sasaoka, T., Hayashi, T., Ueda, K., Yasunami, M., et al. (2003). Association study of CD14 polymorphism with myocardial infarction in a Japanese population. Jpn. Heart J. 44, 613–622. doi: 10.1536/jhj.44.613
Kawai, T., and Akira, S. (2009). The roles of TLRs, RLRs and NLRs in pathogen recognition. Int. Immunol. 21, 317–337. doi: 10.1093/intimm/dxp017
Langfelder, P., and Horvath, S. (2008). WGCNA: an R package for weighted correlation network analysis. BMC Bioinformatics 9:559. doi: 10.1186/1471-2105-9-559
Lee, G. L., Chang, Y. W., Wu, J. Y., Wu, M. L., Wu, K. K., Yet, S. F., et al. (2012). TLR 2 induces vascular smooth muscle cell migration through cAMP response element-binding protein-mediated interleukin-6 production. Arterioscler. Thromb. Vasc. Biol. 32, 2751–2760. doi: 10.1161/ATVBAHA.112.300302
Lee, M. Y., Huang, C. H., Kuo, C. J., Lin, C. L., Lai, W. T., and Chiou, S. H. (2015). Clinical proteomics identifies urinary CD14 as a potential biomarker for diagnosis of stable coronary artery disease. PLoS ONE 10:e0117169. doi: 10.1371/journal.pone.0117169
Maciejak, A., Kiliszek, M., Michalak, M., Tulacz, D., Opolski, G., Matlak, K., et al. (2015). Gene expression profiling reveals potential prognostic biomarkers associated with the progression of heart failure. Genome Med. 7:26. doi: 10.1186/s13073-015-0149-z
Madhavan, M. V., Gersh, B. J., Alexander, K. P., Granger, C. B., and Stone, G. W. (2018). Coronary artery disease in patients >/=80 years of age. J. Am. Coll. Cardiol. 71, 2015–2040. doi: 10.1016/j.jacc.2017.12.068
Malakar, A. K., Choudhury, D., Halder, B., Paul, P., Uddin, A., and Chakraborty, S. (2019). A review on coronary artery disease, its risk factors, and therapeutics. J. Cell. Physiol. 234, 16812–16823. doi: 10.1002/jcp.28350
Miao, L., Yin, R. X., Pan, S. L., Yang, S., Yang, D. Z., and Lin, W. X. (2018). Weighted gene co-expression network analysis identifies specific modules and hub genes related to hyperlipidemia. Cell. Physiol. Biochem. 48, 1151–1163. doi: 10.1159/000491982
Miao, L., Yin, R. X., Pan, S. L., Yang, S., Yang, D. Z., and Lin, W. X. (2019a). Circulating miR-3659 may be a potential biomarker of dyslipidemia in patients with obesity. J. Transl. Med. 17:25. doi: 10.1186/s12967-019-1776-8
Miao, L., Yin, R. X., Yang, S., Huang, F., Chen, W. X., and Cao, X. L. (2017). Association between single nucleotide polymorphism rs9534275 and the risk of coronary artery disease and ischemic stroke. Lipids Health Dis. 16:193. doi: 10.1186/s12944-017-0584-5
Miao, L., Yin, R. X., Zhang, Q. H., Hu, X. J., Huang, F., Chen, W. X., et al. (2019b). Integrated DNA methylation and gene expression analysis in the pathogenesis of coronary artery disease. Aging 11, 1486–1500. doi: 10.18632/aging.101847
Miao, L., Yin, R. X., Zhang, Q. H., Hu, X. J., Huang, F., Chen, W. X., et al. (2019c). A novel lncRNA-miRNA-mRNA triple network identifies lncRNA TWF1 as an important regulator of miRNA and gene expression in coronary artery disease. Nutr. Metab. 16:39. doi: 10.1186/s12986-019-0366-3
Park, H. J., Noh, J. H., Eun, J. W., Koh, Y. S., Seo, S. M., Park, W. S., et al. (2015). Assessment and diagnostic relevance of novel serum biomarkers for early decision of ST-elevation myocardial infarction. Oncotarget 6, 12970–12983. doi: 10.18632/oncotarget.4001
Rajasuriar, R., Kong, Y. Y., Nadarajah, R., Abdullah, N. K., Spelman, T., Yuhana, M. Y., et al. (2015). The CD14 C-260T single nucleotide polymorphism (SNP) modulates monocyte/macrophage activation in treated HIV-infected individuals. J. Transl. Med. 13:30. doi: 10.1186/s12967-015-0391-6
Ravi, S., Schuck, R. N., Hilliard, E., Lee, C. R., Dai, X., Lenhart, K., et al. (2017). Clinical evidence supports a protective role for CXCL5 in coronary artery disease. Am. J. Pathol. 187, 2895–2911. doi: 10.1016/j.ajpath.2017.08.006
Raza, S. T., Abbas, S., Eba, A., Karim, F., Wani, I. A., Rizvi, S., et al. (2018). Association of COL4A1 (rs605143, rs565470) and CD14 (rs2569190) genes polymorphism with coronary artery disease. Mol. Cell. Biochem. 445, 117–122. doi: 10.1007/s11010-017-3257-9
Schoneveld, A. H., Oude Nijhuis, M. M., Van Middelaar, B., Laman, J. D., De Kleijn, D. P., and Pasterkamp, G. (2005). Toll-like receptor 2 stimulation induces intimal hyperplasia and atherosclerotic lesion development. Cardiovasc. Res. 66, 162–169. doi: 10.1016/j.cardiores.2004.12.016
Shannon, P., Markiel, A., Ozier, O., Baliga, N. S., Wang, J. T., Ramage, D., et al. (2003). Cytoscape: a software environment for integrated models of biomolecular interaction networks. Genome. Res. 13, 2498–2504. doi: 10.1101/gr.1239303
Shimada, K., Watanabe, Y., Mokuno, H., Iwama, Y., Daida, H., and Yamaguchi, H. (2000). Common polymorphism in the promoter of the CD14 monocyte receptor gene is associated with acute myocardial infarction in Japanese men. Am. J. Cardiol. 86, 682–684, A688. doi: 10.1016/S0002-9149(00)01054-7
Yamada, Y., Matsui, K., Takeuchi, I., and Fujimaki, T. (2015). Association of genetic variants with coronary artery disease and ischemic stroke in a longitudinal population-based genetic epidemiological study. Biomed. Rep. 3, 413–419. doi: 10.3892/br.2015.440
Yu, G., Li, F., Qin, Y., Bo, X., Wu, Y., and Wang, S. (2010). GOSemSim: an R package for measuring semantic similarity among GO terms and gene products. Bioinformatics 26, 976–978. doi: 10.1093/bioinformatics/btq064
Yu, G., Wang, L. G., Han, Y., and He, Q. Y. (2012). clusterProfiler: an R package for comparing biological themes among gene clusters. OMICS 16, 284–287. doi: 10.1089/omi.2011.0118
Yu, L., and Feng, Z. (2018). The role of toll-like receptor signaling in the progression of heart failure. Mediat. Inflamm. 2018:9874109. doi: 10.1155/2018/9874109
Zhu, Z., Jin, Z., Deng, Y., Wei, L., Yuan, X., Zhang, M., et al. (2019). Co-expression network analysis identifies four hub genes associated with prognosis in soft tissue sarcoma. Front. Genet. 10:37. doi: 10.3389/fgene.2019.00037
Keywords: gene expression omnibus, integrated weighted gene co-expression network analysis, functional enrichment, functional validation, prognostic analysis, coronary artery disease
Citation: Qi B, Chen J-H, Tao L, Zhu C-M, Wang Y, Deng G-X and Miao L (2021) Integrated Weighted Gene Co-expression Network Analysis Identified That TLR2 and CD14 Are Related to Coronary Artery Disease. Front. Genet. 11:613744. doi: 10.3389/fgene.2020.613744
Received: 03 October 2020; Accepted: 15 December 2020;
Published: 26 January 2021.
Edited by:
Hongwei Wang, Sun Yat-sen University, ChinaCopyright © 2021 Qi, Chen, Tao, Zhu, Wang, Deng and Miao. This is an open-access article distributed under the terms of the Creative Commons Attribution License (CC BY). The use, distribution or reproduction in other forums is permitted, provided the original author(s) and the copyright owner(s) are credited and that the original publication in this journal is cited, in accordance with accepted academic practice. No use, distribution or reproduction is permitted which does not comply with these terms.
*Correspondence: Liu Miao, ZHIubWlhb2xpdUBxcS5jb20=
†These authors have contributed equally to this work
Disclaimer: All claims expressed in this article are solely those of the authors and do not necessarily represent those of their affiliated organizations, or those of the publisher, the editors and the reviewers. Any product that may be evaluated in this article or claim that may be made by its manufacturer is not guaranteed or endorsed by the publisher.
Research integrity at Frontiers
Learn more about the work of our research integrity team to safeguard the quality of each article we publish.