 Hao Zuo
 Luojun Chen1,2†
95% of researchers rate our articles as excellent or good
Learn more about the work of our research integrity team to safeguard the quality of each article we publish.
Find out more
ORIGINAL RESEARCH article
Front. Genet. , 22 December 2020
Sec. Cancer Genetics
Volume 11 - 2020 | https://doi.org/10.3389/fgene.2020.612196
This article is part of the Research Topic Advances in Mathematical and Computational Oncology, Volume II View all 13 articles
Pancreatic cancer is known as “the king of cancer,” and ubiquitination/deubiquitination-related genes are key contributors to its development. Our study aimed to identify ubiquitination/deubiquitination-related genes associated with the prognosis of pancreatic cancer patients by the bioinformatics method and then construct a risk model. In this study, the gene expression profiles and clinical data of pancreatic cancer patients were downloaded from The Cancer Genome Atlas (TCGA) database and the Genotype-tissue Expression (GTEx) database. Ubiquitination/deubiquitination-related genes were obtained from the gene set enrichment analysis (GSEA). Univariate Cox regression analysis was used to identify differentially expressed ubiquitination-related genes selected from GSEA which were associated with the prognosis of pancreatic cancer patients. Using multivariate Cox regression analysis, we detected eight optimal ubiquitination-related genes (RNF7, NPEPPS, NCCRP1, BRCA1, TRIM37, RNF25, CDC27, and UBE2H) and then used them to construct a risk model to predict the prognosis of pancreatic cancer patients. Finally, the eight risk genes were validated by the Human Protein Atlas (HPA) database, the results showed that the protein expression level of the eight genes was generally consistent with those at the transcriptional level. Our findings suggest the risk model constructed from these eight ubiquitination-related genes can accurately and reliably predict the prognosis of pancreatic cancer patients. These eight genes have the potential to be further studied as new biomarkers or therapeutic targets for pancreatic cancer.
Pancreatic cancer is a highly fatal disease, with 43,090 deaths every 5 years (Siegel et al., 2017), the 5-year overall survival rate is only 6% (Miller et al., 2019). Many factors contribute to low survival rates for pancreatic cancer. The most important factor may be that more than half of patients are diagnosed with advanced pancreatic cancer, and the 5-year survival rate of advanced pancreatic cancer is only 3% (Ilic and Ilic, 2016). Pancreatic cancer is characterized not only by early recurrence and invasion but also by chemical and radiation resistance (Adamska et al., 2018). In recent years, targeted therapy and emerging immunotherapy have opened up new prospects for the treatment of pancreatic cancer. However, the exploration of new therapeutic targets and prognostic biomarkers for pancreatic cancer still needs to be further carried out. Over the past decade, numerous studies have identified some sensitive and effective biomarkers for pancreatic cancer.
Ubiquitination/deubiquitination is an ATP-dependent reversible reaction that binds small ubiquitin molecules to the target protein through multi-step reactions involving ubiquitin-activating enzyme E1, ubiquitin-binding enzyme E2, and ubiquitin-ligase E3 (Hershko et al., 1979). ATP provides energy, E1 is activated, and the Glycine residue at the Carboxy terminal of ubiquitin and the active Cystine of E1 forms a thioester bond. Next, E1 transfers the ubiquitin to the cysteine residue of the ubiquitin carrier protein E2. E3 is specific in that it coordinates ubiquitin covalently to specific target proteins. The way ubiquitin molecules bind plays an important role in the function of the modified protein (Dikic et al., 2009). Ubiquitination produces a protein that is either monoubiquitinated or polyubiquitinated when one of the seven Lysine residues of ubiquitin binds to the C-terminal Glycine of another ubiquitin. The reverse process of ubiquitination is called deubiquitination. Ubiquitination is best known for its role in mediating protein degradation. Besides, ubiquitination is also involved in the processes of meiosis, autophagy, DNA repair, immune response, and apoptosis. Ubiquitinated proteasome pathway is involved in almost all intracellular molecular biological processes, affecting gene expression and signal transduction in the regulation of DNA damage repair, participating in the differentiation of senescent cells, regulating tumor progression of malignant transformation, and mediating therapeutic resistance (Welchman et al., 2005).
Previous studies have shown that ubiquitination/deubiquitination play important roles in pancreatic cancer. Lian et al. (2020) found that ubiquitin specific peptidase 5 (USP5) enhances STAT3 signaling and promotes migration and invasion in pancreatic cancer. Chen et al. (2020) found that E3 ubiquitin ligase UBR5 promotes pancreatic cancer growth and aerobic glycolysis by downregulating FBP1 via destabilization of C/EBPα. Yang et al. (2019) found that USP44 suppresses pancreatic cancer progression and overcomes gemcitabine resistance by deubiquitinating FBP1. There is no doubt that ubiquitination/deubiquitination is closely related to the progression of pancreatic cancer. Exploration of ubiquitination/deubiquitination related genes in pancreatic cancer is also necessary.
In this study, by analyzing the dataset from TCGA and GTEx database, we aim to study and verify the expression characteristics of ubiquitination-related genes. We then selected several ubiquitination-related genes that were significantly associated with the prognosis of pancreatic cancer patients through a series of statistical methods. Finally, we established a new and reliable risk model to predict the prognosis of pancreatic cancer patients based on the screened risk genes.
To download the transcriptome data of 178 patients (The Cancer Genome Atlas database, TCGA database) with pancreatic cancer and the transcriptome data of 36 cases of normal pancreatic tissue (Genotype-Tissue Expression database, GTEx database) from the UCSC XENA website1. Clinical information of pancreatic cancer patients was obtained from the TCGA database. All data are processed using R software2. The clinical features of pancreatic cancer patients, include age, gender, pathological grade, T-stage, N-stage, M-stage, and TNM-stage.
GSEA3 was used to explore whether the transcriptome data showed statistically significant difference between the two groups (normal and tumor). The expression data of mRNAs, including 36 normal pancreatic tissue and 178 pancreatic cancer samples were analyzed. Normalized P value (P < 0.05) and normalized enrichment score (NES) were used to determine what functions had to be selected for further analysis.
We screened DEGs from these ubiquitination/deubiquitination related genes obtained from GSEA analysis. The “limma” package was used to screen out the DEGs (Log2 fold change ≠ 0, P < 0.05).
Gene Ontology (GO) database is a kind of free and open database, the database includes three aspects of information: biological process, cellular component, and molecular function. The biological functions of genes can be classified and these genes included in the functions that we selected can be further understood through the GO analysis. DAVID online tool4 was used for GO analysis (Xia et al., 2015). Kyoto Encyclopedia of Genes and Genomes (KEGG) database is a database that systematically analyzes the metabolic pathways of gene products in cells and the functions of these gene products. The database is useful for studying gene and expression information as a whole network. KEGG integrates the data of genomic chemical molecules and biochemical systems, including the sequence and genome of metabolic pathways, drugs, and diseases. We used the “clusterProfiler” package (Yu et al., 2012) from Bioconductor to do KEGG analysis of these DEGs. P-value < 0.05 was used as the inclusion standard in the analysis.
As in previous studies (Li et al., 2020), univariate Cox regression (p < 0.05) was used to screen out the ubiquitination-related genes that were significantly associated with the prognosis of pancreatic cancer patients from the DRGs. Multivariate Cox proportional hazards regression analysis (with forwarding selection and backward selection) was then used to analyze these ubiquitination-related genes selected by univariate Cox regression. Finally, optimal ubiquitination-related genes (risk genes) were obtained to be incorporated into the risk model. The alteration of these risk genes is shown online5.
Multivariate Cox proportional hazards regression analysis was used to select the optimal risk genes and construct the Cox regression model. In this process, we can obtain the estimated regression coefficients of each gene. The expression levels of mRNA and estimated regression coefficients of the risk genes were used to calculate a risk score for each pancreatic cancer patients. The risk score model was established with the following formula: Risk score = expression level of Gene1 ∗ β1 + expression level of Gene2 ∗ β2+…+ expression level of Genen ∗ βn; where β is the estimated regression coefficient calculated by the multivariate Cox regression model.
The risk model was used to measure the prognostic risk for each pancreatic cancer patient. The median risk score was used as the cut-off value to divide all the pancreatic cancer patients into two groups: the high-risk group and the low-risk group. The low-risk group has a better prognosis.
Next, univariate and multivariate Cox regression analysis were performed to assess whether the risk model was independent of other clinical features (age, gender, pathological grade, T-stage, and N-stage) as a prognostic factor for pancreatic cancer patients (p < 0.05). The X-tile software was used to identify the optimal cut-off value of the age significantly correlated to the prognosis of pancreatic cancer patients. Because there are too many patients in M0-stage and too few patients in stage III/IV, we excluded these two clinical features (M-stage and TNM-stage) from this analysis. Besides, cases with incomplete clinical information were also excluded. Then, we constructed receiver operating curves (ROC) and calculated the area under the curve (AUC) to assess whether our model accurately predicted the overall survival (OS) of pancreatic cancer patients. C-index value of 0.75 or greater were considered to have excellent predictive value, and value of 0.6 or greater were considered acceptable for survival predictions (Cho et al., 2019).
Kaplan–Meier curves and the log-rank test were used to validate the prognostic significance of the risk model (p < 0.05).
Furthermore, the Human Protein Atlas database6 was used to validate the protein expression level of these risk genes compared to the level of gene transcription.
Expression data set for 55242 mRNAs from the TCGA database and GTEx database were analyzed. Five ubiquitination/deubiquitination-related gene sets we validated by GSEA analysis and there were two gene sets, including REACTOME_ANTIGEN_PROCESSING_UBIQUITINATION_ PROTEASOME_DEGRADATION, and REACTOME_ PROTEIN_UBIQUITINATION were significantly enriched (Table 1 and Figure 1). These 441 ubiquitination-related genes in the two functions were selected for the subsequent analysis.
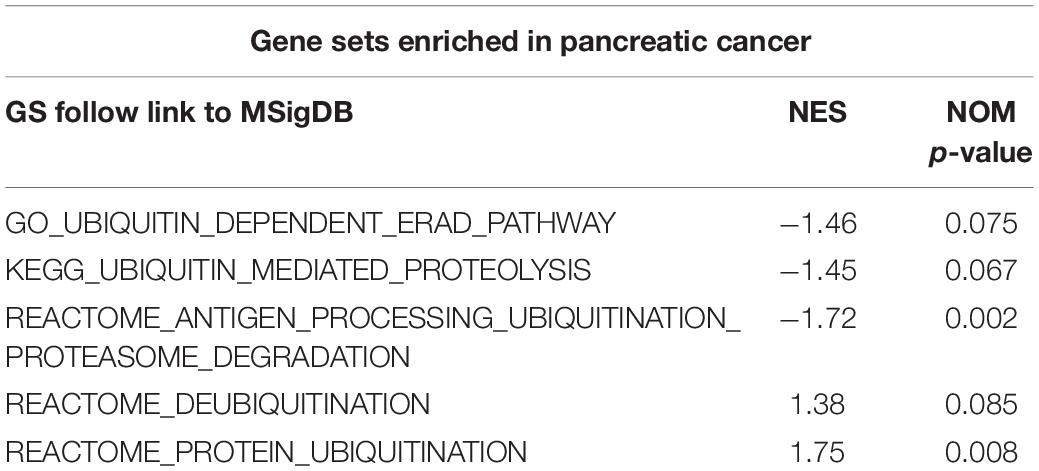
Table 1. Gene sets enriched in pancreatic cancer.
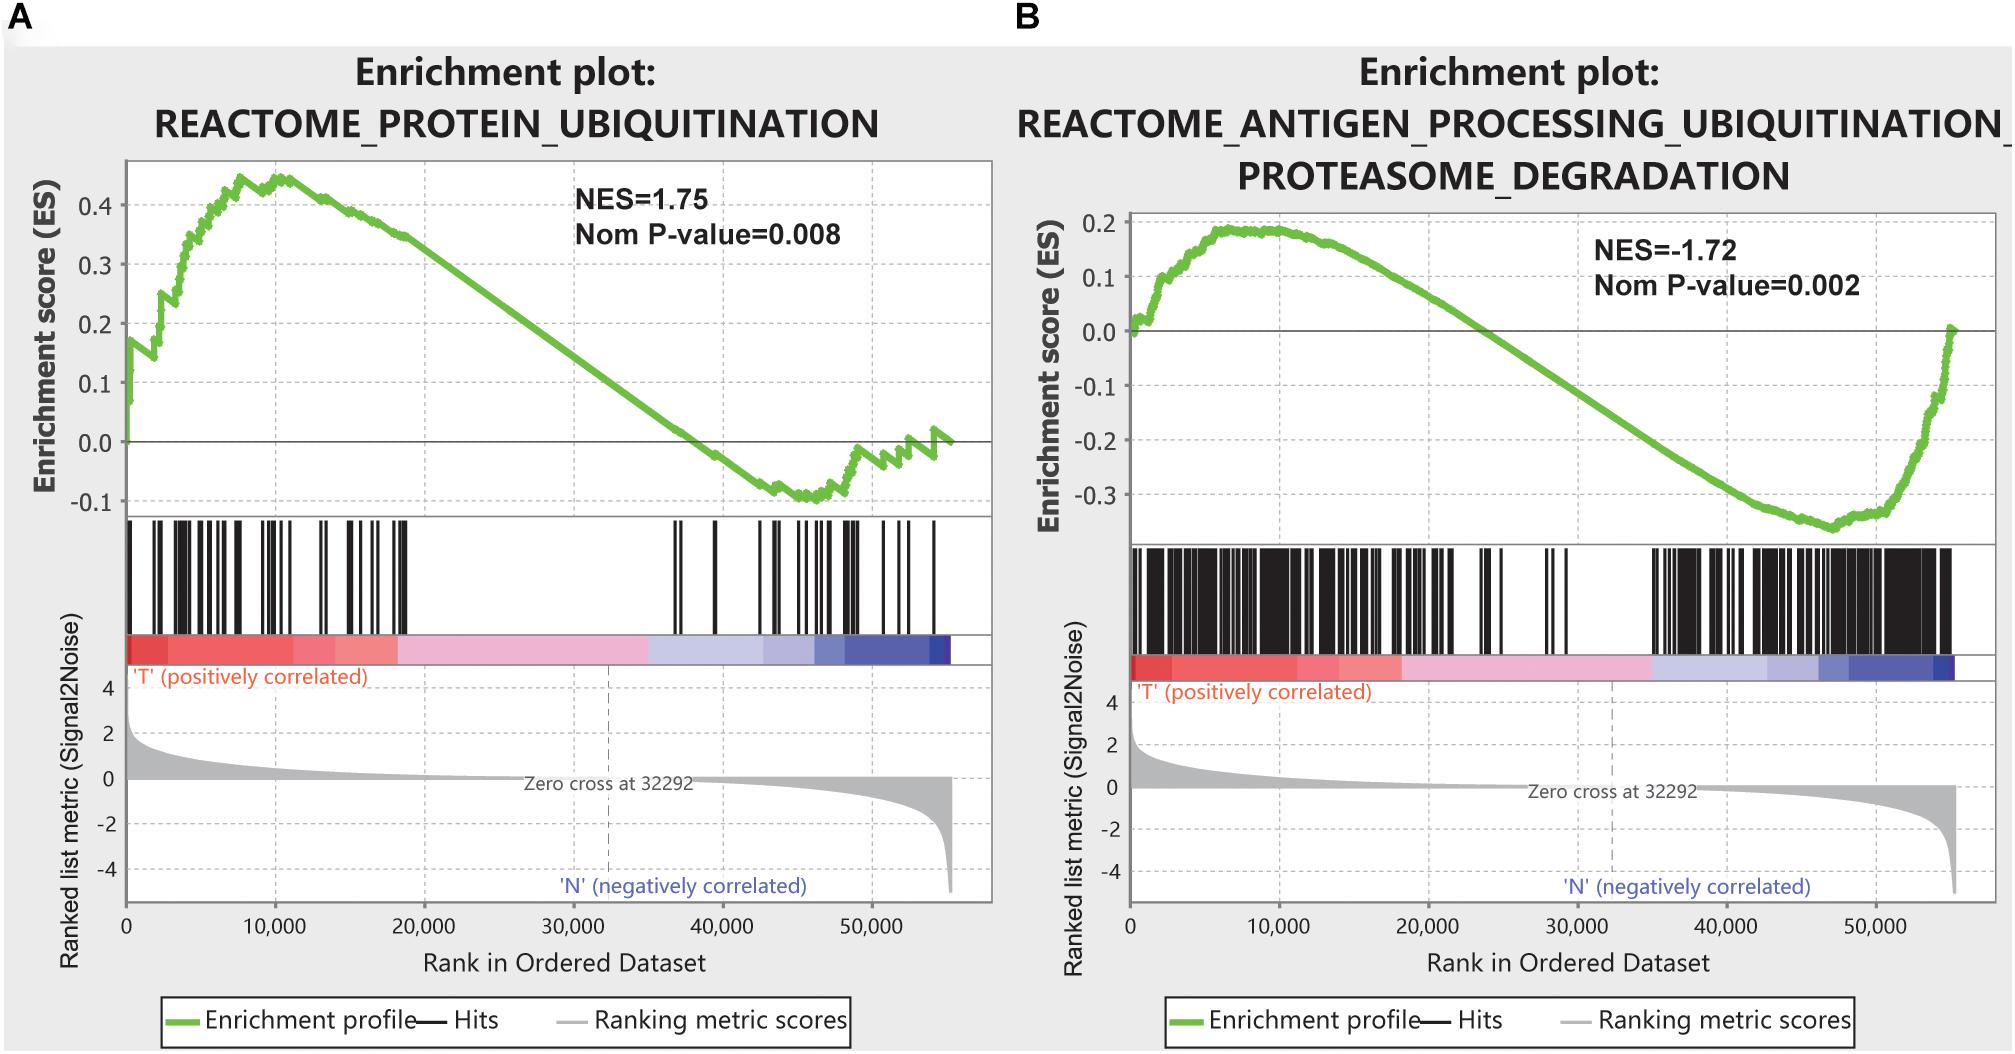
Figure 1. GSEA results for the enrichment plots of two gene sets (REACTOME_ANTIGEN_PROCESSING_UBIQUITINATION_PROTEASOME_DEGRADATION, and REACTOME_PROTEIN_UBIQUITINATION) that were significantly differentiated in normal and pancreatic cancer tissues based on TCGA database. (A) Enrichment plot of the REACTOME_ANTIGEN_PROCESSING_UBIQUITINATION_PROTEASOME_DEGRADATION gene set. (B) Enrichment plot of the REACTOME_PROTEIN_UBIQUITINATION gene set.
Of these 441 ubiquitination-related genes in the two functions, 134 DEGs were screened. These 134 ubiquitination-related DEGs were used to do the GO analysis and KEGG analysis. The results of the GO analysis showed that the functions of the ubiquitination-related genes were concentrated in the functions of the protein polyubiquitination, post-translational protein modification, and proteasome-mediated ubiquitin-dependent protein catabolic process, as shown in Table 2. The results of KEGG analysis showed that the functions of the ubiquitination-related genes were concentrated in ubiquitin-mediated proteolysis, proteasome, and cell cycle, as shown in Table 2.
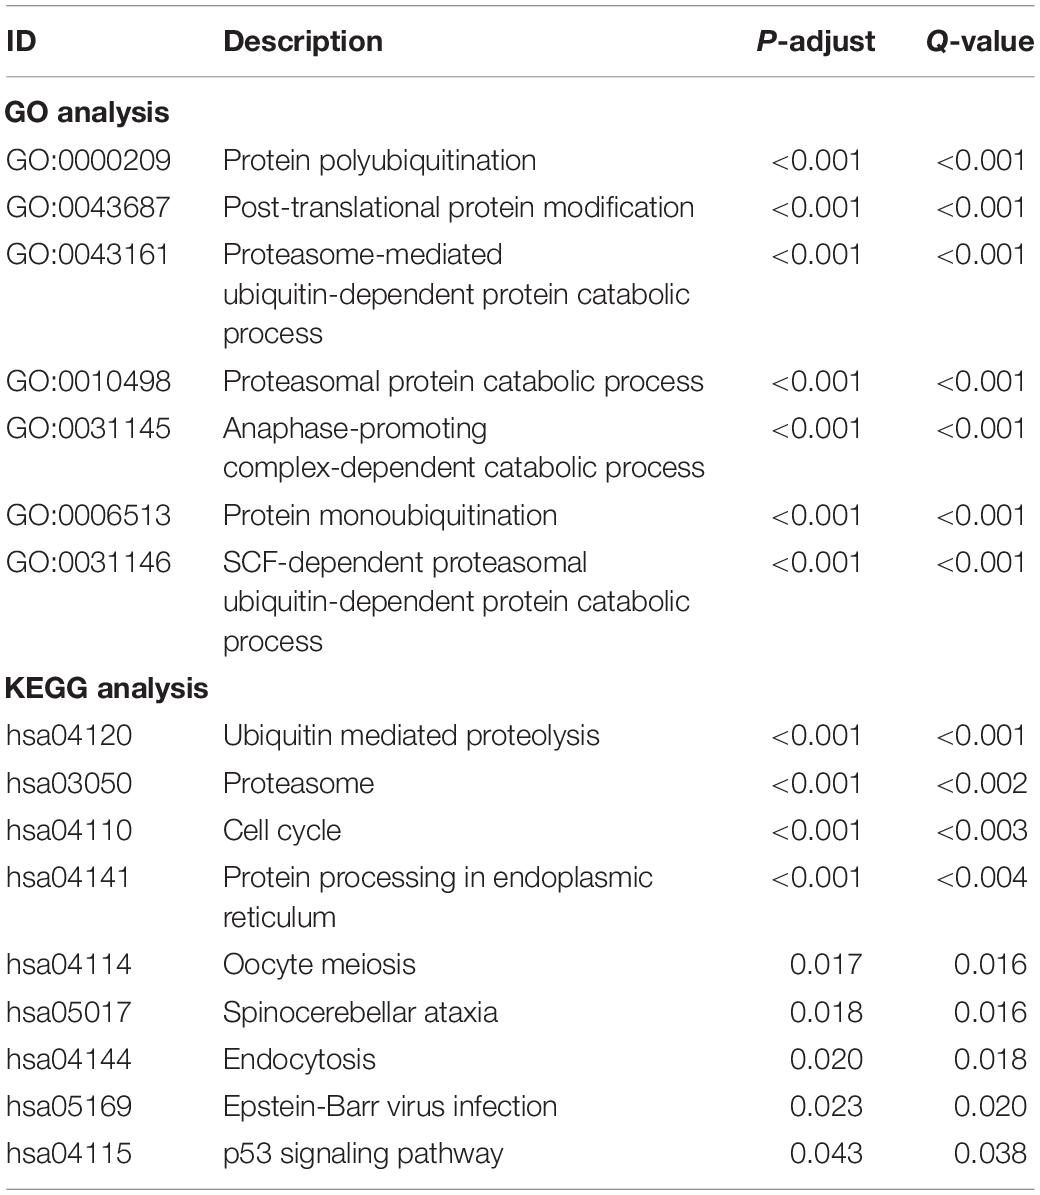
Table 2. Result of GO and KEGG analysis for these ubiquitination-related DEGs.
Sixty-three ubiquitination-related genes significantly correlated with the prognosis of pancreatic cancer patients were screened through the univariate Cox regression analysis from the 134 DEGs. Next, eight optimal ubiquitination-related genes (risk gene) obtained by multivariate Cox analysis were used to construct a risk model (Table 3): RNF7, NPEPPS, NCCRP1, BRCA1, TRIM37, RNF25, CDC27, and UBE2H. The effect of the expression value of these genes on the prognosis of pancreatic cancer is shown in Figures 2A–H. Then, the alteration of the seven genes in 175 clinical pancreatic cancer samples was analyzed in the cBioPortal database. Results showed that there were 33(19%) sequenced cases among the 175 pancreatic cancer samples with the eight genes altering. The alterations of the eight genes are shown in Figure 3A. We also investigated the different expressions of the eight genes between pancreatic cancer tissues and normal pancreatic tissues. Among the eight genes, five genes (BRCA1, TRIM37, RNF25, CDC27, and UBE2H) were significantly upregulated and three genes (RNF7, NPEPPS, and NCCRP1) were significantly down regulated in the tumor tissues (Figure 3B).
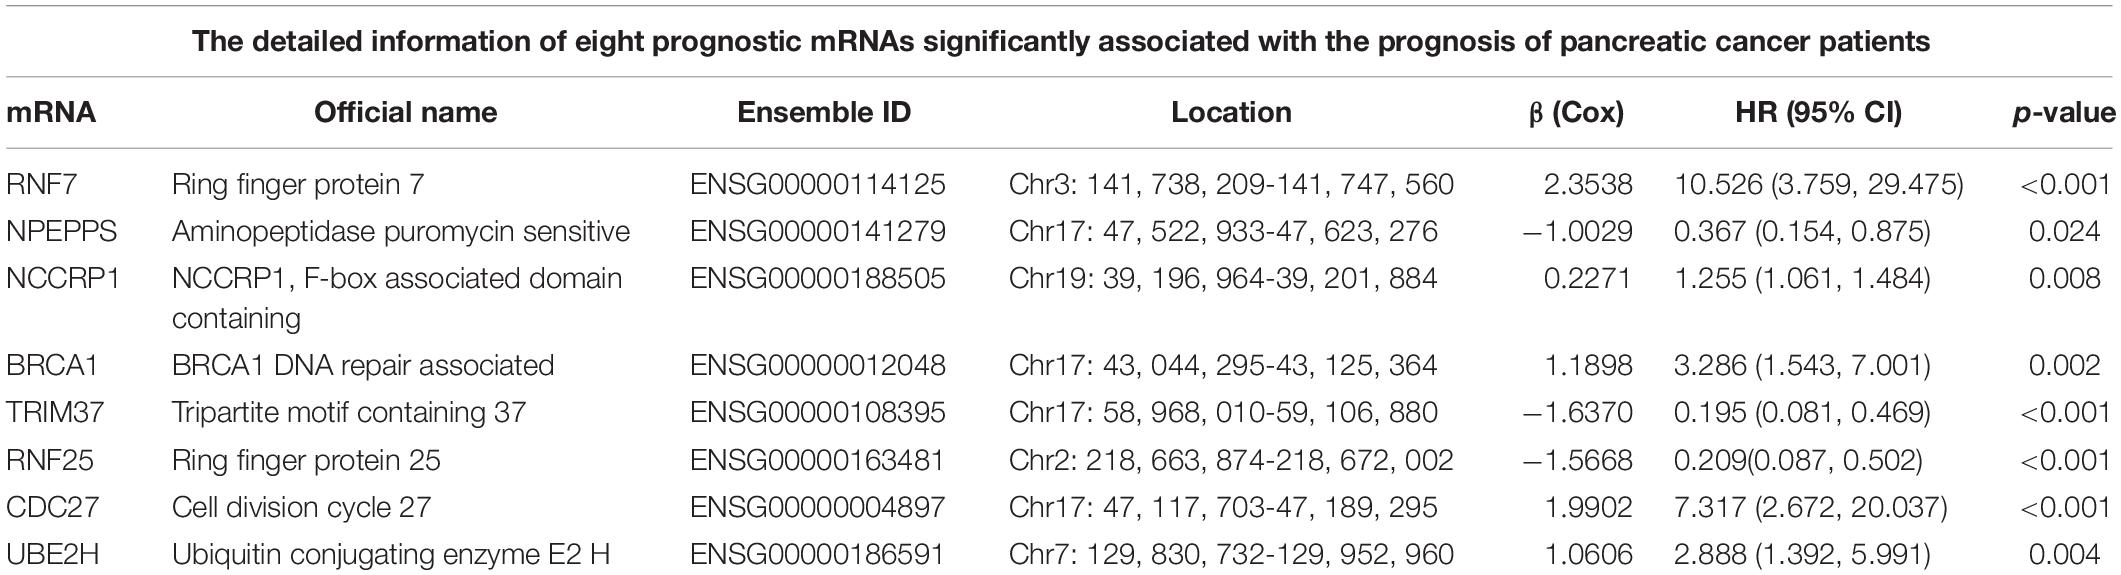
Table 3. The detailed information of eight prognostic mRNAs significantly associated with the prognosis of pancreatic cancer patients.
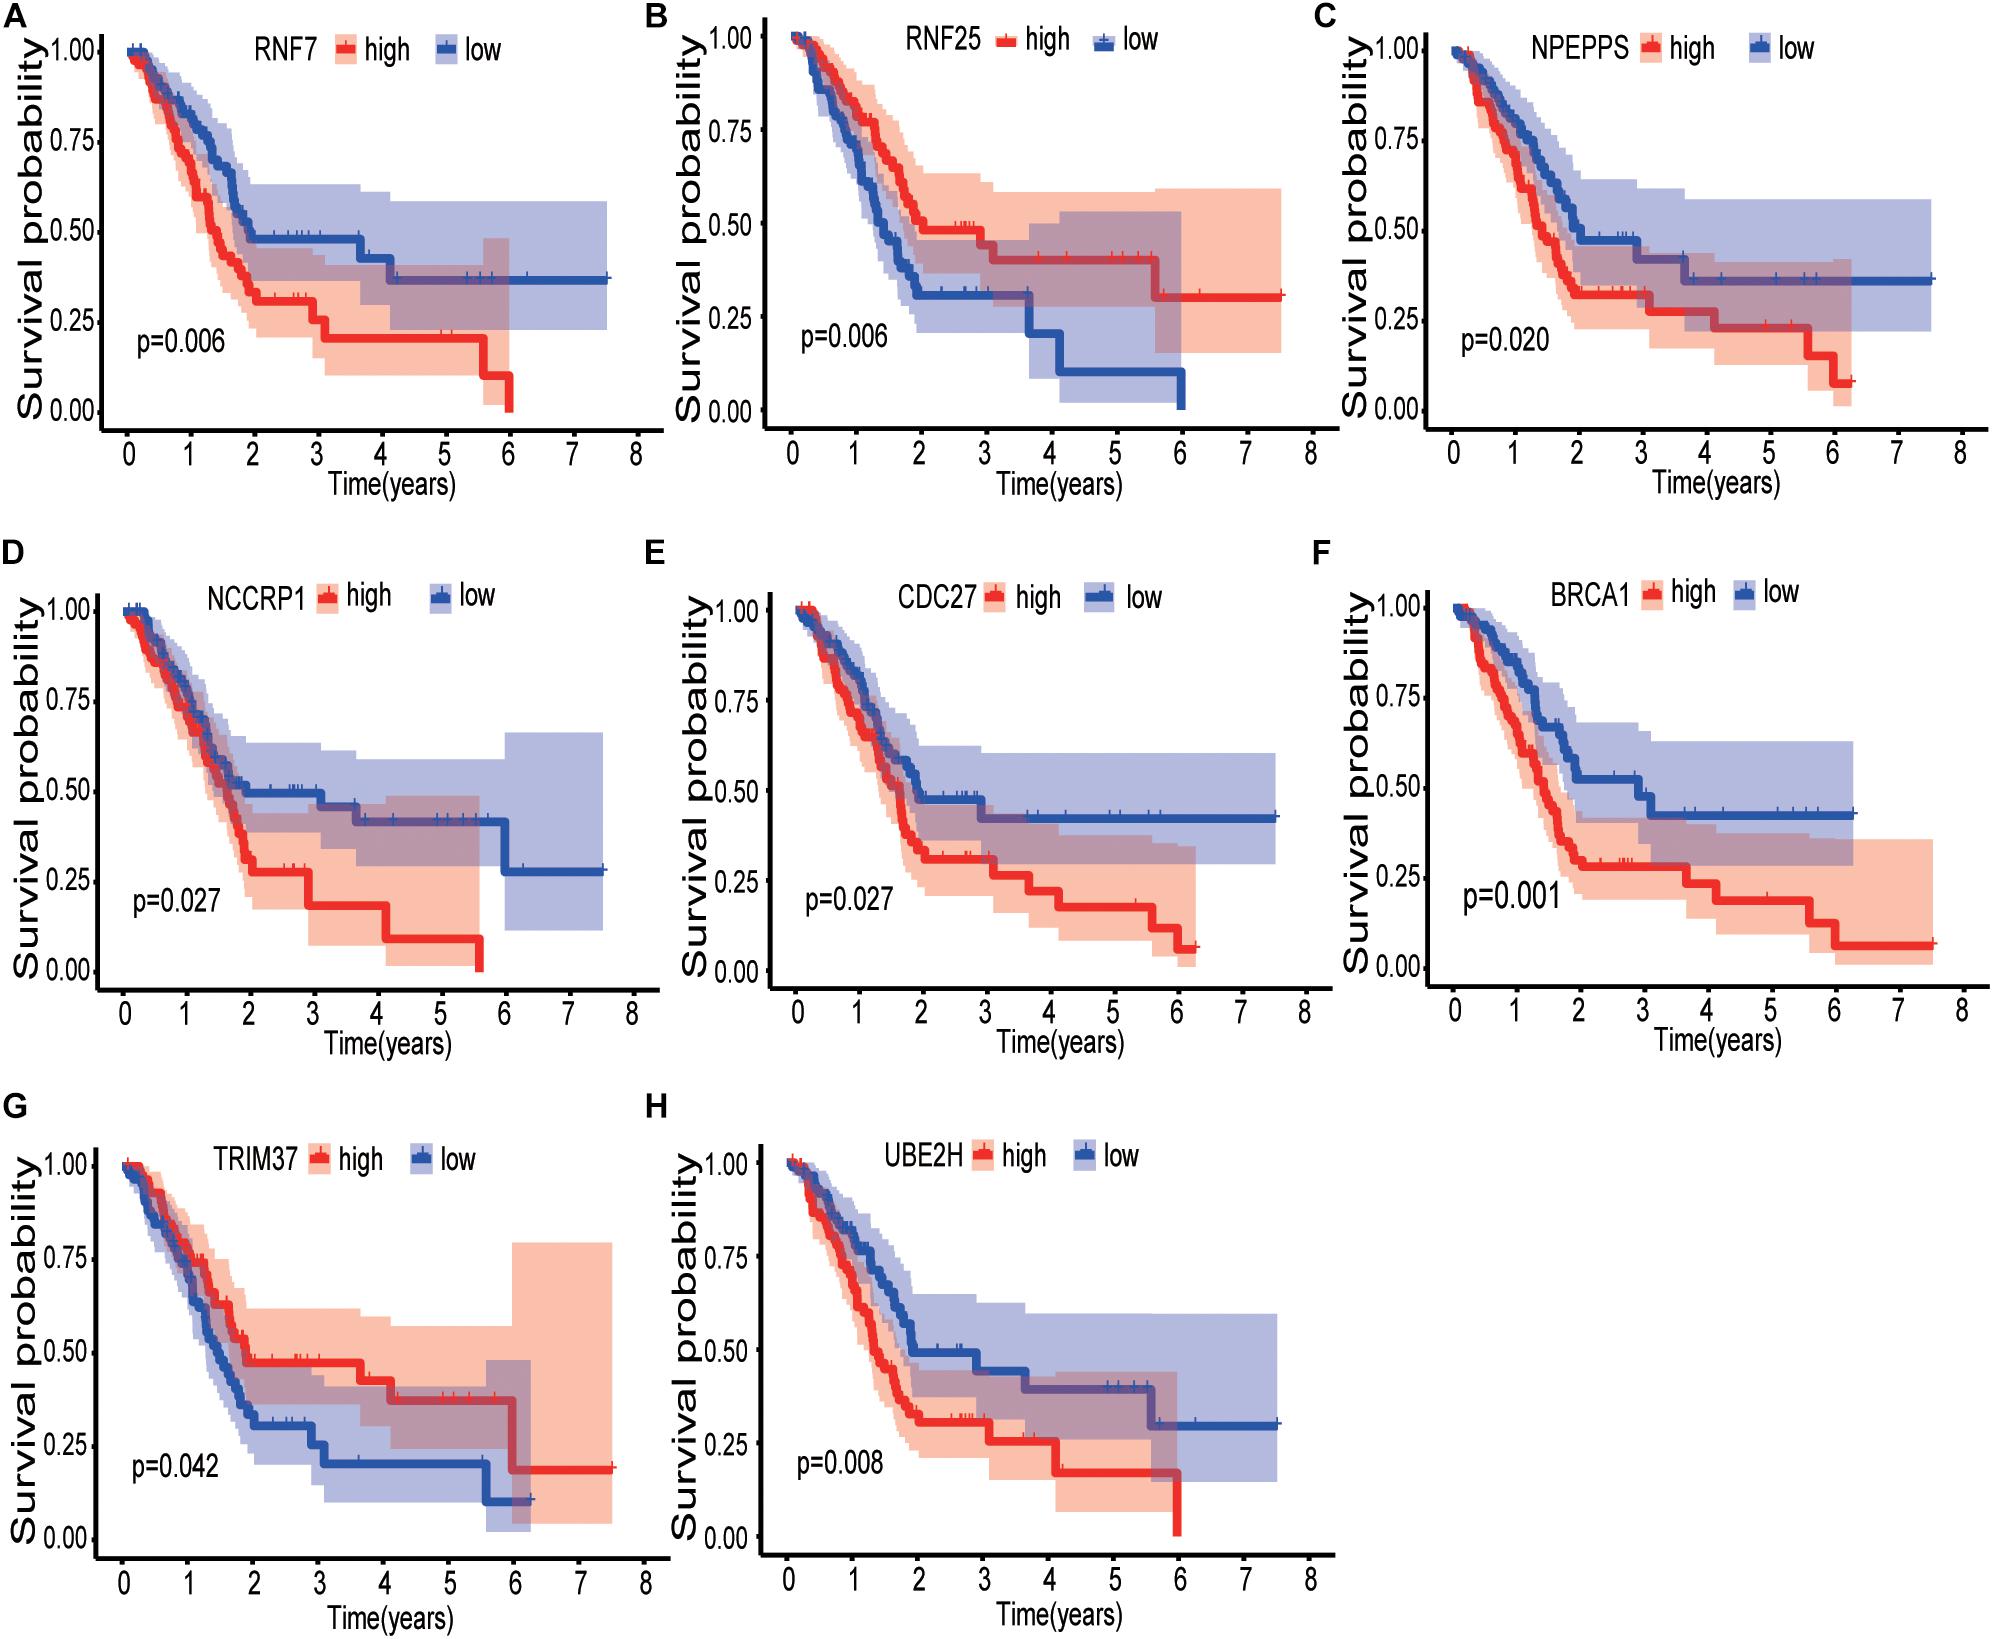
Figure 2. Kaplan-Meier curves of the effect of the gene expression level of the risk genes (RNF7, NPEPPS, NCCRP1, BRCA1, TRIM37, RNF25, CDC27, and UBE2H) on the prognosis of pancreatic cancer patients. (A) Kaplan-Meier curve of the effect of RNF7 gene expression level. (B) Kaplan-Meier curve of the effect of RNF25 gene expression level. (C) Kaplan-Meier curve of the effect of NPEPPS gene expression level. (D) Kaplan-Meier curve of the effect of NCCRP1 gene expression level. (E) Kaplan-Meier curve of the effect of CDC27 gene expression level. (F) Kaplan-Meier curve of the effect of BRCA1 gene expression level. (G) Kaplan-Meier curve of the effect of TRIM37 gene expression level. (H) Kaplan-Meier curve of the effect of UBE2H gene expression level.
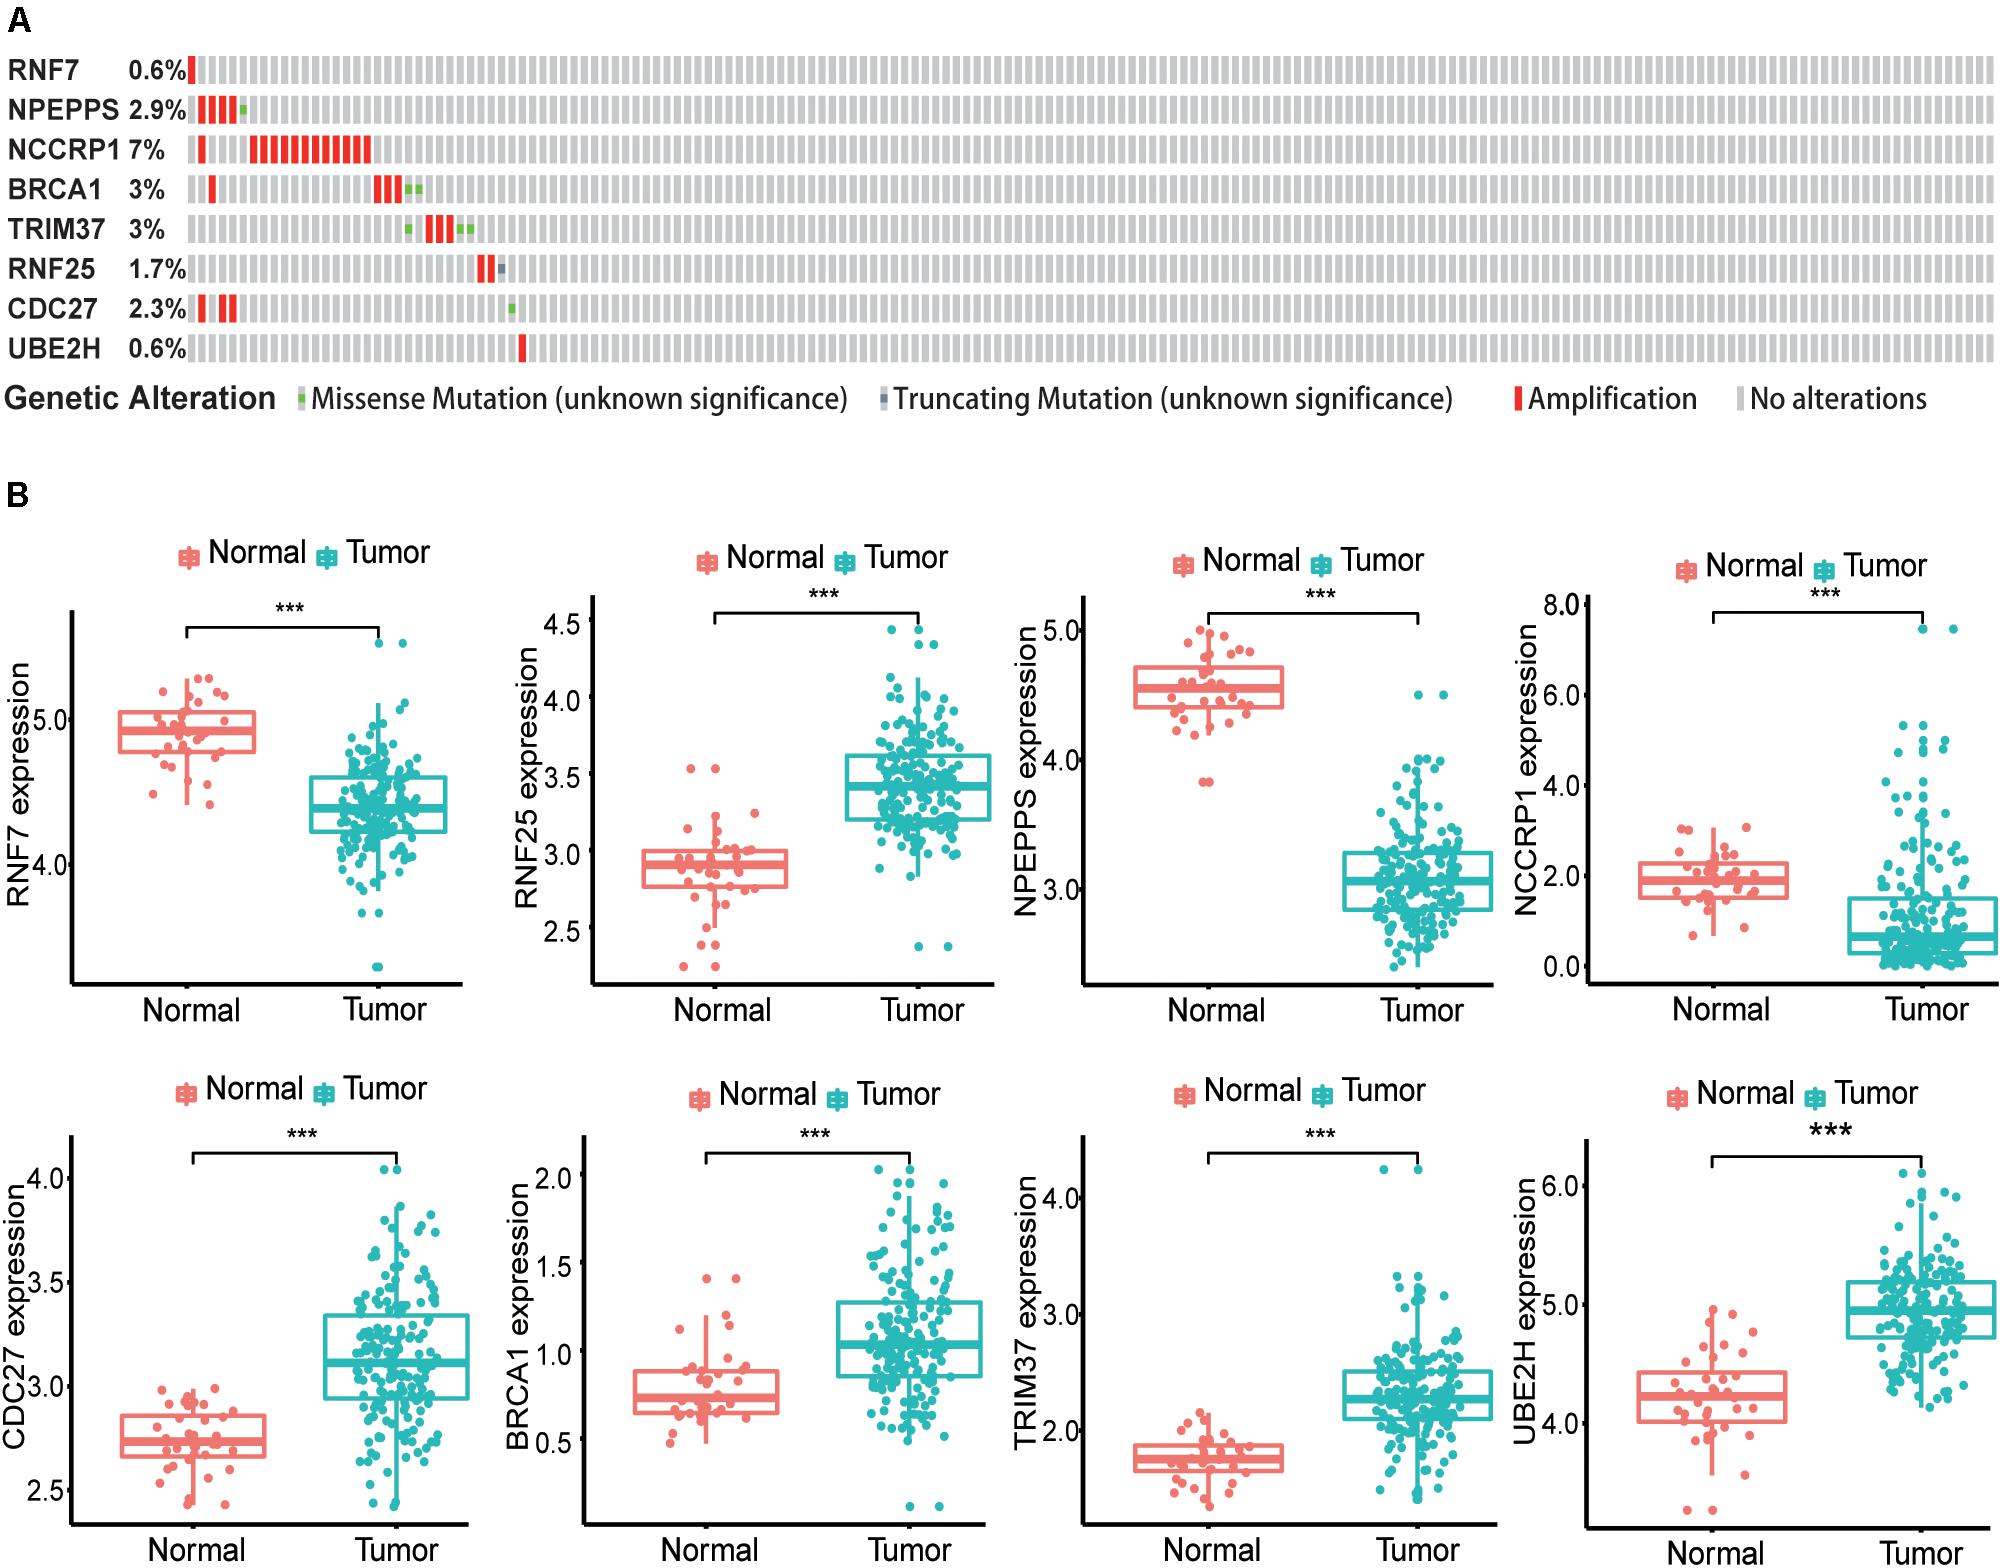
Figure 3. Identification of mRNAs associated with patient survival. (A) The alteration proportion for the eight selected genes in 175 clinical samples of pancreatic cancer in the cBioPortal database. (B) Different expression of eight genes in the normal pancreatic tissues and tumor tissues based on TCGA database. (*P < 0.05, **P < 0.01, ***P < 0.001).
Finally, 171 pancreatic cancer patients were included in the risk model. The computational formula was as follows: Risk score = (2.3538 × expression of RNF7) + (−1.0029 × expression of NPEPPS) + (0.2271 × expression of NCCRP1) + (1.1898 × expression of BRCA1) + (−1.6370 × expression of TRIM37) + (−1.5668 × expression of RNF25) + (1.9902 × expression of CDC27) + (1.0606 × expression of UBE2H).
Patients were divided into two groups, the high-risk group (n = 85) and the low-risk group (n = 86). The high-risk group had a worse outcome than the low-risk group (p < 0.001). The 1- and 3-year OS of pancreatic cancer patients in the high-risk group were 87.7 and 64.7%, respectively, while the corresponding OS in the low-risk group was 57.5 and 17.9%, respectively. The AUC (ROC) value of the risk model in 1-year, and 3-year were 0.756, and 0.810, respectively (Figures 4A,B). Then, risk scores of these pancreatic cancer patients were ranked and their distribution was analyzed. We divided pancreatic cancer patients into low-risk and high-risk groups by the median risk score for all patients enrolled in the study (Figure 4C). The survival status of each patient in the pancreatic cancer patients was shown in Figure 4D. As can be intuitively seen from Figure 4D, the higher the risk score, the shorter the OS of pancreatic cancer patients.
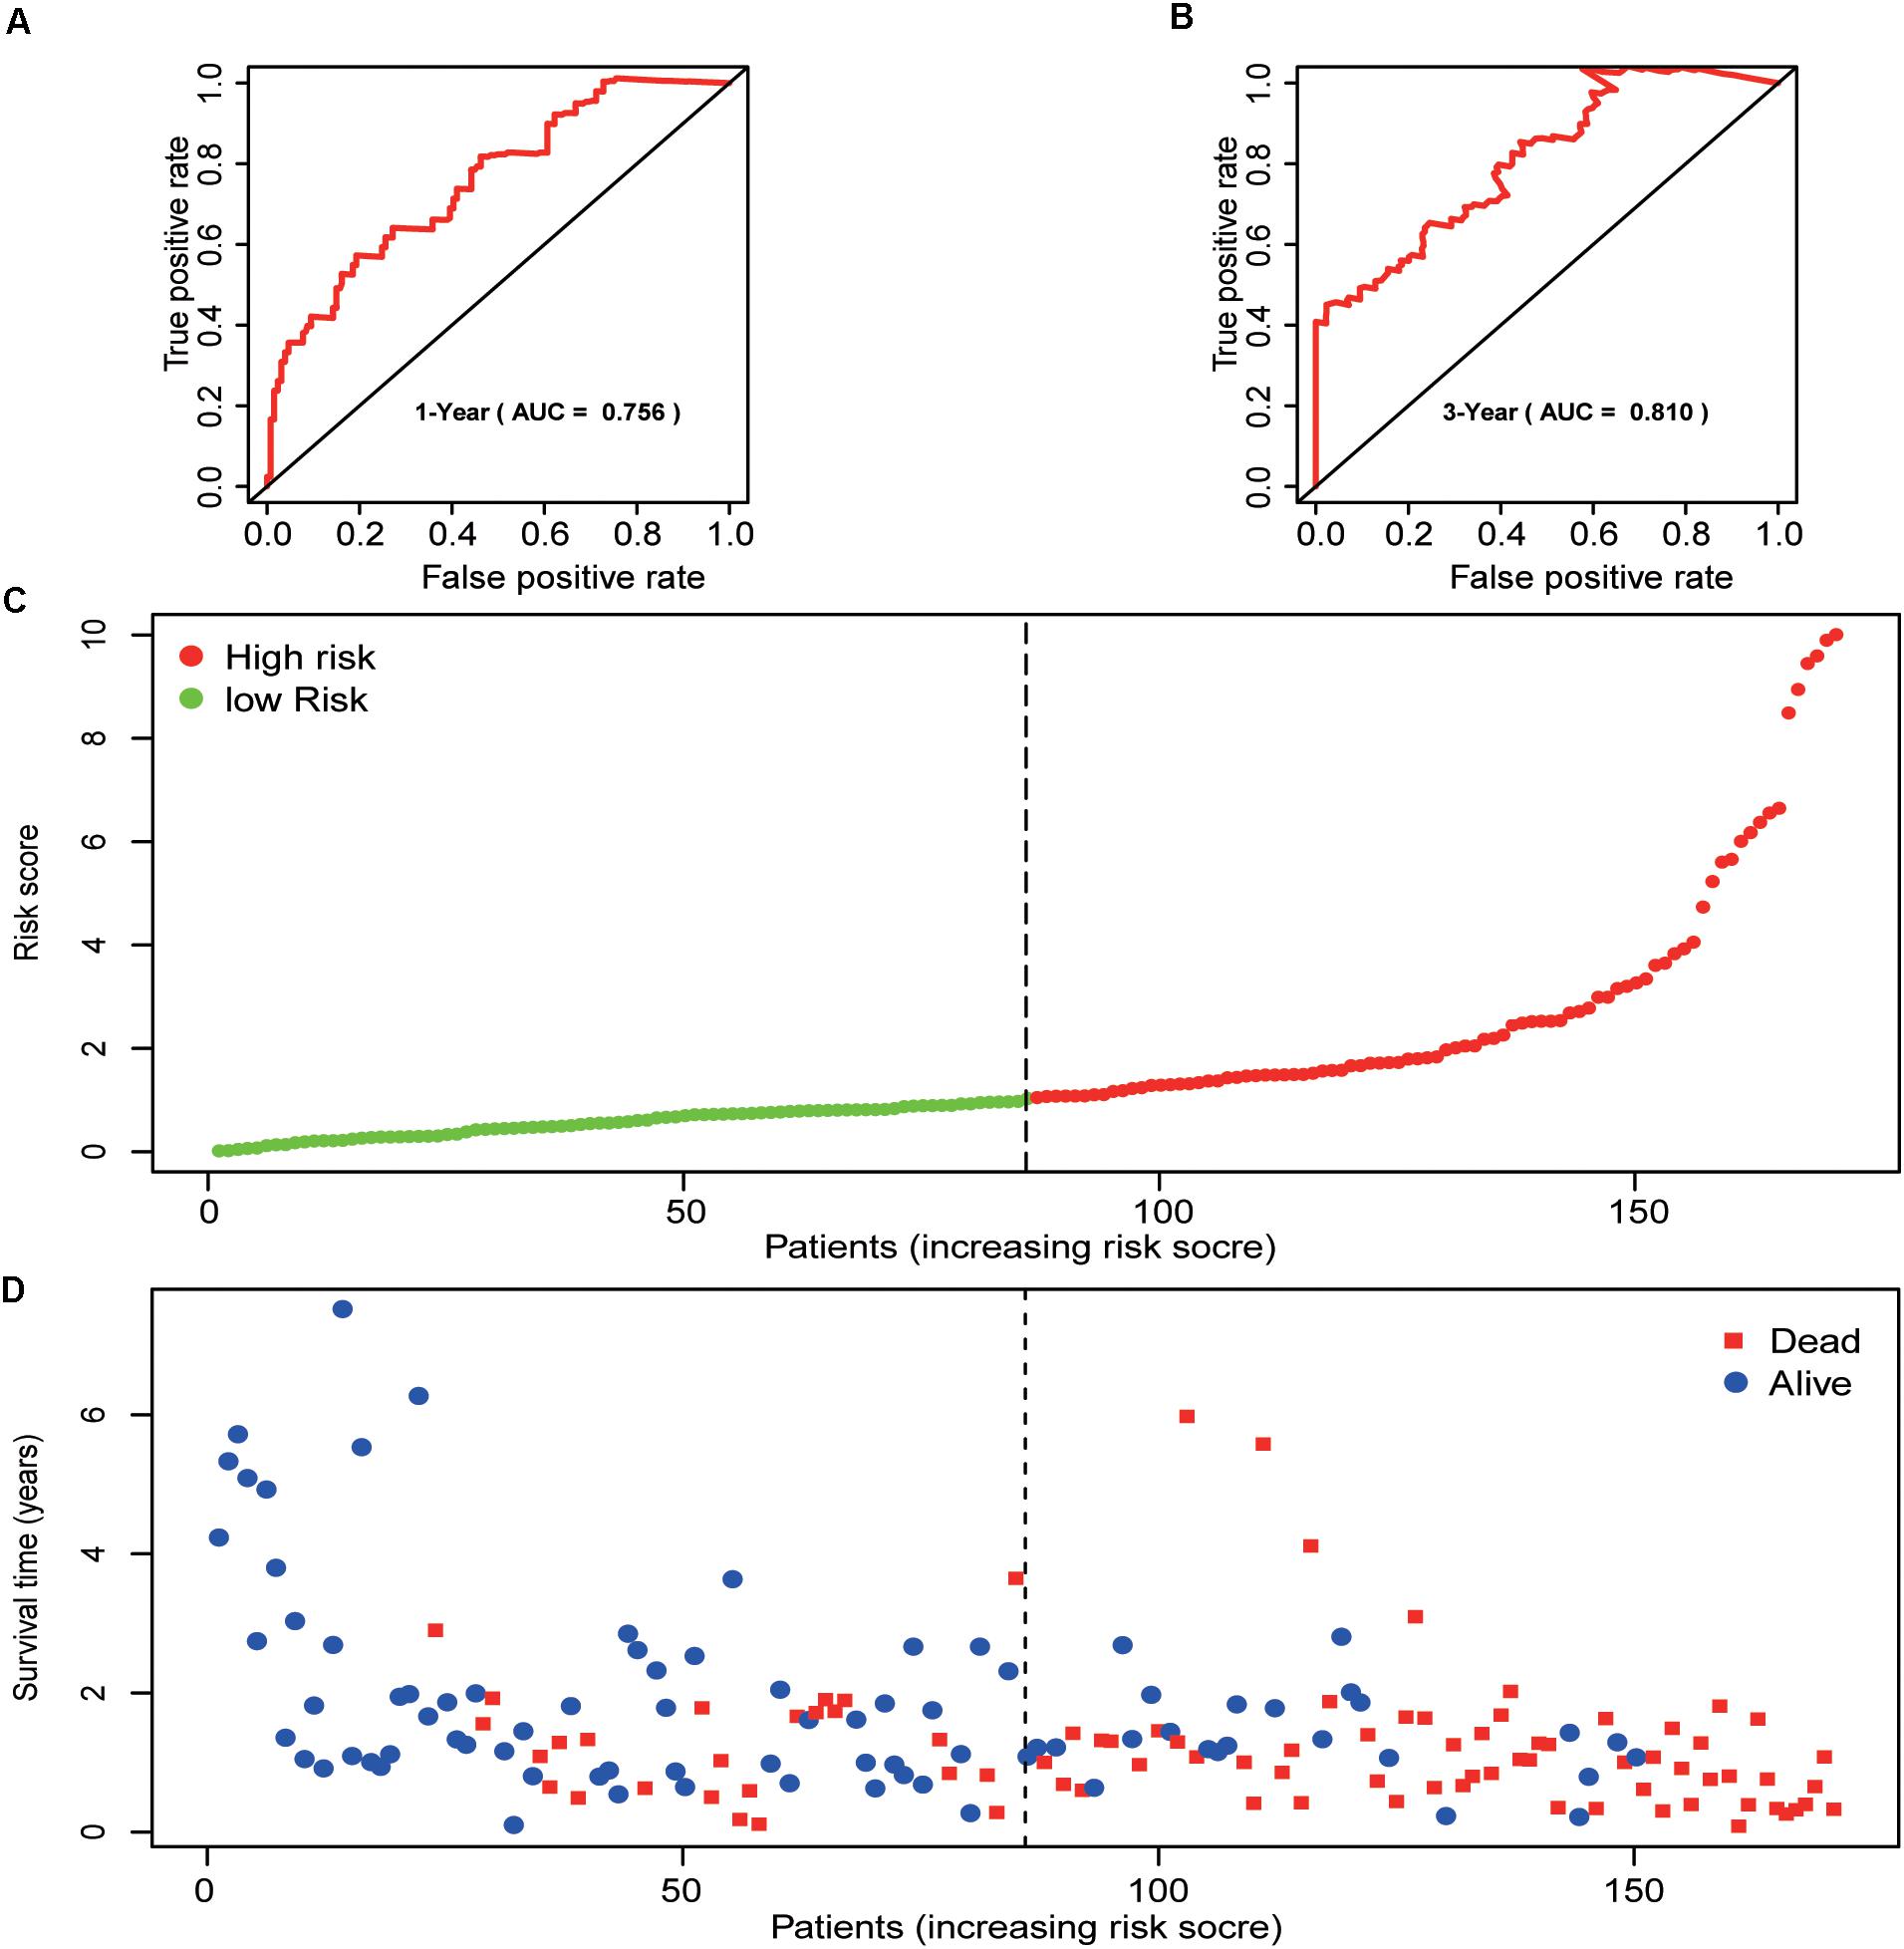
Figure 4. Prognostic analysis of the pancreatic cancer cohort. (A) 1-year ROC curve analysis of the prognostic model. (B) 3-year ROC curve analysis of the prognostic model. (C) Risk score distribution of patients in the prognostic model. (D) Survival status scatter plots for patients in the prognostic model.
A total of 163 pancreatic cancer patients were included in this analysis. Results of the univariate analysis showed that age, pathological grade, T-stage, N-stage, and risk score were significantly correlated with the prognosis of pancreatic cancer patients. The result of multivariate analysis showed that the risk score was independently correlated with the OS for patients with pancreatic cancer (Table 4).
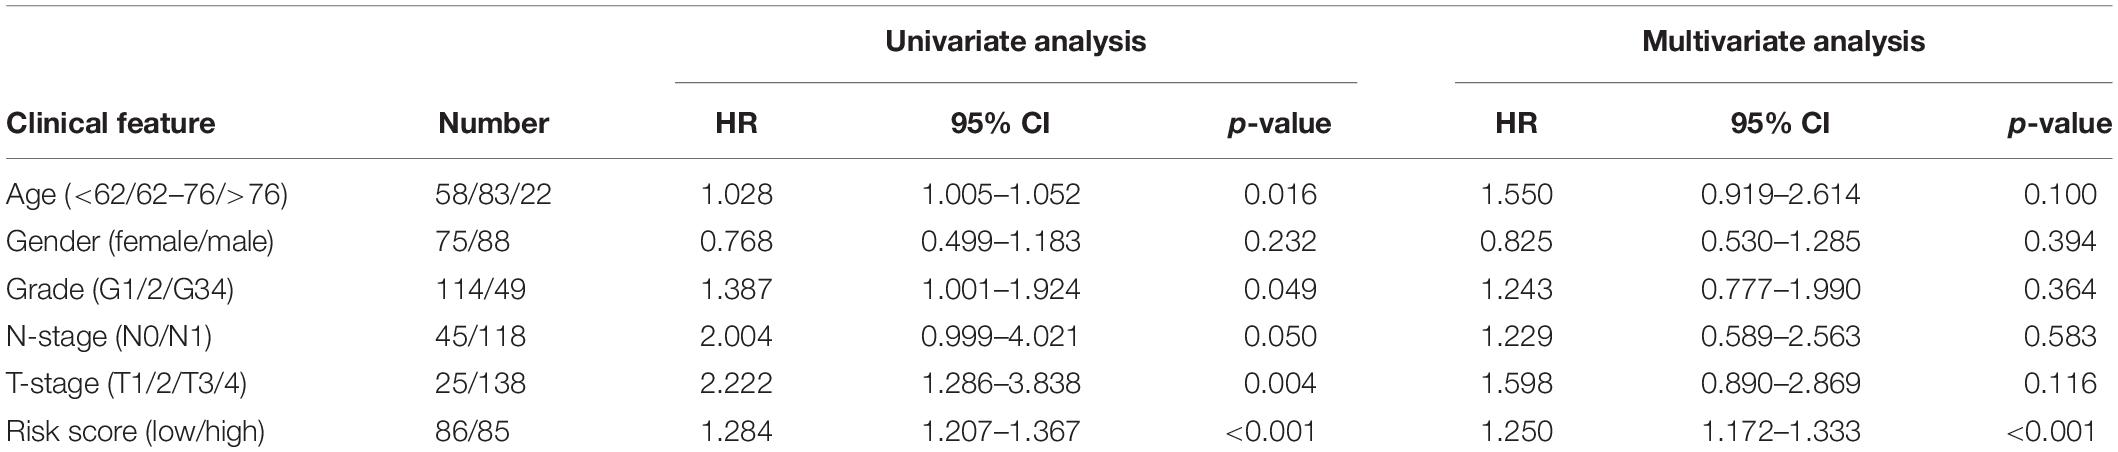
Table 4. Effects of various clinical features on pancreatic cancer patients.
The results of the univariate analysis showed that age was an independent prognostic factor for pancreatic cancer, and the X-tile software found that 62 and 76 were the optimal cut-off values for the prognosis of pancreatic cancer patients (Supplementary Figure 1). The result of Kaplan–Meier curves showed the effects of age, gender, histological grade, T-stage, N-stage, and risk score on the prognosis of pancreatic cancer patients (Figures 5A–F). The result of Kaplan–Meier curves showed that our risk model was a stable predictive tool for the prognosis of pancreatic cancer patients stratified by age (<62, 62–76, and >76), gender (male and female), pathological grade (G1/2, or G3/4), T-stage (T1/2, or T3/4), and N-stage (N0 or N1) (Figures 6A–K). Patients with pancreatic cancer in the high-risk group had significantly shorter OS than those in the low-risk group when the patients were stratified into different subgroups based on age, gender, pathological grade, T-stage, and N-stage.
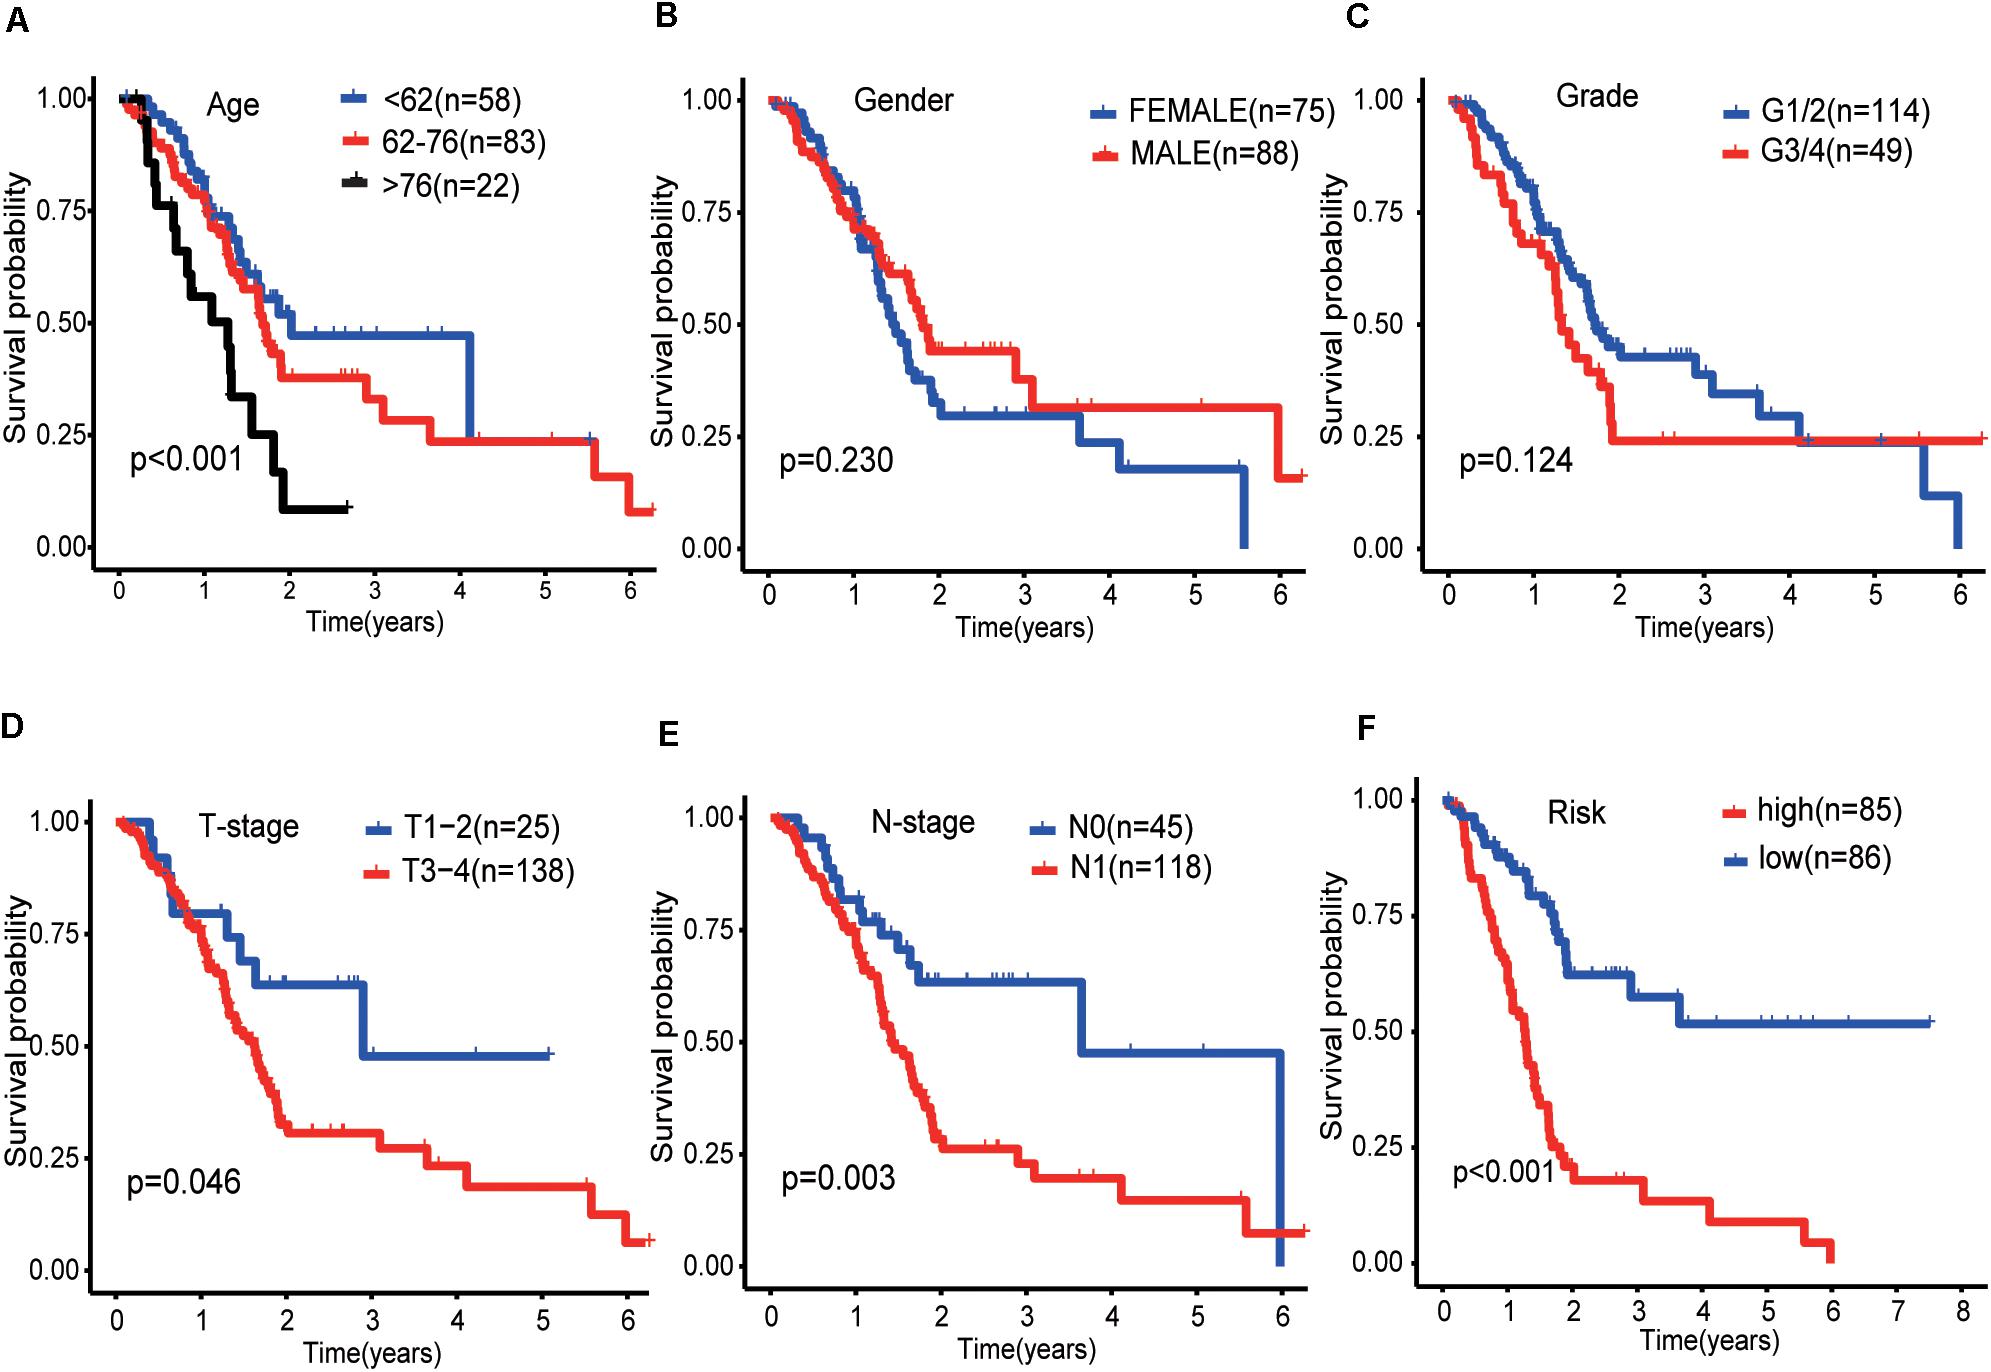
Figure 5. Kaplan-Meier curves of the effect of clinical features (risk score, age, gender, pathological grade, T-stage, and N-stage) on the prognosis of pancreatic cancer. (A) Kaplan-Meier curve of the effect of age. (B) Kaplan-Meier curve of the effect of gender. (C) Kaplan-Meier curve of the effect of pathological grade. (D) Kaplan-Meier curve of the effect of T-stage. (E) Kaplan-Meier curve of the effect of N-stage. (F) Kaplan-Meier curve of the effect of risk score.
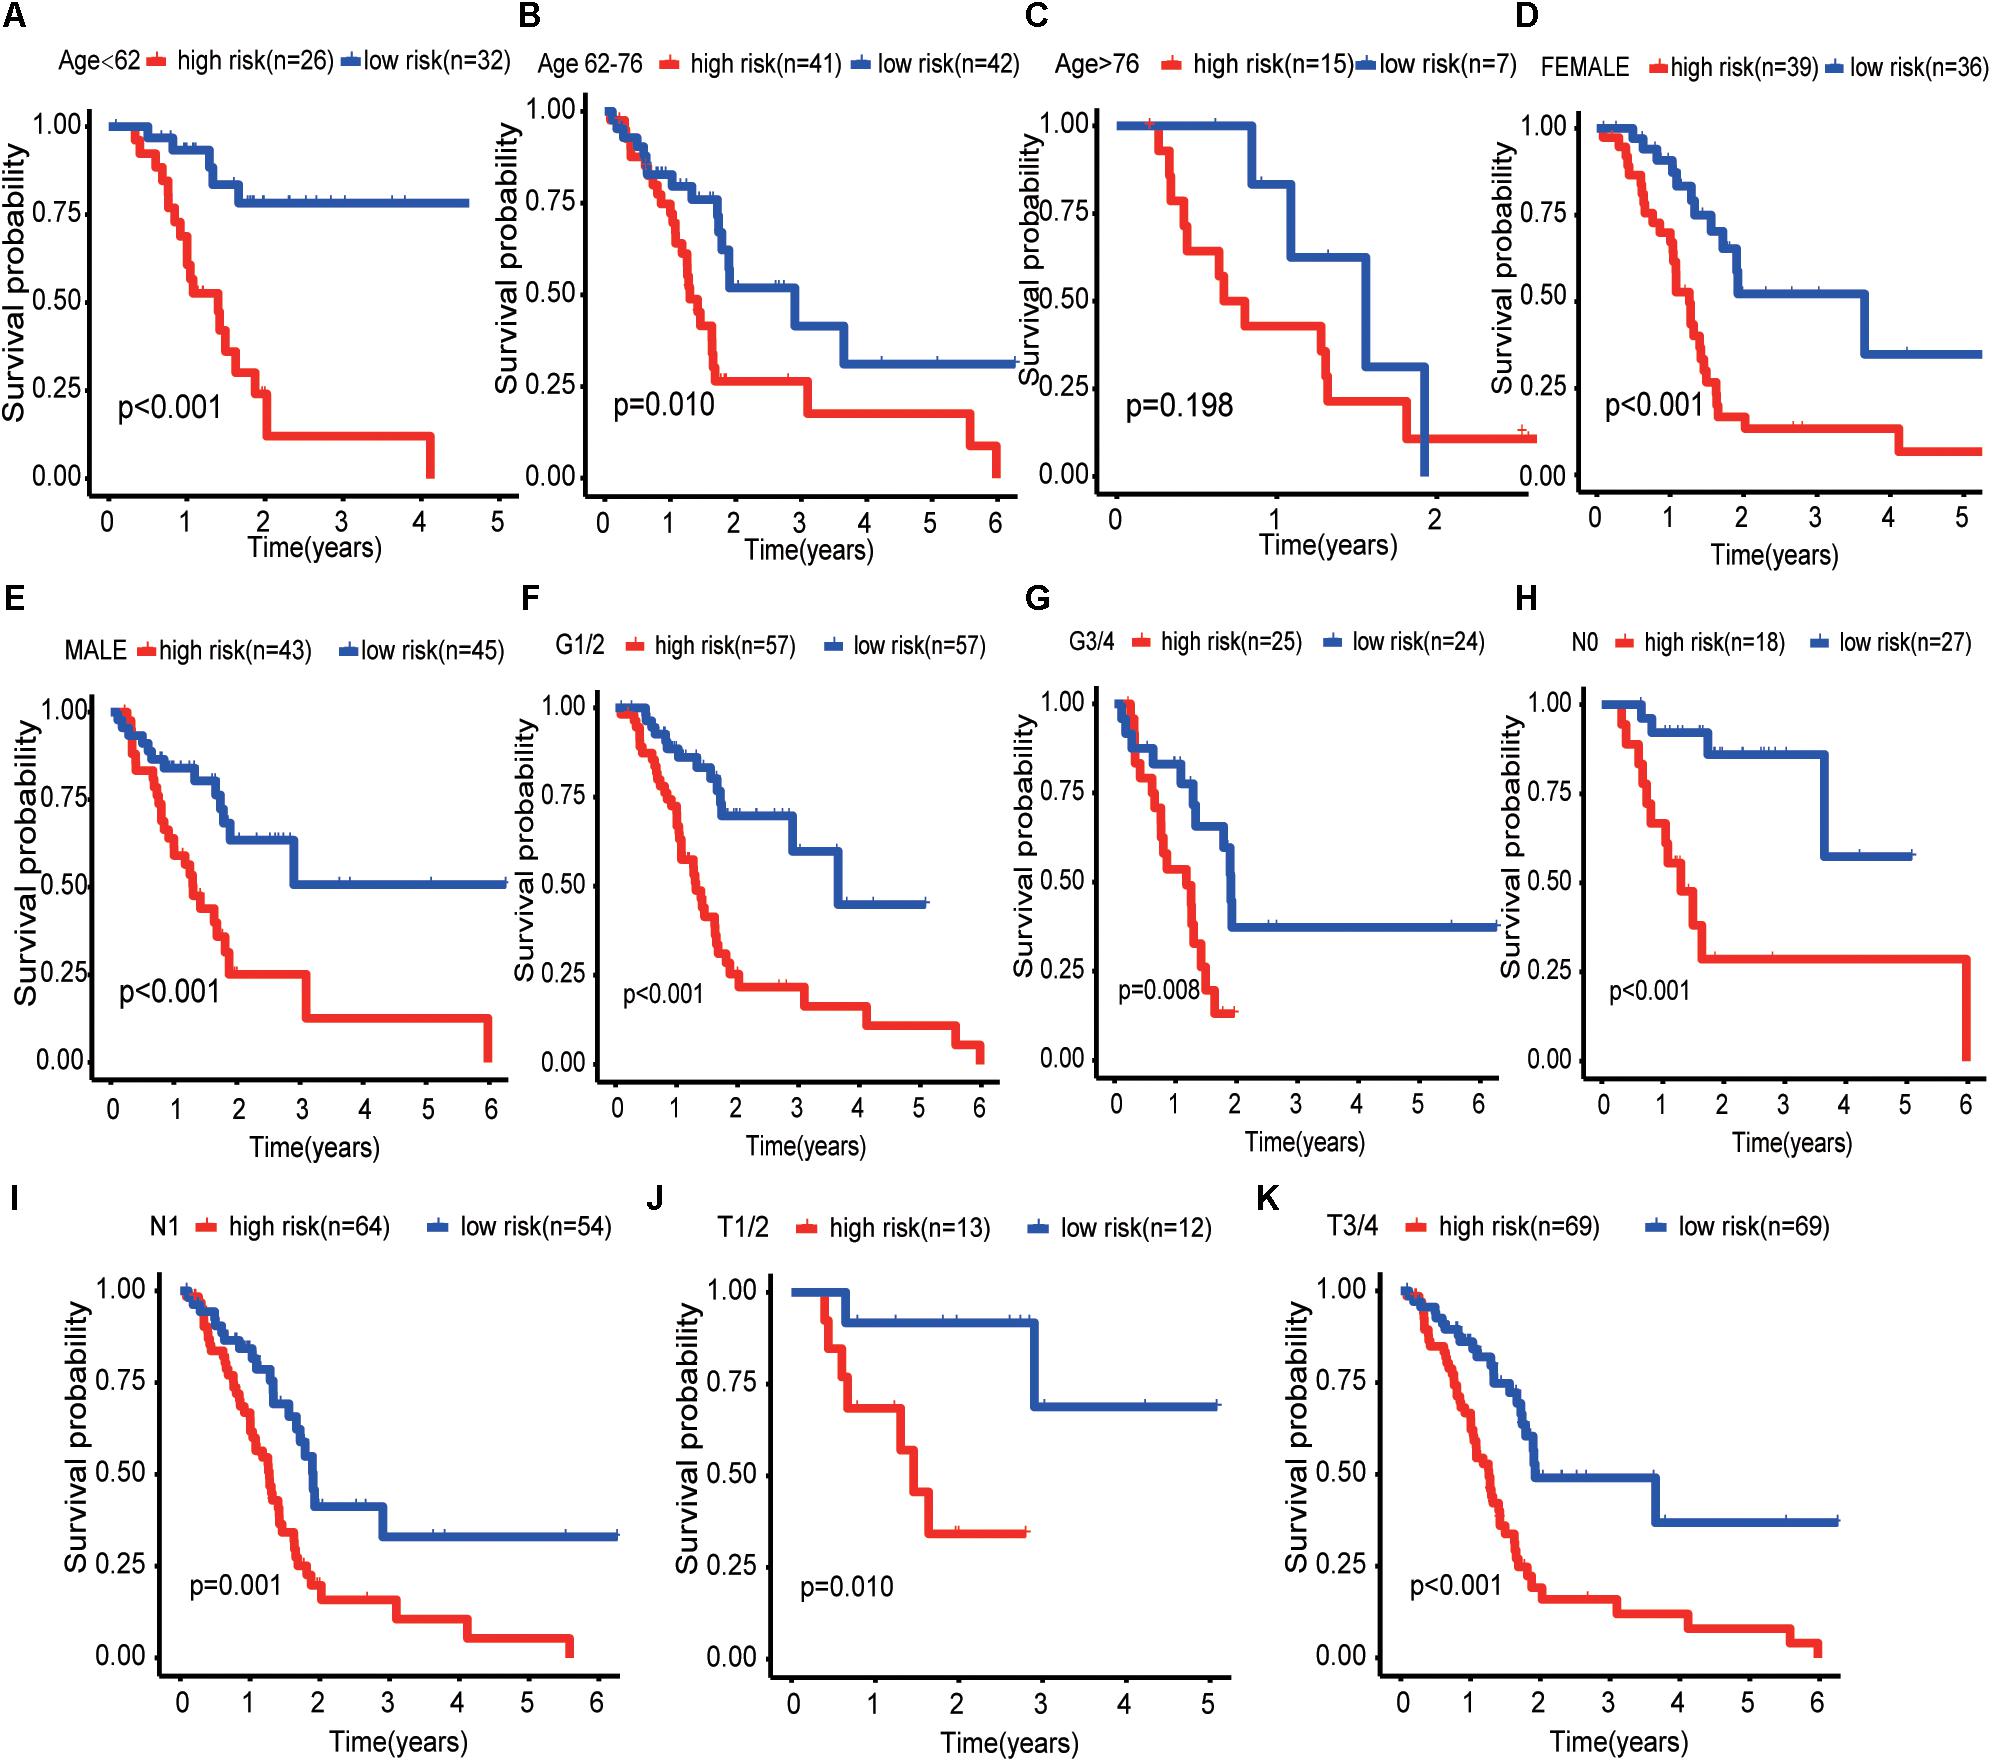
Figure 6. Kaplan–Meier curves for the prognostic value of risk model for the patients grouped according to each clinical feature. (A–C) Kaplan–Meier survival curves of the age patient group (<62, 62–76, and >76). (D,E) Kaplan–Meier survival curves of the gender patient group (male and female). (F,G) Kaplan–Meier survival curves of the pathological grade patient group (G1/2 and G3/4). (H,I) Kaplan–Meier survival curves of the T-stage patient group (T1/2 and T3/4). (J,K) Kaplan–Meier survival curves of the N-stage patient group (N0 and N1).
The protein levels of immunohistochemistry (IHC) staining obtained from the HPA database showed that the expression of the protein in four risk genes (BRCA1, TRIM37, RNF25, and UBE2H) was significantly higher in pancreatic cancer tissues than in normal pancreatic tissues, three genes (RNF7, NPEPPS, and NCCRP1) do the opposite, which was consistent with that at the transcriptional level. Only CDC27 protein expression levels was high in both the normal and tumor group in the HPA database (Figures 7A–H).
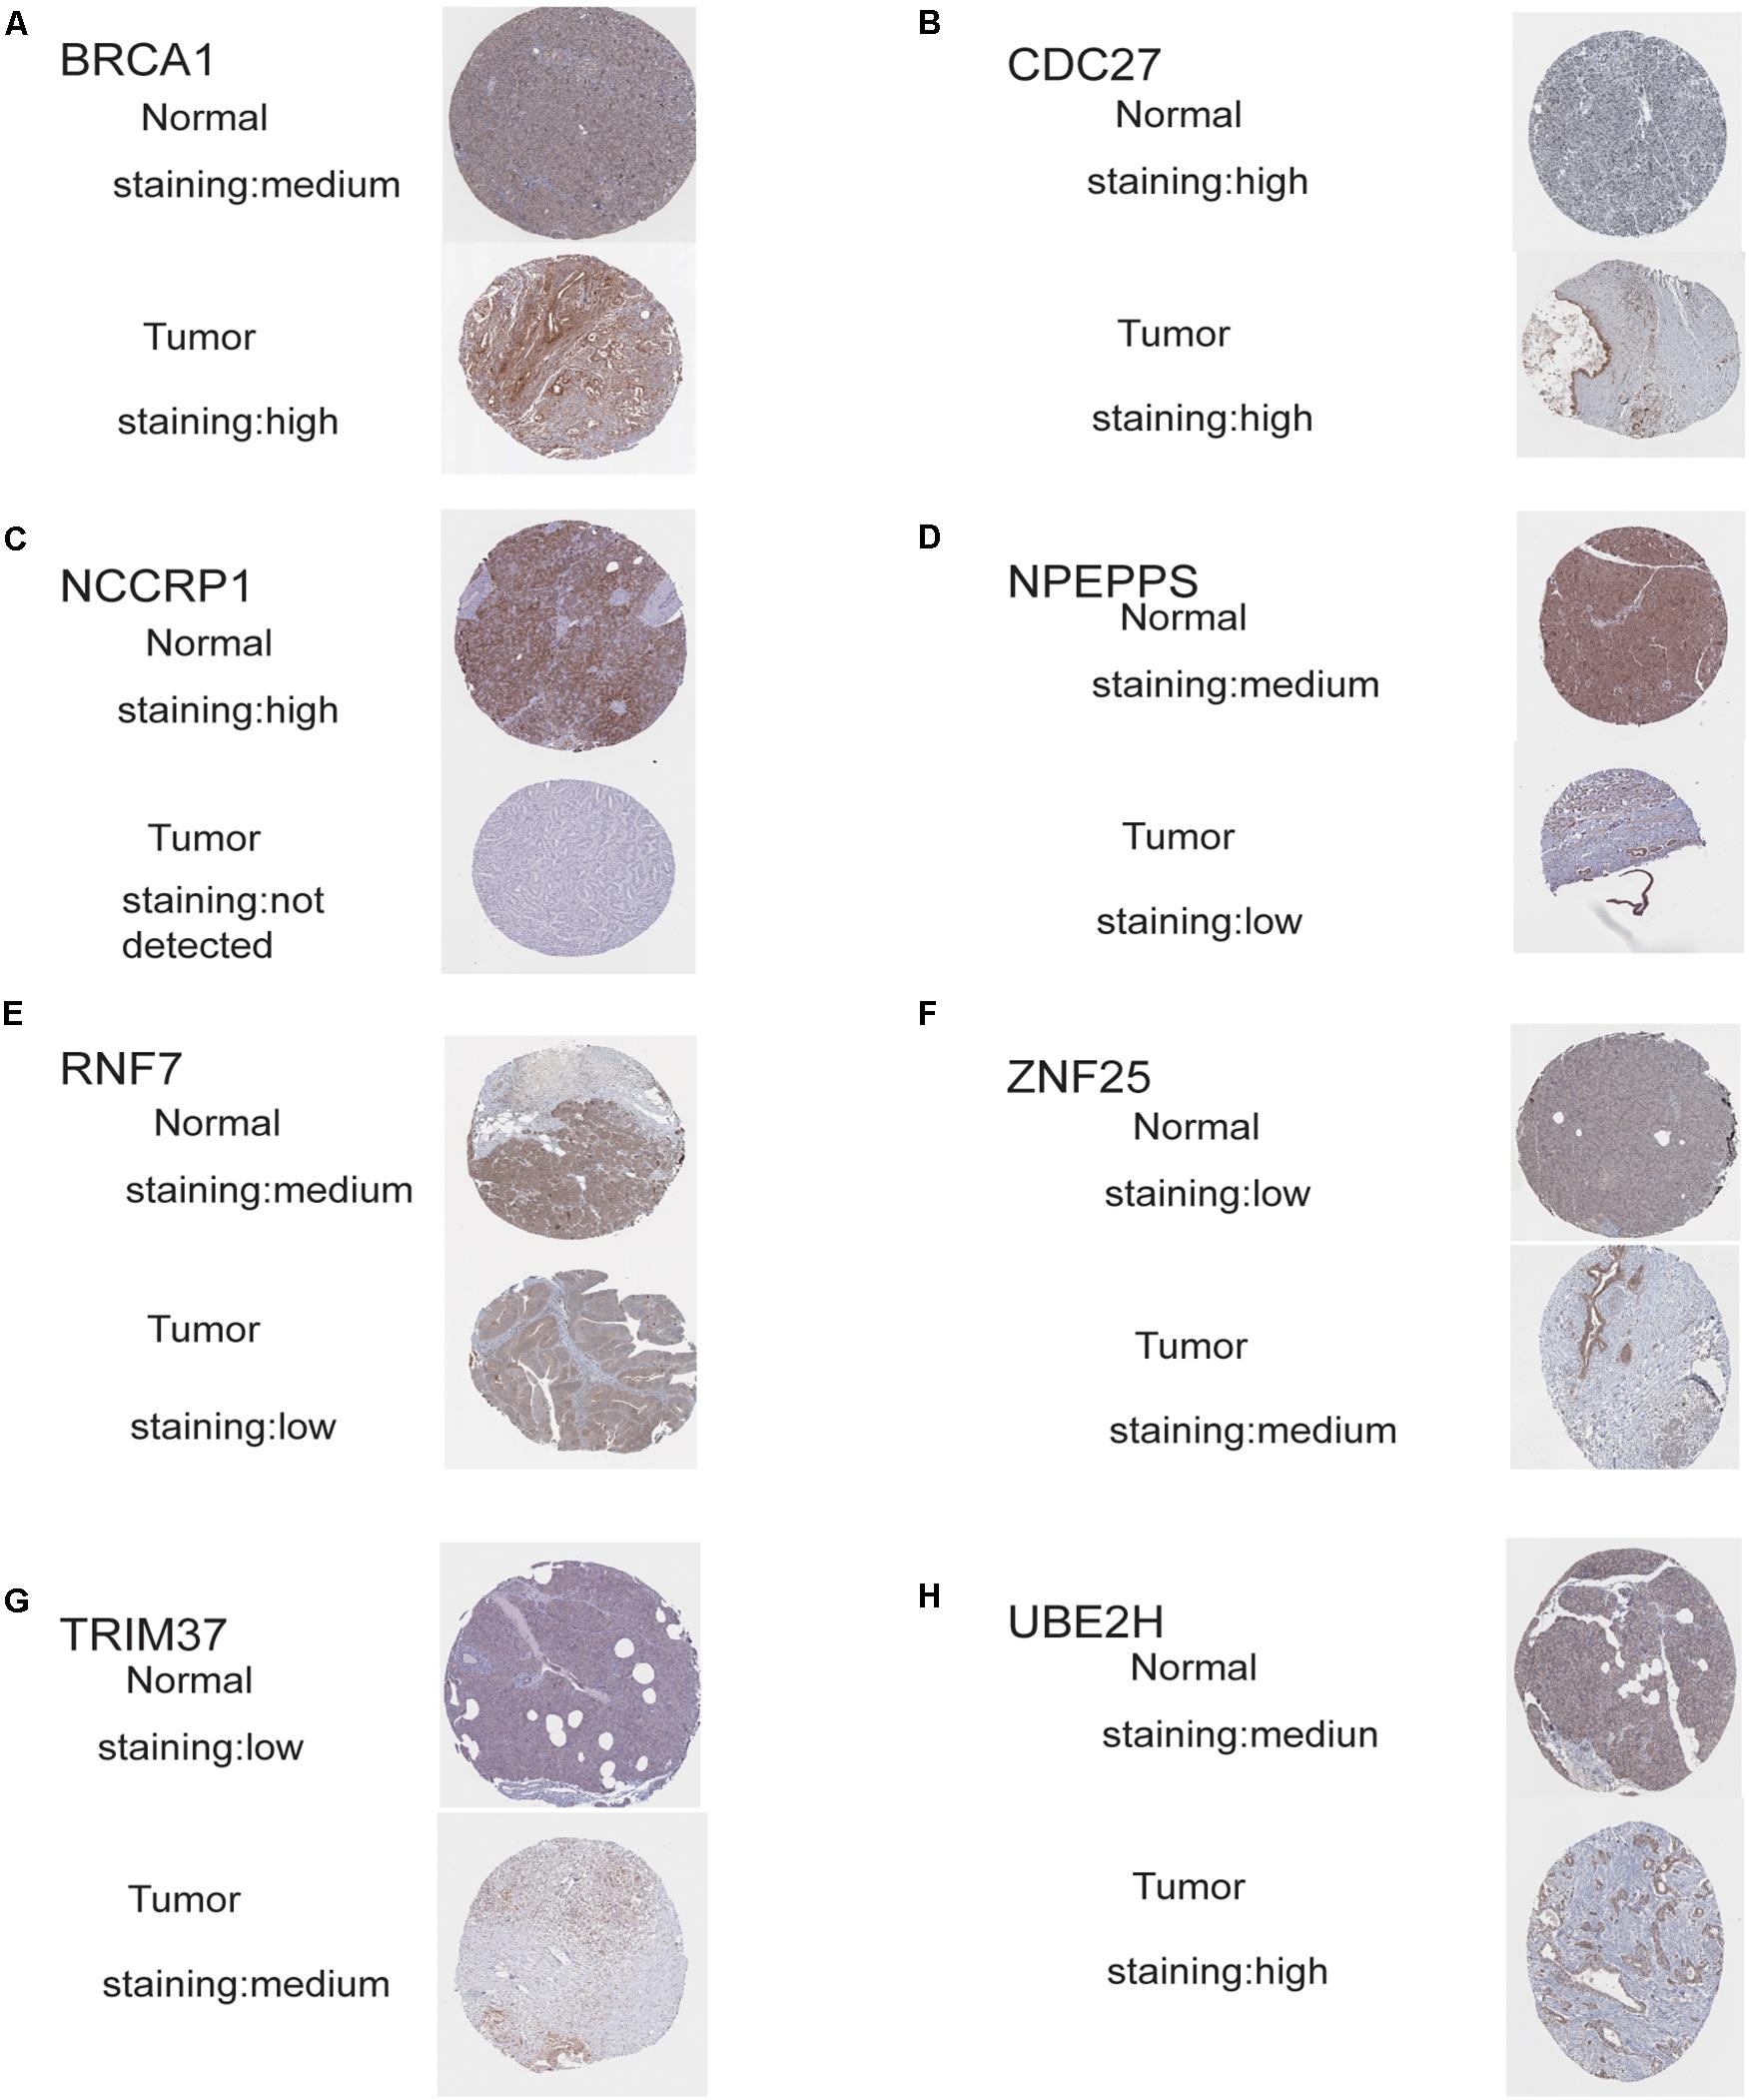
Figure 7. Validation of risk genes at the translational level. (A) Validation of BRCA1 by The Human Protein Atlas database (IHC). (B) Validation of CDC27 by The Human Protein Atlas database (IHC). (C) Validation of NCCRP1 by The Human Protein Atlas database (IHC). (D) Validation of NPEPPS by The Human Protein Atlas database (IHC). (E) Validation of ZNF7 by The Human Protein Atlas database (IHC). (F) Validation of ZNF25 by The Human Protein Atlas database (IHC). (G) Validation of TRIM37 by The Human Protein Atlas database (IHC). (H) Validation of UBE2H by The Human Protein Atlas database (IHC).
One or more pathway data sets are used to assess the ranking list of statistically significant genes/proteins using GSEA. GSEA can not only detect statistically significant genes and proteins group-wise but also enrich the previous research characteristics of gene sets in functional genomes in a large database of pathway gene sets (Subramanian et al., 2005; Wu et al., 2014). In our study, mRNA expression data from 178 patients with pancreatic cancer and 36 normal pancreatic tissues were used for GSEA analysis, and significant differences were found in two functions. These two functions are all related to ubiquitination, indicating that ubiquitination changes significantly in the development of pancreatic cancer. And then, these ubiquitination-related genes in the two functions were selected for subsequent analysis.
Combined with GO enrichment analysis and KEGG enrichment analysis, the results suggest that these genes are closely related to the ubiquitination process of pancreatic cancer. Next, eight optimal ubiquitination-related genes were identified via multivariate Cox proportional hazards regression analysis, and they were used to construct a risk model. The reliability and stability of the model were further validated. The results showed that the model could accurately distinguish pancreatic cancer patients with different survival outcomes. The results of univariate and multivariate analysis showed that our model could independently predict the outcome of pancreatic cancer patients. The result of Kaplan–Meier curves shows that our risk model has excellent stability and reliability in predicting the prognosis of pancreatic cancer at all age, gender, pathological grade, T-stage, and N-stage. Therefore, our risk model can screen high-risk patients for personalized treatment. Finally, the eight risk genes were validated by the HPA database, and the results showed that the protein expression level of the eight genes was generally consistent with those at the transcriptional level. These results suggest that the genes we identified deserve further study.
Of the eight genes identified, seven genes (RNF7, NCCRP1, BRCA1, TRIM37, RNF25, CDC27, and UBE2H) have been reported to play roles in ubiquitination (Asamitsu et al., 2003; Kallio et al., 2011; Link et al., 2016; Cho et al., 2018; Lim and Joo, 2020; Meitinger et al., 2020; Zhang et al., 2020). It has not been reported that NPEPPS directly participates in the process of ubiquitination, but NPEPPS is also known to degrade the tau protein, which accumulates and polymerizes in some neurodegenerative diseases (Kudo et al., 2011). In our study, the expression of these ubiquitination-related genes was significantly associated with the prognosis of patients with pancreatic cancer, providing us with a new key to the study of pancreatic cancer. Among these genes, some have been studied as biomarkers for cancer. For example, BRCA has been proved to be a biomarker in many cancers, and its mutation or not has a guiding role in the application of targeted drugs, such as pancreatic cancer (Wu and Shi, 2020). RNF7, an apoptosis-sensitive gene, has been shown in several previous studies to play an important role in the development and progression of tumors such as prostate cancer and lung cancer (Li et al., 2014; Tan et al., 2016). There are also relevant studies showing that RNF7 regulates ionizing radiation-induced apoptosis in pancreatic cancer (Kim et al., 2011). TRIM37 has also been shown to promote the proliferation, invasion and migration in breast cancer, lung cancer, gastric cancer, glioma, and pancreatic cancer (Jiang et al., 2016; Li et al., 2018; Tang et al., 2018; Hu et al., 2019; Fu et al., 2020). CDC27 promotes the progression and affects PD-L1 expression in T-cell lymphoblastic lymphoma, and also promotes epithelial-to-mesenchymal transition in colorectal cancer (Qiu et al., 2017; Song et al., 2020). There are few studies on the role of NCCRP1, RNF25, and UBE2H in cancer, but the existing research results suggest that these three genes also have the potential to become new tumor biomarkers or targets for cancer (Miwa et al., 2017; Cho et al., 2018; Zhu et al., 2018).
Of the eight genes we identified, three genes (RNF7, NPEPPS, and NCCRP1) were down-regulated and the remaining five (BRCA1, TRIM37, RNF25, CDC27, and UBE2H) were up-regulated in tumor tissue compared to normal pancreatic tissue. But we found that even though some genes (RNF7, NPEPPS, and NCCRP1) were down-regulated in tumor group, patients with pancreatic cancer with high expression of these genes had a worse prognosis. Some genes are up-regulated (TRIM37 and RNF25), but high expression of these genes has a better prognosis. So we suspect that these genes play an opposite role in the development and progression of pancreatic cancer. For example, NPEPPS may inhibit tumor formation in normal tissue but may promote tumor progression once the tumor has formed. This phenomenon has been reported in previous literature. In retrospect, the study has shown that TGF-β is a key negative regulator of cell proliferation, but the abnormal function of retinoblastoma protein can lead to the inhibition of the function of TGF-β and promote the progression of pancreatic cancer (Gore et al., 2014). Another study showed that Daple is also a tumor-suppressor gene, although it appears only in the early stages of cancer to function as a tumor-suppressor gene. In the later stages of cancer, when cancer cells escape from their primary sites and circulate in the blood, the expression of Daple makes cancer cells more aggressive and more likely to spread (Aznar et al., 2015).
Many previous studies have explored new potential biomarkers and therapeutic targets for pancreatic cancer through bioinformatic methods. Wu et al. (2019) screened nine DEGs (MET, KLK10, COL17A1, CEP55, ANKRD22, ITGB6, ARNTL2, MCOLN3, and SLC25A45) through the joint analysis of GEO and TCGA databases and construct a risk score model. They also analyzed the relationship between the nine gene models and tumor immune infiltration. Wei et al. (2019) constructed a risk model to predict the prognosis of pancreatic cancer patients by screening nine immune-related lnRNAs from the TCGA database. Compared with the previous studies, we use GSEA enrichment analysis to explore the function of ubiquitination in pancreatic cancer, and on this basis, identify eight ubiquitination-related genes to construct a risk model. There has been no previous study on the bioinformatics related to the ubiquitination of pancreatic cancer, and our study provides a new idea for relevant studies on the progression of pancreatic cancer.
Of course, our study also has some shortcomings. First, our study was a retrospective study based on a public database. The data we used has not been validated by prospective clinical trials. Besides, the identified mechanism of ubiquitination-related genes affecting the development of pancreatic cancer needs further support from basic experimental studies. Next, we need to collect clinical specimens and data for subsequent studies.
Using GSEA enrichment analysis, we found that the ubiquitination-related functions of pancreatic cancer were significantly different from those of normal pancreatic tissues. Subsequently, we extracted and screened the genes in these functions, and finally selected eight genes significantly related to the prognosis of pancreatic cancer patients as risk genes to construct a risk model. This model has a good predictive effect on the prognosis of pancreatic cancer patients. Moreover, these eight genes have the potential to be further studied as new biomarkers or therapeutic targets for pancreatic cancer.
The datasets supporting the conclusions of this article are obtained from The Cancer Genome Atlas (TCGA) portal website (https://portal.gdc.cancer.gov/) and the Genotype-Tissue Expression (GTEx) database (https://xenabrowser.net/). The alteration of these genes is from an online database (http://www.cbioportal.org/). The authors did not have special access privileges.
NL and QS: conception and design. HZ and LC: data acquisition, data analysis and interpretation, and article writing and revision. All authors have read and agreed to the published version of the manuscript.
This research was supported by National Natural Science Foundation of China (81802980).
The authors declare that the research was conducted in the absence of any commercial or financial relationships that could be construed as a potential conflict of interest.
The Supplementary Material for this article can be found online at: https://www.frontiersin.org/articles/10.3389/fgene.2020.612196/full#supplementary-material
Supplementary Figure 1 | The result of the best cut-off values for the age by using the X-tile software.
Adamska, A., Elaskalani, O., Emmanouilidi, A., Kim, M., Abdol Razak, N. B., Metharom, P., et al. (2018). Molecular and cellular mechanisms of chemoresistance in pancreatic cancer. Adv. Biol. Regul. 68, 77–87. doi: 10.1016/j.jbior.2017.11.007
Asamitsu, K., Tetsuka, T., Kanazawa, S., and Okamoto, T. (2003). RING finger protein AO7 supports NF-kappaB-mediated transcription by interacting with the transactivation domain of the p65 subunit. J. Biol. Chem. 278, 26879–26887. doi: 10.1074/jbc.M211831200
Aznar, N., Midde, K. K., Dunkel, Y., Lopez-Sanchez, I., Pavlova, Y., Marivin, A., et al. (2015). Daple is a novel non-receptor GEF required for trimeric G protein activation in Wnt signaling. eLife 4:e07091. doi: 10.7554/eLife.07091
Chen, L., Yuan, R., Wen, C., Liu, T., Feng, Q., Deng, X., et al. (2020). E3 ubiquitin ligase UBR5 promotes pancreatic cancer growth and aerobic glycolysis by downregulating FBP1 via destabilization of C/EBPalpha. Oncogene doi: 10.1038/s41388-020-01527-1
Cho, J. H., You, Y. M., Yeom, Y. I., Lee, D. C., Kim, B. K., Won, M., et al. (2018). RNF25 promotes gefitinib resistance in EGFR-mutant NSCLC cells by inducing NF-kappaB-mediated ERK reactivation. Cell Death Dis. 9:587. doi: 10.1038/s41419-018-0651-5
Cho, S. H., Pak, K., Jeong, D. C., Han, M. E., Oh, S. O., and Kim, Y. H. (2019). The AP2M1 gene expression is a promising biomarker for predicting survival of patients with hepatocellular carcinoma. J. Cell Biochem. 120, 4140–4146. doi: 10.1002/jcb.27699
Dikic, I., Wakatsuki, S., and Walters, K. J. (2009). Ubiquitin-binding domains - from structures to functions. Nat. Rev. Mol. Cell Biol. 10, 659–671. doi: 10.1038/nrm2767
Fu, T., Ji, K., Jin, L., Zhang, J., Wu, X., Ji, X., et al. (2020). ASB16-AS1 up-regulated and phosphorylated TRIM37 to activate NF-kappaB pathway and promote proliferation, stemness, and cisplatin resistance of gastric cancer. Gas. Cancer doi: 10.1007/s10120-020-01096-y [Epub ahead of print].
Gore, A. J., Deitz, S. L., Palam, L. R., Craven, K. E., and Korc, M. (2014). Pancreatic cancer-associated retinoblastoma 1 dysfunction enables TGF-beta to promote proliferation. J. Clin. Invest. 124, 338–352. doi: 10.1172/JCI71526
Hershko, A., Ciechanover, A., and Rose, I. A. (1979). Resolution of the ATP-dependent proteolytic system from reticulocytes: a component that interacts with ATP. Proc. Natl. Acad. Sci. U.S.A. 76, 3107–3110. doi: 10.1073/pnas.76.7.3107
Hu, X., Xiang, D., Xie, Y., Tao, L., Zhang, Y., Jin, Y., et al. (2019). LSD1 suppresses invasion, migration and metastasis of luminal breast cancer cells via activation of GATA3 and repression of TRIM37 expression. Oncogene 38, 7017–7034. doi: 10.1038/s41388-019-0923-2
Ilic, M., and Ilic, I. (2016). Epidemiology of pancreatic cancer. World J. Gastroenterol. 22, 9694–9705. doi: 10.3748/wjg.v22.i44.9694
Jiang, J., Tian, S., Yu, C., Chen, M., and Sun, C. (2016). TRIM37 promoted the growth and migration of the pancreatic cancer cells. Tumour Biol. 37, 2629–2634. doi: 10.1007/s13277-015-4078-7
Kallio, H., Tolvanen, M., Janis, J., Pan, P. W., Laurila, E., Kallioniemi, A., et al. (2011). Characterization of non-specific cytotoxic cell receptor protein 1: a new member of the lectin-type subfamily of F-box proteins. PLoS One 6:e27152. doi: 10.1371/journal.pone.0027152
Kim, S. Y., Yang, E. S., Lee, Y. S., Lee, J., and Park, J. W. (2011). Sensitive to apoptosis gene protein regulates ionizing radiation-induced apoptosis. Biochimie 93, 269–276. doi: 10.1016/j.biochi.2010.09.020
Kudo, L. C., Parfenova, L., Ren, G., Vi, N., Hui, M., Ma, Z., et al. (2011). Puromycin-sensitive aminopeptidase (PSA/NPEPPS) impedes development of neuropathology in hPSA/TAU(P301L) double-transgenic mice. Hum. Mol. Genet. 20, 1820–1833. doi: 10.1093/hmg/ddr065
Li, H., Tan, M., Jia, L., Wei, D., Zhao, Y., Chen, G., et al. (2014). Inactivation of SAG/RBX2 E3 ubiquitin ligase suppresses KrasG12D-driven lung tumorigenesis. J. Clin. Invest. 124, 835–846. doi: 10.1172/JCI70297
Li, J. P., Li, R., Liu, X., Huo, C., Liu, T. T., Yao, J., et al. (2020). A seven immune-related lncRNAs model to increase the predicted value of lung Adenocarcinoma. Front. Oncol. 10:560779. doi: 10.3389/fonc.2020.560779
Li, Y., Deng, L., Zhao, X., Li, B., Ren, D., Yu, L., et al. (2018). Tripartite motif-containing 37 (TRIM37) promotes the aggressiveness of non-small-cell lung cancer cells by activating the NF-kappaB pathway. J. Pathol. 246, 366–378. doi: 10.1002/path.5144
Lian, J., Liu, C., Guan, X., Wang, B., Yao, Y., Su, D., et al. (2020). Ubiquitin specific peptidase 5 enhances STAT3 signaling and promotes migration and invasion in pancreatic cancer. J. Cancer 11, 6802–6811. doi: 10.7150/jca.48536
Lim, K. H., and Joo, J. Y. (2020). Predictive potential of circulating Ube2h mRNA as an E2 ubiquitin-conjugating enzyme for diagnosis or treatment of Alzheimer’s disease. Int. J. Mol. Sci. 21:3398. doi: 10.3390/ijms21093398
Link, L. A., Howley, B. V., Hussey, G. S., and Howe, P. H. (2016). PCBP1/HNRNP E1 protects chromosomal integrity by translational regulation of CDC27. Mol. Cancer Res. 14, 634–646. doi: 10.1158/1541-7786.MCR-16-0018
Meitinger, F., Ohta, M., Lee, K. Y., Watanabe, S., Davis, R. L., Anzola, J. V., et al. (2020). TRIM37 controls cancer-specific vulnerability to PLK4 inhibition. Nature 585, 440–446. doi: 10.1038/s41586-020-2710-1
Miller, K. D., Nogueira, L., Mariotto, A. B., Rowland, J. H., Yabroff, K. R., Alfano, C. M., et al. (2019). Cancer treatment and survivorship statistics, 2019. CA Cancer J. Clin. 69, 363–385. doi: 10.3322/caac.21565
Miwa, T., Kanda, M., Koike, M., Iwata, N., Tanaka, H., Umeda, S., et al. (2017). Identification of NCCRP1 as an epigenetically regulated tumor suppressor and biomarker for malignant phenotypes of squamous cell carcinoma of the esophagus. Oncol. Lett. 14, 4822–4828. doi: 10.3892/ol.2017.6753
Qiu, L., Tan, X., Lin, J., Liu, R. Y., Chen, S., Geng, R., et al. (2017). CDC27 induces metastasis and invasion in colorectal cancer via the promotion of epithelial-to-mesenchymal transition. J. Cancer 8, 2626–2635. doi: 10.7150/jca.19381
Siegel, R. L., Miller, K. D., and Jemal, A. (2017). Cancer statistics, 2017. CA Cancer J. Clin. 67, 7–30. doi: 10.3322/caac.21387
Song, Y., Song, W., Li, Z., Song, W., Wen, Y., Li, J., et al. (2020). CDC27 promotes tumor progression and affects PD-L1 expression in T-Cell Lymphoblastic lymphoma. Front. Oncol. 10:488. doi: 10.3389/fonc.2020.00488
Subramanian, A., Tamayo, P., Mootha, V. K., Mukherjee, S., Ebert, B. L., Gillette, M. A., et al. (2005). Gene set enrichment analysis: a knowledge-based approach for interpreting genome-wide expression profiles. Proc. Natl. Acad. Sci. U.S.A. 102, 15545–15550. doi: 10.1073/pnas.0506580102
Tan, M., Xu, J., Siddiqui, J., Feng, F., and Sun, Y. (2016). Depletion of SAG/RBX2 E3 ubiquitin ligase suppresses prostate tumorigenesis via inactivation of the PI3K/AKT/mTOR axis. Mol. Cancer 15:81. doi: 10.1186/s12943-016-0567-6
Tang, S. L., Gao, Y. L., and Wen-Zhong, H. (2018). Knockdown of TRIM37 suppresses the proliferation, migration and invasion of glioma cells through the inactivation of PI3K/Akt signaling pathway. Biomed. Pharmacother. 99, 59–64. doi: 10.1016/j.biopha.2018.01.054
Wei, C., Liang, Q., Li, X., Li, H., Liu, Y., Huang, X., et al. (2019). Bioinformatics profiling utilized a nine immune-related long noncoding RNA signature as a prognostic target for pancreatic cancer. J. Cell Biochem. 120, 14916–14927. doi: 10.1002/jcb.28754
Welchman, R. L., Gordon, C., and Mayer, R. J. (2005). Ubiquitin and ubiquitin-like proteins as multifunctional signals. Nat. Rev. Mol. Cell Biol. 6, 599–609. doi: 10.1038/nrm1700
Wu, B., and Shi, L. (2020). Cost-effectiveness of maintenance olaparib for germline BRCA-mutated metastatic pancreatic cancer. J. Natl. Compr. Cancer Netw. 18, 1528–1536. doi: 10.6004/jnccn.2020.7587
Wu, M., Li, X., Zhang, T., Liu, Z., and Zhao, Y. (2019). Identification of a nine-gene signature and establishment of a prognostic nomogram predicting overall survival of pancreatic cancer. Front. Oncol. 9:996. doi: 10.3389/fonc.2019.00996
Wu, X., Hasan, M. A., and Chen, J. Y. (2014). Pathway and network analysis in proteomics. J. Theor. Biol. 362, 44–52. doi: 10.1016/j.jtbi.2014.05.031
Xia, J., Gill, E. E., and Hancock, R. E. (2015). Network analyst for statistical, visual and network-based meta-analysis of gene expression data. Nat. Protoc. 10, 823–844. doi: 10.1038/nprot.2015.052
Yang, C., Zhu, S., Yang, H., Deng, S., Fan, P., Li, M., et al. (2019). USP44 suppresses pancreatic cancer progression and overcomes gemcitabine resistance by deubiquitinating FBP1. Am. J. Cancer Res. 9, 1722–1733.
Yu, G., Wang, L. G., Han, Y., and He, Q. Y. (2012). clusterProfiler: an R package for comparing biological themes among gene clusters. OMICS 16, 284–287. doi: 10.1089/omi.2011.0118
Zhang, F., Yan, P., Yu, H., Le, H., Li, Z., Chen, J., et al. (2020). L ARP7 Is a BRCA1 ubiquitinase substrate and regulates genome stability and Tumorigenesis. Cell Rep. 32:107974. doi: 10.1016/j.celrep.2020.107974
Keywords: pancreatic cancer, bioinformatics, prognosis, ubiquitination-related genes, risk model
Citation: Zuo H, Chen L, Li N and Song Q (2020) Identification of a Ubiquitination-Related Gene Risk Model for Predicting Survival in Patients With Pancreatic Cancer. Front. Genet. 11:612196. doi: 10.3389/fgene.2020.612196
Received: 30 September 2020; Accepted: 30 November 2020;
Published: 22 December 2020.
Edited by:
Maria Rodriguez Martinez, IBM Research - Zürich, SwitzerlandReviewed by:
Arsheed A. Ganaie, University of Minnesota Twin Cities, United StatesCopyright © 2020 Zuo, Chen, Li and Song. This is an open-access article distributed under the terms of the Creative Commons Attribution License (CC BY). The use, distribution or reproduction in other forums is permitted, provided the original author(s) and the copyright owner(s) are credited and that the original publication in this journal is cited, in accordance with accepted academic practice. No use, distribution or reproduction is permitted which does not comply with these terms.
*Correspondence: Na Li, bmFsaXJlbm1pbkAxNjMuY29t; Qibin Song, cWliaW5zb25nQDE2My5jb20=
†These authors have contributed equally to this work and share first authorship
Disclaimer: All claims expressed in this article are solely those of the authors and do not necessarily represent those of their affiliated organizations, or those of the publisher, the editors and the reviewers. Any product that may be evaluated in this article or claim that may be made by its manufacturer is not guaranteed or endorsed by the publisher.
Research integrity at Frontiers
Learn more about the work of our research integrity team to safeguard the quality of each article we publish.