 Xin Wen1†
 Zhiying Shao2,3†
 Shuyi Chen1†Wei Wang1Yan Wang1Jinghua Jiang1Qinggong Ma1
 Longzhen Zhang1,4,5*
- 1Department of Radiation Oncology, Affiliated Hospital of Xuzhou Medical University, Xuzhou, China
- 2Department of Interventional Ultrasound, Cancer Hospital of the University of Chinese Academy of Sciences (Zhejiang Cancer Hospital), Hangzhou, China
- 3Institute of Cancer and Basic Medicine (IBMC), Chinese Academy of Sciences, Hangzhou, China
- 4Cancer Institute, Xuzhou Medical University, Xuzhou, China
- 5Jiangsu Center for the Collaboration and Innovation of Cancer Biotherapy, Xuzhou, China
Background: Recently, RNA-binding proteins (RBPs) were reported to interact with target mRNA to regulate gene posttranscriptional expression, and RBP-mediated RNA modification can regulate the expression and function of proto-oncogenes and tumor suppressor genes. We systematically analyzed the expression of RBPs in pancreatic adenocarcinoma (PAAD) and constructed an RBP-associated prognostic risk model.
Methods: Gene expression data of normal pancreatic samples as well as PAAD samples were downloaded from TCGA-PAAD and GTEx databases. Wilcoxon test and univariate Cox analysis were, respectively, applied to screen differential expression RBPs (DE-RBPs) and prognostic-associated RBPs (pRBPs). Functional enrichment was analyzed by GO, KEGG, and GSEA. Protein–protein interaction (PPI) network was constructed by STRING online database. Modeling RBPs were selected by multivariate Cox analysis. Kaplan–Meier survival and Cox analysis were applied to evaluate the effects of risk score on the overall survival of PAAD patients. ROC curves and validation cohort were applied to verify the accuracy of the model. Nomogram was applied for predicting 1-, 3-, and 5-year overall survival (OS) of PAAD patients. At last, modeling RBPs were further analyzed to explore their differential expression, prognostic value, as well as enrichment pathways in PAAD.
Results: RBPs (453) were differentially expressed in normal and tumor samples, besides, 28 of which were prognostic associated. DE-RBPs (453) are functionally associated with ribosome, ribonuclease, spliceosome, etc. Eight RBPs (PABPC1, PRPF6, OAS1, RBM5, LSM12, IPO7, FXR1, and RBM6) were identified to construct a prognostic risk model. Higher risk score not only predicted poor prognosis but also was an independent poor prognostic indicator, which was verified by ROC curves and validation cohort. Eight modeling RBPs were confirmed to be significantly differentially expressed between normal and tumor samples from RNA and protein level. Besides, all of eight RBPs were related with overall survival of PAAD patients.
Conclusions: We successfully constructed an RBP-associated prognostic risk model in PAAD, which has a potential clinical application prospect.
Introduction
Pancreatic adenocarcinoma (PAAD) is one of the malignant tumors with the worst prognosis in the digestive system. On the background of great advances in diagnosis and therapy of PAAD, there are only 2–9% of PAAD patients surviving for more than 5 years, indicating that PAAD is a highly fatal disease with an insidious onset (McGuigan et al., 2018). Existing medical technologies such as imaging examination, tumor molecular biomarkers, and pathological examination are currently quite limited and in low efficiency, which may be a momentous reason for low early detection rate and high mortality in PAAD. Therefore, exploring the pathogenesis of PAAD, formulating effective methods of early screening and diagnosis, and looking for new prognostic biomarkers and treatment targets of PAAD are helpful to improve the therapeutic effect and survival rate of PAAD.
RNA-binding proteins (RBPs) are defined as proteins that contain known domains to directly interact with various types of RNA. Of course, some proteins without structurally characterized conformations to interact with RNA but residing within well characterized ribonucleoproteins (RNPs–protein or proteins complexed with RNA as an obligate binding partner) are also defined as RBPs. With the development of techniques for the identification of RBPs, 1,542 RBPs have been in a final census up to date (Gerstberger et al., 2014). RBPs play a vital role in regulating post-transcription of gene expression by recognizing specific sequences or secondary structures to form ribonucleoprotein (RNP) complexes to regulate a series of RNA processes, including splicing, polyadenylation, maturation, modification, transport, stability, localization, and translation (Castello et al., 2012; Mitchell and Parker, 2014). RBPs is a key regulator in maintaining cell physiological balance, especially in stress response (such as hypoxia, DNA damage, nutrition deficiency, or chemotherapy) and cell development (Masuda and Kuwano, 2019). More studies have proved that abnormal RBP expression is the genesis of diseases and is associated with cancer occurring and development (Pereira et al., 2017; Chatterji and Rustgi, 2018; Legrand et al., 2019; Li et al., 2020). The role of RBP-promoters or suppressors are various according to cancer types. For example, RBM38 was considered to take part in the formation of T-cell lymphoma by regulating mutants p53 and PTEN, but in non-small cell lung cancer (NSCLC), renal carcinoma (RCC), and hepatocellular carcinoma (HCC), RBM38 suppressed the progression of carcinoma (Ding et al., 2014; Huang et al., 2017; Yang et al., 2018; Zhang et al., 2018). PCBP1 was found in a lower expression level in cervical, colorectal, lung, liver, and breast cancer compared with corresponding normal tissues, which was identified as a tumor suppressor (Pillai et al., 2003; Thakur et al., 2003; Wang et al., 2010; Zhang et al., 2010; Guo and Jia, 2018). Not only does RBPs itself influence occurrence and progression of cancers, RBPs can also influence the expression of other oncogenes and tumor suppressor genes through post-translational modification, expression, or localization, which regulates the growth of cancers (Lujan et al., 2018). At present, there is no systematic study to analyze the relationship of RBP expression with PAAD.
In this study, we first identified differently expressed and prognosis-related RBPs in PAAD through high-throughput bioinformatics analysis based on TCGA and GTEx database, and ultimately, we constructed and verified the prognostic risk model, which may become potential diagnostic and prognostic biomarkers. The complete workflow is summarized in Figure 1.
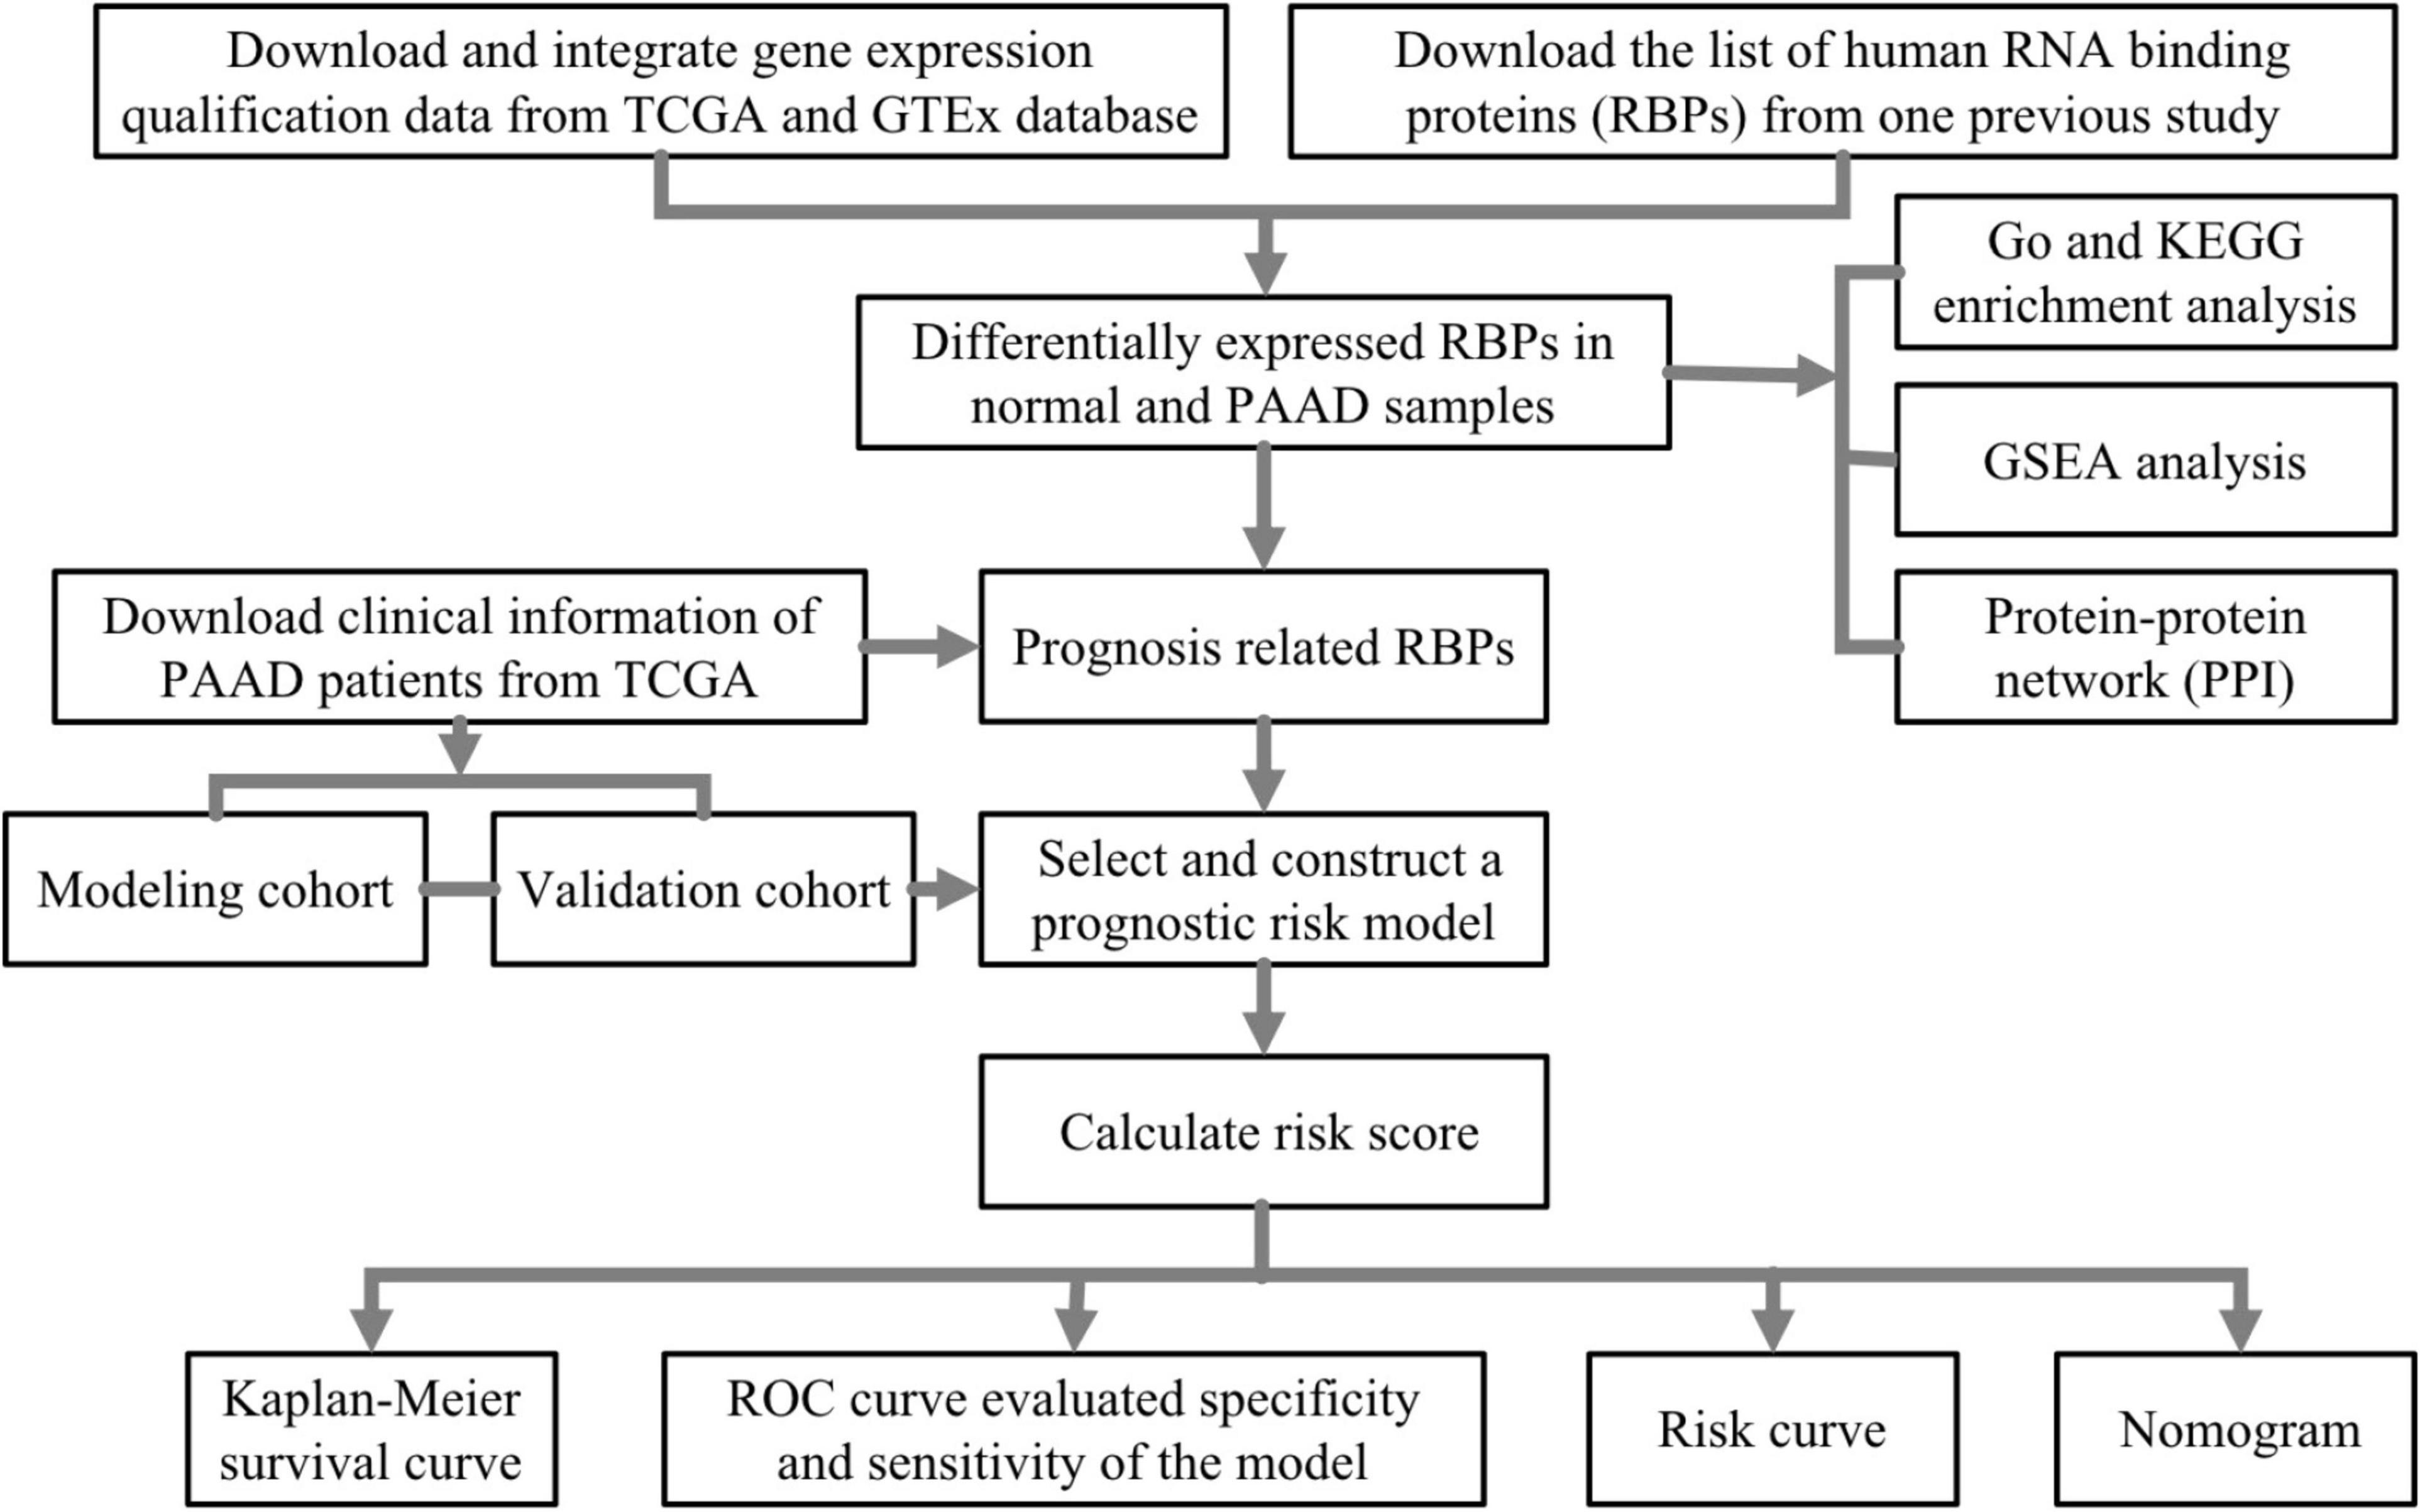
Figure 1. The flowchart of analysis of RNA-binding proteins (RBPs) in pancreatic adenocarcinoma (PAAD).
Materials and Methods
Data Download and Processing
Gene expression data of normal pancreatic samples and PAAD samples were downloaded from GTEx databases1 and TCGA-PAAD2. Data type was HTseq-FPKM, and gene expression level in both two databases was further processed by log2 (FPKM+1). It should be noted that GTEx database collected more than 7,000 normal samples from 449 healthy humans, and gene expression data were treated by the same sequencing platform with TCGA database for minimizing potential batch effects. Previous studies have proved that the gene expression data of TCGA and GTEx can be analyzed and integrated successfully (Kosti et al., 2016; Aran et al., 2017; Raphael et al., 2017; Zeng et al., 2019; Venkat et al., 2020). Based on this, we integrated gene expression data from TCGA-PAAD and GTEx including 178 tumor samples and 171 normal samples (4 from TCGA-PAAD and 167 from GTEx). Clinical information was all downloaded from TCGA-PAAD, and patients losing to follow-up or follow-up of less than 90 days were removed. Ultimately, 173 PAAD samples, summarized in Table 1, were brought into survival analysis. The list of 1,542 RBPs in a final census up to date was downloaded from one previous study of Gerstberger et al. (2014).
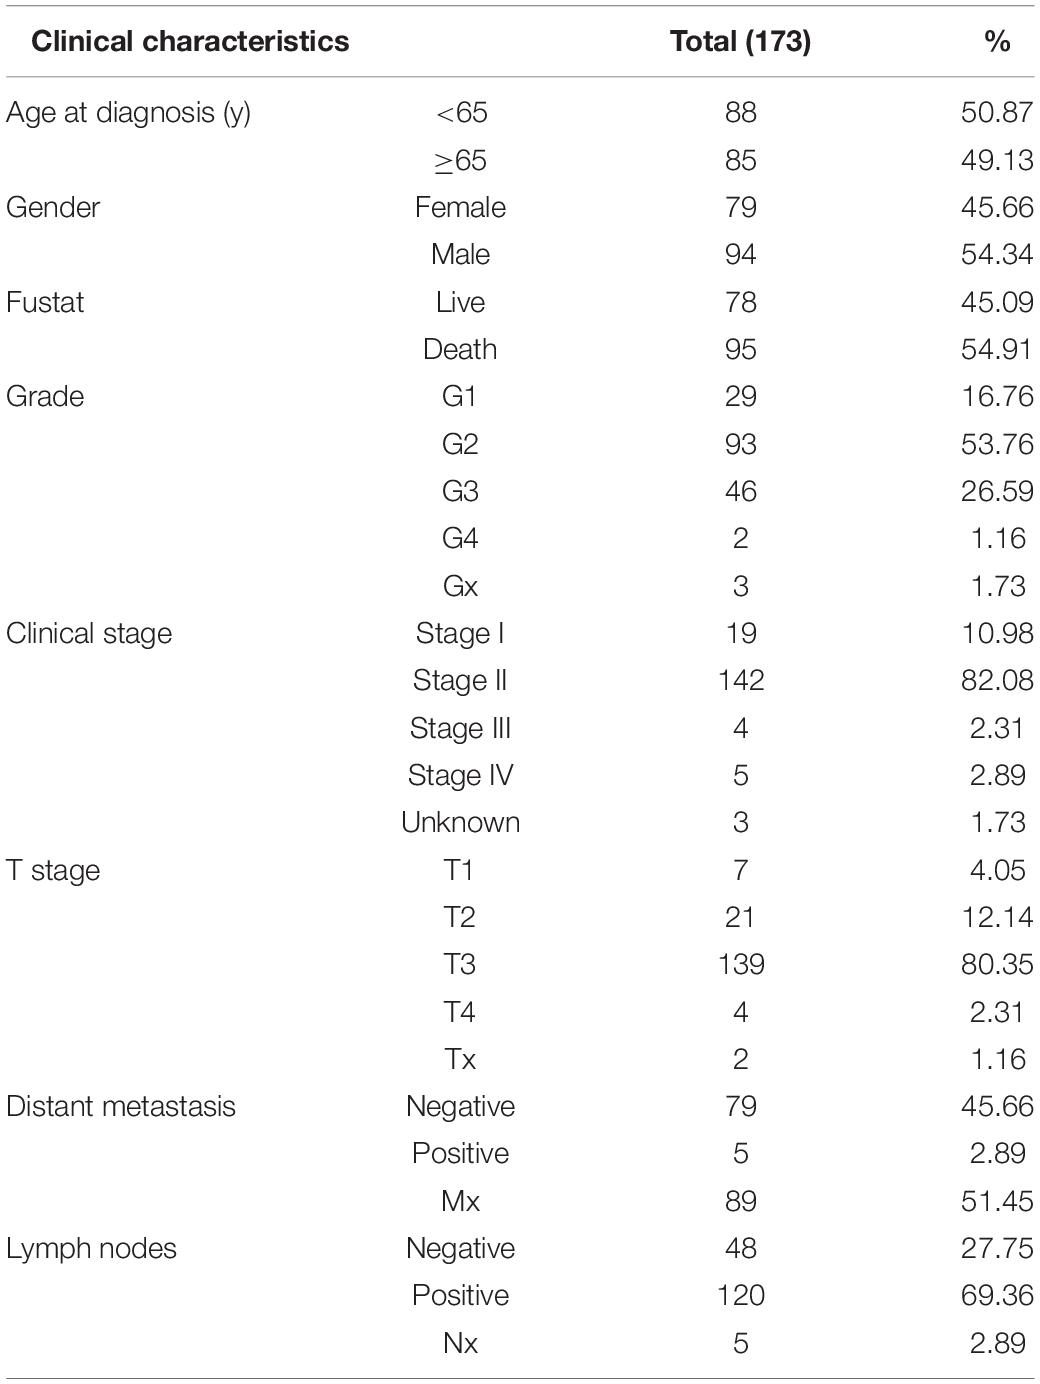
Table 1. Clinical characteristics of pancreatic adenocarcinoma (PAAD) patients from TCGA.
Variance Analysis
Differential expression-RBPs (DE-RBPs) in normal and PAAD samples were selected by Wilcoxon test with the screening requirement of false discovery rate (FDR) < 0.01 and | Log2FC| > 1 (Zhang et al., 2016; Han et al., 2018; Ouyang et al., 2019). In variance analysis, if one gene appears for more than one time, the mean value was calculated and applied for further analysis, which is by means of the “Limma” package (Li et al., 2020).
Functional Enrichment Analysis and Protein–Protein Interaction Network
The GO and KEGG functional enrichment of DE-RBPs were analyzed with the requirement of p-value < 0.05 and q-value < 0.05 (Yang et al., 2019). Functional enrichment analysis of these 453 DE-RBPs was further analyzed by gene set enrichment analysis (GSEA). GSEA is a computational method, which determines whether an a priori defined set of genes shows significant differences between two groups (normal pancreatic group and PAAD group) statistically. One thousand genome permutations were performed per analysis (Subramanian et al., 2005; Wu and Zhang, 2018). | Normalized enrichment score| (| NES|) > 1 and norminal p-value (NOM p-value) < 0.05 were considered significant. Functional protein–protein interaction (PPI) network of DE-RBPs was analyzed by STRING online database3 (Szklarczyk et al., 2019) and was visualized by cytoscape 3.7.1 (Zhang et al., 2016). The important precondition was set as interaction score ≥ 0.4 and hiding disconnected nodes. Critical sub-networks were separated out to construct sub-networks by MCODE (molecular complex detection) plug-in of the cytoscape 3.7.1 software (Bader and Hogue, 2003). Node count number and MCODE score were both more than 15.
Construction of Prognostic Risk Model in PAAD
Prognosis-related RBPs (pRBPs) were selected by univariate Cox analysis with the screening criteria of p ≤ 0.001, which was visualized with “forestplot” software package in R software (Li et al., 2020). pRBP constructing prognostic risk model in PAAD were further analyzed and selected by multivariate Cox analysis. Risk score was calculated by the formulation , where coef is the coefficient value of one pRBP constructed model, Exp is the expression level of the corresponding gene, and n is the number of modeling pRBPs. Here, patients from TCGA-PAAD were classified into two cohorts randomly and equally. One cohort was the modeling, and the other was the testing. Based on the median risk scores of two cohorts, PAAD patients were split into two subgroups, respectively: the high-risk score subgroups and the low-risk score subgroups. Kaplan–Meier (KM) survival curves were used to describe the overall survival difference between two subgroups by the “survminer” package, and ROC (receiver operating characteristic) curves were used to evaluate the accuracy of the model with AUC values (area under curve) by “survivalROC” package (Heagerty et al., 2000). Cox regression analysis was further applied to analyze the relationship of risk score prognosis of PAAD patients. Finally, the “rms” package was used to draw a nomogram for predicting 1-, 3-, and 5-year OS of PAAD patients in modeling cohort (Kim et al., 2018; Liu et al., 2020).
Differential Expression, Prognostic Analysis, and Gene Set Enrichment Analysis of 8 Modeling RBPs
Wilcox regression was applied to analyze the expression of modeling RBPs in normal samples and PAAD samples (Zhang et al., 2016; Han et al., 2018; Ouyang et al., 2019). A P-value < 0.05 was considered significant. The differential expression of eight modeling RBPs in normal and tumor cases was then verified by the Human Protein Atlas (HPA) online database4 from protein level in forms of immunohistochemical staining images (Thul et al., 2017). Kaplan–Meier survival curves were applied to analyze prognostic values of modeling RBPs. A P-value < 0.05 was considered significant. We further analyzed the function and potential molecular mechanism of eight modeling RBPs by GSEA. GSEA was conducted as abovementioned and in a previous study (Zhang et al., 2020).
Statistical Analysis
All statistical analyses in this study were performed by the R (V.4.0.2) software.
Results
Patient Characteristics
As summarized in Table 1, basic information of 173 PAAD patients downloaded from TCGA database on June 11, 2020 were used for analysis. Patients older than 65 and younger than 65 accounted for half approximately, respectively, and male patients were approximately 8.68% more than female patients. Until the date we downloaded information, 54.91% PAAD patients have died. Of the 173 PAAD patients, the pathologic stage mainly focused on the G2 stage (n = 93, 53.76%) and G3 stage (n = 46, 26.59%); the clinical stage mainly concentrated on stage II (n = 142, 82.08%). Stages I, III, and IV patients accounted for 10.98% (n = 19), 2.31% (n = 4), and 2.89% (n = 5), respectively. Patients with T3 stage accounted for the majority (n = 139, 80.35%). Tx, T1, T2, and T4 patients accounted for 1.16% (n = 2), 4.05% (n = 7), 12.14% (n = 21), and 2.31% (n = 4), respectively. Patients with positive lymph node metastasis and distant metastasis accounted for 69.36% (n = 120) and 2.89% (n = 5), respectively, which further proved that insidious onset of PAAD resulted in advanced stage and poor prognosis when diagnosed.
Variance Analysis
The expression variance of 1,542 RBPs between 171 normal samples and 178 PAAD samples is shown in Figure 2. RBPs (453) were differentially expressed in normal and tumor samples (FDR < 0.01 and | log2FC| > 1). Compared with normal samples, 224 DE-RBPs were upregulated and 229 DE-RBPs were downregulated in PAAD samples.
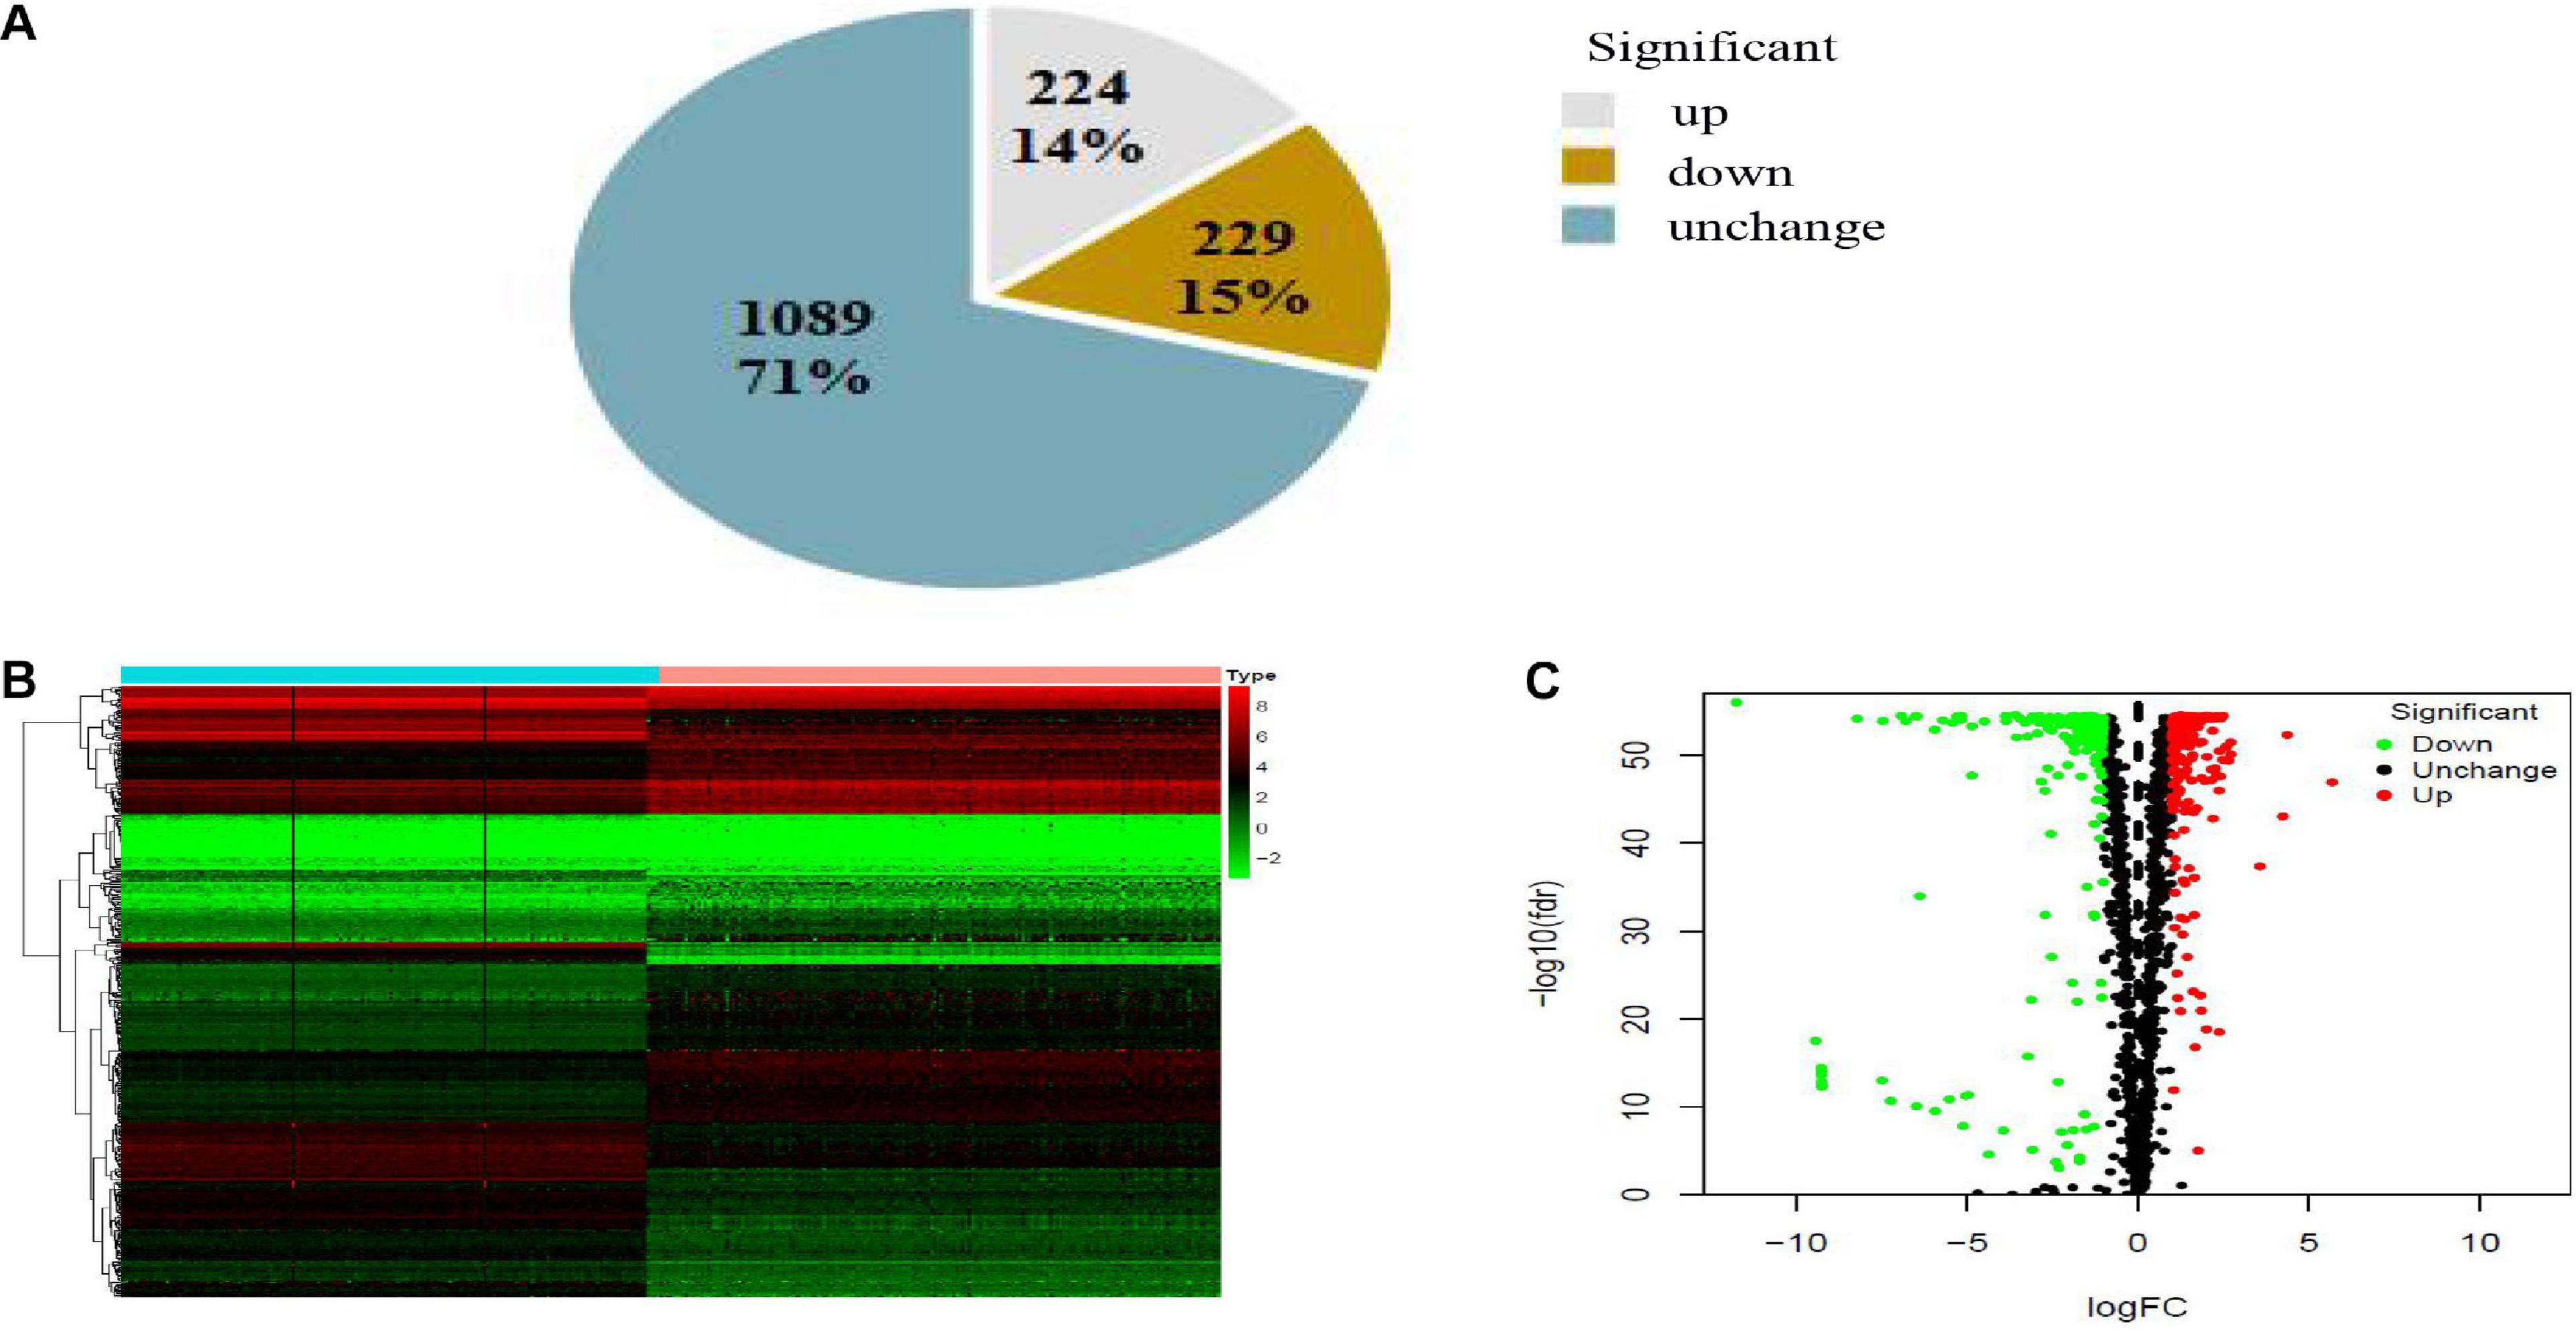
Figure 2. Pie chart (A), heatmap (B), and volcano map (C) of RBPs in PAAD. (A) Gray, brown, and blue pieces represented number and percentage of up-, down- and no significant difference RBPs. (B) X- and Y-axes represented samples and RBPs, respectively. Higher, lower, and medium expression of RBPs is shown, respectively, in red, green, and black. Blue and pink bars on top of the heat map indicate normal pancreatic samples and PAAD samples, respectively. (C) Downregulated, upregulated, and no significant difference RBPs in PAAD are shown in green, red, and black dots, respectively. False discovery rate (FDR) < 0.01 and | log2FC| > 1 was considered statistically significant.
Functional Enrichment Analysis
To research the function and molecular mechanisms of 453 DE-RBPs, we subsequently implemented GO functional, KEGG pathway enrichment analysis, and GSEA. GO functional enrichment analysis was classified by three categories: BP—biological process, CC—cellular component, and MF—molecular function. As shown in Table 2A and Figure 3, the top 10 components of BP were RNA splicing, RNA catabolic process, etc. The top 10 components of CC were ribosome, ribonucleoprotein granule, etc. The top 10 components of MF were catalytic activity acting on RNA, translation regulator activity, etc. According to the NES of GSEA, the function of DE-RBPs in PAAD were enriched in the protein DNA complex, abnormality of the thorax, and limitation of joint mobility; the function of DE-RBPs in normal pancreatic group were enriched in cytoplasmic translation, peptide metabolic process, peptide biosynthetic process, etc. (Supplementary Figure 1, Table 2B and Figure 3). The KEGG pathway enrichment analysis showed that DE-RBPs in PAAD were enriched in RNA transport and ribosome mainly. None enriched pathways were found by GSEA. Therefore, RBPs may mediate various regulatory processes of post-transcription, such as RNA splicing and polyadenylation, which then affect the occurrence and progression of malignant tumors and other biological functions.
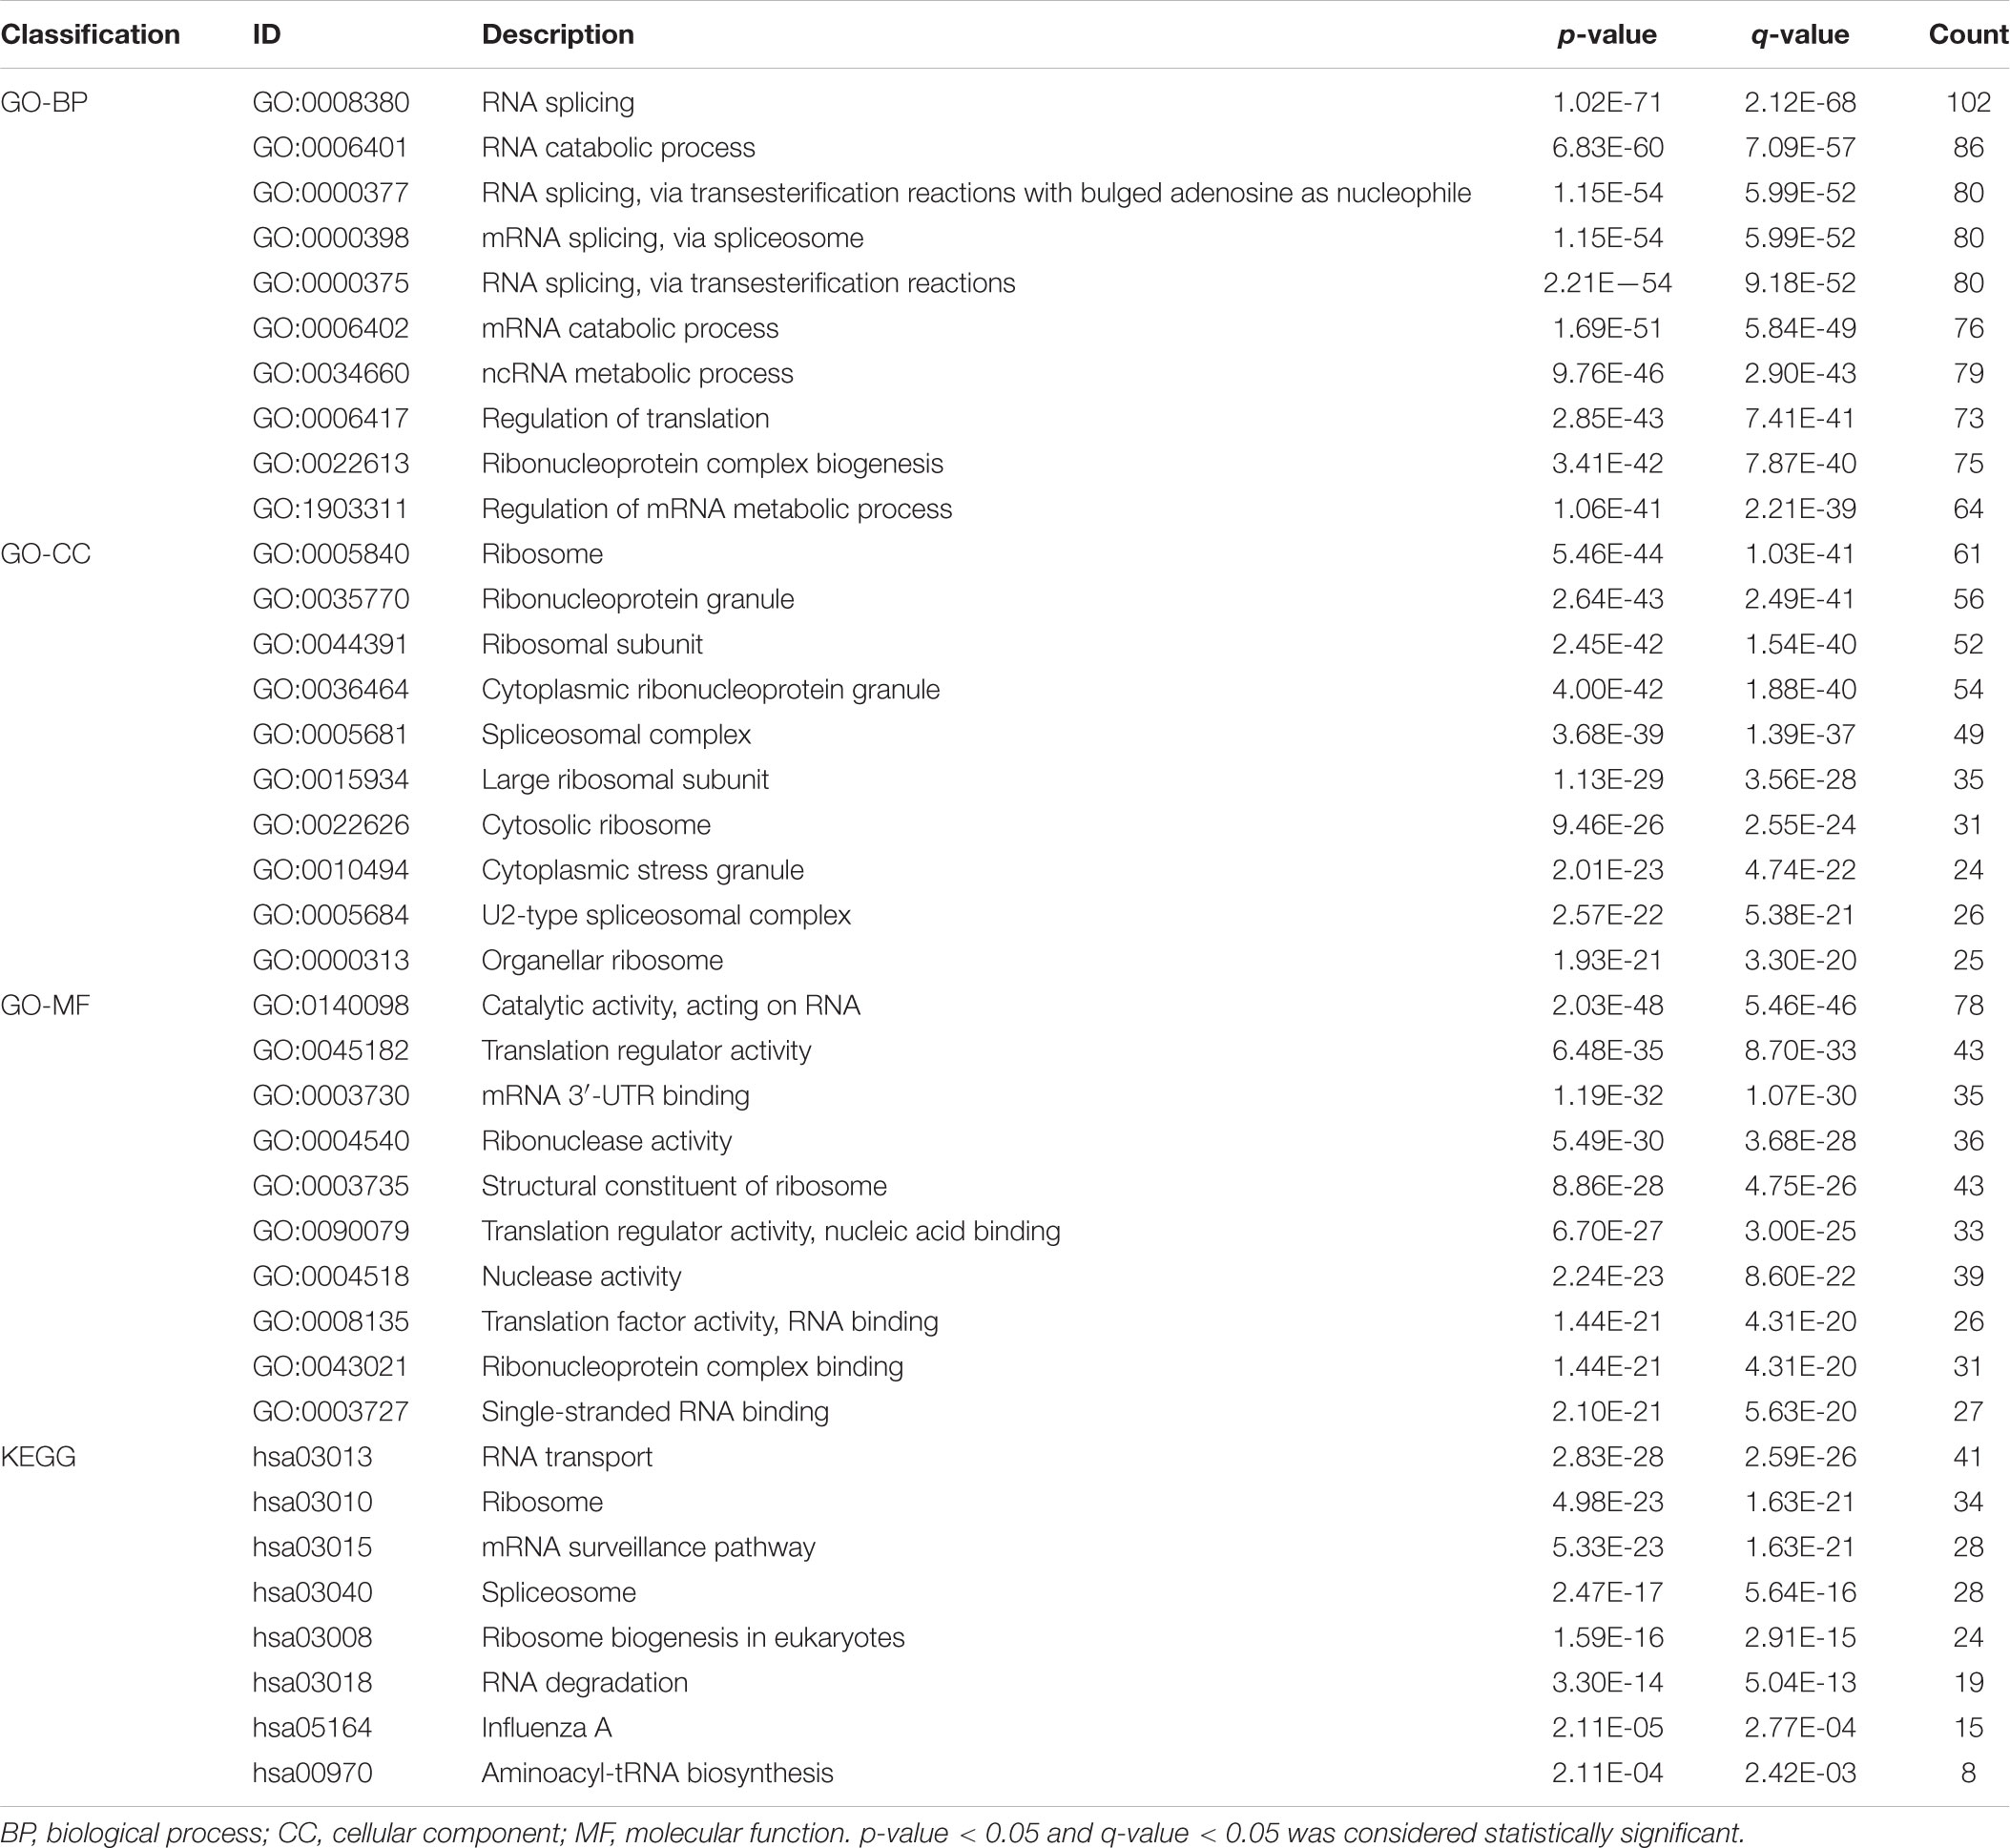
Table 2A GO and KEGG functional enrichment analysis of differential expression –RBPs (DE-RBPs) in PAAD.
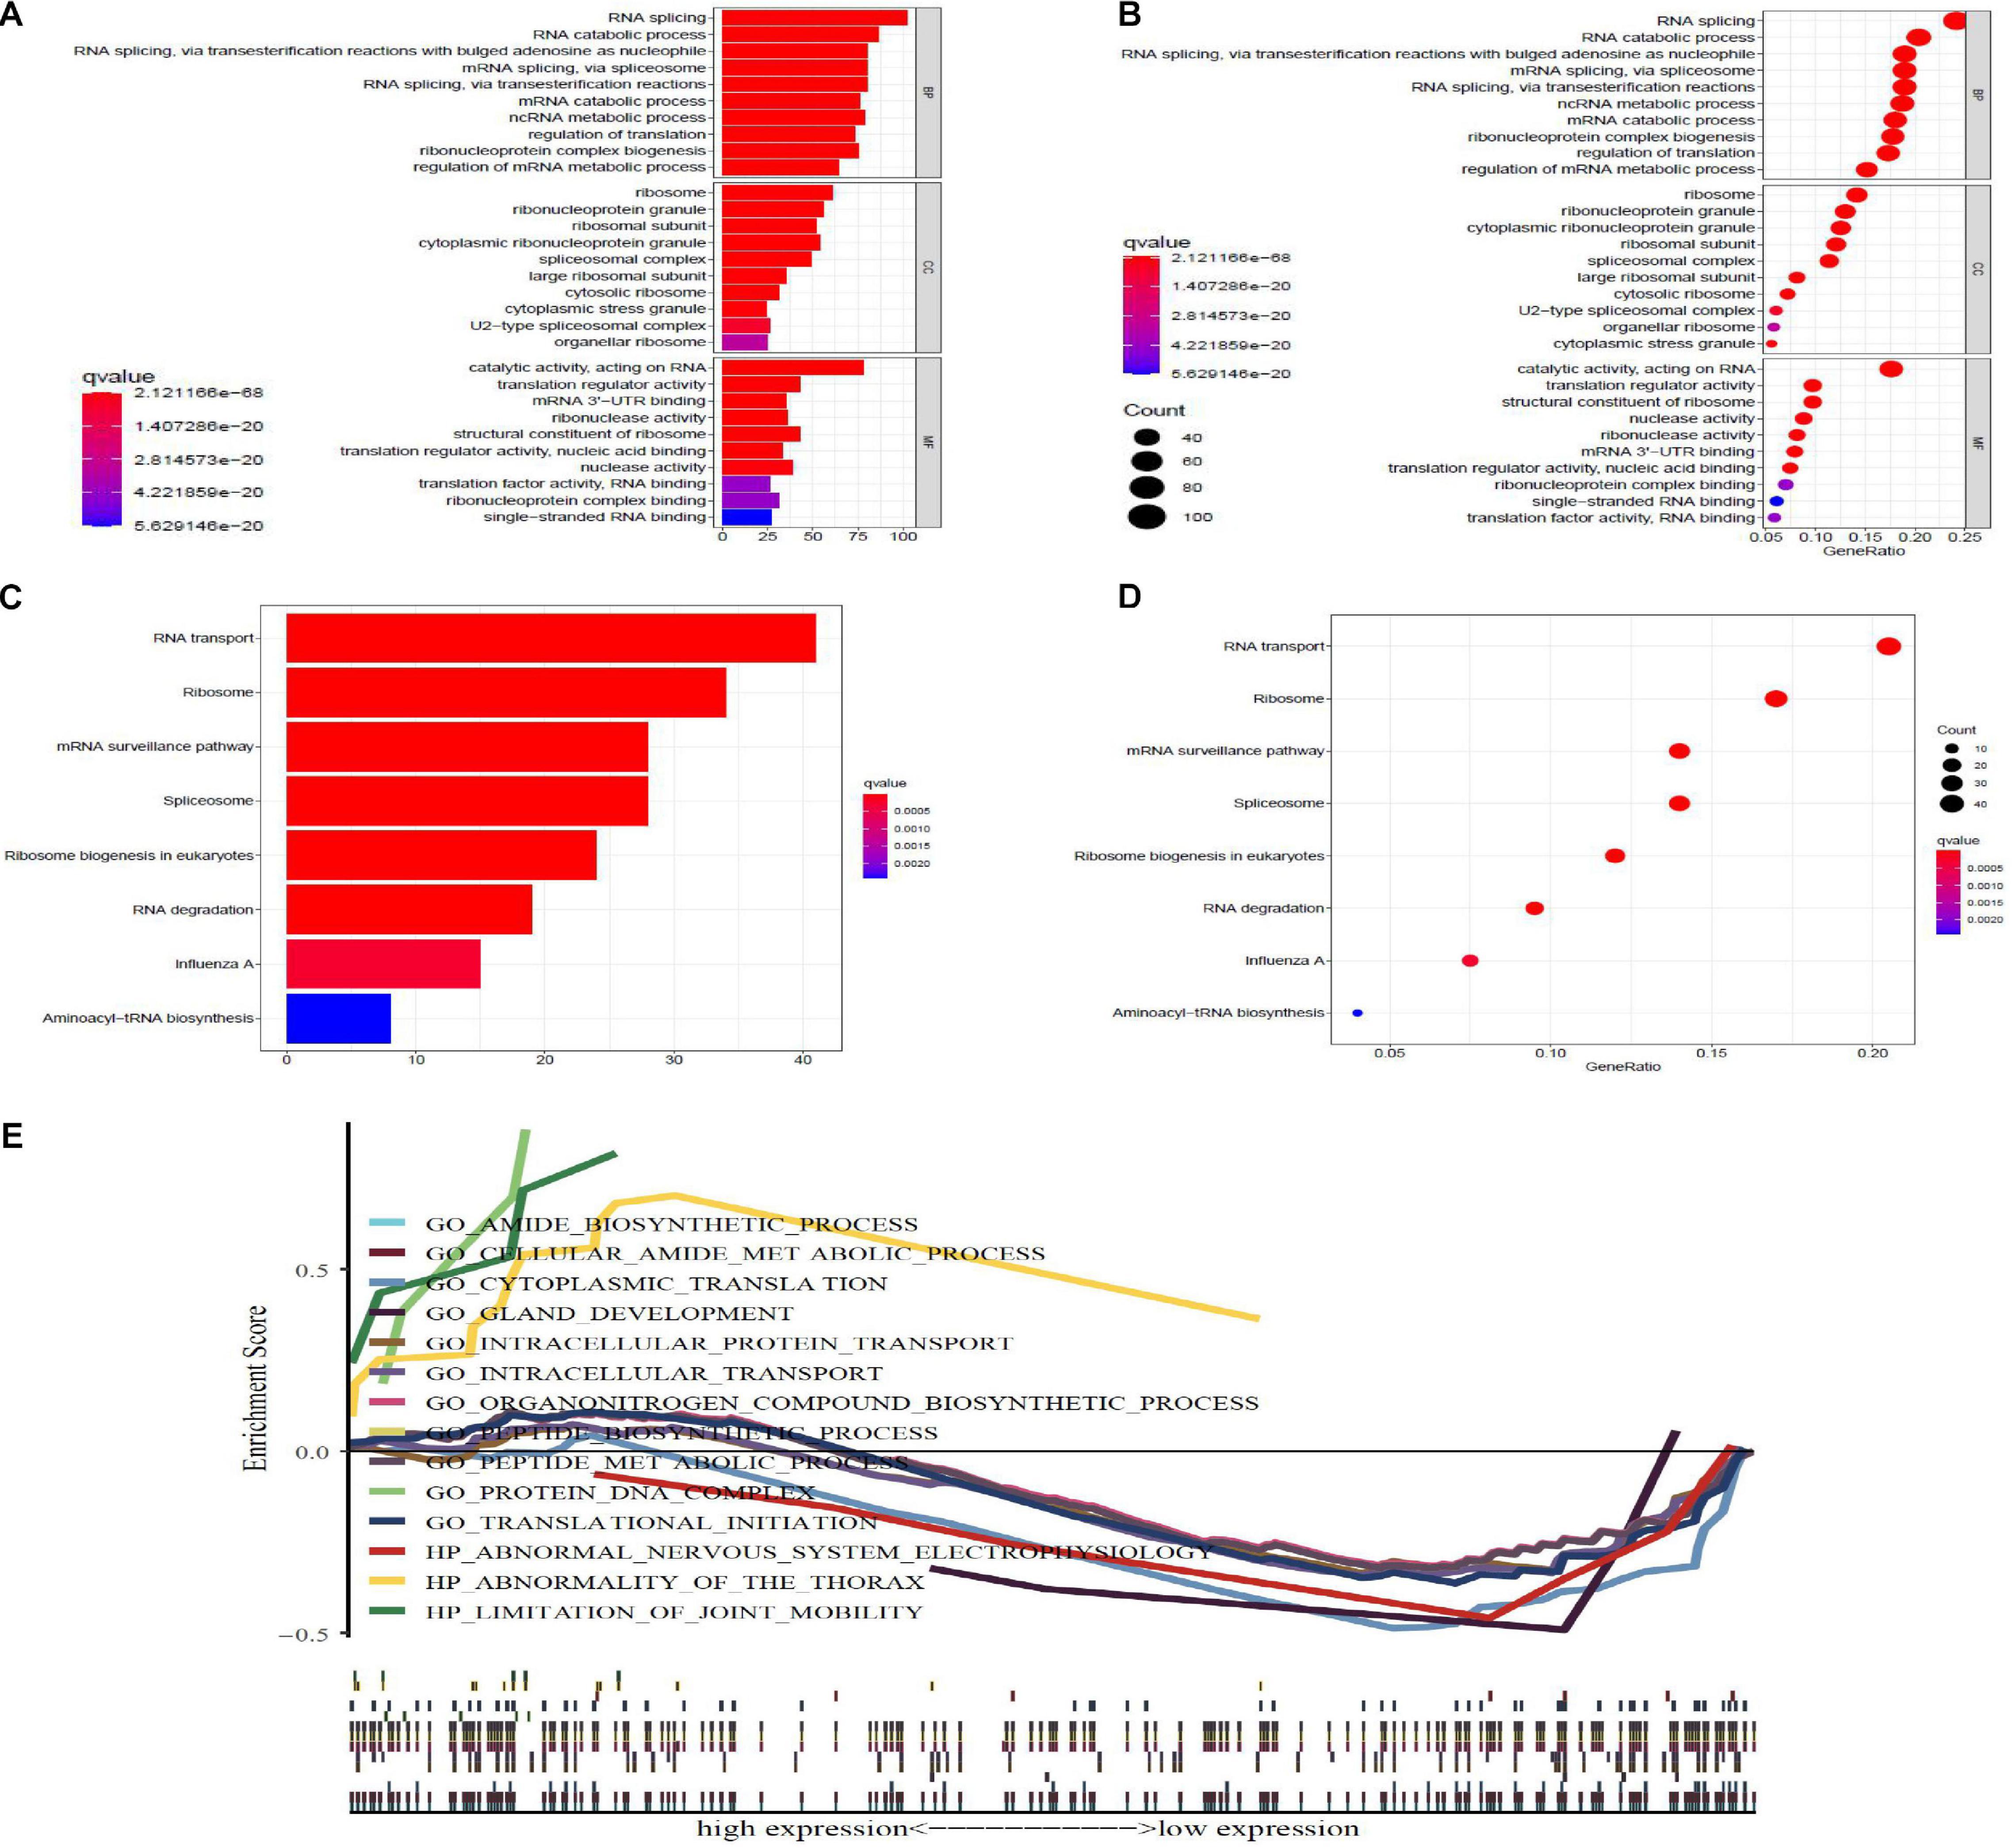
Figure 3. GO, KEGG, and gene set enrichment analysis (GSEA), enrichment analysis of differential expression-RBPs (DE-RBPs) in PAAD. Panels (A,B) are barplot and bubble plot, respectively, of GO functional enrichment analysis; BP, biological process; CC, cellular component; MF, molecular function. Panels (B,D) are barplot and bubble plot, respectively, of KEGG pathway enrichment analysis. P-value < 0.05 and q-value < 0.05 are considered statistically significant. (E) GSEA analysis for DE-RBPs. P-value < 0.05 and normalized enrichment score | NES| > 1 were considered statistically significant.
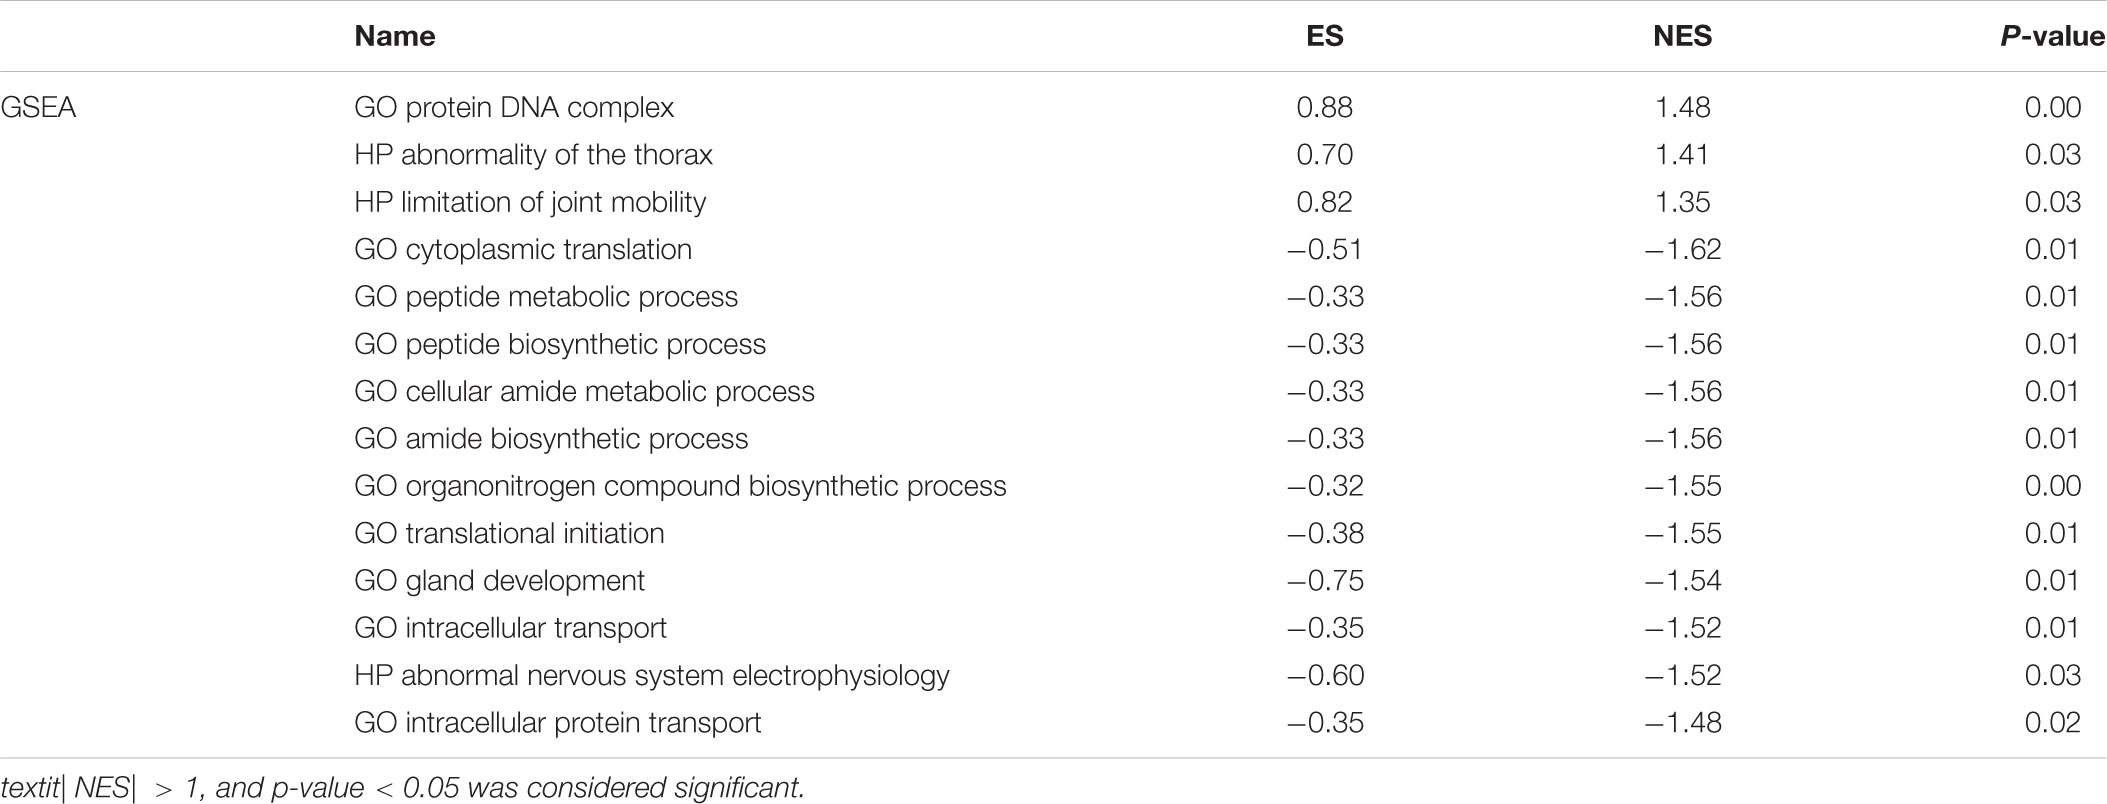
Table 2B Functional enrichment analysis of DE-RBPs in PAAD by gene set enrichment analysis (GSEA).
Protein–Protein Interaction Network and Critical Sub-Network Construction
All DE-RBPs except disconnected nodes were imported in the STRING database to construct the PPI network including 422 PPI nodes and 5,840 edges, which were then visualized with cytoscape in Figure 4A. Then, critical sub-networks were separated out to construct sub-networks by MCODE as shown in Figure 4B.
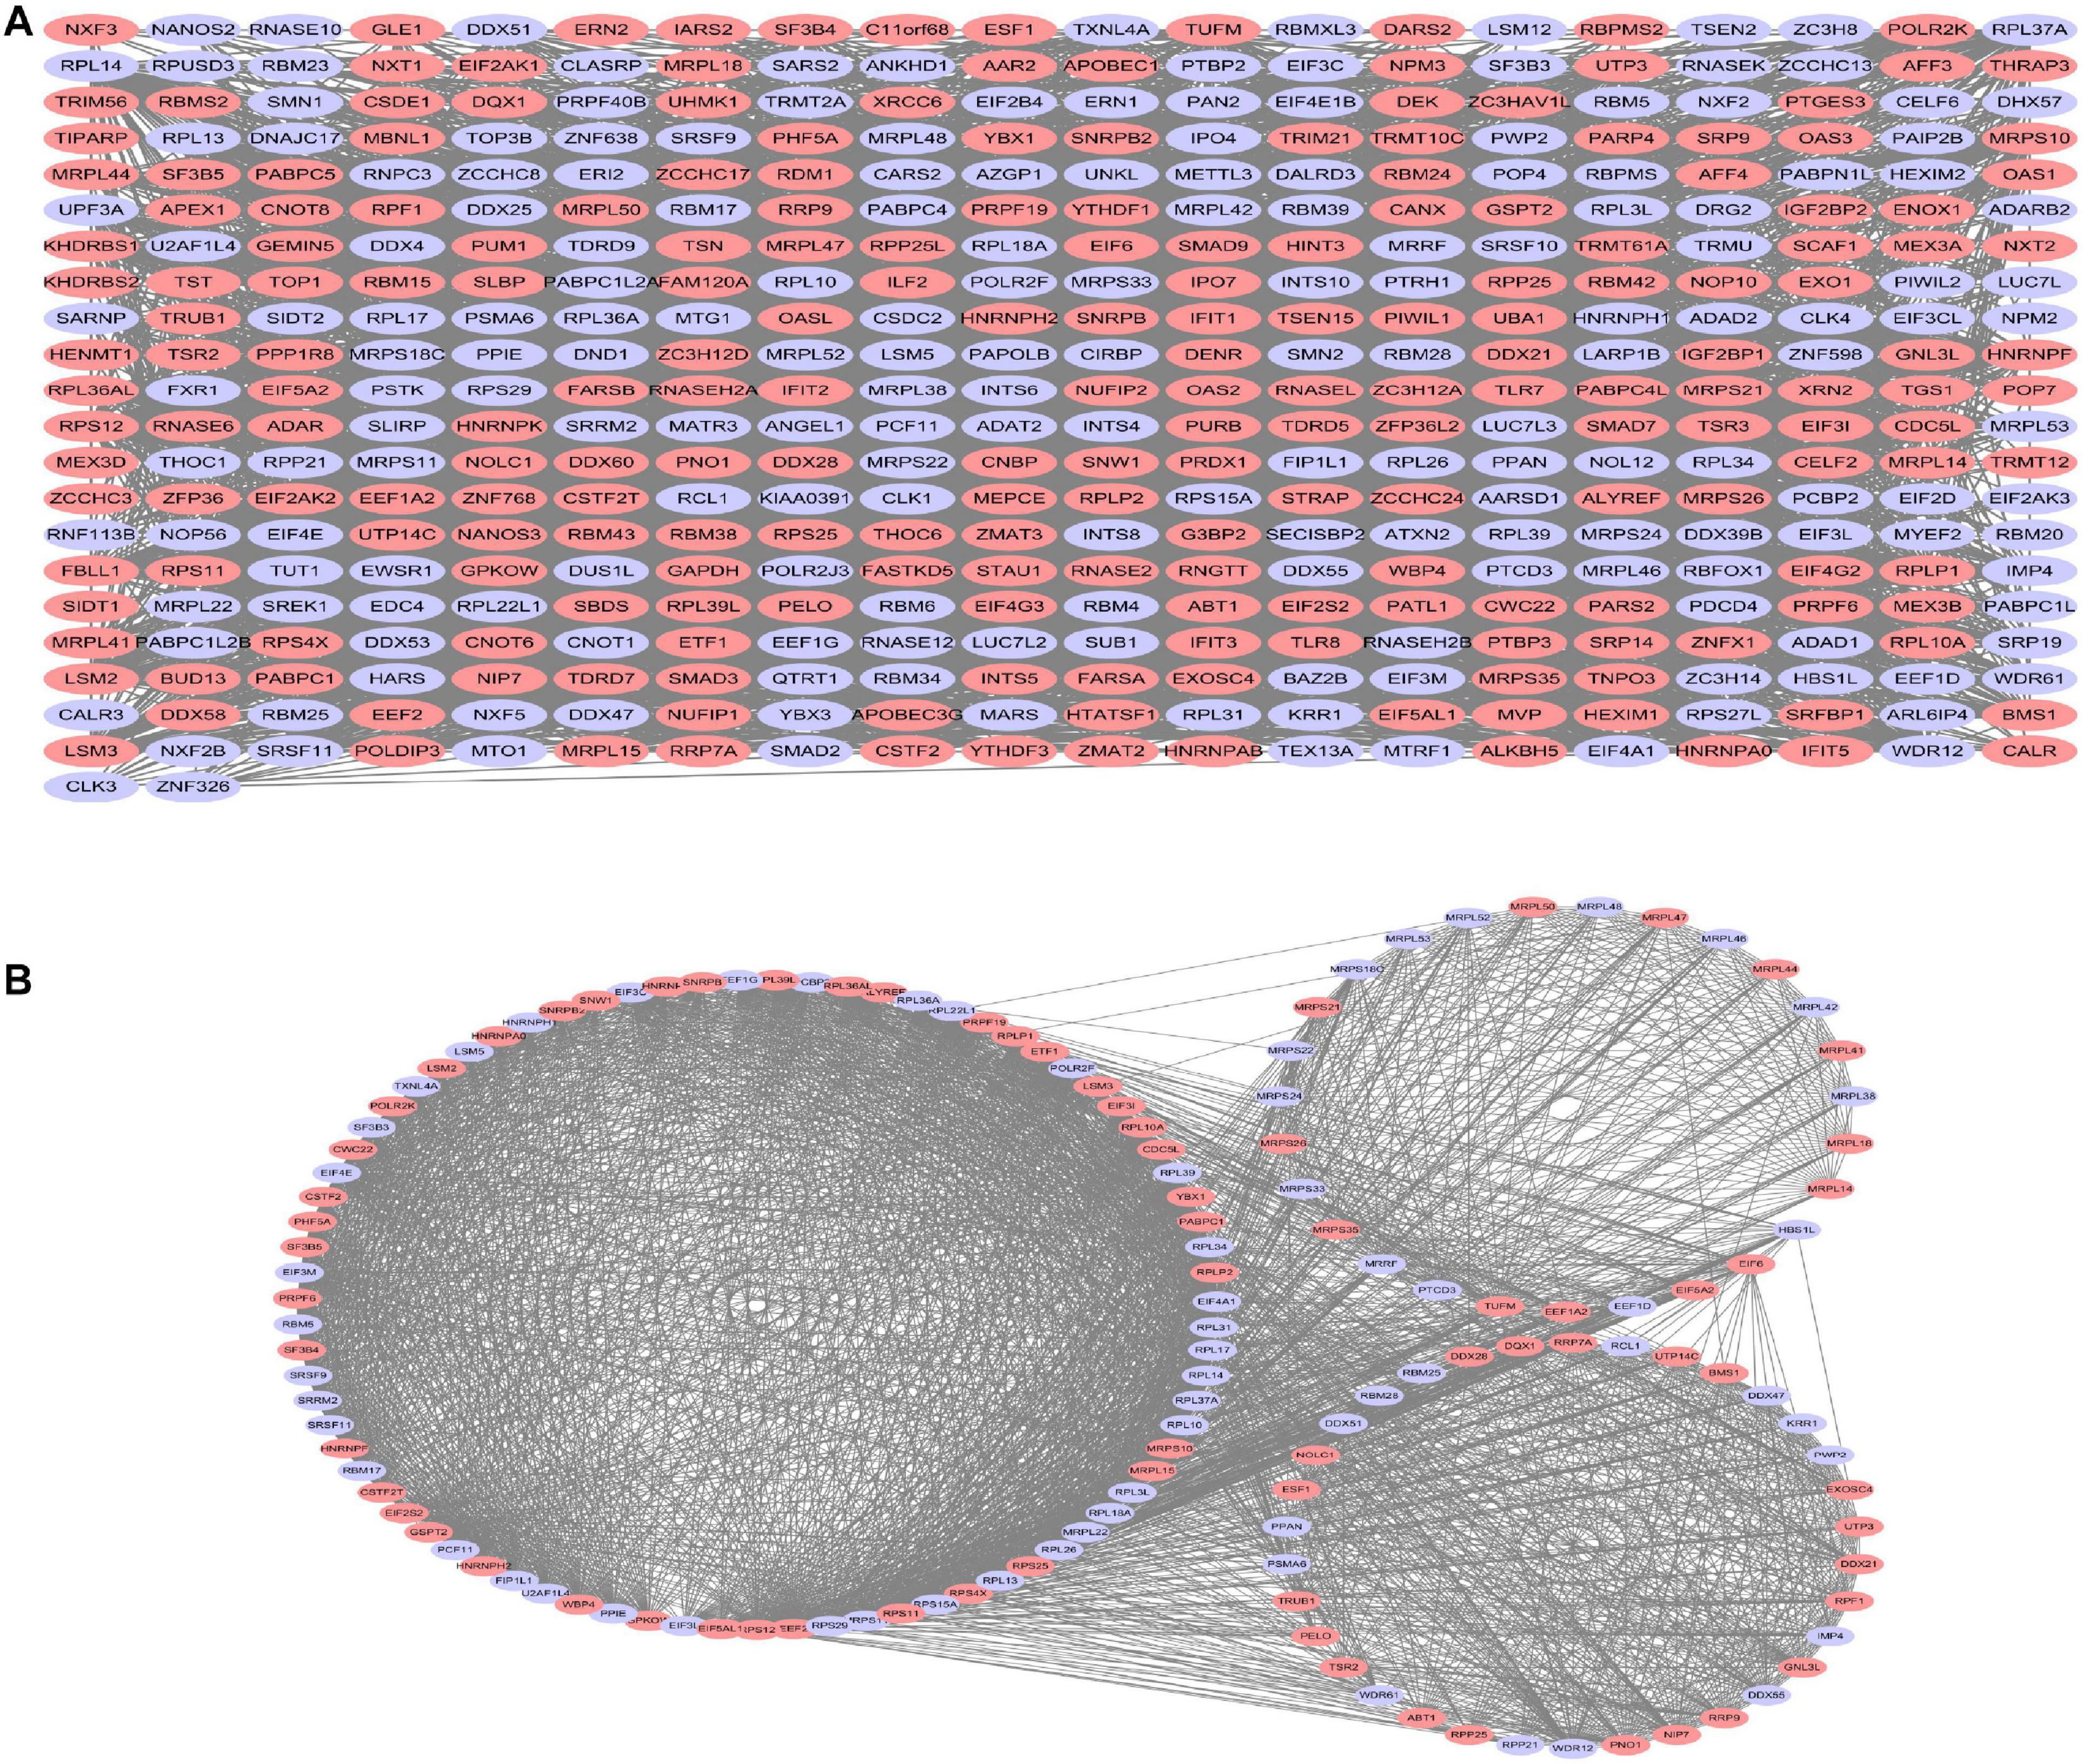
Figure 4. Protein–protein interaction (PPI) network analysis (A) and critical sub-network analysis (B). Lilac ovals, downregulated RBPs; pink ovals, upregulated RBPs.
Prognostic Risk Model in Pancreatic Adenocarcinoma
Twenty eight prognosis-related RBPs (pRBPs) were selected by univariate Cox regression (Figure 5A). It should be noted that patients in TCGA were classified into two cohorts randomly and equally, one cohort for modeling and the other for validating. Multivariate Cox regression was further applied to select pRBPs to construct a prognostic risk model in modeling cohort. These eight pRBPs are shown in Table 3 and Figure 5B. Of the eight pRBPs, three pRBPs (PABPC1, PRPF6, and RBM5) were low risk and five pRBPs (OAS1, LSM12, IPO7, FXR1, and RBM6) were high risk. According to coefficient values of modeling pRBPs and corresponding pRBP expression value, risk scores of PAAD patients in modeling cohort and validation cohort were calculated. The formulation was: risk score = (−1.2467 × ExpPABPC1) + (−1.4246 × ExpPRPF6) + (0.4943 × ExpOAS1) + (−1.9552 × ExpRBM5) + (1.4727 × ExpLSM12) + (1.3216 × ExpIPO7) + (3.0145 × ExpFXR1) + (1.6201 × ExpRBM6). Kaplan–Meier survival curves indicated that higher risk score was especially relevant to poor prognosis (p = 1.196e-06); the validation cohort got the same conclusion (p = 3.747e-03) (Figures 6A,B). ROC curves verified favorable accuracy (AUC value was 0.728 and 0.727, respectively) (Figures 6C,D). Risk curves further confirmed that the higher the risk score, the lower the survival rate, and the worse prognosis (Figure 7). Then we analyzed the effect of risk score on the prognosis of PAAD by univariate and multivariate Cox regression. As shown in Table 4 and Figure 8, high risk score is an independent worse prognostic indicator for PAAD patients either in the modeling cohort or in the validation cohort. We then established a nomogram by assigning to quantize clinical factors of PAAD patients such as age, gender, grader, stage, tumor size, lymph gland involvement, and risk score (Figure 9). Based on multivariate Cox regression analysis and the influence of various clinical characteristics on the prognosis, each value level of each factor was scored. By adding up each score, the total score was obtained, and the total score can evaluate 1-, 3-, and 5-year survival rate, which might assist clinicians in making clinical decisions for PAAD patients.
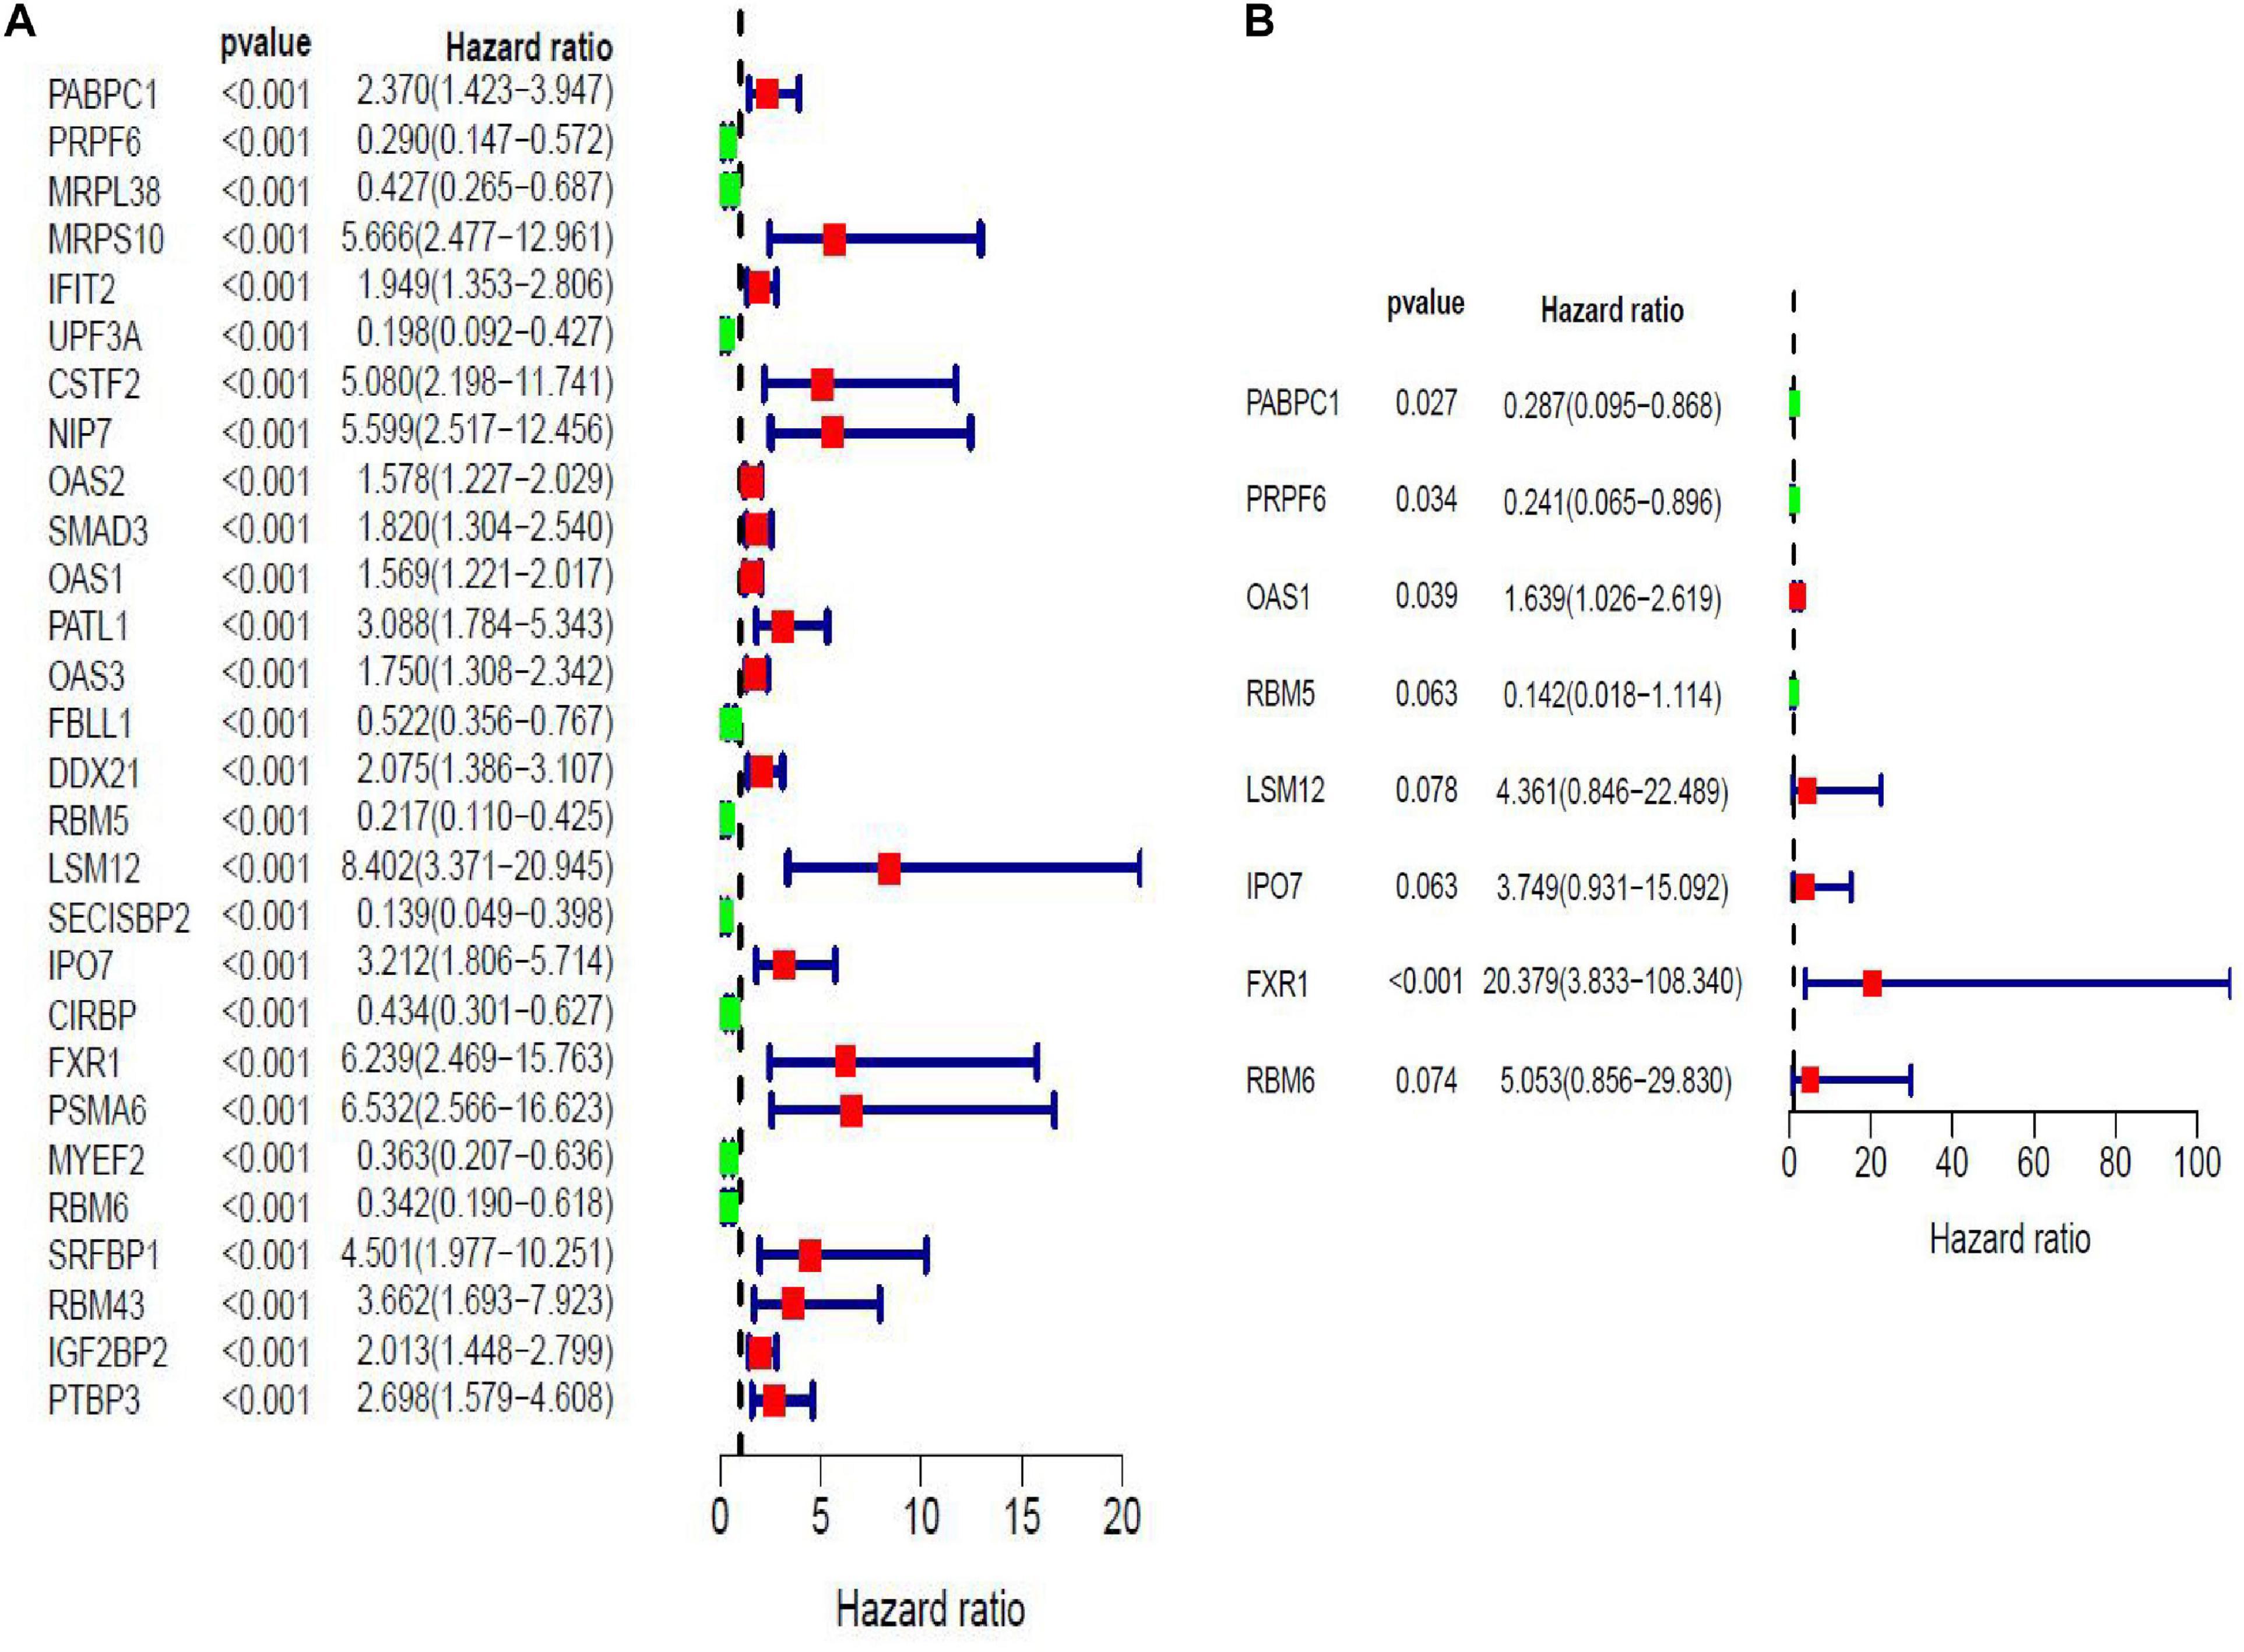
Figure 5. Forest maps of prognosis-related RBPs (pRBPs) in PAAD by univariate (A) and multivariate (B) Cox regression analysis. Green boxes, lower risk RBPs with hazard ratio (HR) < 1; red boxes, higher risk RBPs with HR > 1.
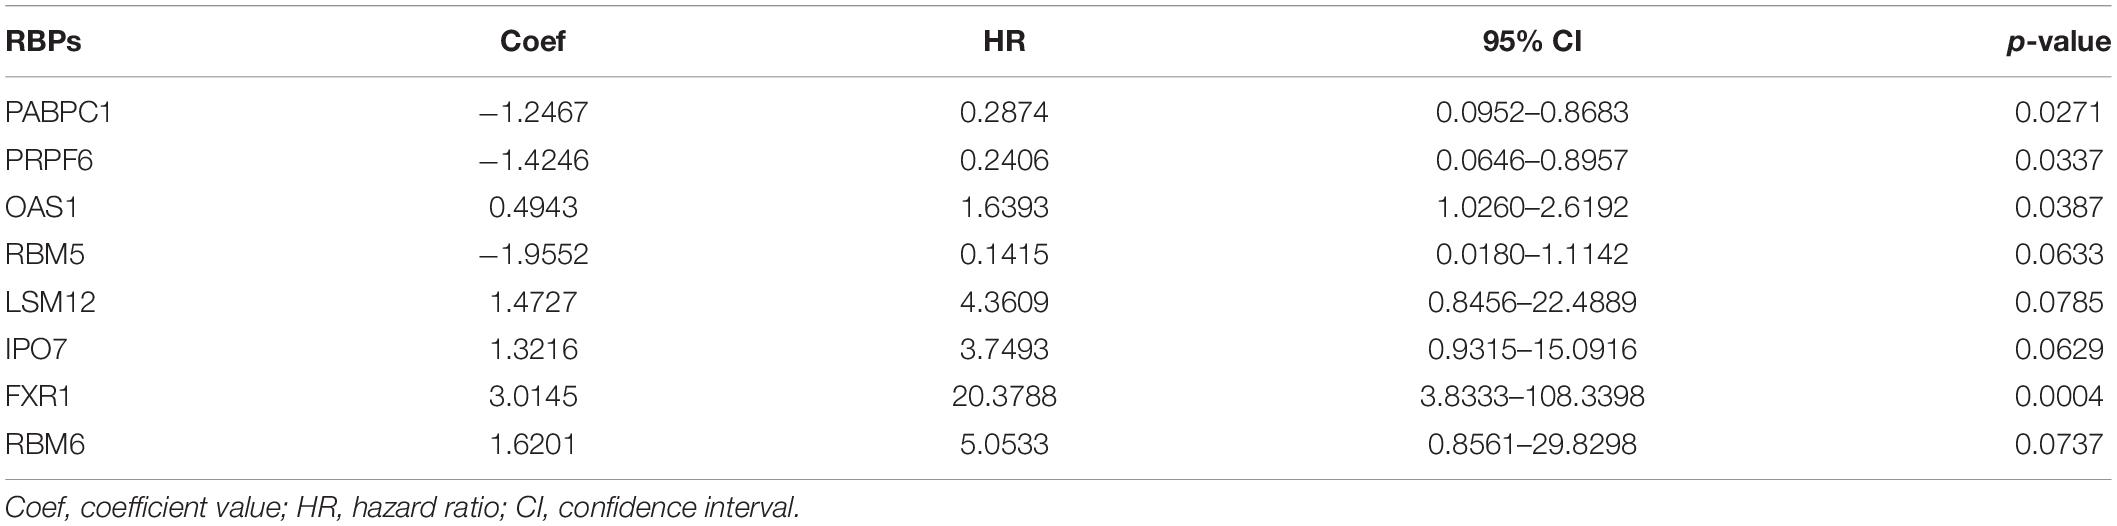
Table 3. RNA-binding proteins (RBPs) selected to construct prognostic risk model by multivariate Cox regression analysis in modeling cohort.
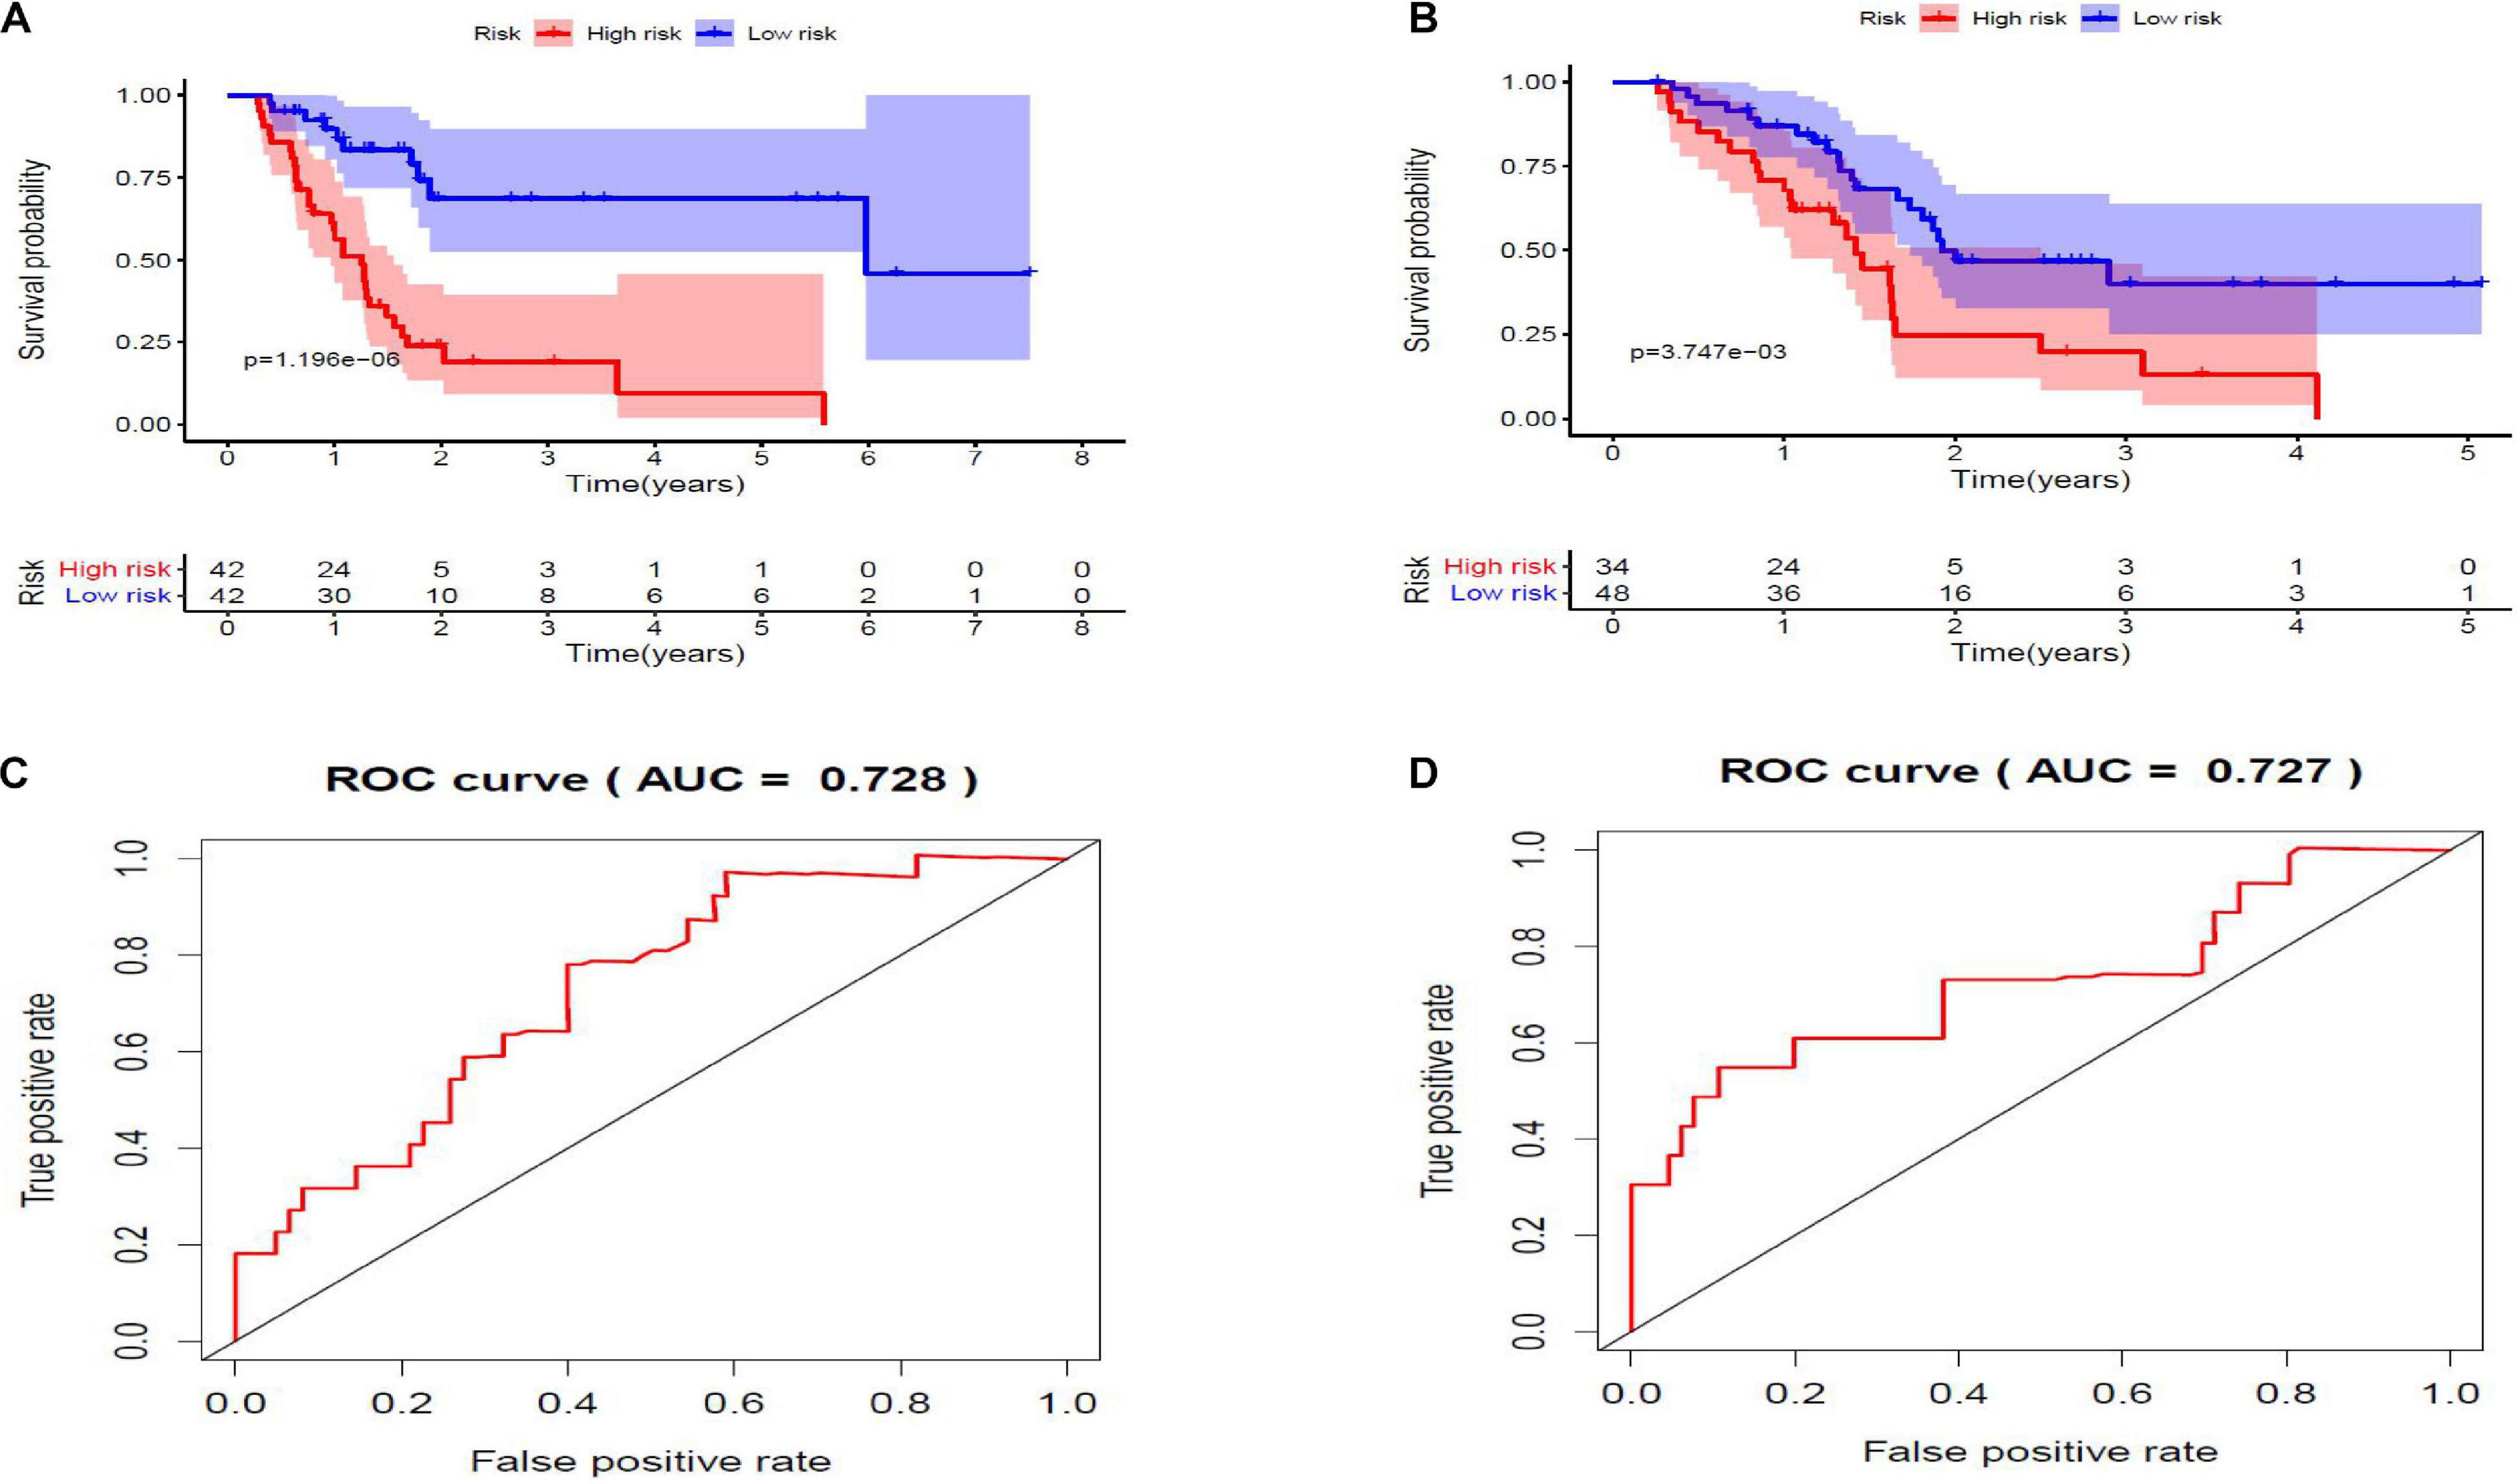
Figure 6. (A,B) Kaplan–Meier survival curves. Low-risk score subgroup and high-risk score subgroup are highlighted by blue curve and red curve, respectively. The cutoff value of risk score is determined by its median value. Panels (A,B) are modeling cohort (p = 1.196e-06) and validation cohort (p = 3.747e-03), respectively. (C,D) Receiver operating characteristic (ROC) curves. X- and Y-axes represent false-positive rate and true-positive rate, respectively. Area under curve (AUC) value of modeling cohort and validation cohort are 0.728 and 0.727, respectively.
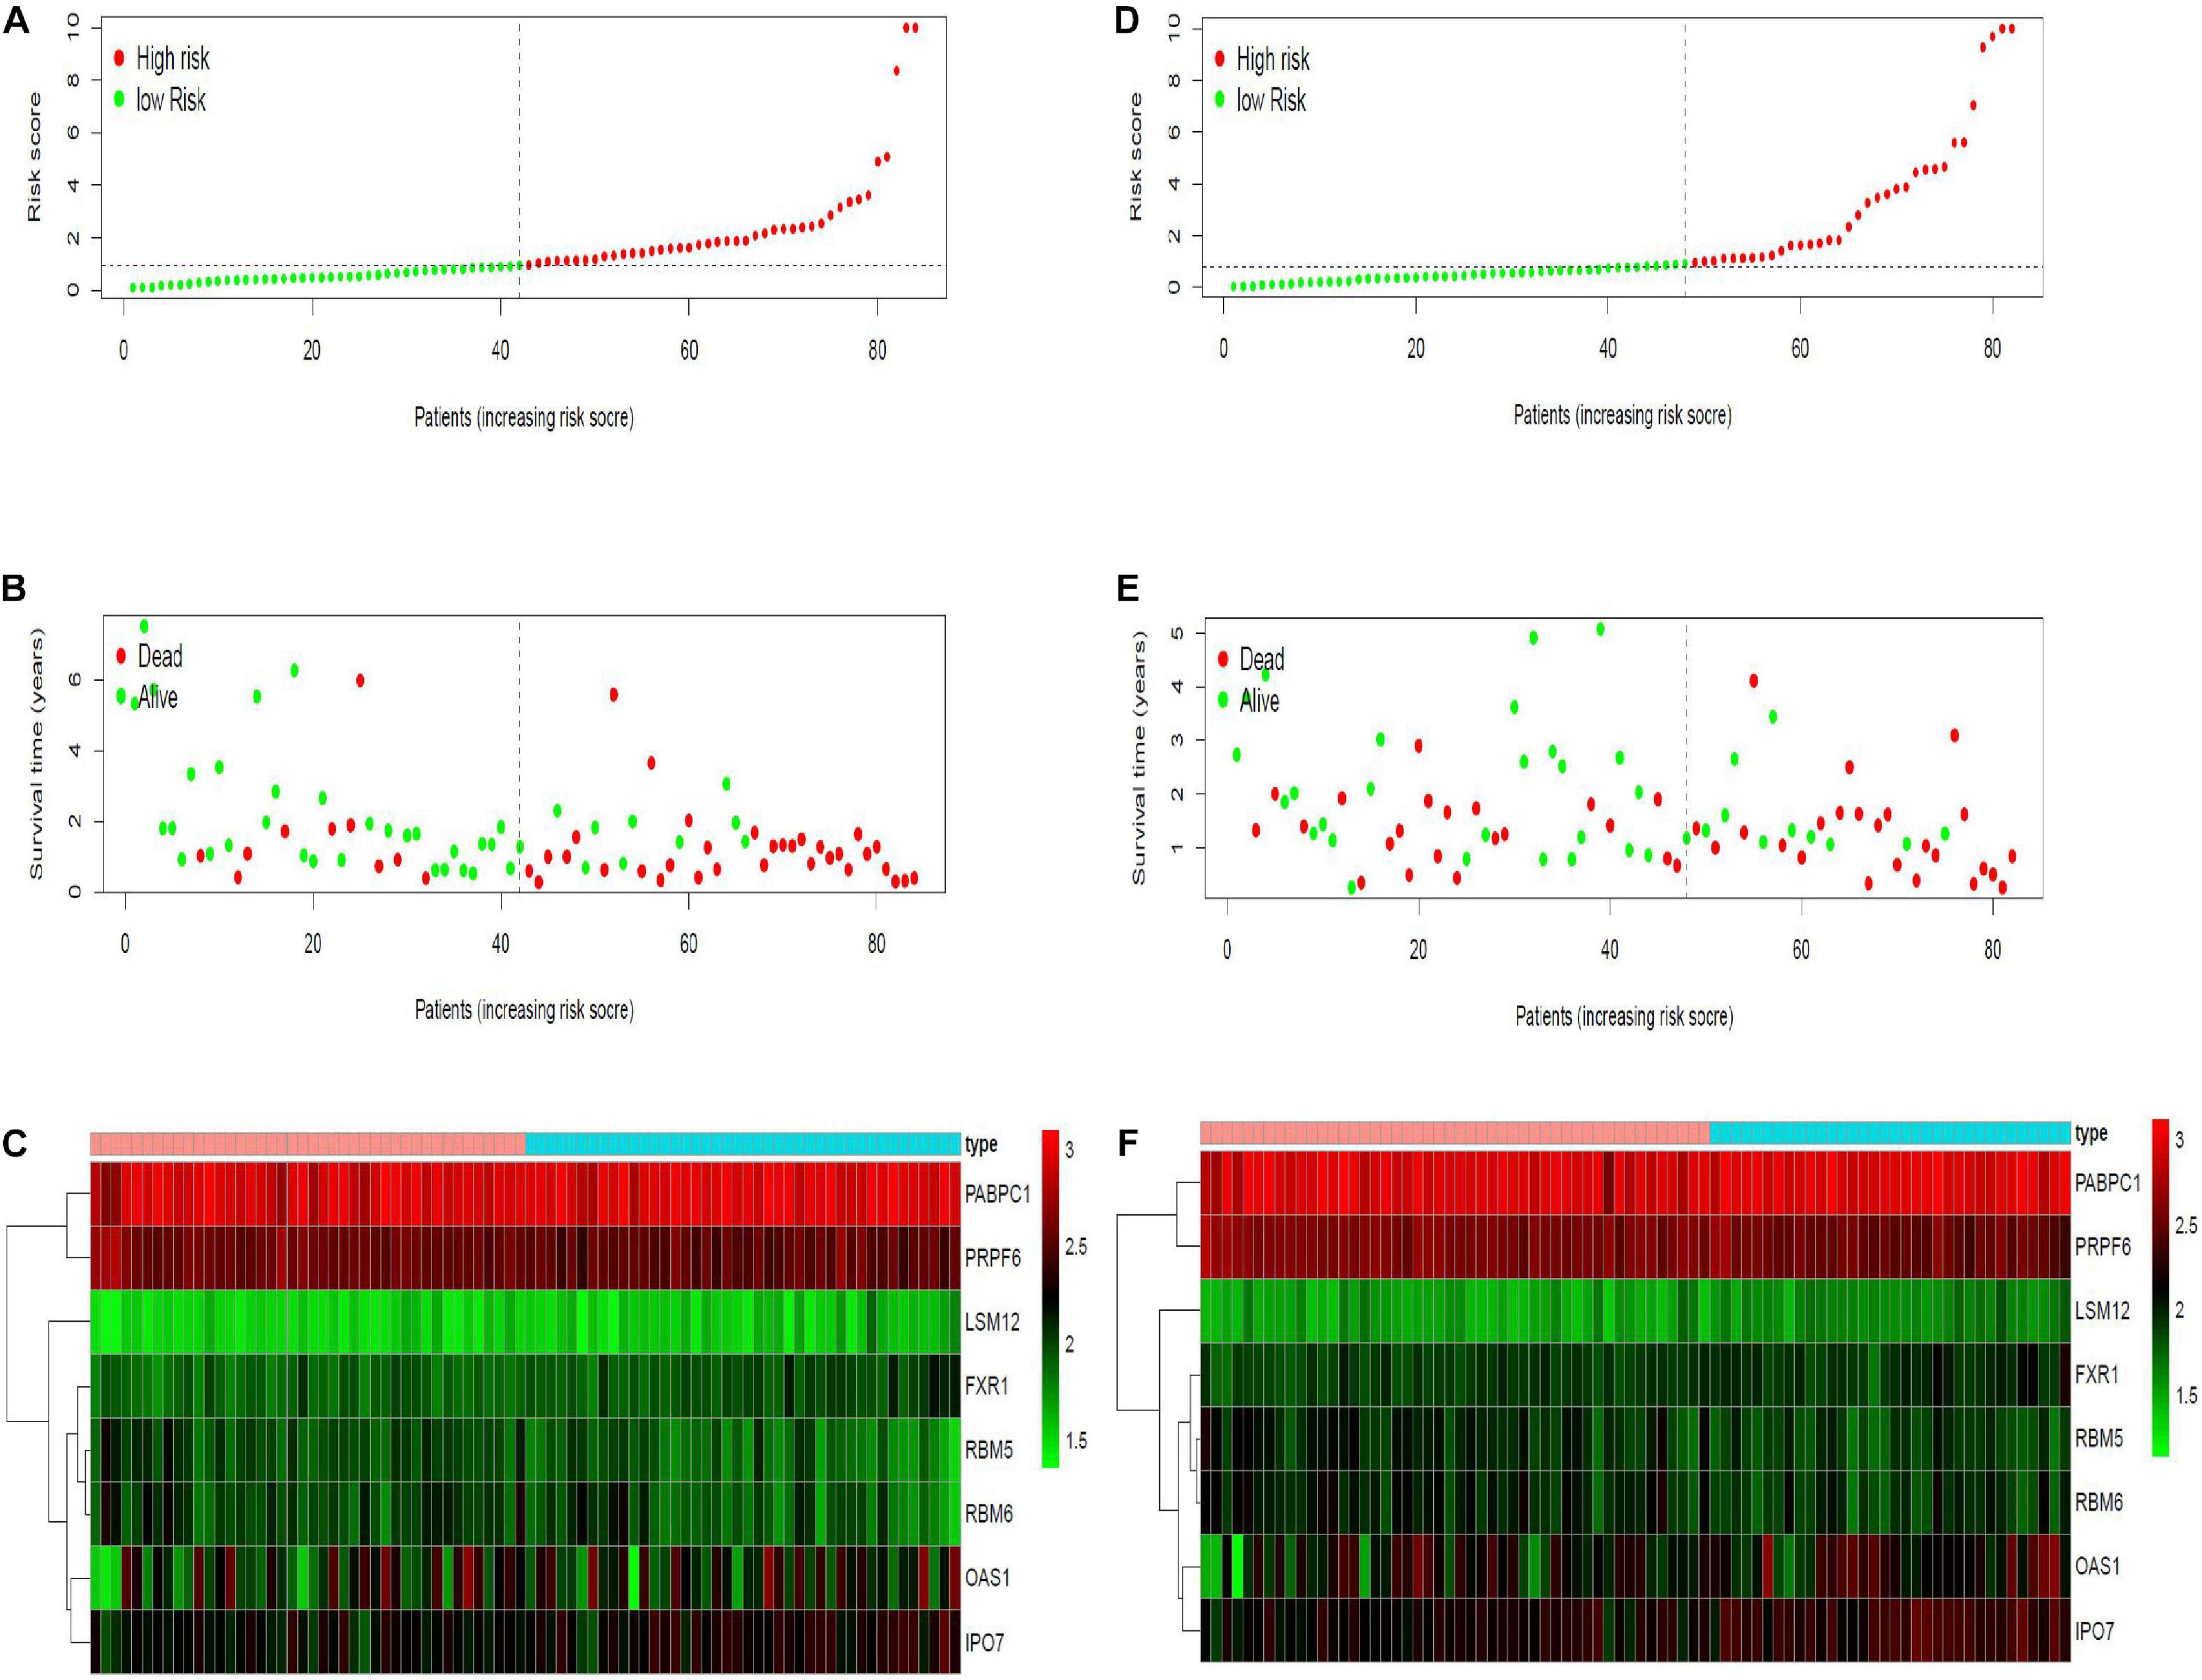
Figure 7. Risk curves in modeling and validation cohort. X- axes of the six figures all represent PAAD samples, arranged in order of increasing risk score. (A,D) Dot plot of risk score. Y-axis represents risk score. Red and green color dots represent, respectively, high- and low-risk score samples. (B,E) Dot plot of survival. Y-axis represents survival times (years). Red and green color dots represent, respectively, dead and living PAAD samples. (C,F) Heat map. Y-axis represents eight modeling RBPs. Higher, medium, and lower expression levels of RBPs are shown in red, black, and green, respectively. Blue and pink bars on top of the heat map indicate low- and high-risk score samples, respectively.
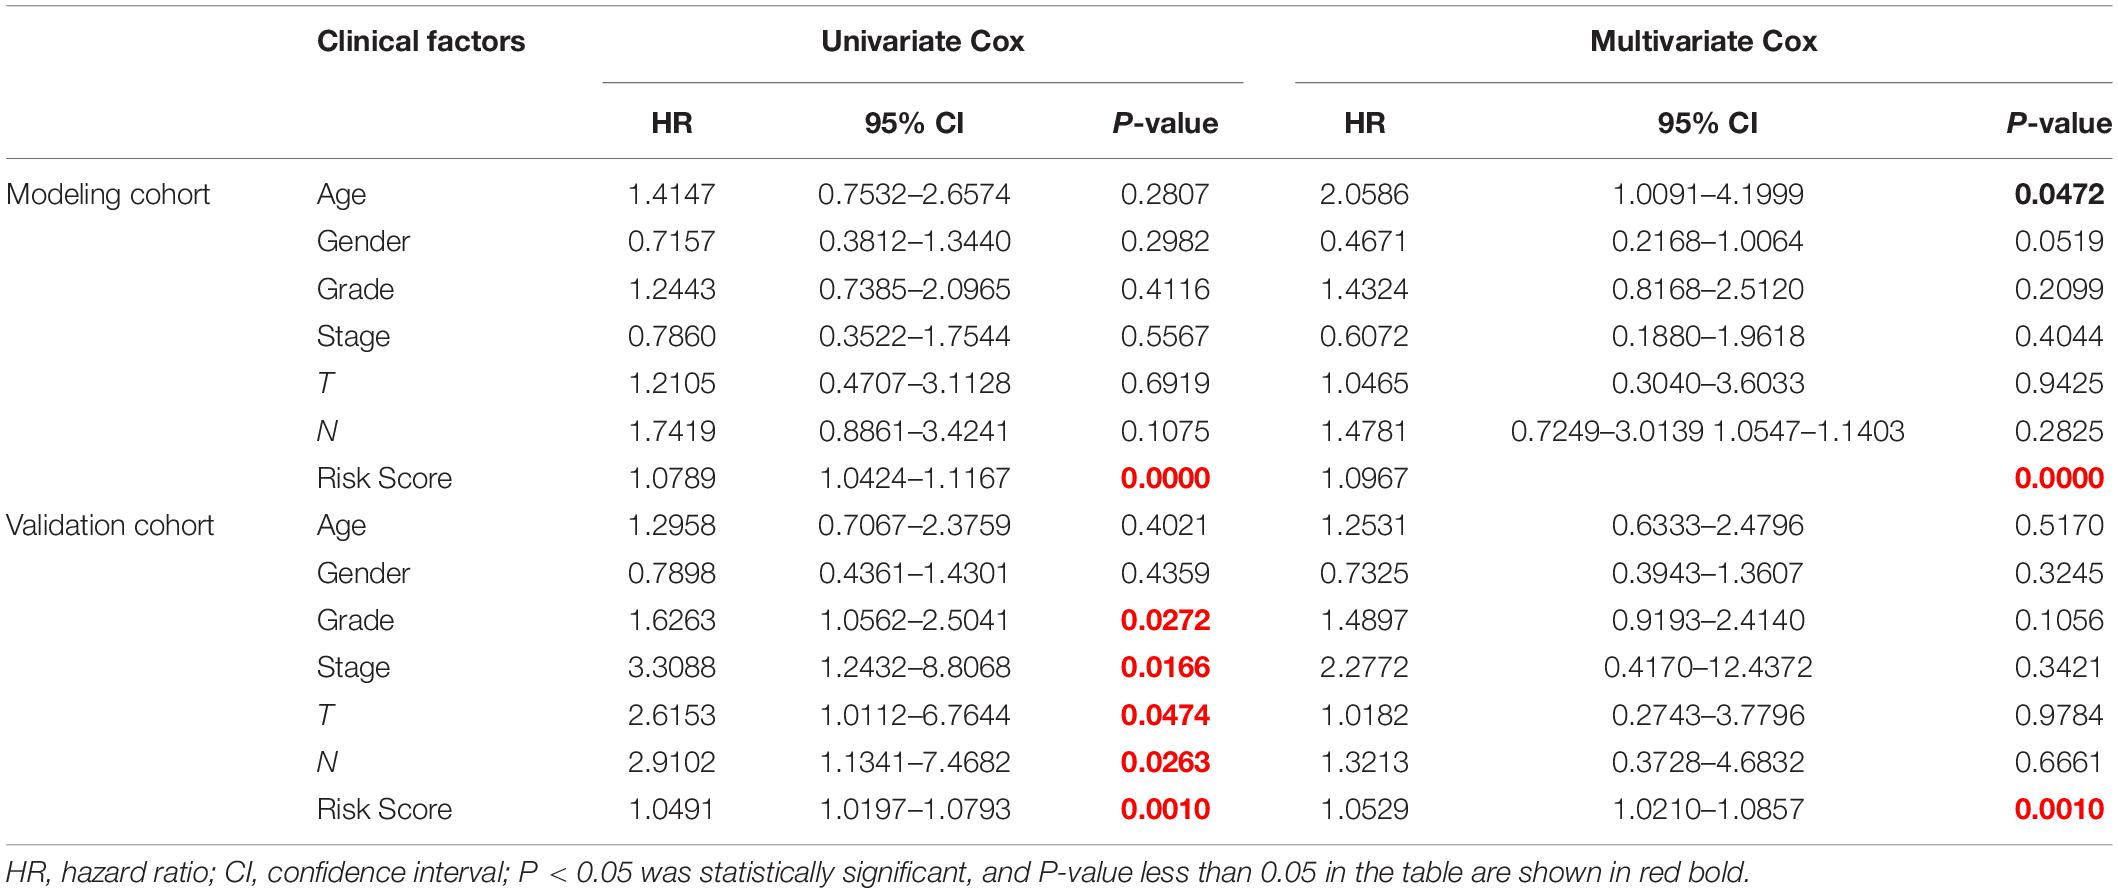
Table 4. Effects of clinical factors and risk score on prognosis of PAAD patients analyzed by univariate and multivariate Cox analysis.
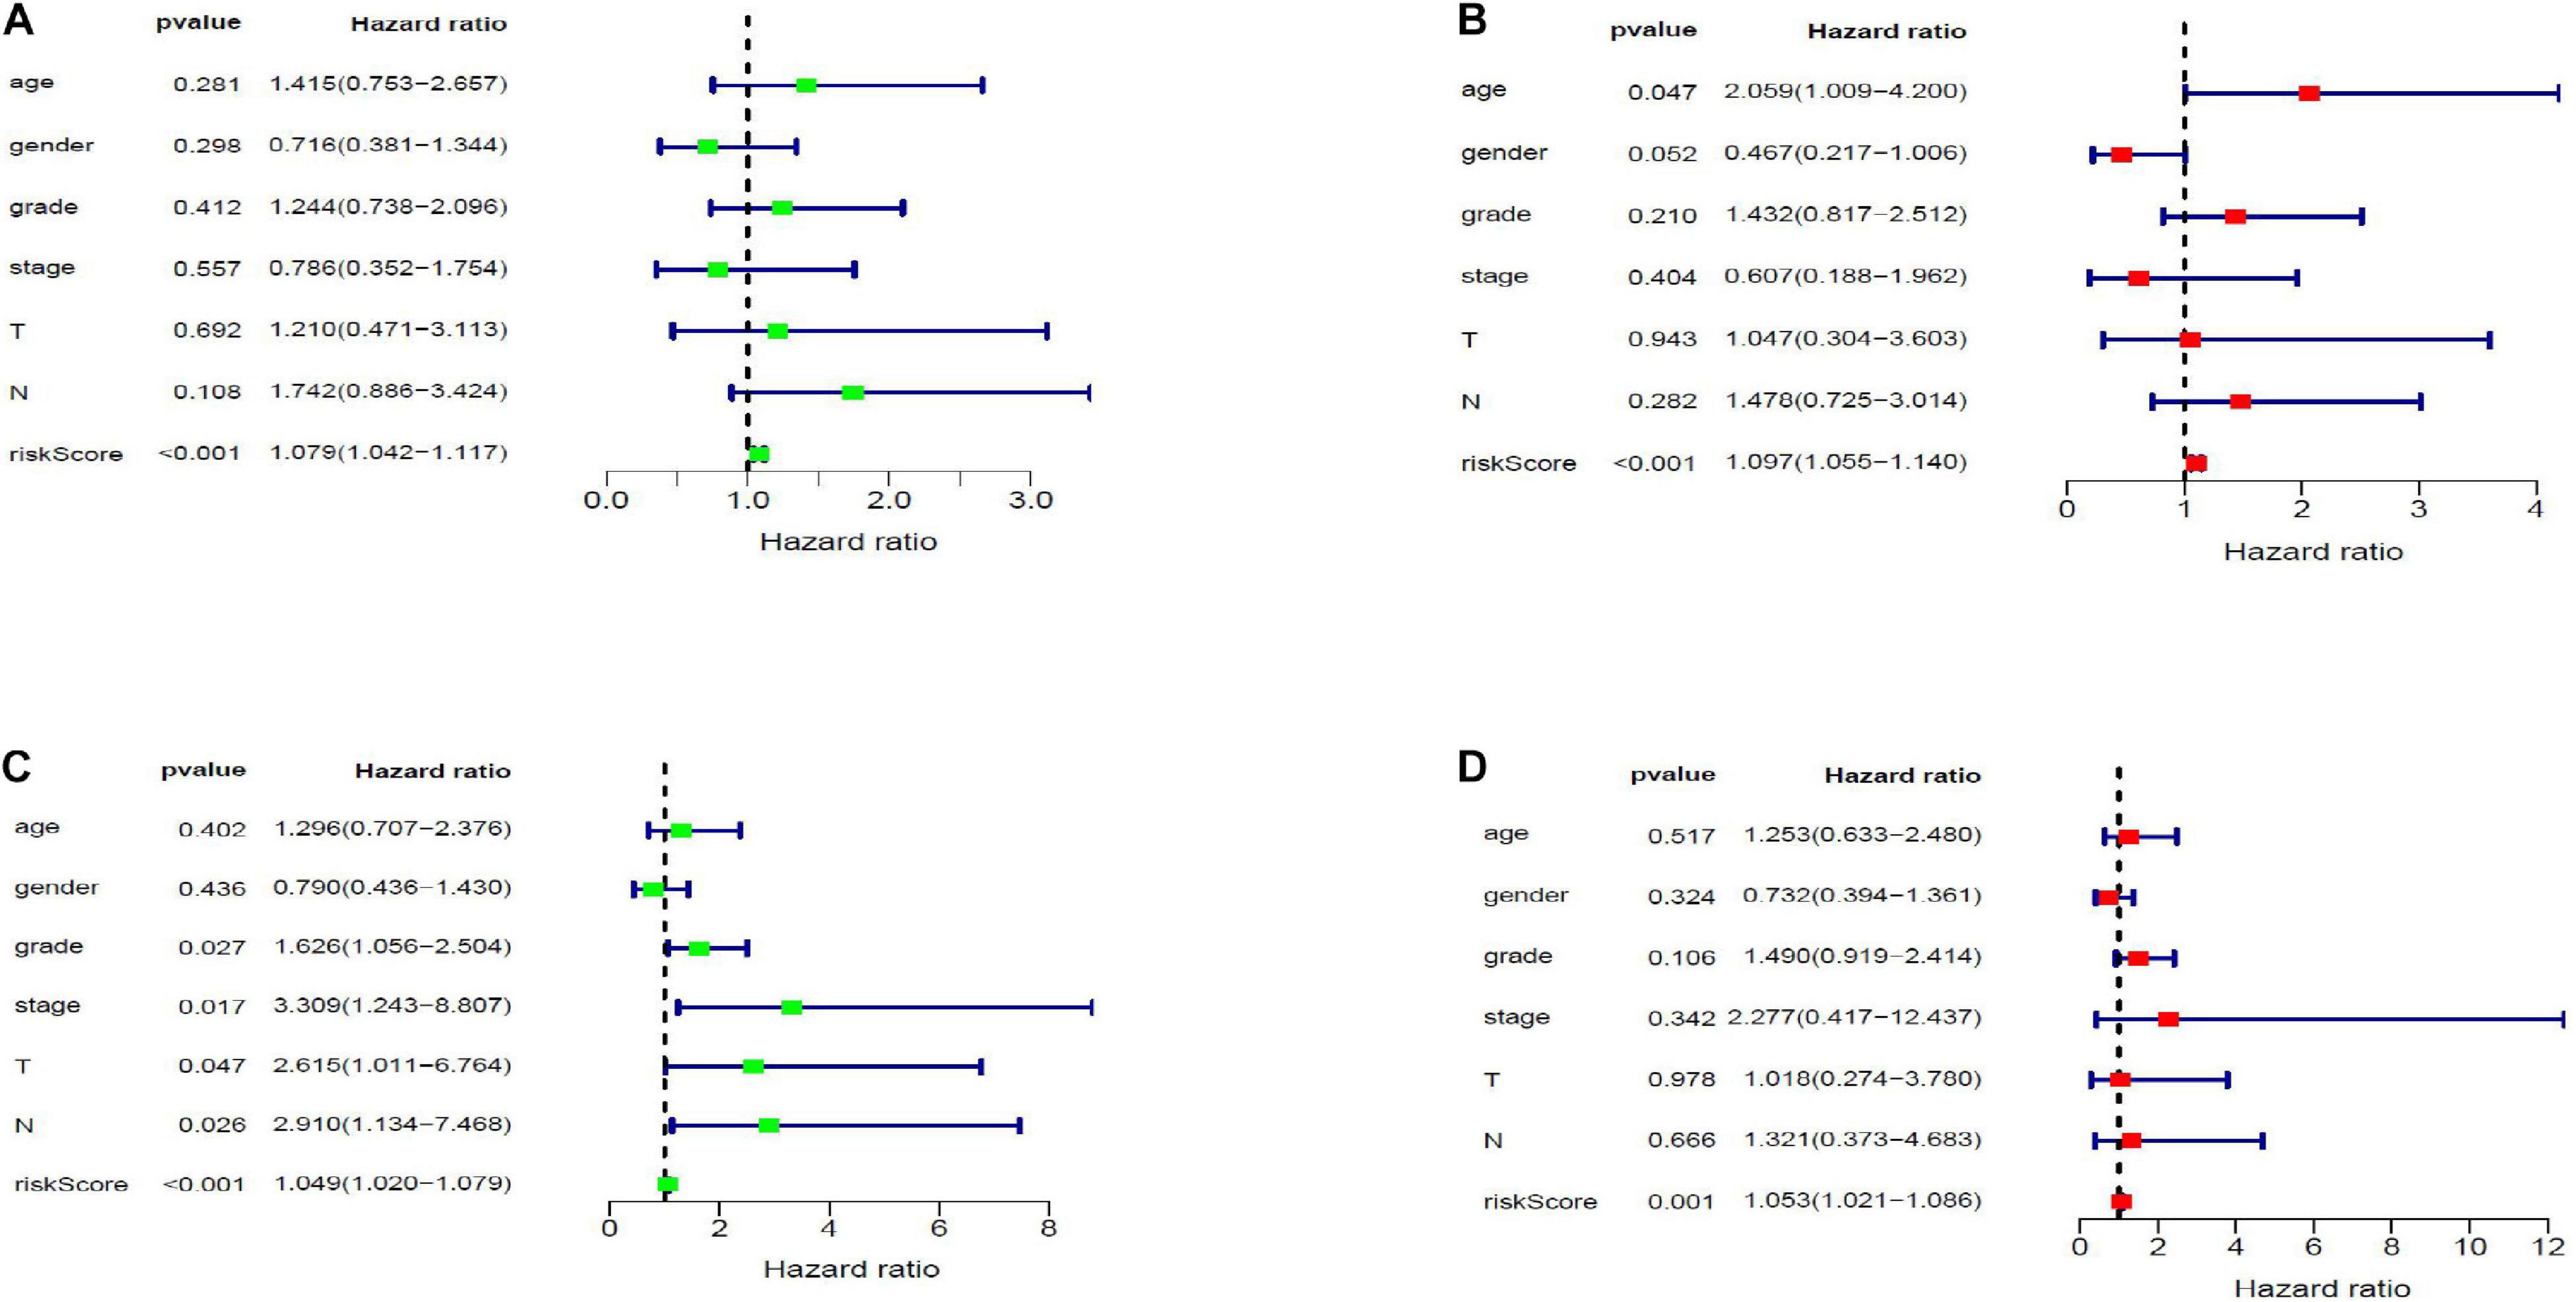
Figure 8. Forest map of the relationship of risk score and clinical characteristics with prognosis in PAAD by univariate (A,C) and multivariate (B,D) Cox analysis. Panels (A,B) and (C,D) are forest maps of modeling and validation cohort, respectively.

Figure 9. Nomogram for predicting 1-, 3-, and 5-year overall survival (OS) of PAAD patients based on modeling cohort.
Expression, Survival Value and Gene Set Enrichment Analysis of 8 Modeling RNA-Binding Proteins
We further analyzed the expression differences of eight modeling RBPs between normal and cancer cases from RNA and protein expression level. The results are shown in Figure 10. Of the eight modeling RBPs, half were upregulated including PABPC1, PRPF6, OAS1, IPO7, and half were downregulated including RBM5, RBM6, LSM12, and FXR7 in cancer cases. Results of immunohistochemical staining are in accordance with RNA expression level. KM survival curves are shown in Figure 10. All of the 8 modeling RBPs were associated with overall survival in PAAD. Higher expression levels of PABPC1, OAS1, LSM12, IPO7, and FXR1 predicted poor prognosis, and adversely, higher expression levels of PRPF6, RBM5, and RBM6 predicted favorable prognosis. To gain insight into the molecular mechanisms in which these RBPS may be involved, we performed GSEA for these modeling RBPs (Figure 11 and Supplementary Table 1). In Supplementary Table 1, we listed all significant pathways and separated the top 5 in sheet 2. According to NES of GSEA, signaling pathways that were enriched in highly expressed phenotypes in PABPC were thyroid cancer, adherens junction, dorso ventral axis formation, small cell lung cancer, and basal transcription factors; signaling pathways that were enriched in highly expressed phenotypes in PRPF6 were ribosome, spliceosome, nucleotide excision repair, RNA polymerase, Huntington’s disease, etc.; signaling pathways that were enriched in low expressed phenotypes in PRPF6 were cytokine–cytokine receptor interaction, cell adhesion molecule cams, leishmania infection, Toll-like receptor signaling pathway, FC gamma R-mediated phagocytosis, etc.; signaling pathways that were enriched in highly expressed phenotypes in OAS1 were rig I-like receptor signaling pathway, base excision repair, proteasome, and cytosolic DNA-sensing pathway; signaling pathways that were enriched in low expressed phenotypes in RBM5 were amino sugar, and nucleotide sugar metabolism, mismatch repair, pyrimidine metabolism, proteasome, N-glycan biosynthesis, etc.; signaling pathways that were enriched in low expressed phenotypes in RBM6 were sphingolipid metabolism, citrate cycle (TCA cycle), O-glycan biosynthesis, amino sugar and nucleotide sugar metabolism, N-glycan biosynthesis, etc.; signaling pathways that were enriched in highly expressed phenotypes in LSM12 were cell cycle, mismatch repair, nucleotide excision repair, one carbon pool by folate, basal transcription factors, etc.; signaling pathways that were enriched in highly expressed phenotypes in IPO7 were dorso-ventral axis formation, adherence junction, endometrial cancer, ERBB signaling pathway, prostate cancer, etc.; signaling pathways that were enriched in highly expressed phenotypes in FXR1 were ubiquitin-mediated proteolysis, basal transcription factors, small cell lung cancer, renal cell carcinoma, glioma, etc.; signaling pathways that were enriched in low expressed phenotypes in FXR1 were linoleic acid metabolism, arachidonic acid metabolism, alpha linolenic acid metabolism, retinol metabolism, Parkinson’s disease, etc.
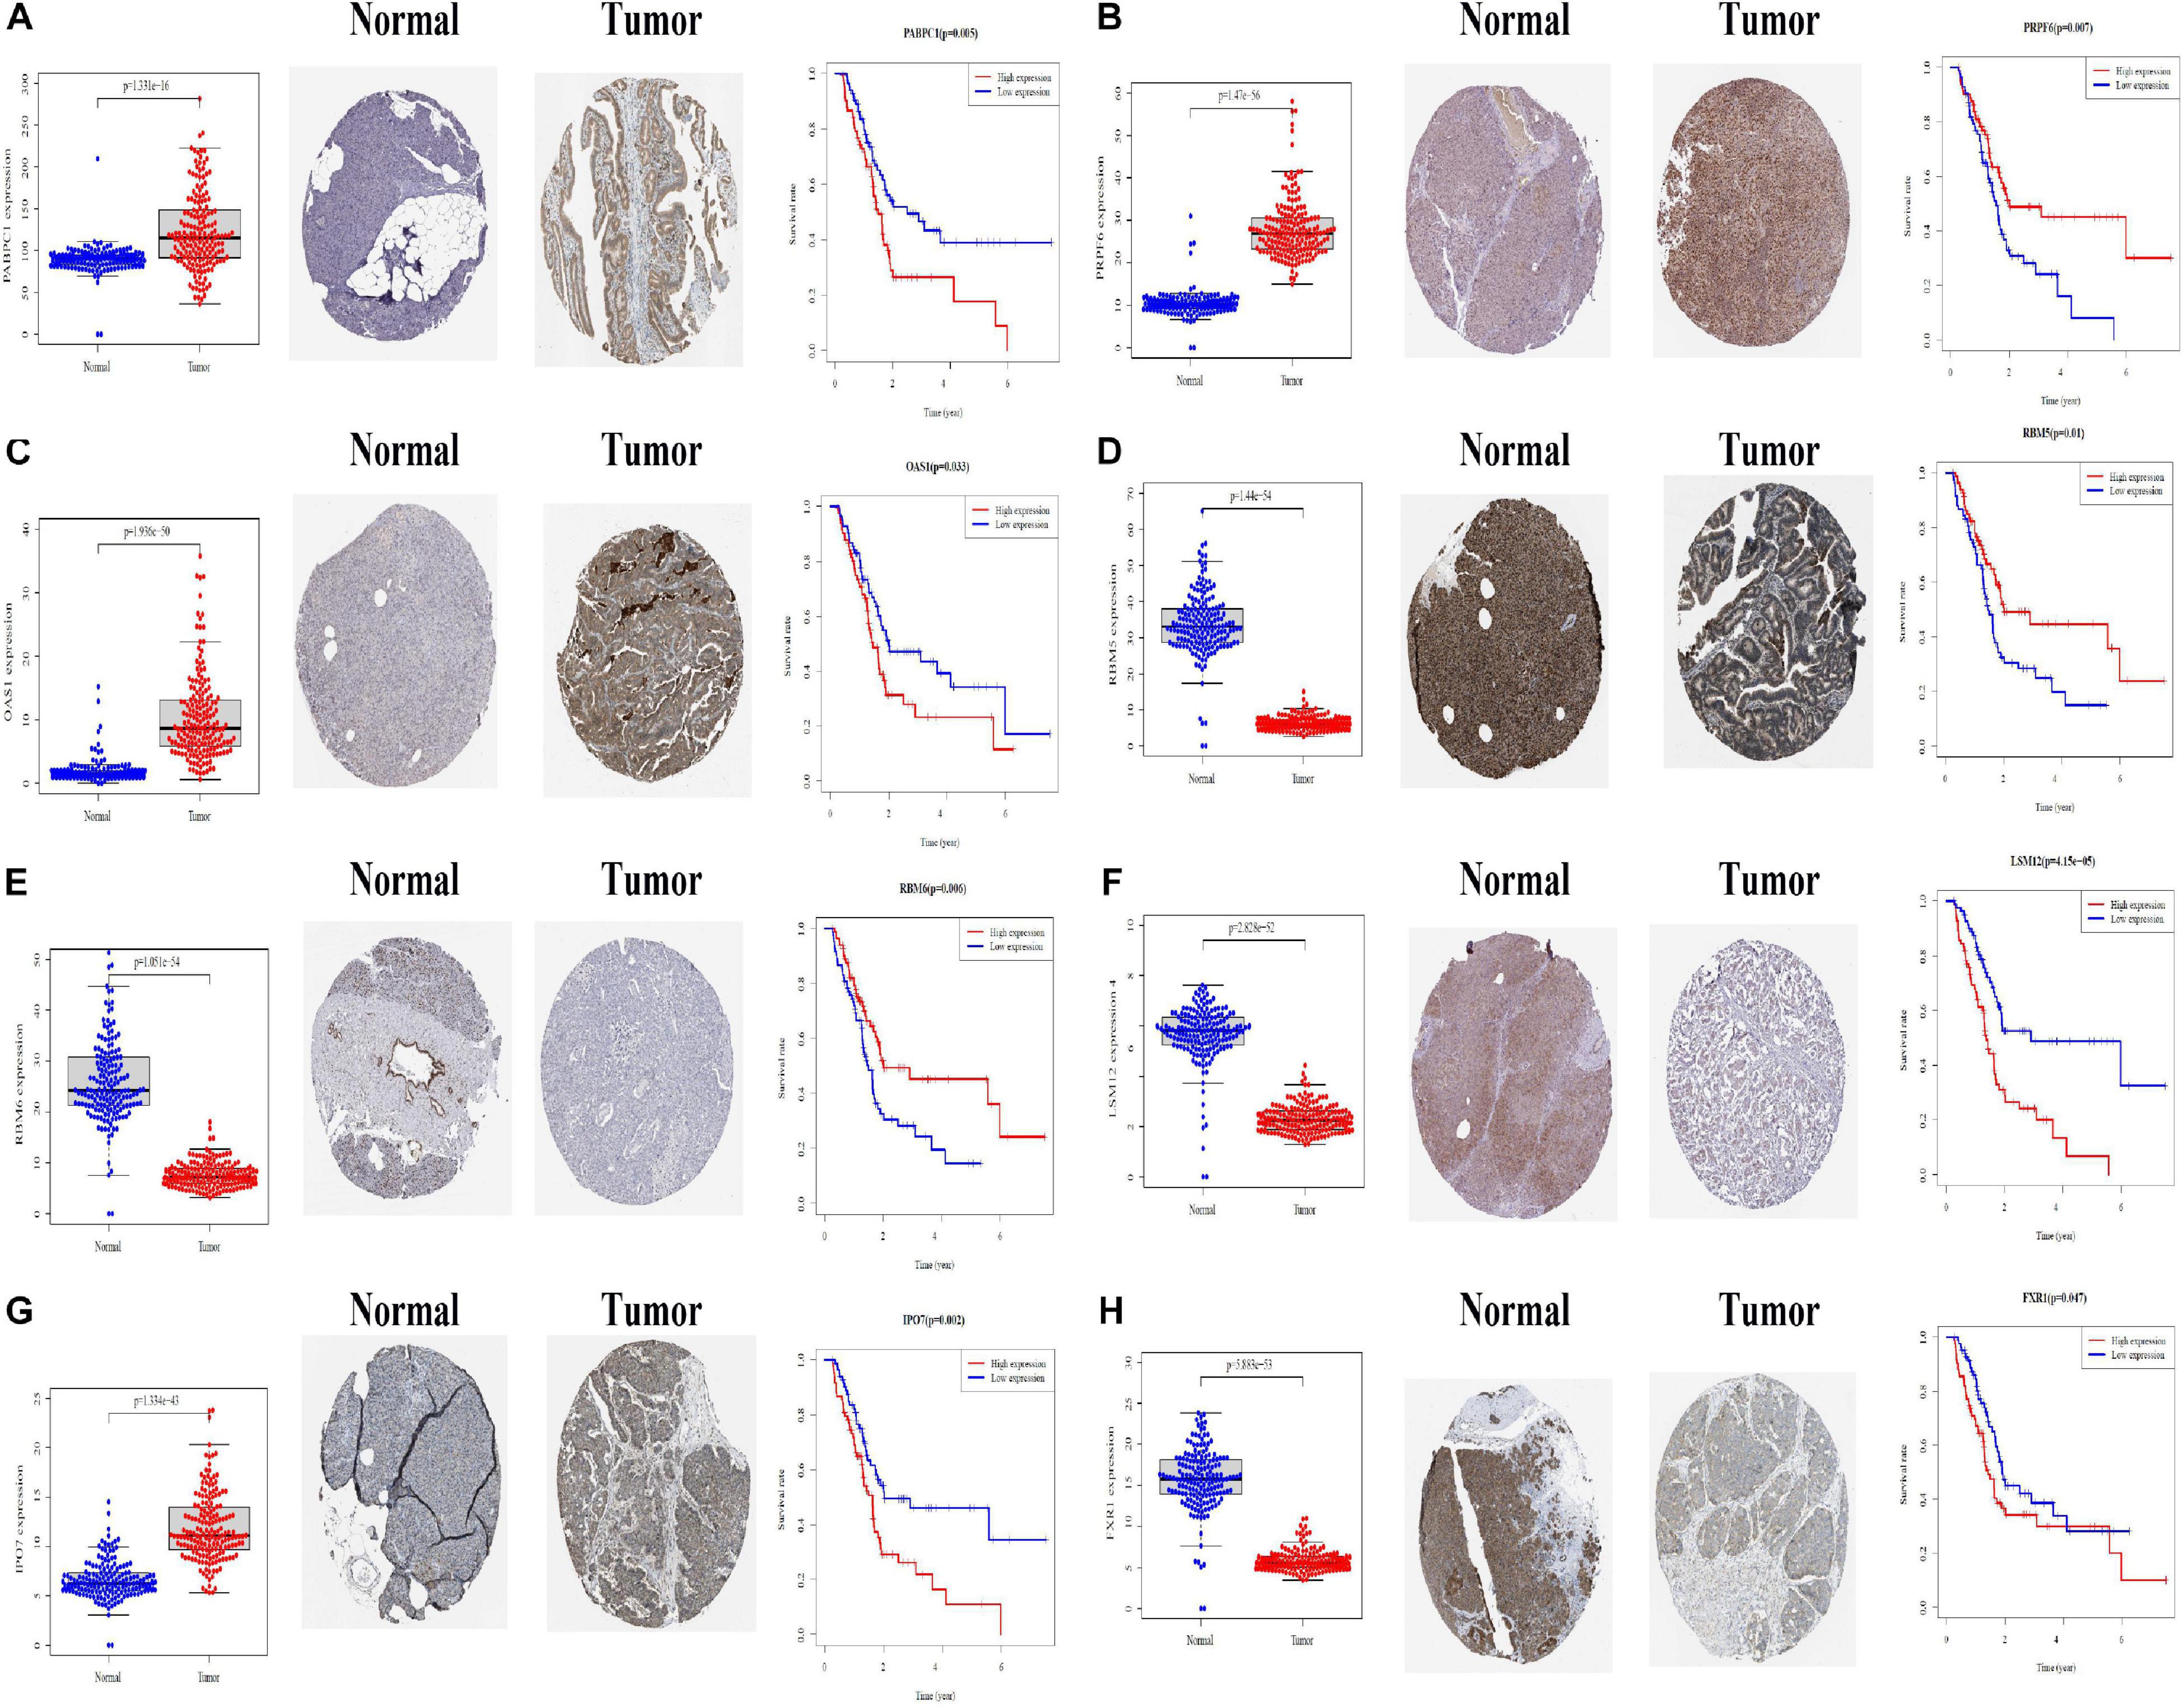
Figure 10. Differential expression and Kaplan–Meier survival curves of eight modeling RBPs in PAAD based on TCGA, HPA, and KM-PLOT databases. (A) PABPC1; (B) PRPF6; (C) OAS1; (D) RBM5; (E) RBM6; (F) LSM12; (G) IPO7; (H) FXR1. P < 0.05 is considered significantly.
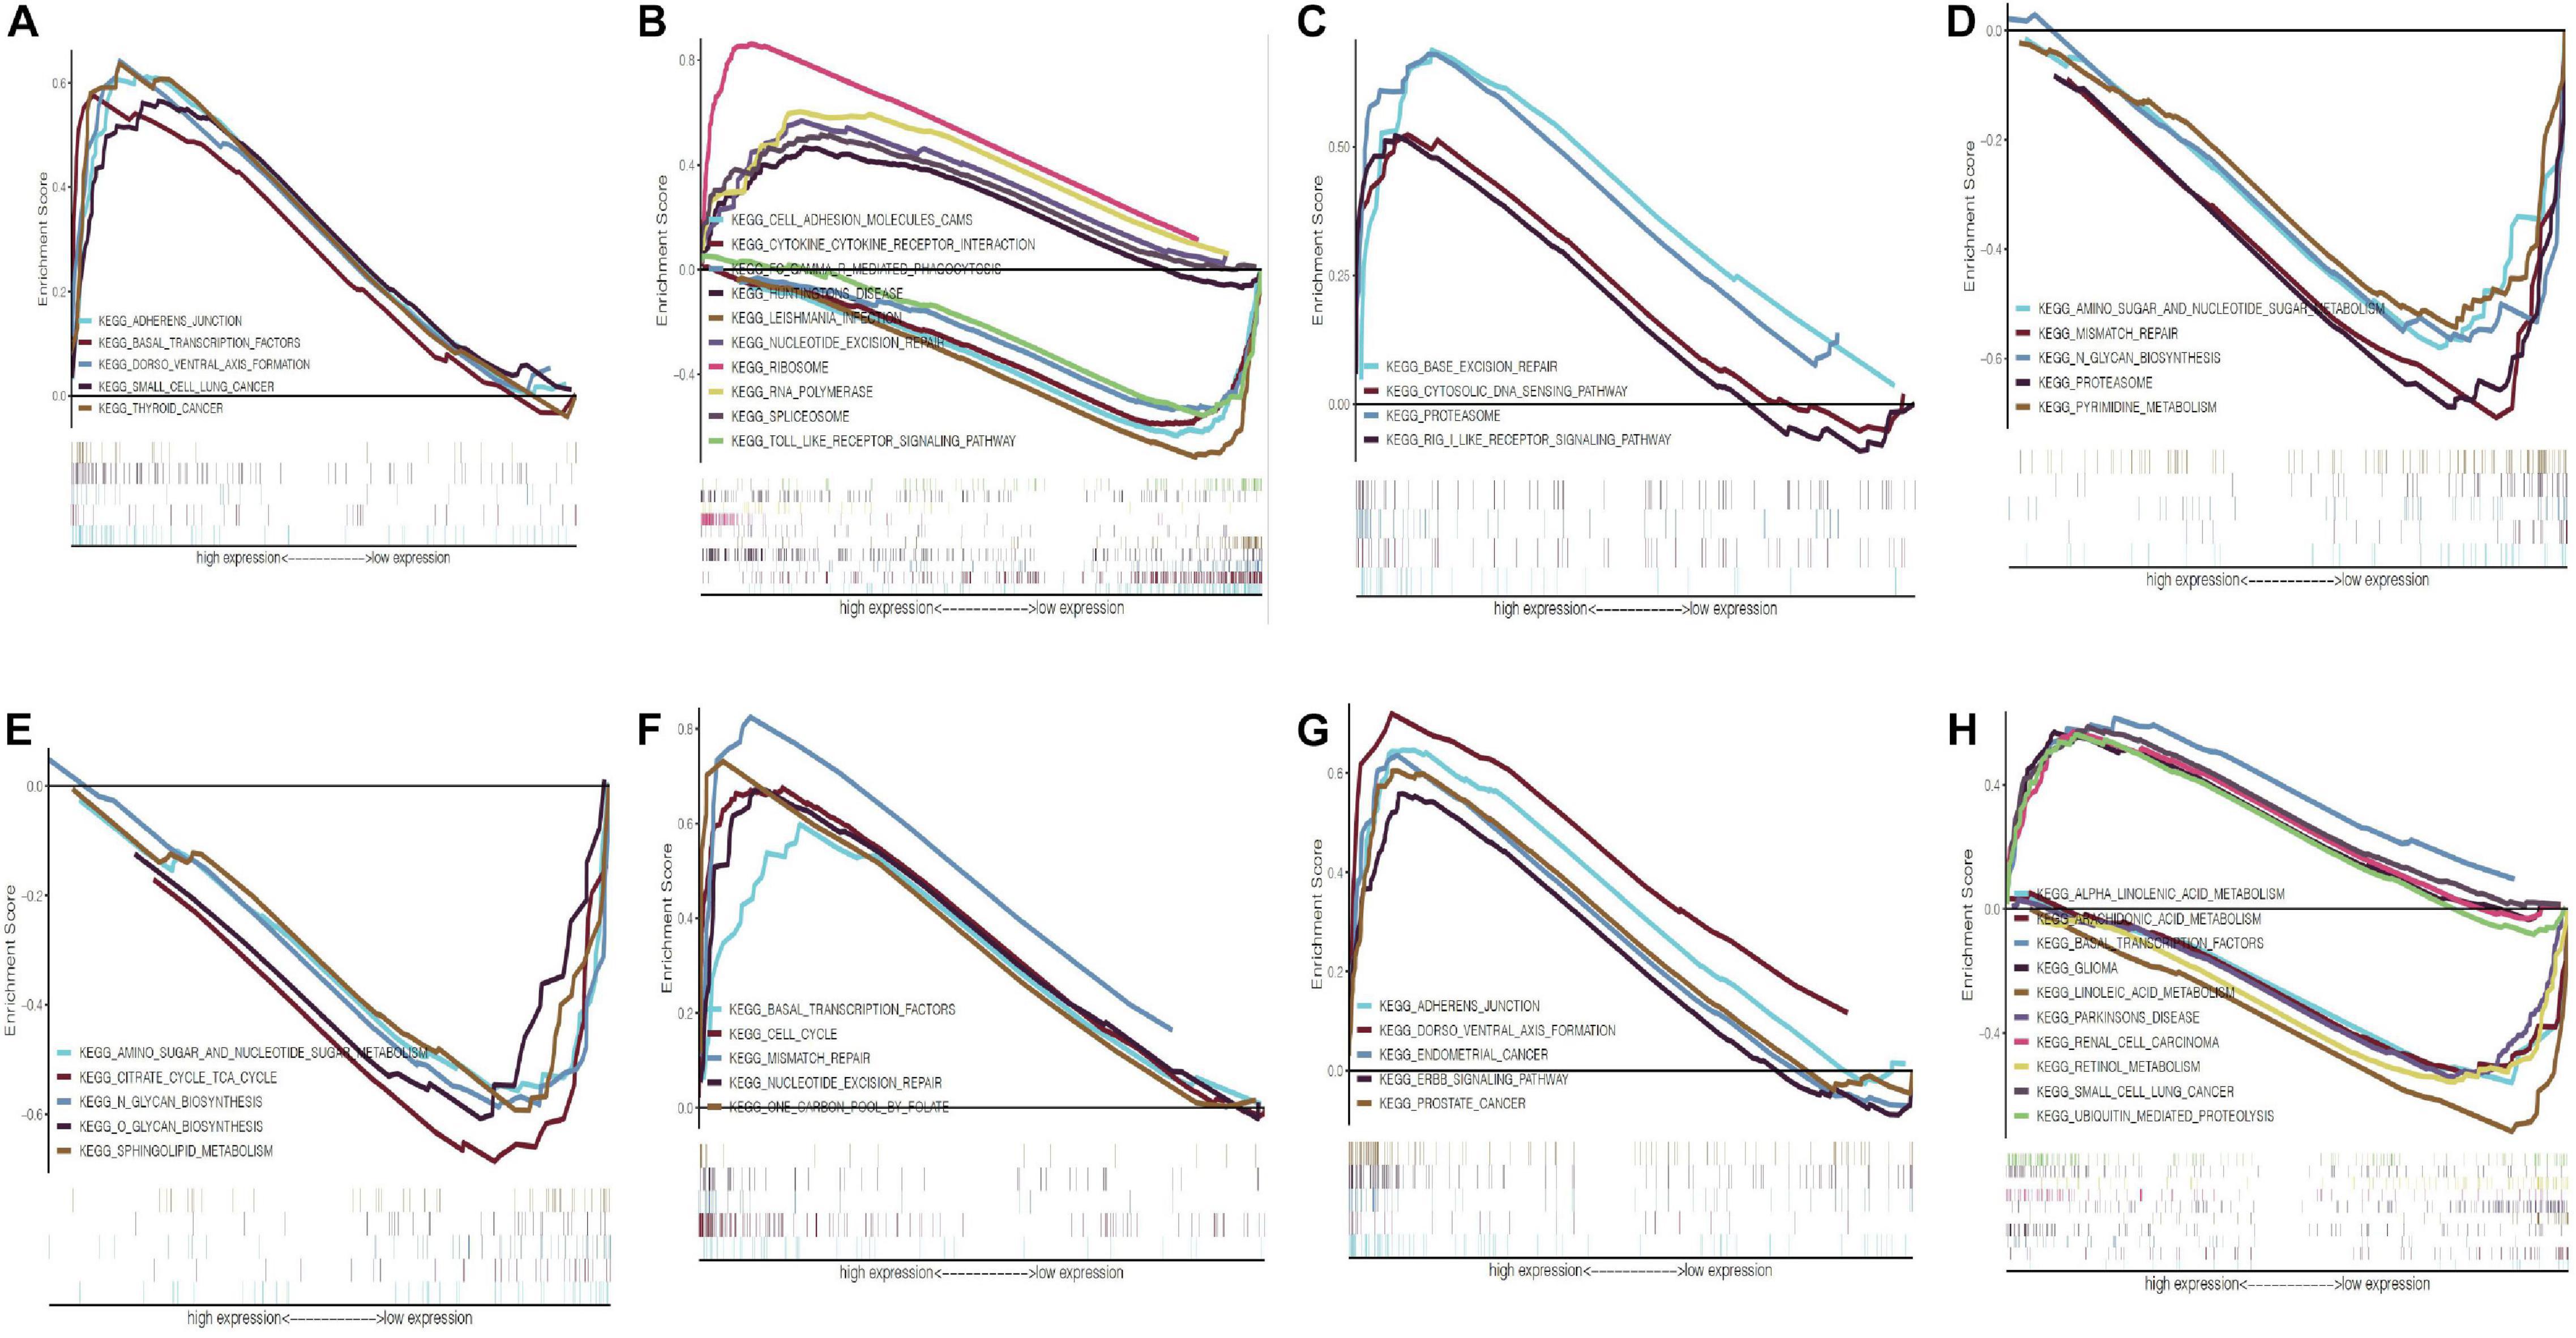
Figure 11. Gene set enrichment analysis of eight modeling RBPs in PAAD. (A) PABPC1; (B) PRPF6; (C) OAS1; (D) RBM5; (E) RBM6; (F) LSM12; (G) IPO7; (H) FXR1. Only the top 5 enrichment pathways according to NES in each phenotype were displayed if available. NOM P-value < 0.05 and FDR q-value < 0.25 were considered significant. NES, normalized enrichment score.
Discussion
Pancreatic adenocarcinoma is the most malignant digestive tract tumor with a 5-year survival rate of less than 10% (McGuigan et al., 2018). In the background of rapid development of diagnosis and treatment for malignant tumors, the worse status of early diagnosis and treatment of PAAD has not been greatly improved. Recently, several studies have revealed that parts of RBPs significantly influence the progression of PAAD. For example, MSL1 and MSL2 were drivers of PAAD, which were proved to promote the transition of pancreatic intraepithelial neoplasias to PAAD and to increase the aggression of PAAD (Fox et al., 2016; Kudinov et al., 2017). Considering the significance of RBPs in PAAD, in this study, we systematically explored RBP expression in PAAD in order to provide potential biomarkers for diagnosis and treatment of PAAD.
First, we screened DE-RBPs and pRBPs in PAAD. RBPs (453) are expressed differentially between normal and PAAD samples, 28 of which are prognosis related. Of the 453 DE-RBPs, most of them are functionally associated with ribosome, ribonuclease, and spliceosome. Ribonucleases (RNases) are a group of hydrolytic enzymes to catalyze RNA molecule degradation, which are classified by two types: endoribonucleases and exoribonucleases (Shlyakhovenko, 2016). Biologically, RNases take part in many physiological activity such as RNA metabolism, remobilization of phosphate, defensin-like activity, and senescence (Fang et al., 2012; Tatsuta et al., 2014). Researchers were attracted by the cytotoxic effects (inducing apoptosis) of RNases, which can be applied in anticancer activity. One study indicated that defection of RNases inhibited the apoptosis of prostate cancer cells (Malathi et al., 2004). The loss of RNase T2 stimulated ovarian tumorigenesis (Acquati et al., 2013). Ribosome is one of the important organelles of protein synthesis. Studies have shown that in order to satisfy the tumor cells’ continuous growing, it is necessary to increase ribosome biogenesis to maintain high protein synthesis efficiency. Therefore, abnormal ribosome biogenesis may result in the occurrence of carcinoma (Pelletier et al., 2018). Specific ribosomal proteins were found to be upregulated in a variety of tumors. For example, the expression of RPL5, RPS3, RPS6, RPS8, and RPS12 in colorectal cancer was higher than that in normal colorectal mucosa. The expression of RPL15 was upregulated in gastric cancer tissues and cell lines. The mRNA level of RPS8, RPL12, RPL23A, RPL27, and RPL30 was detected as upregulated in hepatocellular carcinoma tissues and cell lines (Wang et al., 2015). Related mechanism studies show that ribosome biosynthesis is an important part of Ras/Raf/MEK/ERK, MYC, and PI3K/Akt/mTOR pathways, which are proven to drive malignant tumors. Besides, therapeutic effects of many anticancer drugs used in the clinic are partly by destroying ribosome biosynthesis. For example, cisplatin, oxaliplatin, adriamycin, and mitomycin C inhibit ribosome synthesis at the rRNA transcription level, while 5-fluorouracil-camptothecin inhibits ribosome formation at the rRNA processing level (Burger and Eick, 2013; Derenzini et al., 2018). There is no doubt that spliceosome is a hot spot in the field of cancer research in recent years. The spliceosome consists of five snRNP containing U1, U2, U4, U5, U6, and several splicing factors (SFs) (Hsu et al., 2015). The disorder of SFs expression can activate tumor-related alternative splicing events, leading to cell carcinogenesis ultimately (David and Manley, 2010; Zhang and Manley, 2013). Then, the KEGG pathway enrichment analysis indicated that these DE-RBPs are mainly enriched in RNA transport, ribosome, mRNA surveillance pathway, spliceosome, ribosome biogenesis in eukaryotes, RNA degradation, influenza A, as well as aminoacyl-tRNA biosynthesis, which echoed GO functional analysis.
In addition, we established a PPI network with 422 nodes and 5,840 edges for DE-RBPs. Of 28 pRBPs, 8 RBPs including PABPC1, PRPF6, OAS1, RBM5, LSM12, IPO7, FXR1, and RBM6 are selected to construct a prognostic risk model by multivariate Cox regression. PABPC1 (poly A binding protein, cytoplasmic 1) is known to participate in RNA degradation and translation (Takashima et al., 2006). PABPC1 promotes growth and progression of gastric cancer cells by regulating miR-34c and induces proliferation of hepatocellular carcinoma cells by promoting entry into the S phase (Zhang et al., 2015; Zhu et al., 2015). On the contrary, PABPC-1 is considered as a tumor suppressor in glioblastoma cells by binding to BDNF-AS (Su et al., 2020). PRPF6 is reported to be related with spliceosome in colon cancer (Adler et al., 2014) and androgen receptor (AR) signaling in hepatocellular carcinoma (HCC) (Song et al., 2020). Most studies about OAS1 are limited in bioinformatics analysis. A study from Robert et al. indicated that OAS1 expression was correlated with azacytidine (AZA) sensitivity in the NCI-60 tumor cell lines and was a biomarker for predicting AZA sensitivity of tumor cells (Banerjee et al., 2019). Besides, one gene expression profiling combining bioinformatics analysis in regard to PAAD identified that OAS1 was related to worse prognosis of PAAD (Tang et al., 2019). A basic experiment showed that pancreatic cancer cell lines with high OAS expression were resistant to oncolytic virus therapy (Moerdyk-Schauwecker et al., 2013). RBM5 (RNA-binding motif protein 5) and RBM6 (RNA-binding motif protein 6) were initially reported as tumor suppressors. Both of them map to the 3p21.3 region with frequent alteration in lung cancer (Lerman and Minna, 2000; Oh et al., 2002). RBM5 was observed to promote cell apoptosis and retard tumor growth. RBM5 was highly downregulated in breast cancer (Rintala-Maki et al., 2004) and prostate cancer (Zhao et al., 2012). By contrast, some studies indicated that RBM5 was upregulated in breast cancer and ovarian cancer as a result of overexpression of oncogene EGFR-2 (Zhang et al., 2019). It seems that both overexpression and downexpression of RBM5 influence the progression of cancer. RBM6 mRNA was reported to be highly upregulated in many cancer types, such as breast cancer, malignant fibrous histiocytoma, ovary cystadenoma, non-Hodgkin’s lymphoma, and pancreatic cancer. A study from Chen Huang et Al. proved that upregulated RBM6 in pancreatic cancer may be released into the blood, which could be a candidate and potential serum biomarker for early diagnosis of pancreatic cancer (Duan et al., 2019). Elevated IPO7 was found in various cancer types such as colorectal cancer (CRC), which can be explained by the fact that the transcription of gene IPO7 was suppressed by p53 and promoted by c-Myc (Golomb et al., 2012), as well as glioma, in which IPO7 increased promoter activity of FOXM1, leading to the nuclear import of GL1 and glioma development (Xue et al., 2015). IPO7 was found to be upregulated in several pancreatic cancer lines (Suit2 and MIA PaCa2) (Cui et al., 2017). A lot of studies suggested the tumor-promotive function of FXR1, and FXR1 was highly upregulated in oral squamous cell carcinoma (Majumder et al., 2016), lung squamous cell carcinoma (Comtesse et al., 2007), head and neck squamous cell carcinoma (Qie et al., 2017), triple negative breast carcinoma (Qian et al., 2017), ovarian carcinoma (Zhao et al., 2017), etc. It not only has potential diagnostic and prognostic value but also can predict specific metastasis and response to chemoradiotherapy. The function of LSM12 has not been reported in the development of cancer. Our analysis suggests that LSM12 may be a high-risk RBP with carcinogenesis in PAAD. The abovementioned researches and our analysis of ROC curve, validation cohort, risk curves, as well as nomogram proved the reliability and accuracy of the model.
In general, we successfully constructed an RBP-associated prognostic risk model in PAAD, which has potential clinical application prospect. However, there are still many limitations in our study. First, we did not compare the prognostic risk model with other recognized prognostic factors such as KRAS and TP53. Second, most of the eight modeling RBPs are not reported in PAAD, and functional studies are needed to verify the roles of modeling RBPs in PAAD.
Conclusion
We constructed a prognostic risk model consisting of eight hub RBPs in PAAD based on TCGA database. The corresponding results not only help us understand the significant values of RBPs in occurrence and progression of PAAD but also help develop new therapeutic targets and prognostic molecular markers.
Data Availability Statement
The original contributions generated for this study are included in the article/Supplementary Material, further inquiries can be directed to the corresponding author.
Ethics Statement
Ethical review and approval was not required for the study on human participants in accordance with the local legislation and institutional requirements. Written informed consent for participation was not required for this study in accordance with the national legislation and the institutional requirements.
Author Contributions
XW: data download and analysis and manuscript writing. ZS: manuscript writing and modification. SC: manuscript arrangement and manuscript writing. WW, YW, JJ, and QM: reviewing literature. LZ: manuscript guidance. All authors contributed to the article and approved the submitted version.
Conflict of Interest
The authors declare that the research was conducted in the absence of any commercial or financial relationships that could be construed as a potential conflict of interest.
Supplementary Material
The Supplementary Material for this article can be found online at: https://www.frontiersin.org/articles/10.3389/fgene.2020.610350/full#supplementary-material
Supplementary Figure 1 | Gene set enrichment analysis (GSEA) analysis for differentially expressed RBPs between normal and tumor groups in PAAD. P-value < 0.5 and | NES| > 1were considered significantly.
Supplementary Table 1 | Gene set enrichment analysis (GSEA) for eight modeling RBPs. (| NES| > 1 and NOM p-value < 0.05 were considered significantly).
Footnotes
- ^ https://xenabrowser.net/datapages/
- ^ https://portal.gdc.cancer.gov/
- ^ http://www.string-db.org/
- ^ https://www.proteinatlas.org/
References
Acquati, F., Lualdi, M., Bertilaccio, S., Monti, L., Turconi, G., Fabbri, M., et al. (2013). Loss of function of Ribonuclease T2, an ancient and phylogenetically conserved RNase, plays a crucial role in ovarian tumorigenesis. Proc. Natl. Acad. Sci. U.S.A. 110, 8140–8145. doi: 10.1073/pnas.1222079110
Adler, A. S., McCleland, M. L., Yee, S., Yaylaoglu, M., Hussain, S., Cosino, E., et al. (2014). An integrative analysis of colon cancer identifies an essential function for PRPF6 in tumor growth. Genes Dev. 28, 1068–1084. doi: 10.1101/gad.237206.113
Aran, D., Camarda, R., Odegaard, J., Paik, H., Oskotsky, B., Krings, G., et al. (2017). Comprehensive analysis of normal adjacent to tumor transcriptomes. Nat. Commun. 8:1077. doi: 10.1038/s41467-017-01027-z
Bader, G. D., and Hogue, C. W. (2003). An automated method for finding molecular complexes in large protein interaction networks. BMC Bioinform. 4:2. doi: 10.1186/1471-2105-4-2
Banerjee, S., Gusho, E., Gaughan, C., Dong, B., Gu, X., Holvey-Bates, E., et al. (2019). OAS-RNase L innate immune pathway mediates the cytotoxicity of a DNA-demethylating drug. Proc. Natl. Acad. Sci. U.S.A. 116, 5071–5076. doi: 10.1073/pnas.1815071116
Burger, K., and Eick, D. (2013). Functional ribosome biogenesis is a prerequisite for p53 destabilization: impact of chemotherapy on nucleolar functions and RNA metabolism. Biol. Chem. 394, 1133–1143. doi: 10.1515/hsz-2013-0153
Castello, A., Fischer, B., Eichelbaum, K., Horos, R., Beckmann, B. M., Strein, C., et al. (2012). Insights into RNA biology from an atlas of mammalian mRNA-binding proteins. Cell 149, 1393–1406. doi: 10.1016/j.cell.2012.04.031
Chatterji, P., and Rustgi, A. K. (2018). RNA binding proteins in intestinal epithelial biology and colorectal cancer. Trends Mol. Med. 24, 490–506. doi: 10.1016/j.molmed.2018.03.008
Comtesse, N., Keller, A., Diesinger, I., Bauer, C., Kayser, K., Huwer, H., et al. (2007). Frequent overexpression of the genes FXR1, CLAPM1 and EIF4G located on amplicon 3q26-27 in squamous cell carcinoma of the lung. Intern. J. Cancer 120, 2538–2544.
Cui, L., Nakano, K., Obchoei, S., Setoguchi, K., Matsumoto, M., Yamamoto, T., et al. (2017). Small nucleolar noncoding RNA SNORA23, Up-regulated in human pancreatic ductal adenocarcinoma, regulates expression of spectrin repeat-containing nuclear envelope 2 to promote growth and metastasis of xenograft tumors in mice. Gastroenterology 153, 292–306.e2. doi: 10.1053/j.gastro.2017.03.050
David, C. J., and Manley, J. L. (2010). Alternative pre-mRNA splicing regulation in cancer: pathways and programs unhinged. Genes Dev. 24, 2343–2364. doi: 10.1101/gad.1973010
Derenzini, E., Rossi, A., and Treré, D. (2018). Treating hematological malignancies with drugs inhibiting ribosome biogenesis: when and why. J. Hematol. Oncol. 11:75. doi: 10.1186/s13045-018-0609-1
Ding, C., Cheng, S., Yang, Z., Lv, Z., Xiao, H., Du, C., et al. (2014). Long non-coding RNA HOTAIR promotes cell migration and invasion via down-regulation of RNA binding motif protein 38 in hepatocellular carcinoma cells. Intern. J. Mol. Sci. 15, 4060–4076. doi: 10.3390/ijms15034060
Duan, B., Hu, X., Fan, M., Xiong, X., Han, L., Wang, Z., et al. (2019). RNA-binding motif protein 6 is a candidate serum biomarker for pancreatic cancer. Proteom. Clin. Appl. 13:e1900048. doi: 10.1002/prca.201900048
Fang, E. F., Zhang, C. Z. Y., Fong, W. P., and Ng, T. B. (2012). RNase MC2: a new Momordica charantia ribonuclease that induces apoptosis in breast cancer cells associated with activation of MAPKs and induction of caspase pathways. Apoptosis 17, 377–387. doi: 10.1007/s10495-011-0684-z
Fox, R. G., Lytle, N. K., Jaquish, D. V., Park, F. D., Ito, T., Bajaj, J., et al. (2016). Image-based detection and targeting of therapy resistance in pancreatic adenocarcinoma. Nature 534, 407–411. doi: 10.1038/nature17988
Gerstberger, S., Hafner, M., and Tuschl, T. (2014). A census of human RNA-binding proteins. Nat. Rev. Genet. 15, 829–845. doi: 10.1038/nrg3813
Golomb, L., Bublik, D. R., Wilder, S., Nevo, R., Kiss, V., Grabusic, K., et al. (2012). Importin 7 and exportin 1 link c-Myc and p53 to regulation of ribosomal biogenesis. Mol. Cell 45, 222–232. doi: 10.1016/j.molcel.2011.11.022
Guo, J., and Jia, R. (2018). Splicing factor poly(rC)-binding protein 1 is a novel and distinctive tumor suppressor. J. Cell. Physiol. 234, 33–41. doi: 10.1002/jcp.26873
Han, M.-E., Kim, J.-Y., Kim, G. H., Park, S. Y., Kim, Y. H., and Oh, S.-O. (2018). SAC3D1: a novel prognostic marker in hepatocellular carcinoma. Sci. Rep. 8:15608. doi: 10.1038/s41598-018-34129-9
Heagerty, P. J., Lumley, T., and Pepe, M. S. (2000). Time-dependent ROC curves for censored survival data and a diagnostic marker. Biometrics 56, 337–344.
Hsu, T. Y. T., Simon, L. M., Neill, N. J., Marcotte, R., Sayad, A., Bland, C. S., et al. (2015). The spliceosome is a therapeutic vulnerability in MYC-driven cancer. Nature 525, 384–388. doi: 10.1038/nature14985
Huang, W., Wei, X.-L., Ni, W., Cao, M., Meng, L., and Yang, H. (2017). The expression of RNA-binding protein RBM38 decreased in renal cell carcinoma and represses renal cancer cell proliferation, migration, and invasion. Tumour Biol. 39:1010428317701635. doi: 10.1177/1010428317701635
Kim, S. Y., Yoon, M. J., Park, Y. I., Kim, M. J., Nam, B.-H., and Park, S. R. (2018). Nomograms predicting survival of patients with unresectable or metastatic gastric cancer who receive combination cytotoxic chemotherapy as first-line treatment. Gas. Cancer 21, 453–463. doi: 10.1007/s10120-017-0756-z
Kosti, I., Jain, N., Aran, D., Butte, A. J., and Sirota, M. (2016). Cross-tissue analysis of gene and protein expression in normal and cancer tissues. Sci. Rep. 6:24799. doi: 10.1038/srep24799
Kudinov, A. E., Karanicolas, J., Golemis, E. A., and Boumber, Y. (2017). Musashi RNA-binding proteins as cancer drivers and novel therapeutic targets. Clin. Cancer Res. 23, 2143–2153. doi: 10.1158/1078-0432.CCR-16-2728
Legrand, N., Dixon, D. A., and Sobolewski, C. (2019). AU-rich element-binding proteins in colorectal cancer. World J. Gastrointest. Oncol. 11, 71–90. doi: 10.4251/wjgo.v11.i2.71
Lerman, M. I., and Minna, J. D. (2000). The 630-kb lung cancer homozygous deletion region on human chromosome 3p21.3: identification and evaluation of the resident candidate tumor suppressor genes. The International Lung Cancer Chromosome 3p21.3 Tumor suppressor gene consortium. Cancer Res. 60, 6116–6133.
Li, W., Gao, L.-N., Song, P.-P., and You, C.-G. (2020). Development and validation of a RNA binding protein-associated prognostic model for lung adenocarcinoma. Aging 12, 3558–3573. doi: 10.18632/aging.102828
Liu, S., Song, A., Zhou, X., Huo, Z., Yao, S., Yang, B., et al. (2020). ceRNA network development and tumour-infiltrating immune cell analysis of metastatic breast cancer to bone. J. Bone Oncol. 24:100304. doi: 10.1016/j.jbo.2020.100304
Lujan, D. A., Ochoa, J. L., and Hartley, R. S. (2018). Cold-inducible RNA binding protein in cancer and inflammation. Wiley Interdiscip. Rev. RNA 9:1462. doi: 10.1002/wrna.1462
Majumder, M., House, R., Palanisamy, N., Qie, S., Day, T. A., Neskey, D., et al. (2016). RNA-Binding Protein FXR1 regulates p21 and TERC RNA to bypass p53-mediated cellular senescence in OSCC. PLoS Genet. 12:e1006306. doi: 10.1371/journal.pgen.1006306
Malathi, K., Paranjape, J. M., Ganapathi, R., and Silverman, R. H. (2004). HPC1/RNASEL mediates apoptosis of prostate cancer cells treated with 2’,5’-oligoadenylates, topoisomerase I inhibitors, and tumor necrosis factor-related apoptosis-inducing ligand. Cancer Res. 64, 9144–9151.
Masuda, K., and Kuwano, Y. (2019). Diverse roles of RNA-binding proteins in cancer traits and their implications in gastrointestinal cancers. Wiley Interdiscip. Rev. RNA 10:e1520. doi: 10.1002/wrna.1520
McGuigan, A., Kelly, P., Turkington, R. C., Jones, C., Coleman, H. G., and McCain, R. S. (2018). Pancreatic cancer: a review of clinical diagnosis, epidemiology, treatment and outcomes. World J. Gastroenterol. 24, 4846–4861. doi: 10.3748/wjg.v24.i43.4846
Mitchell, S. F., and Parker, R. (2014). Principles and properties of eukaryotic mRNPs. Mol. Cell 54, 547–558. doi: 10.1016/j.molcel.2014.04.033
Moerdyk-Schauwecker, M., Shah, N. R., Murphy, A. M., Hastie, E., Mukherjee, P., and Grdzelishvili, V. Z. (2013). Resistance of pancreatic cancer cells to oncolytic vesicular stomatitis virus: role of type I interferon signaling. Virology 436, 221–234. doi: 10.1016/j.virol.2012.11.014
Oh, J. J., West, A. R., Fishbein, M. C., and Slamon, D. J. (2002). A candidate tumor suppressor gene, H37, from the human lung cancer tumor suppressor locus 3p21.3. Cancer Res. 62, 3207–3213.
Ouyang, W., Ren, L., Liu, G., Chi, X., and Wei, H. (2019). LncRNA MIR4435-2HG predicts poor prognosis in patients with colorectal cancer. PeerJ 7:e6683. doi: 10.7717/peerj.6683
Pelletier, J., Thomas, G., and Volarević, S. (2018). Corrigendum: ribosome biogenesis in cancer: new players and therapeutic avenues. Nat. Rev. Cancer 18:134. doi: 10.1038/nrc.2018.3
Pereira, B., Billaud, M., and Almeida, R. (2017). RNA-binding proteins in cancer: old players and new actors. Trends Cancer 3, 506–528. doi: 10.1016/j.trecan.2017.05.003
Pillai, M. R., Chacko, P., Kesari, L. A., Jayaprakash, P. G., Jayaram, H. N., and Antony, A. C. (2003). Expression of folate receptors and heterogeneous nuclear ribonucleoprotein E1 in women with human papillomavirus mediated transformation of cervical tissue to cancer. J. Clin. Pathol. 56, 569–574.
Qian, J., Chen, H., Ji, X., Eisenberg, R., Chakravarthy, A. B., Mayer, I. A., et al. (2017). A 3q gene signature associated with triple negative breast cancer organ specific metastasis and response to neoadjuvant chemotherapy. Sci. Rep. 7:45828. doi: 10.1038/srep45828
Qie, S., Majumder, M., Mackiewicz, K., Howley, B. V., Peterson, Y. K., Howe, P. H., et al. (2017). Fbxo4-mediated degradation of Fxr1 suppresses tumorigenesis in head and neck squamous cell carcinoma. Nat. Commun. 8:1534. doi: 10.1038/s41467-017-01199-8
Raphael, B. J., Hruban, R. H., Aguirre, A. J., Moffitt, R. A., Yeh, J. J., Stewart, C., et al. (2017). Integrated genomic characterization of pancreatic ductal adenocarcinoma. Cancer Cell 32, 185–203.e113.
Rintala-Maki, N. D., Abrasonis, V., Burd, M., and Sutherland, L. C. (2004). Genetic instability of RBM5/LUCA-15/H37 in MCF-7 breast carcinoma sublines may affect susceptibility to apoptosis. Cell Biochem. Funct. 22, 307–313.
Shlyakhovenko, V. O. (2016). Ribonucleases. Possible new approach in cancer therapy. Exper. Oncol. 38, 2–8.
Song, H., Sun, N., Lin, L., Wei, S., Zeng, K., Liu, W., et al. (2020). Splicing factor PRPF6 upregulates oncogenic androgen receptor signaling pathway in hepatocellular carcinoma. Cancer Sci. 111, 3665–3678. doi: 10.1111/cas.14595
Su, R., Ma, J., Zheng, J., Liu, X., Liu, Y., Ruan, X., et al. (2020). PABPC1-induced stabilization of BDNF-AS inhibits malignant progression of glioblastoma cells through STAU1-mediated decay. Cell Death Dis. 11:81. doi: 10.1038/s41419-020-2267-9
Subramanian, A., Tamayo, P., Mootha, V. K., Mukherjee, S., Ebert, B. L., Gillette, M. A., et al. (2005). Gene set enrichment analysis: a knowledge-based approach for interpreting genome-wide expression profiles. Proc. Natl. Acad. Sci. U.S.A. 102, 15545–15550.
Szklarczyk, D., Gable, A. L., Lyon, D., Junge, A., Wyder, S., Huerta-Cepas, J., et al. (2019). STRING v11: protein-protein association networks with increased coverage, supporting functional discovery in genome-wide experimental datasets. Nucleic Acids Res. 47, D607–D613. doi: 10.1093/nar/gky1131
Takashima, N., Ishiguro, H., Kuwabara, Y., Kimura, M., Haruki, N., Ando, T., et al. (2006). Expression and prognostic roles of PABPC1 in esophageal cancer: correlation with tumor progression and postoperative survival. Oncol. Rep. 15, 667–671.
Tang, D., Wu, Q., Yuan, Z., Xu, J., Zhang, H., Jin, Z., et al. (2019). Identification of key pathways and genes changes in pancreatic cancer cells (BXPC-3) after cross-talked with primary pancreatic stellate cells using bioinformatics analysis. Neoplasma 66, 681–693. doi: 10.4149/neo_2018_181020N786
Tatsuta, T., Sugawara, S., Takahashi, K., Ogawa, Y., Hosono, M., and Nitta, K. (2014). Leczyme: a new candidate drug for cancer therapy. Biomed. Res. Intern. 2014:421415. doi: 10.1155/2014/421415
Thakur, S., Nakamura, T., Calin, G., Russo, A., Tamburrino, J. F., Shimizu, M., et al. (2003). Regulation of BRCA1 transcription by specific single-stranded DNA binding factors. Mol. Cell. Biol. 23, 3774–3787.
Thul, P. J., Åkesson, L., Wiking, M., Mahdessian, D., Geladaki, A., Ait Blal, H., et al. (2017). A subcellular map of the human proteome. Science 356:aal3321. doi: 10.1126/science.aal3321
Venkat, S., Tisdale, A. A., Schwarz, J. R., Alahmari, A. A., Maurer, H. C., Olive, K. P., et al. (2020). Alternative polyadenylation drives oncogenic gene expression in pancreatic ductal adenocarcinoma. Genome Res. 30, 347–360. doi: 10.1101/gr.257550.119
Wang, H., Vardy, L. A., Tan, C. P., Loo, J. M., Guo, K., Li, J., et al. (2010). PCBP1 suppresses the translation of metastasis-associated PRL-3 phosphatase. Cancer Cell 18, 52–62. doi: 10.1016/j.ccr.2010.04.028
Wang, W., Nag, S., Zhang, X., Wang, M.-H., Wang, H., Zhou, J., et al. (2015). Ribosomal proteins and human diseases: pathogenesis, molecular mechanisms, and therapeutic implications. Med. Res. Rev. 35, 225–285. doi: 10.1002/med.21327
Wu, H., and Zhang, J. (2018). Decreased expression of TFAP2B in endometrial cancer predicts poor prognosis: a study based on TCGA data. Gynecol. Oncol. 149, 592–597. doi: 10.1016/j.ygyno.2018.03.057
Xue, J., Zhou, A., Tan, C., Wu, Y., Lee, H.-T., Li, W., et al. (2015). Forkhead Box M1 is essential for nuclear localization of glioma-associated oncogene homolog 1 in glioblastoma multiforme cells by promoting importin-7 expression. J. Biol. Chem. 290, 18662–18670. doi: 10.1074/jbc.M115.662882
Yang, L., He, Y., Zhang, Z., and Wang, W. (2019). Systematic analysis and prediction model construction of alternative splicing events in hepatocellular carcinoma: a study on the basis of large-scale spliceseq data from The Cancer Genome Atlas. PeerJ 7:e8245. doi: 10.7717/peerj.8245
Yang, L., Zhang, Y., Ling, C., and Heng, W. (2018). RNPC1 inhibits non-small cell lung cancer progression via regulating miR-181a/CASC2 axis. Biotechnol. Lett. 40, 543–550. doi: 10.1007/s10529-017-2504-1
Zeng, W. Z. D., Glicksberg, B. S., Li, Y., and Chen, B. (2019). Selecting precise reference normal tissue samples for cancer research using a deep learning approach. BMC Med. Genom. 12, (Suppl. 1):21. doi: 10.1186/s12920-018-0463-6
Zhang, H., Sheng, C., Yin, Y., Wen, S., Yang, G., Cheng, Z., et al. (2015). PABPC1 interacts with AGO2 and is responsible for the microRNA mediated gene silencing in high grade hepatocellular carcinoma. Cancer Lett. 367, 49–57. doi: 10.1016/j.canlet.2015.07.010
Zhang, J., and Manley, J. L. (2013). Misregulation of pre-mRNA alternative splicing in cancer. Cancer Discov. 3, 1228–1237. doi: 10.1158/2159-8290.CD-13-0253
Zhang, J., Xu, E., Ren, C., Yang, H. J., Zhang, Y., Sun, W., et al. (2018). Genetic ablation of promotes lymphomagenesis in the context of mutant p53 by downregulating PTEN. Cancer Res. 78, 1511–1521. doi: 10.1158/0008-5472.CAN-17-2457
Zhang, T., Huang, X.-H., Dong, L., Hu, D., Ge, C., Zhan, Y.-Q., et al. (2010). PCBP-1 regulates alternative splicing of the CD44 gene and inhibits invasion in human hepatoma cell line HepG2 cells. Mol. Cancer 9:72. doi: 10.1186/1476-4598-9-72
Zhang, X., Wen, X., Feng, N., Chen, A., Yao, S., Ding, X., et al. (2020). Increased expression of T-Box transcription factor protein 21 (TBX21) in skin cutaneous melanoma predicts better prognosis: a study based on the cancer genome Atlas (TCGA) and genotype-tissue expression (GTEx) databases. Med. Sci. Moni. 26:e923087. doi: 10.12659/MSM.923087
Zhang, Y., Wagner, E. K., Guo, X., May, I., Cai, Q., Zheng, W., et al. (2016). Long intergenic non-coding RNA expression signature in human breast cancer. Sci. Rep. 6:37821. doi: 10.1038/srep37821
Zhang, Y.-P., Liu, K.-L., Wang, Y.-X., Yang, Z., Han, Z.-W., Lu, B.-S., et al. (2019). Down-regulated RBM5 inhibits bladder cancer cell apoptosis by initiating an miR-432-5p/β-catenin feedback loop. FASEB J. 33, 10973–10985. doi: 10.1096/fj.201900537R
Zhao, B. B., Yang, Z. J., Wang, Q., Pan, Z. M., Zhang, W., and Li, L. (2017). Clinical validation of multiple biomarkers suspension array technology for ovarian cancer. Zhonghua Chan Zhi 52, 11–19. doi: 10.3760/cma.j.issn.0529-567X.2017.01.005
Zhao, L., Li, R., Shao, C., Li, P., Liu, J., and Wang, K. (2012). 3p21.3 tumor suppressor gene RBM5 inhibits growth of human prostate cancer PC-3 cells through apoptosis. World J. Surg. Oncol. 10:247. doi: 10.1186/1477-7819-10-247
Keywords: RNA-binding proteins (RBPs), pancreatic adenocarcinoma (PAAD), prognosis, TCGA, GTEx
Citation: Wen X, Shao Z, Chen S, Wang W, Wang Y, Jiang J, Ma Q and Zhang L (2021) Construction of an RNA-Binding Protein-Related Prognostic Model for Pancreatic Adenocarcinoma Based on TCGA and GTEx Databases. Front. Genet. 11:610350. doi: 10.3389/fgene.2020.610350
Received: 28 September 2020; Accepted: 18 December 2020;
Published: 27 January 2021.
Edited by:
Y-H. Taguchi, Chuo University, JapanReviewed by:
Cheng Zhang, Fourth Affiliated Hospital of China Medical University, ChinaZhanzhong Ma, Yuebei People’s Hospital, China
Copyright © 2021 Wen, Shao, Chen, Wang, Wang, Jiang, Ma and Zhang. This is an open-access article distributed under the terms of the Creative Commons Attribution License (CC BY). The use, distribution or reproduction in other forums is permitted, provided the original author(s) and the copyright owner(s) are credited and that the original publication in this journal is cited, in accordance with accepted academic practice. No use, distribution or reproduction is permitted which does not comply with these terms.
*Correspondence: Longzhen Zhang, anN4eWZ5emx6QDEyNi5jb20=
†These authors have contributed equally to this work