 Yanqing Guo1,2†
 Paul A. Garber
 Jiang Zhou
- 1School of Karst Science, Guizhou Normal University, Guiyang, China
- 2College of Life Sciences, Northwest University, Xi’an, China
- 3State Key Laboratory of Environment Criteria and Risk Assessment, Chinese Research Academy Environmental Sciences, Beijing, China
- 4Department of Anthropology, Program in Ecology, Evolution, and Conservation Biology, The University of Illinois at Chicago, Urbana, IL, United States
- 5Guiyang Nursing Vacational College, Guiyang, China
The Hainan gibbon (Nomascus hainanus), once widespread across Hainan, China, is now found only in the Bawangling National Nature Reserve. With a remaining population size of 33 individuals, it is the world’s rarest primate. Habitat loss and fragmentation are the primary drivers of Hainan gibbon population decline. In this study, we integrated data based on field investigations and genotype analyses of 10 microsatellite loci (from fecal samples) to assess genetic diversity in this Critically Endangered primate species. We found that the genetic diversity of the Hainan gibbon is extremely low, with 7 of 8 microsatellite loci exhibiting decreased diversity. Additional molecular analyses are consistent with field observations indicating that individuals in groups A, B, and C are closely related, the female–male sex ratios of the offspring deviates significantly from 1:1, and the world’s remaining Hainan gibbon population is expected to experience continued high levels of inbreeding in the future. Given extensive habitat loss (99.9% of its natural range has been deforested) and fragmentation, this rarest ape species faces impending extinction unless corrective measures are implemented immediately.
Introduction
Species classified by the IUCN as Endangered (EN) or Critically Endangered (CR) face an impending extinction crisis and require immediate protection. In the case of nonhuman primates, which represent the 3rd most speciose mammalian order (some 512 species, Estrada et al., 2017), 17% of species are currently listed as CR and 28% as EN (Iucn, 2020). In the case of gibbons and siamangs (Hylobatidae, Primates) or small bodied Asian apes (genera Hylobates, Hoolock, Nomascus, and Sympalangus), the threat of extinction is extremely severe. Ninety-five percent (18 of 19 species) of gibbon and siamang species are EN or CR. This includes the world’s most threatened primate species, the Hainan gibbon (Nomascus hainanus). Only 33 Hainan gibbons remain in the wild. In the current study, we examine the genetic status of the critically endangered primate species.
There are several evaluation criteria used to assess a species viability and conservation status for it to be assessed as CR. These include the remaining population is small, declining, and geographically restricted; the species geographic range is highly fragmentated and decreasing; and quantitative assessments indicate that the extinction risk is high (Iucn, 2004). Given the difficulty of obtaining DNA samples of highly threatened and rare primate species, population genetics have seldom been used to assess their population viability. However, population genetic assessments are essential for effective programs of species management and conservation. For example, in 1958 China established the Xishuangbanna National Nature Reserve in Yunnan Province in an attempt to protect the Critically Endangered northern white-cheeked gibbon (Nomascus leucogenys). In 1980, China established the Nangunhe National Nature Reserve, also in Yunnan Province, to protect the Endangered lar gibbon (Hylobates lar). Although both gibbon species were censused and demographic information collected, studies by Fan et al. (2013) indicate that both gibbon species have been extirpated from China. Thus, although the creation of protected areas and periodic population re-censusing are important components of a species survivorship plan, population genetics research that includes estimates of genetic diversity, effective population size, inbreeding potential, and strategies for increasing gene flow also are essential.
Many species are facing a significant threat due to anthropogenically induced habitat fragmentation and habitat loss that has resulted in previously continuous populations becoming isolated (David and Richard, 2003; Frankham, 2005; Wei et al., 2012; Estrada et al., 2017; Li et al., 2018). As subpopulations decrease in size, they also are expected to decline in genetic diversity. In general, populations with higher genetic diversity have a greater ability to adapt and respond to changing environmental conditions (Lindsey et al., 2013) and are more disease resistant (Siddle et al., 2007), then populations characterized by limited genetic diversity (Swinnerton et al., 2004; Hemmings et al., 2012). At the same time, small populations are at greater risk for inbreeding, which will increase the degree of genetic drift and allelic loss, leading to reduced genetic diversity (Frankham et al., 2009; Frankham et al., 2014).
Research in conservation genetics has found that many small and isolated populations exhibit low genetic diversity. For example, the population of northern elephant seals (Mirounga angustirostris) inhabiting Guadalupe Island was reduced to a relic population of only 10–30 individuals in the 19th century. By 1991, the population had increased to 127,000. Despite this rapid population increase, genetic research indicates that the genetic variation of northern elephant seals remains extremely low and has been severely affected by inbreeding and genetic drift. The genetic diversity of the population is only 45% of the original population (Hoelzel, 1997). Similarly, recent habitat fragmentation has resulted in several primate species in China (e.g., Rhinopithecus roxellana, Rhinopithecus bieti, Rhinopithecus brelichi, Trachypithecus francoisi, and Trachypithecus leucocephalus) distributed into small isolated subpopulations. Genetic differentiation across subpopulations is high (0.109–0.177), and in at least three of these five species, genetic drift has occurred (Liu et al., 2015). In the black snub-nosed monkey (Rhinopithecus strykeri), which has a remaining population of approximately 400 individuals (200 individuals in China and 200 individuals in Myanmar; Yang et al., 2019), genetic diversity in the mitochondrial control region indicates no variability (Andie et al., 2016). A greater understanding of the genetic diversity of threatened species is critical for developing effective management and conservation plans.
The Hainan gibbon (Nomascus hainanus) (Thomas, 1892) is endemic to China, and although it was once widespread across Hainan Province, it is now considered the world’s rarest ape, with a remaining population of only 33 individuals. These 33 Hainan gibbons are distributed in five groups (A, B, C, D, and E) that inhabit the Bawangling National Nature Reserve, which is a protected area of some 16 km2 (Deng et al., 2015). In the past 70 years, the Hainan gibbon population has declined by 99.4%and its habitat has declined by 99.9% (Liu et al., 1989; Zhou et al., 2005; Deng et al., 2015). Systematic field observations have been conducted in the reserve since 2001, and over the past 17 years, only two new breeding groups have been established. The genetic relationships among breeding individuals as well the sex of the offspring recently born into each family group remain unknown.
Previous genetic studies of the Hainan gibbon have focused either on broad phylogenetic analyses (Su et al., 1995; Zhang, 1995; Thinh et al., 2010a,b), or attempts to identify microsatellite diversity of the mitochondrial DNA (mtDNA) control region (Li et al., 2010; Bryant et al., 2016b). Unfortunately, sampling limitations have made it difficult to conduct a comprehensive genetic analysis, and therefore our understanding of genetic variation in this last remaining Hainan gibbon population is extremely limited.
In the current study, over the course of one year, we collected fresh fecal samples from Hainan gibbons inhabiting three groups and combined field surveys and DNA analysis to identify patterns of gene flow, genetic drift, inbreeding depression, and genetic variability in this Critically Endangered primate species. Based on the research of Bryant et al. (2016b), we selected 10 microsatellite markers to obtain detailed information on Hainan gibbon genetic diversity. Our goal was to use these data to develop an effective management strategy to protect the last remaining Hainan gibbon population.
Materials and Methods
Sampling and DNA Extraction
We studied Hainan gibbons inhabiting the Bawangling National Nature Reserve (19N 02′–19N 08′, 109 E 02′–09 E 13′), Hainan, China (Figure 1). Male and female Hainan gibbons display each morning by producing a set of highly stereotypic vocalizations. From September 2017 to December 2018, we monitored these vocalizations to identify group location (for groups A, B, C, and D; we did not monitor group E) and at these locations we collected fecal samples noninvasively and immediately after defecation (for groups A, B, and C). High-temperature sterilized tweezers and petri dishes were used to collect fecal samples, which were stored in liquid nitrogen, and then kept cold using dry ice to transport the samples back to our laboratory for cryogenic storage. We also collected blood samples from two yellow-cheeked gibbons (Hylobates gabriellae) housed at the Nanning Zoo, Guangxi, China, and used these for comparative analyses.
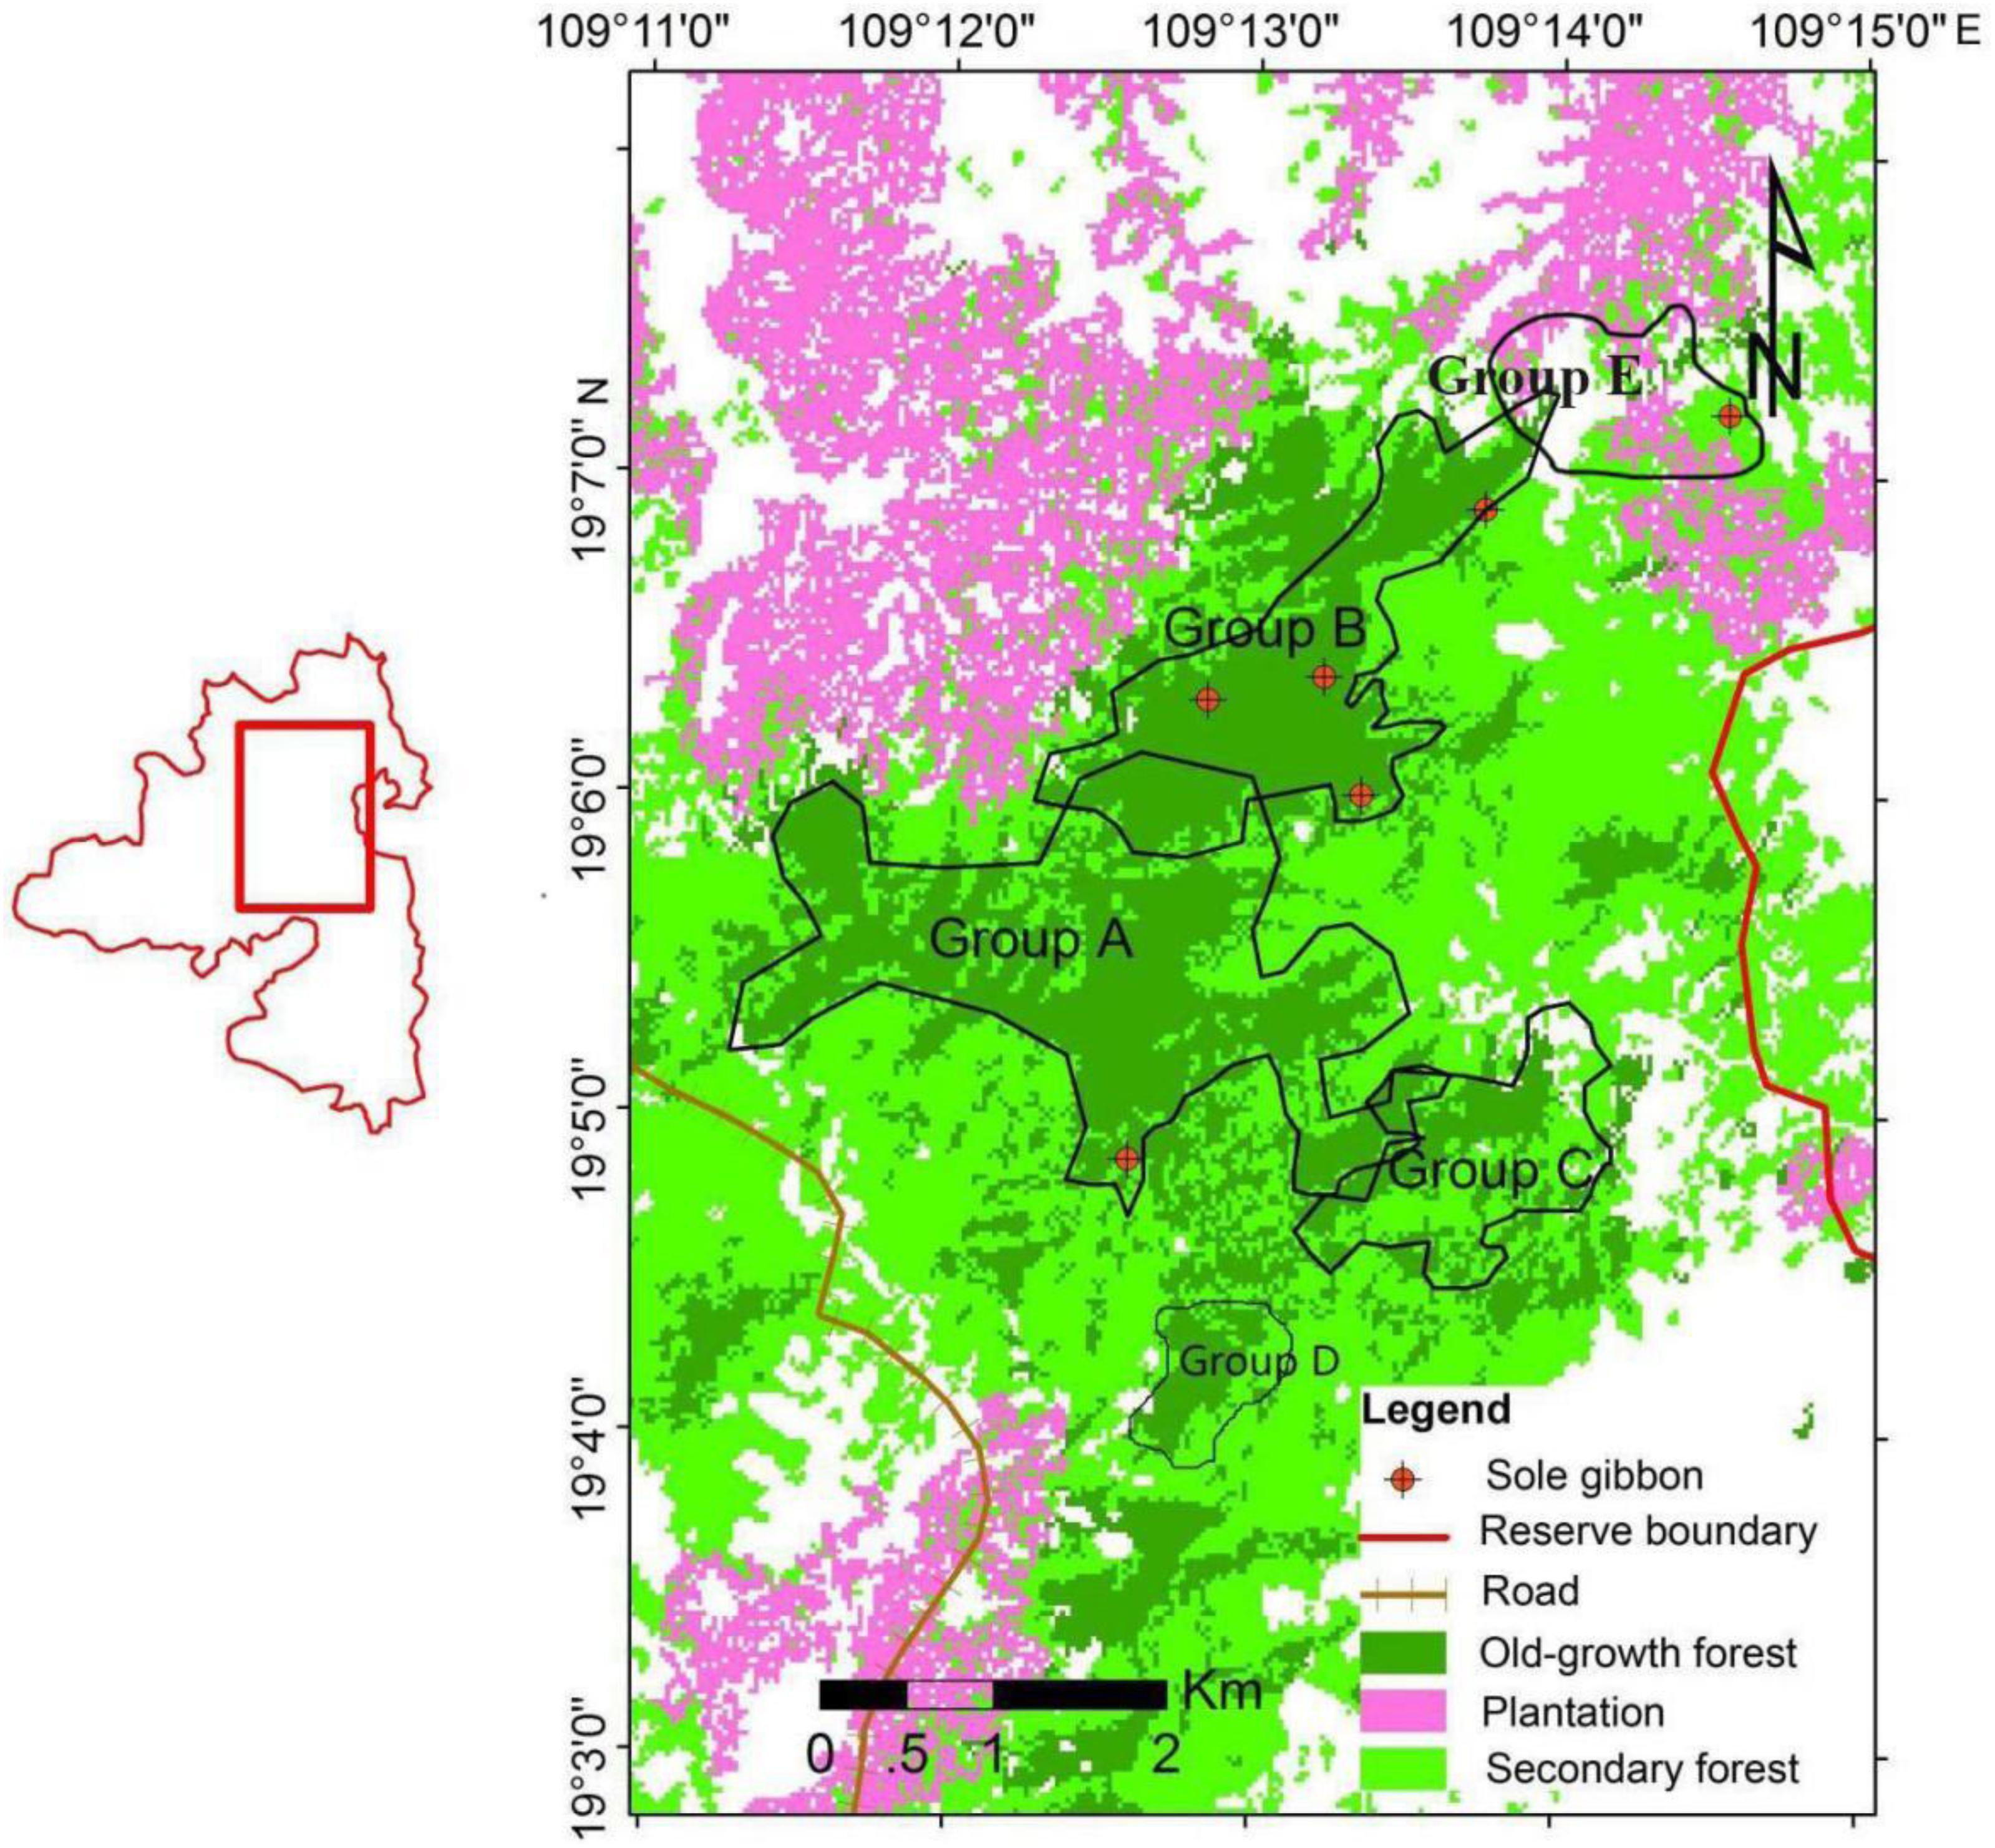
Figure 1. Distribution of the five remaining groups of Hainan gibbons (Group E was discovered in June 2020; the survey of this study does not include Group E).
We extracted DNA from 100 to 150 mg of feces using a QIAamp Fast DNA Stool Mini Kit and from 1 ml of blood using a QIAamp Blood & Cell Culture DNA Kit, following the manufacturer’s instructions. The extracted DNA was subjected to 0.8% agarose gel electrophoresis, GreenView nucleic acid dye staining, and the estimated concentration and purity (260/280, 260/230 value) were recorded using a UV transilluminator. At the same time, we employed a Qubit 3.0 fluorescence quantifier to accurately quantify the concentration of DNA.
Identification of Polymorphic Markers and Genotyping
Microsatellite Loci
We tested 10 microsatellite loci previously described to be polymorphic in Hainan gibbons (Bryant et al., 2016b). Using the method of searching for microsatellite loci in the whole genome (Hou et al., 2018), and based on the reference genome of the northern white-cheeked gibbon (Hylobates leucogenys), 20 microsatellite loci were screened. To guarantee high-amplification success, particularly for DNA sourced from noninvasive samples, we selected microsatellites with >20 repeats and a product length of 100–300 bp. From the library of microsatellites that met our requirements, we randomly selected loci comprising different motifs for further optimization.
DNA extracts from two blood samples obtained from captive yellow-cheeked gibbons were used to amplify the 30 loci (Supplementary File 1). Polymerase chain reaction (PCR) amplification was performed in a 10-μl reaction volume, containing 1 μl of template DNA, 1 μl of forward and reverse primers, respectively, 5 μl of QIAGEN Multiplex PCR Master Mix (Qiagen), and 2 μg/μl of bovine serum albumin (BSA). The amplification conditions were 94°C for 15 min, 35 cycles at 94°C for 30 s, 43–65°C for 45 s, 72°C for 45 s, and final extension at 72°C for 5 min. Polymerase chain reaction products were separated on 3% agarose gels by electrophoresis to visually assess the amplification efficiency.
Next, we filtered the reliably sites from the Hylobates gabriellae blood sample amplifications and used the fecal samples of the Hainan gibbons to select appropriate microsatellite loci. Human blood was used for comparison to ensure that there was no contamination during the DNA extraction process.
PCR products were visualized on an ABI3730 XL Genetic Analyzer. Alleles were scored using GENEMARKER version 2.2.0. Readable peak: peak reading at ≤100 and lower intensity peak ≤50% of the higher intensity peak (the peak reads 50), otherwise the reading was abandoned and set to 0. According to genotyping criteria for the number of repeated experiments outlined by Taberlet and Luikart (1999), the length of allele fragments and the data were counted according to the integer multiples of 2, 3, and 4 bp in the length of different alleles. These data were transposed into an Excel table for subsequent population genetic testing.
Sex Markers
Three primers from Palle and Tina (2006), Valiere (2002), and Bolechova et al. (2016) were tested. We used known females and males to test the reliability of these primers for determining sex identification.
Individual Identification
We used the MICROSATELLITE TOOLKIT to obtain individual genotype data from each fecal sample (Park, 2001; Zhan et al., 2007; Hou et al., 2018), and combined sex identification (see above) and field survey data to obtain individual identities.
Data Assess
Genotyping
The presence of null alleles and scoring errors for each locus was estimated using MICRO-CHECKER v 2.2.3. Next, we used three indices to assess the reliability of genotyping. (1) Genotyping errors that resulted in allelic dropout (ADO), false alleles (FA), ADO, and FA were calculated using GIMLET v 1.1.3. (2). PCR success rates were estimated by calculating the percentage of successful PCRs that matched the consensus genotype (Wulstch et al. 2014). (3) For a specific locus i, we calculated the mean quality index (QI) of n samples for that locus using the following equation (Miquel et al., 2006).
Where n is the number of samples and QIi, j the quality index of the ith locus for the jth sample. QIi,j is estimated by the proportion of correct genotypes in three PCR replicates.
We further calculated the quality index of each sample using Eq. 2 (e.g., jth sample) and we calculated the global quality index using Eq. 3: In Eq. 3, n and m represent the numbers of loci and samples, respectively.
Polymorphic Information Content and Hardy–Weinberg Equilibrium
To investigate the suitability of our markers, we calculated the polymorphic information content (PIC), which is an estimate of the discriminating power of markers (ranging from 0 to 1, from no allelic variation to only new alleles) (Botstein et al., 1980). We also tested markers for deviation from Hardy–Weinberg equilibrium (HWE). We assumed that deviation from HWE would indicate genotyping problems, such as segregating null alleles or incorrectly distinguished alleles.
Individual Recognition Ability
The individual identification ability of each loci can be determined by calculating the PID (probability of identity) value (Valiere, 2002; Zhan et al., 2007). We used the software Gimlet v1.1.3 to calculate the values of PID and PIDsib. Judgment criteria: PID < 0.001 and PIDsib < 0.01 (Waits et al., 2001; Hou et al., 2018). According to the curve produced by plotting the PID value of each locus, the closer the curve is to the X axis, the stronger the individual recognition ability.
Assessing Genetic Variation and Inbreeding
For each of the selected markers, we computed standard population genetic parameters of genetic variation. First, we calculated the expected heterozygosity (He), the observed heterozygosity (Ho), allelic frequencies, and the effective number of alleles. If the observed heterozygosity is lower than expected, this indicates inbreeding, while a higher than expected heterozygosity suggests the admixture of two previously isolated populations (Hartl and Clark, 1997). Furthermore, we determined inbreeding coefficients (FIS), with negative values indicating an excess of heterozygosity (Hedrick, 2000). We conducted all calculations in GeneALEx V.6.51 except the Wright F statistic (FIS), which we computed using FSTAT (version 2.9.3.) (Goudet, 2001).
Parentage Analysis
We used COLONY V.2.0.6.4 to conduct kinship analyses in order to infer the theoretical parental pair (Jones and Wang, 2010). We used the criterion probability of ≤95% to determine kinship (parent–child, mother–child, parental pair) (Wang and Santure, 2009; Bryant et al., 2016b; Wang, 2017).
Population Size Estimation
Based on linkage disequilibrium, we used NeEstimator V2.1 to calculate the effective population size.
Allele Loss
To detect allelic loss in our study population, we used genotype data from the microsatellite loci and compared those results with the historical population of Hainan gibbons presented in Bryant et al. (2016b).
Results
Study Population
We investigated the size and composition of four of the five remaining family groups of Hainan gibbons. The total population size of these four groups is 25 individuals (Figure 2). A total of 36 fecal samples were collected from three of these four groups, of which 6 samples were collected from Group A, 11 samples were collected from Group B, and 19 samples were collected from Group C. No genetic data were collected for Group D (Supplementary File 2).
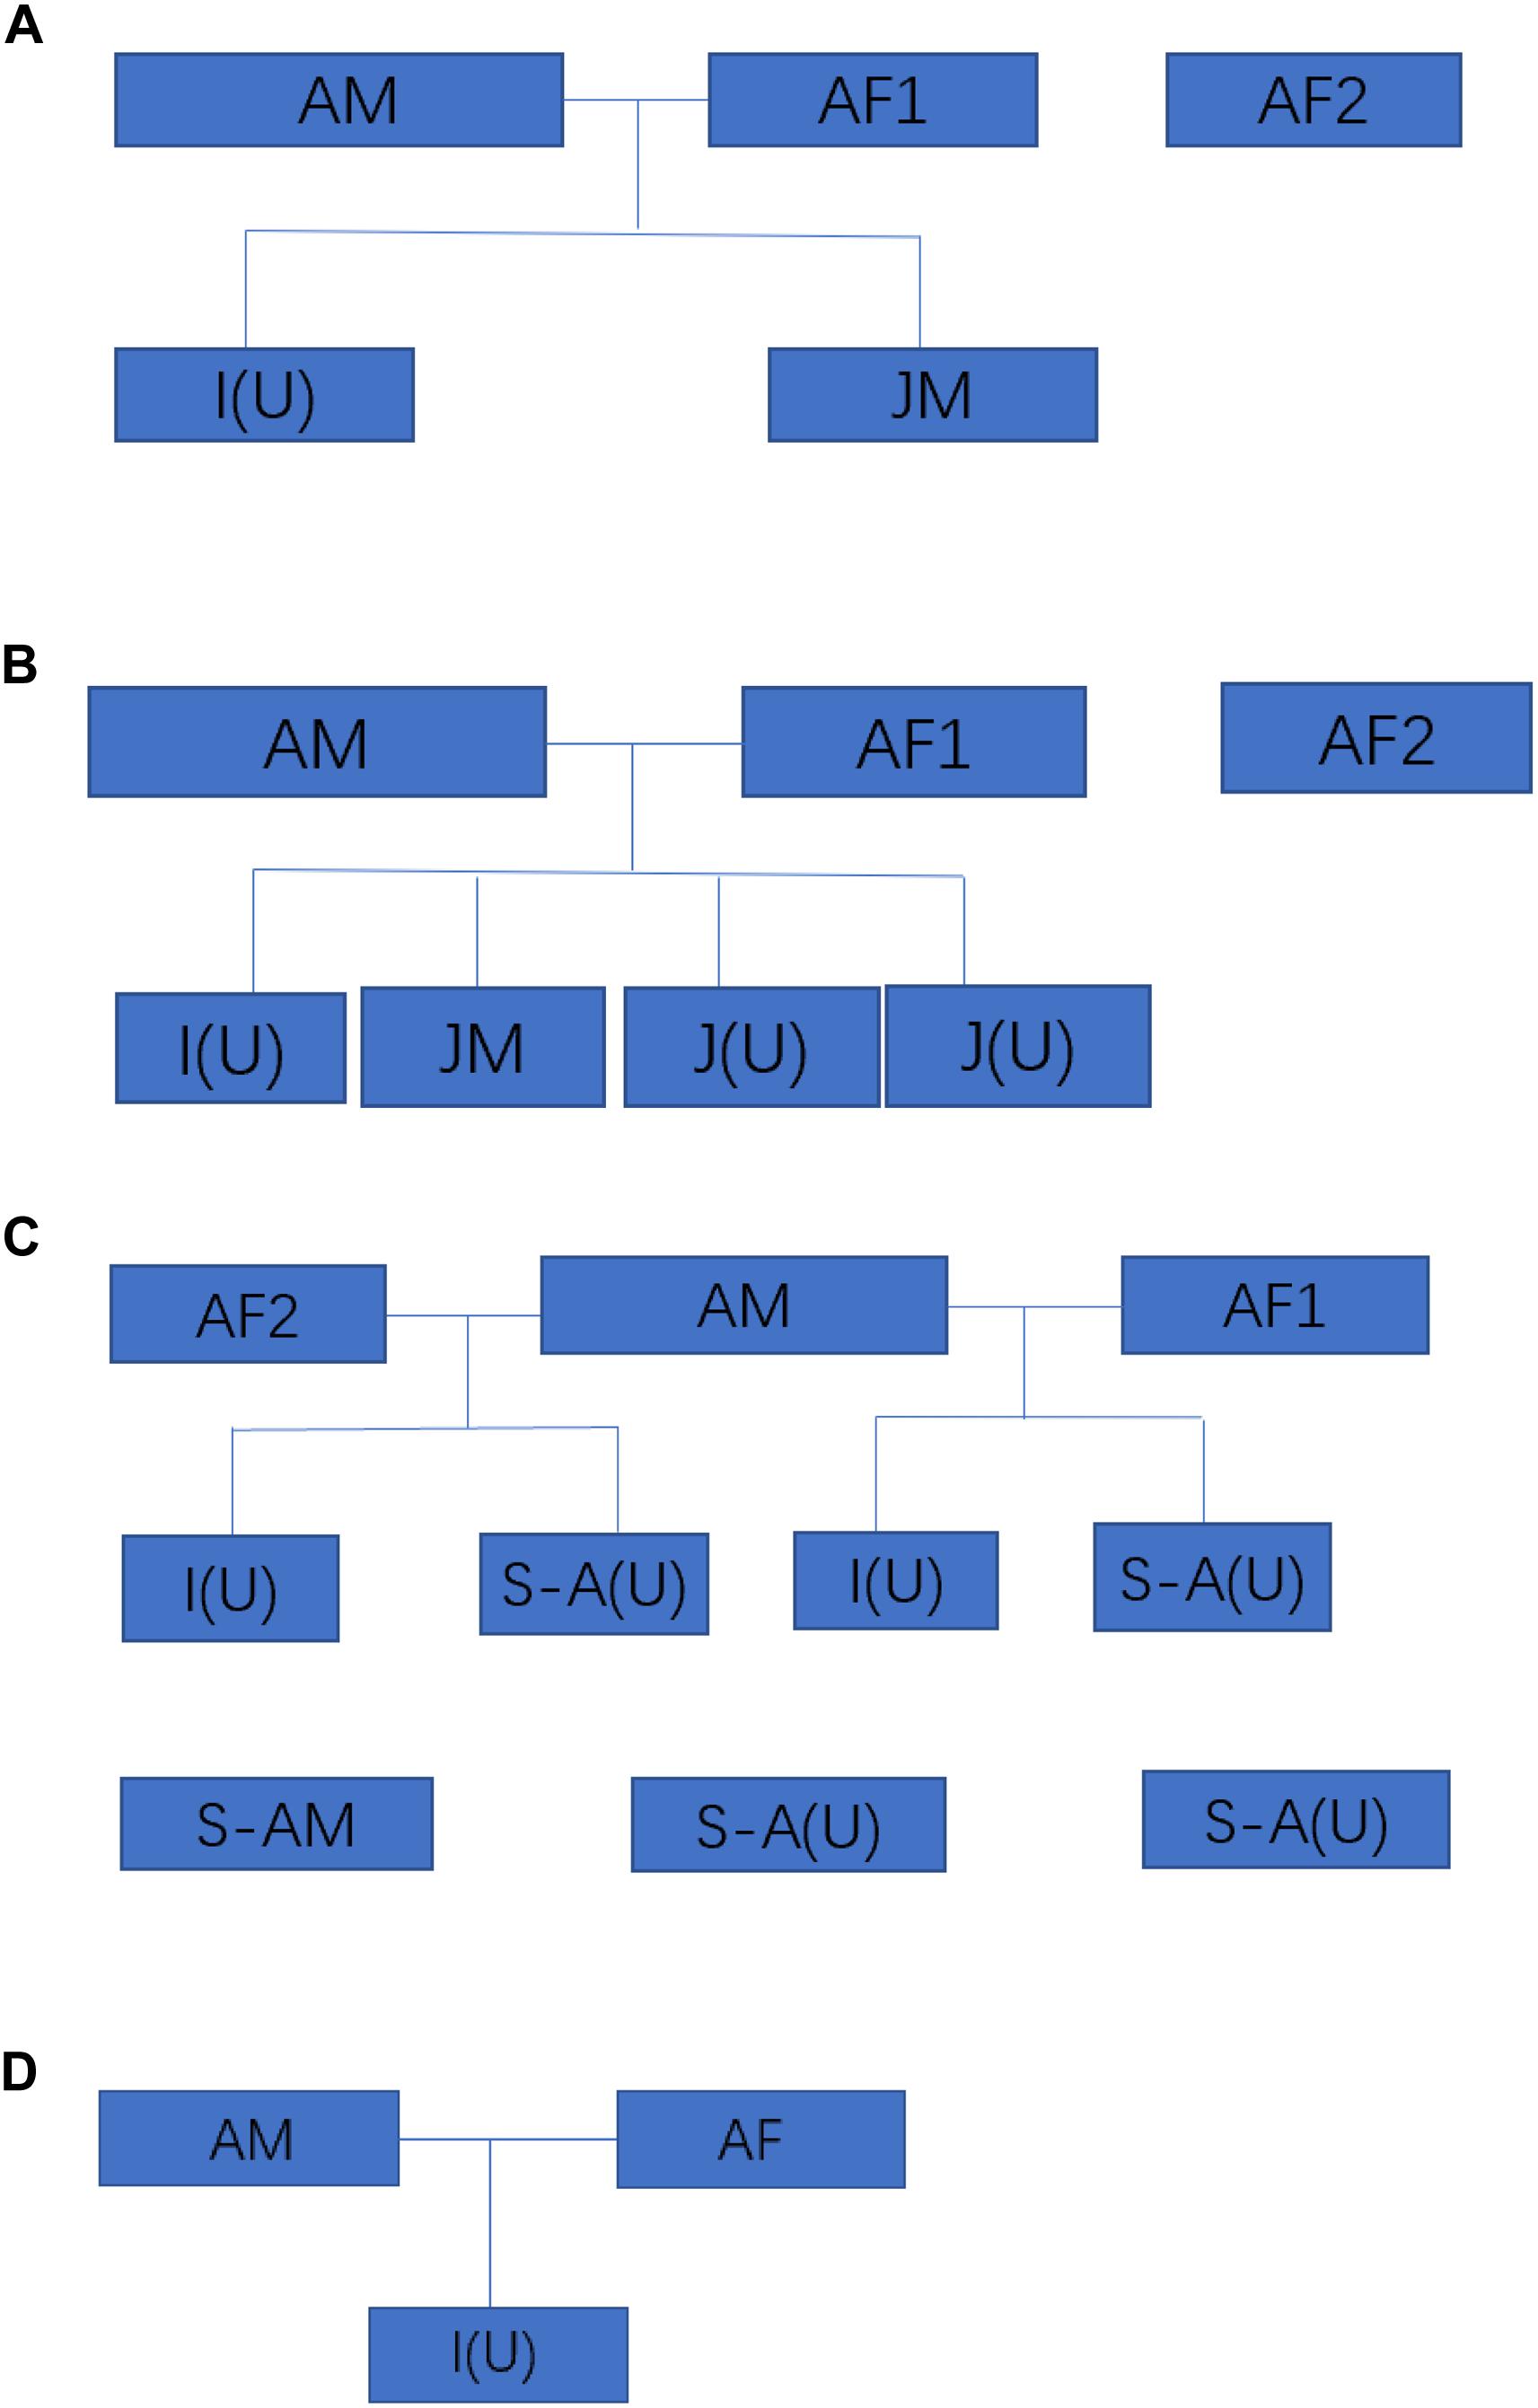
Figure 2. The size and composition four wild Hainan gibbon groups. AM represents an adult male, AF represents an adult female, S-A represents a subadult, JM represents a juvenile, I represents an infant, and (U) represents an adult, subadult, juvenile, or infant of unknown sex. Infants are 0–24 months of age, juveniles are >2–7 years of age, subadults are >7–9 years of age, and adults are >9 years of age.
Characterization of Markers
Microsatellite Markers
Overall, 33% (10/30) of the microsatellite markers tested suitable for investigating genetic diversity in the Hainan gibbon population. These included 6 tetranucleotide and 4 dinucleotide loci with 4–9 alleles per locus (Table 1 and Supplementary File 3).
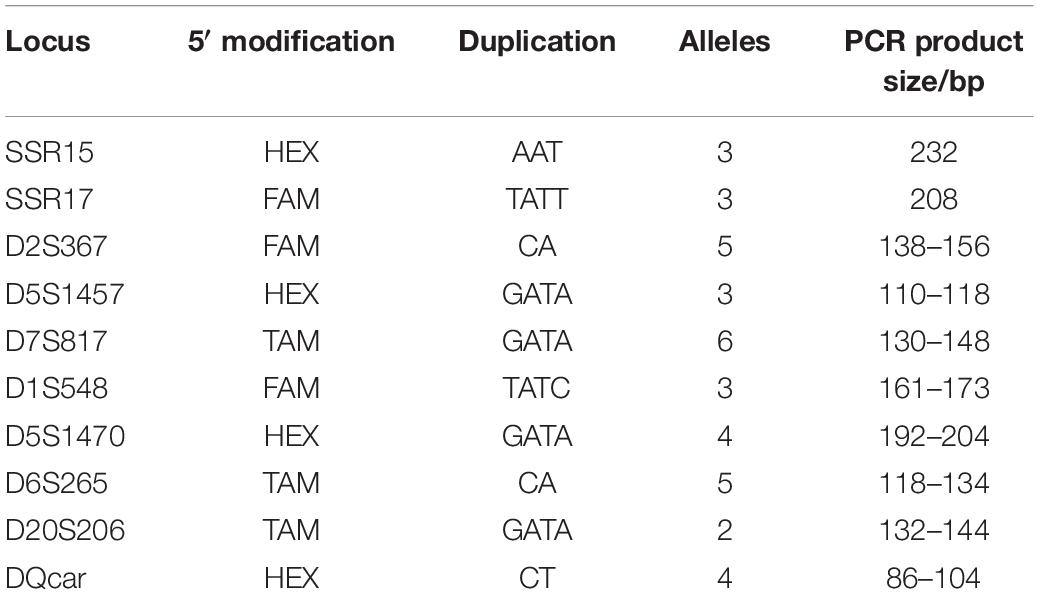
Table 1. Ten pairs of microsatellite loci and their primers.
Sex Markers
Comparing the electropherograms of the sex-marked PCR products, we found that PCR products numbered 1 to 8 had no bands in the blank control group, and the target bands were bright and the background was clean. Select A-UTXTUY_F1, A-UTXR1, A-UTYR1, A-SRY_F1, and A-SRY_R1 (Valiere, 2002) were found to be reliable as sex identification markers (Figure 3).
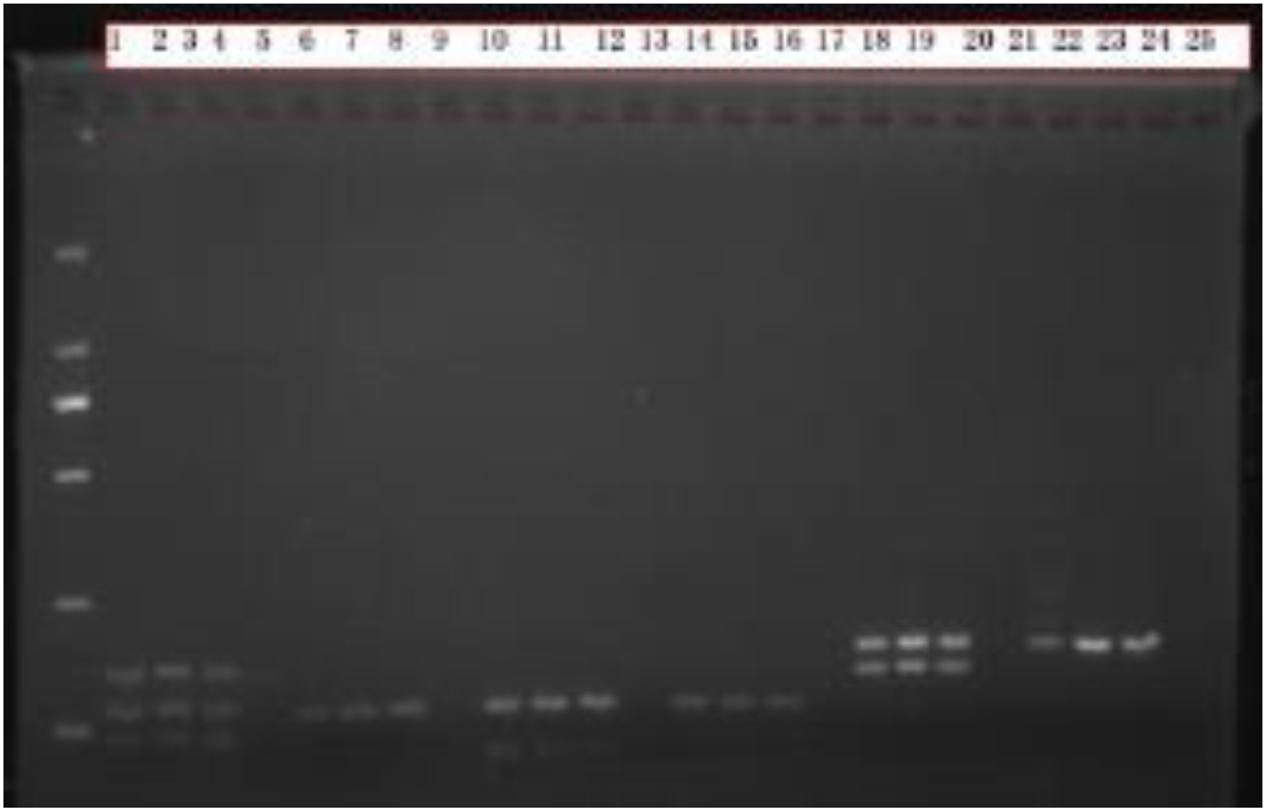
Figure 3. Sex identification electrophoresis test results. Males have 2–3 bands, females have only 1 band, and numbers 1–8 are the PCR products of Scheme A. The blank control group does not have any bands, the target band is bright, and the background is clean; Numbers 9–16 are the PCR products of Scheme B. The blank control group has no bands, the target bands have a clean background, and the bands are fuzzy; Numbers 17–25 are the PCR products of Scheme C. The blank control group has no bands, the target bands are bright, and the background is clean, but some samples have nonspecific amplification.
Individual Identification
Combined with the results of sex identification, a total of 12 different individuals (4 females and 8 males) were identified. These 12 individuals included three residents of Group A (1 female and 2 males, accounting for 60% of this group), four residents of Group B (1 female and 3 males, accounting for 57% of this group), and five residents of Group C (2 females and 3 males, accounting for 50% of this group). Fecal samples of infants (wet and scattered after voided) could not be collected. Overall, the 12 genetically identified Hainan gibbons accounted for approximately 67% of the total number of individuals present in the A, B, and C Groups (Table 2).
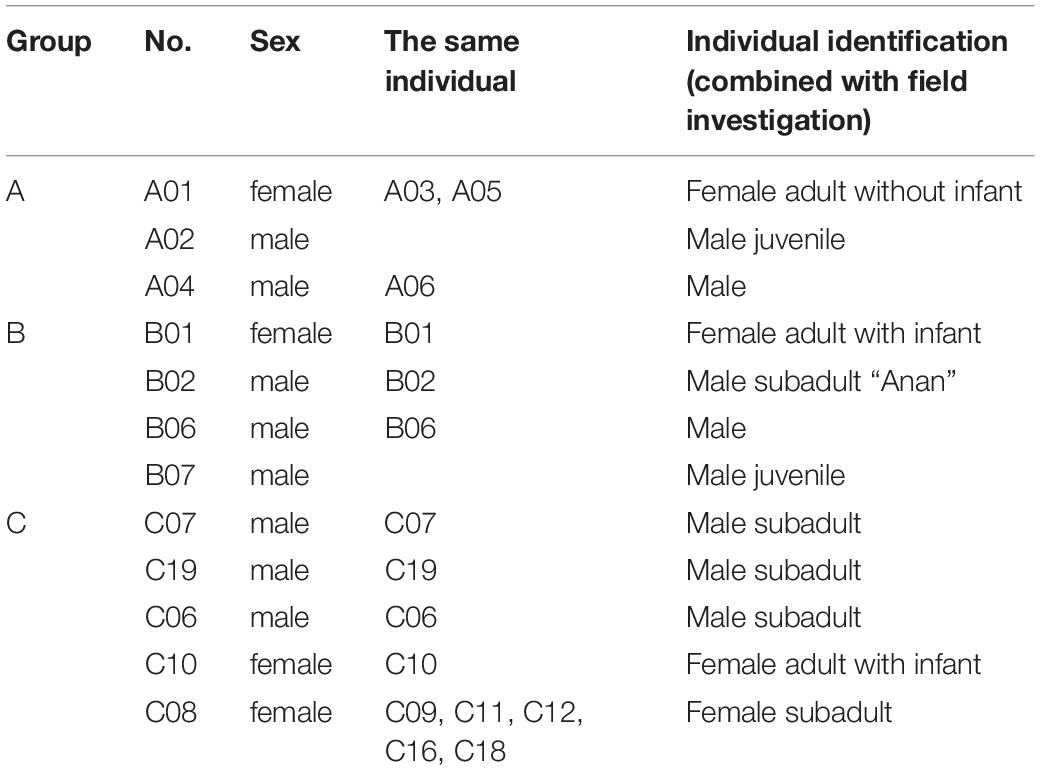
Table 2. Individual identification of residents in the A, B, and C Hainan gibbon social groups.
Performance of the Microsatellite System in Hainan Gibbons
None of 10 loci showed allelic loss, null alleles, or reading errors caused by stuttering (shadow peak). The amplification success rate was 74.09–100%, and the average amplification success rate was 93.40%. The quality index was 0.766–1, and the average quality index was 0.891.
The PIC results ranged from 0.1948 to 0.6682, suggesting that our markers had high discriminating power. The 10 loci all conformed to a Harvin equilibrium, indicating that the selected 10 microsatellite loci were all neutrally inherited (Table 3).
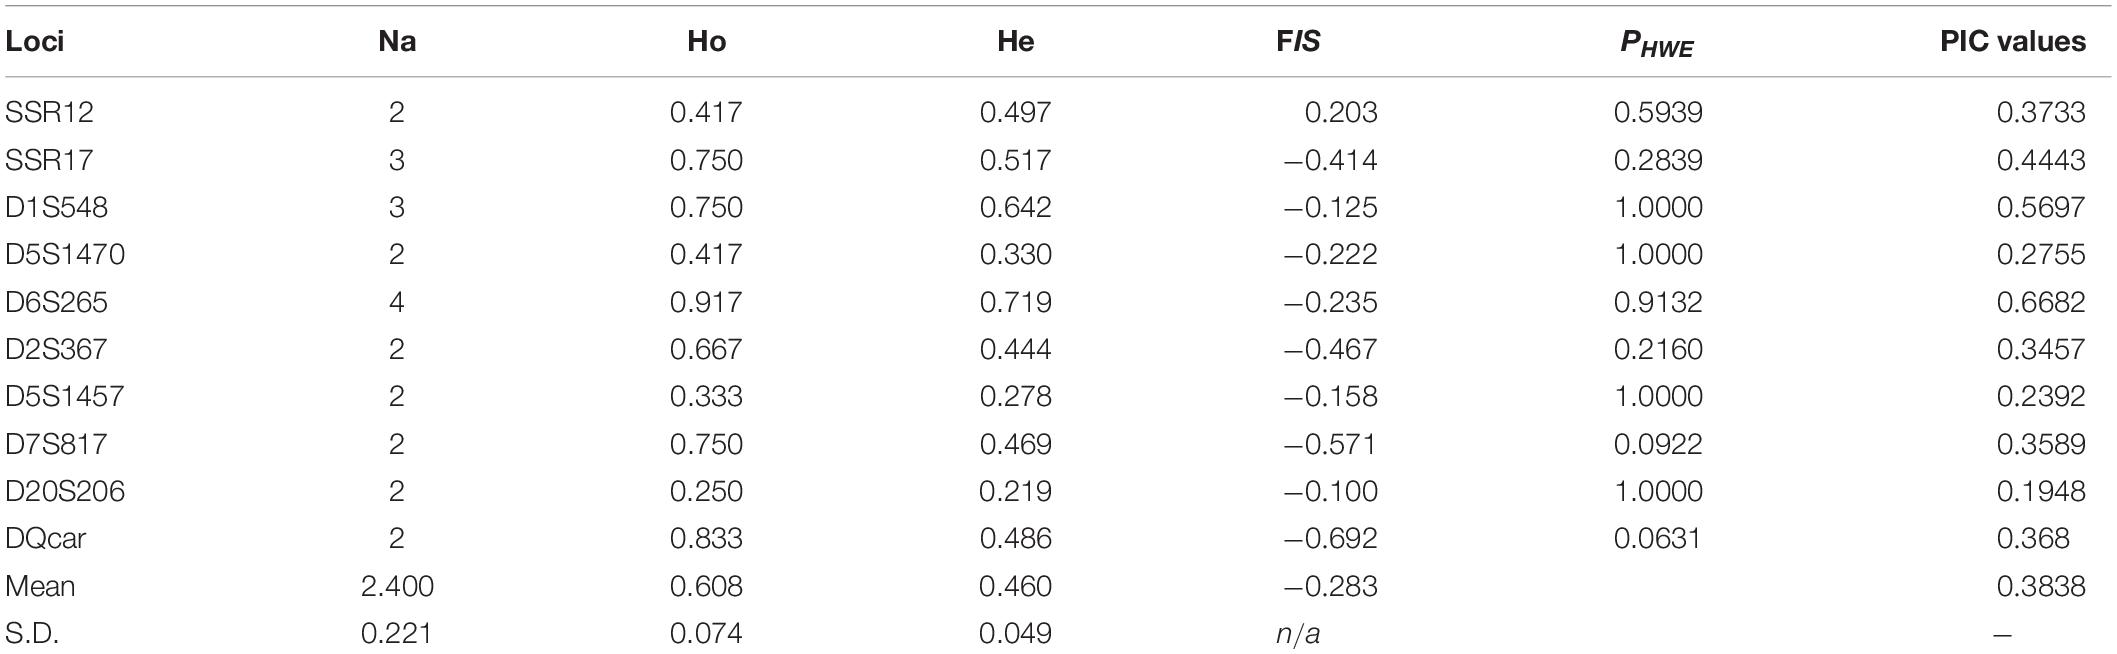
Table 3. Number of alleles (Na), observed and expected heterozygosity (Ho, He), polymorphic information content (PIC), inbreeding coefficient (FIS), and Hardy–Weinberg deviation (PHWE) for 10 selected markers with the mean and standard deviation (SD) across all markers.
Individual Recognition Ability P(ID)DQcar was <0.001, indicating that only five sites were useful in recognizing two unrelated individuals. Similarly, P(ID)sib D5S1457 was <0.01, and thus using data from 9 sites allowed us to recognize two related individuals (Figure 4). Therefore, the individual identification system of 10 sites in this study was sufficient for individual recognition of Hainan Gibbon.
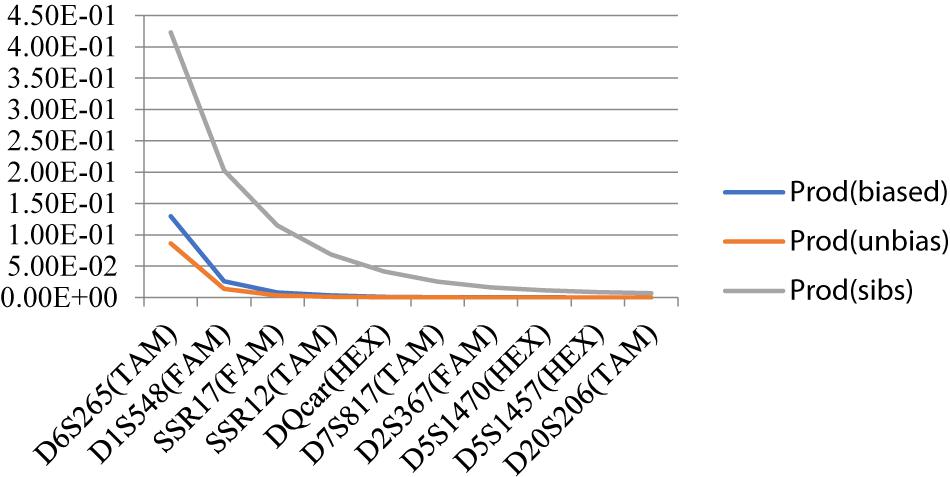
Figure 4. Individual identification system ability curve.
Sex Ratio
We found that across all three of our main study groups, there was a greater number of male Hainan gibbons than female Hainan gibbons. Of the 12 genetically identified individuals, 8 were males and four were females. In addition, of the 7 individuals for which parentage was determined, 6 were males and one was female. Based on the results of individual DNA identification, although this population contains many more males than females, the observed sex ratios of the offspring in Groups A, B, and C deviate from an expected 1:1 (Table 4).
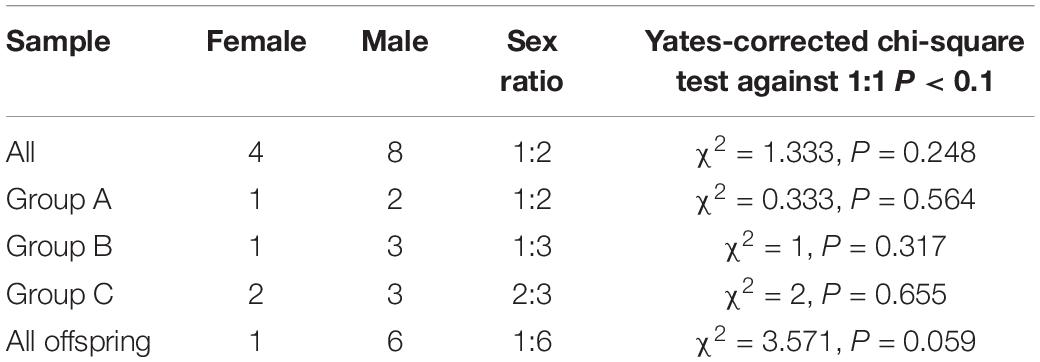
Table 4. Sex ratio of the Hainan gibbon study population.
Genetic Variation and Inbreeding
The observed heterozygosity (Ho) ranged from 0.250 to 0.917 and expected heterozygosity (He) from 0.219 to 0.719 (Table 3). The mean observed heterozygosity (mean ± SD = 0.608 ± 0.074) was greater than the mean expected heterozygosity (mean ± SD = 0.460 ± 0.049) (Table 3), In other words, although we expected approximately 46% of individuals to be heterozygous at a given locus under random mating conditions, on average 60% of individuals were heterozygous. Similarly, the mean FIS was −0.283 (mean), with FIS consistently <0 for all 12 polymorphic loci, indicating an excess of observed heterozygosity (see Hedrick, 2000, for comparison). Thus, individuals in our three study groups were less closely related than expected under random mating.
Parentage Analysis
We constructed a genetic pedigree (Figure 5) based on the results of kinship analysis (Table 5), Six individuals in Groups A, B, and C were identified as parent–child or full-sibs.
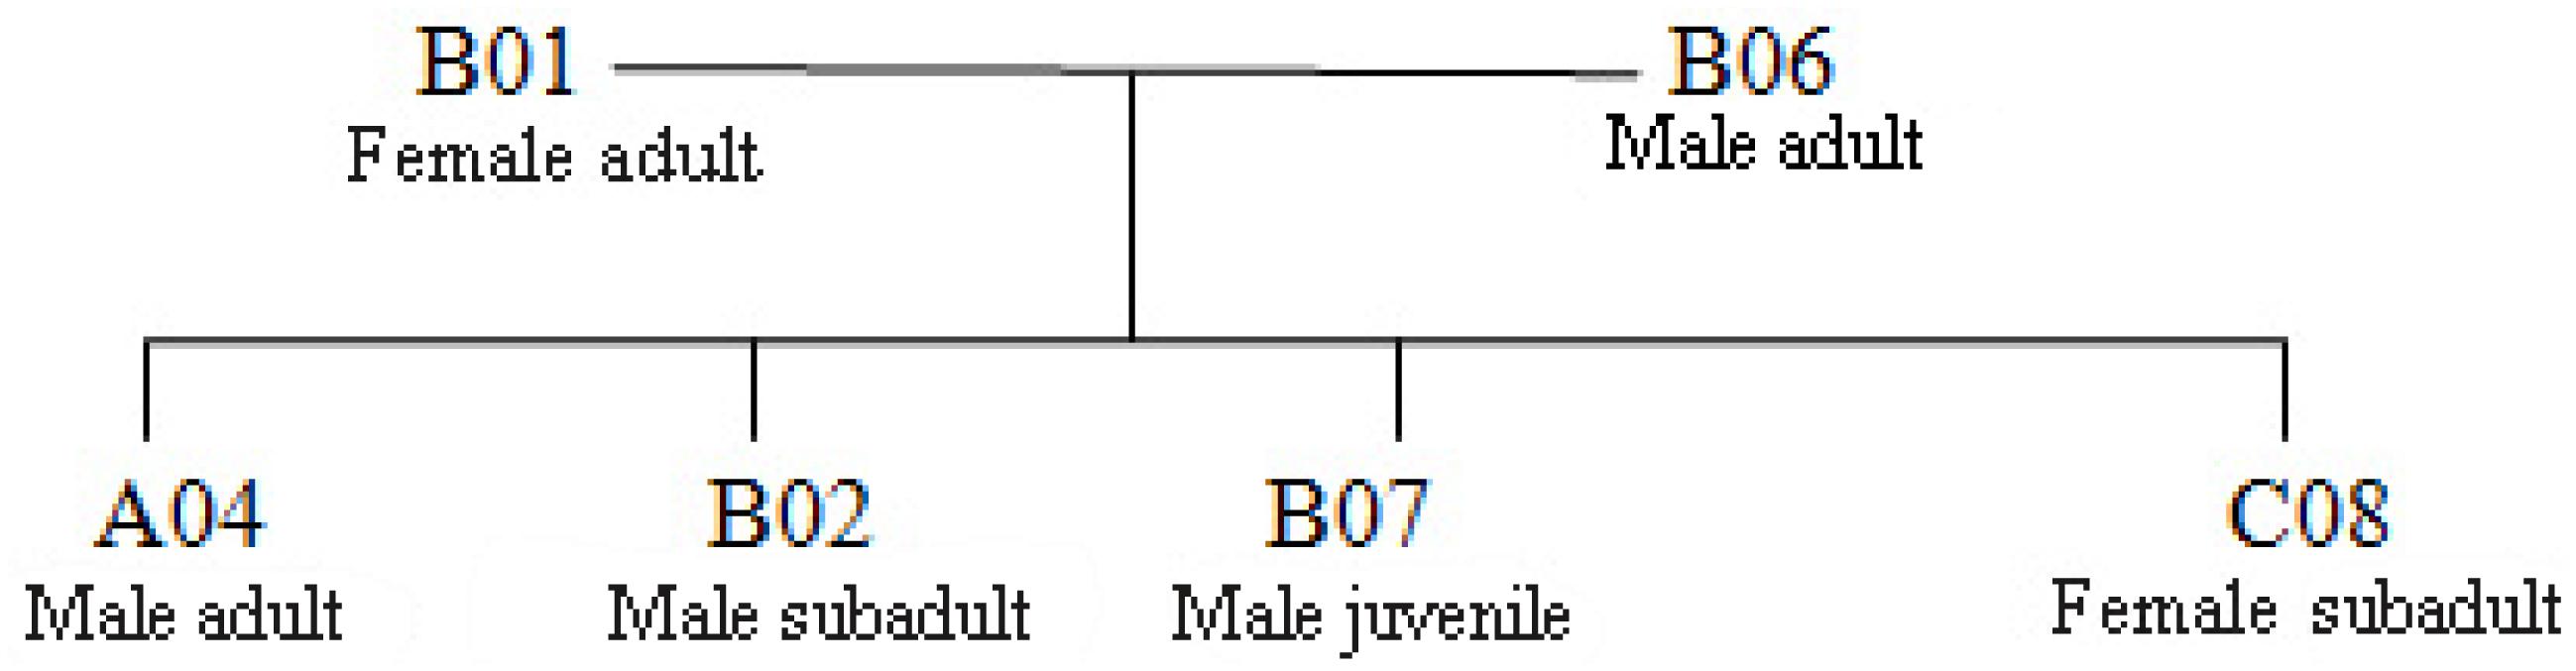
Figure 5. Genetic maps of 3 Hainan gibbon groups.

Table 5. Parent–offspring pair inferred using the software COLONY.
Population Size
The effective population size of the Hainan Gibbon is 5 (Table 6). The actual population is 33 individuals, and the ratio of effective population to actual population is 1:6.
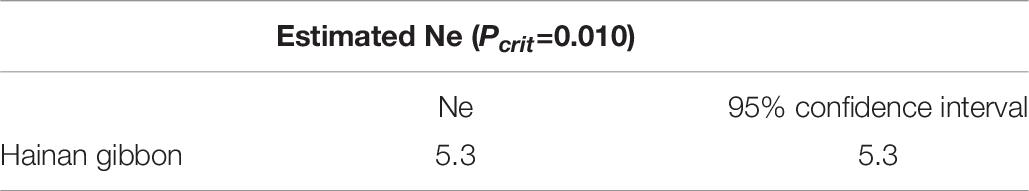
Table 6. Effective population size estimates of Hainan gibbon.
Allele Loss
We compared the published microsatellite genotyping data of the historical population of Hainan gibbons with our results (Bryant et al., 2016b). Among the 8 microsatellite loci we examined, the number of alleles at 7 microsatellite loci in the present Hainan gibbon population has decreased, allelic loss has occurred, and allelic frequency has changed (Supplementary File 4 and Table 7). Alleles fall into frequency classes (1–10). The current population showed fewer alleles in low-frequency classes and more in higher-frequency classes. This suggests that some alleles with low frequency recently have been lost in this population (Figure 6). This is consistent with the profile of a population characterized by a marked decline in genetic diversity.
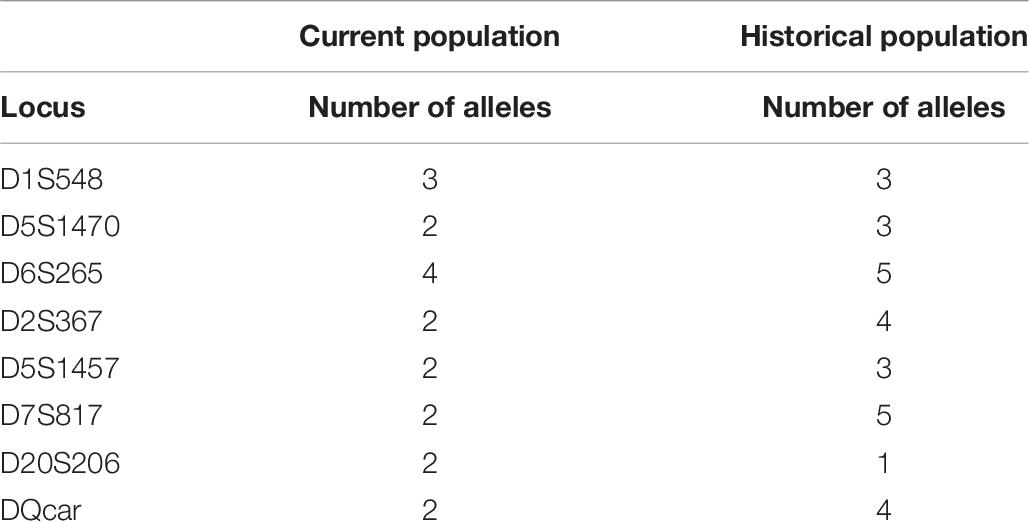
Table 7. The difference in the number of alleles at 8 microsatellite loci between the existing population and the historical population.
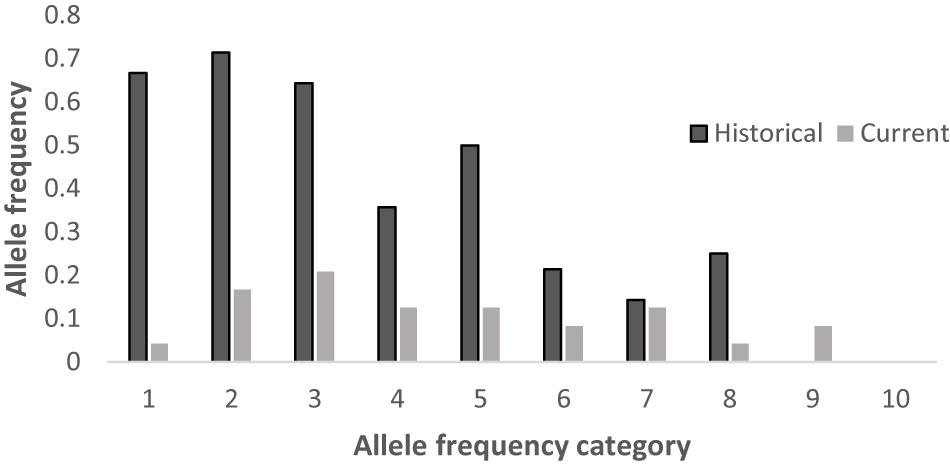
Figure 6. Distribution of allele frequencies for the historical and current populations across 8 loci.
Discussion
Sample Collection and Suitability of Selected Markers
This study represents the first integrated investigation of the population demography and genetic diversity of the critically endangered Hainan gibbon. We have conducted long-term field observations of this species, and in the present study we also collected and analyzed DNA (from feces) from 50 to 60% of all residents in three of the five remaining wild groups. Our DNA sampling coverage was greater than in any previous study of this species (Li et al., 2010; Bryant et al., 2016b). In this regard, as pointed out by Tajima (1982), a DNA sequencing sample size of >10 is expected to result in limited variance and a representative genetic profile.
Prior to 2007, field surveys reported the existence of only two wild groups of Hainan gibbons, Group A and Group B (Zhou et al., 2008). Subsequently, Group C was discovered in 2011. Group C was formed by the reorganization of individuals from groups A and B (Deng et al., 2015). In 2015, Bryant et al. (2016a) used the method of acoustic playback to identify a newly formed group of Hainan gibbons (Group D). In 2020, we located a fifth group of Hainan gibbons (Group E). Although our study did not collect genetic samples from residents of Group D or Group E, we assume that these groups were founded by members of Groups A, B, and/or C, and therefore from the perspective of population structure, the samples we collected are likely to reflect the genetic information present in Hainan gibbons.
The microsatellite markers used in this study fulfill important genetic and technical criteria that allow for high levels of precision and efficacy using high-throughput genotyping, which greatly improves the reliability of the genetic information (Butler et al., 2001). Twenty microsatellite loci were screened from the reference genome of Hylobates leucogenys, a close relative of the Hainan gibbon. The availability of several reference genomes provides valuable resources for genetic marker identification, and this resulted in simpler procedures for sample preparation and provided a larger amount of genetic information than other types of sequencing data (e.g., transcriptome). Compared with other types of genetic markers (SNPs), microsatellites have relatively high amplification success rates, especially for noninvasive samples, and have been used widely for individual identification in avian populations (Hou et al., 2018). Our results show that the 10 microsatellites used in this study provided reliable information on the sex and genotype of individual Hainan gibbons, provided high confidence paternity assignment, presented a relatively high level of polymorphic information and genetic variation, and resulted in a high accuracy of allelic characterization and a low occurrence or absence of mutations.
Declining Genetic Diversity
At the microsatellite level, the genetic diversity of the Hainan gibbon population is significantly lower than that reported in other gibbon species. For example, the number of alleles (Na) of the lar gibbon (Hylobates lar) is 7 and the expected heterozygosity (He) is 0.725 (Chambers et al., 2004); the number of alleles (Na) in Müller’s gibbon (Hylobates muelleri) is 14.8 (Oka and Takenaka, 2001). Similarly, the Endangered Borneo elephant (Elephas maximus), which today is only distributed in the northeastern part of Sabah, Malaysia, and has a remaining population of only 2,000 individuals, also is characterized by low genetic diversity (Ho = 0.14–0.41) and significant inbreeding (Fis = 0.14–0.38) (Benoit et al., 2016). In the case of the Mexican howler monkey (Alouatta palliata mexicana), a Critically Endangered subspecies endemic to Mexico, extensive habitat loss and fragmentation over the past 30 years have resulted in a major population decline. Presently, this primate taxon is distributed in four forest fragments in the state of Veracruz, Mexico. Genetic testing revealed that haplotype diversity and nucleotide diversity (h = 0.486; π = 0.0007) are extremely low compared with other Neotropical primates (Jacob et al., 2014).
The low genetic diversity of the remaining Hainan gibbon population is consistent with their severe population decline (99.4%), which has occurred over the past 70 years (Zhou et al., 2008). Their current population size of only 33 individuals is the result of extreme deforestation and forest fragmentation that has decreased their remaining area of suitable habitat from 27,784 km2 (Zhou et al., 2005) to approximately 16 km2 (Zhou et al., 2008). The number of alleles in the existing population, and therefore its genetic diversity, is far less than historically reported (Bryant et al., 2016b) and extremely low compared to other primate populations.
Probability of Inbreeding in the Future
The social and breeding system of Hainan gibbons is described as monogamous (Liu et al., 1989; Zhou et al., 2008). When the number of reproducing males in a population is small, binomial sampling error occurs, and the frequency of alleles contributed by paternal and maternal lines is unequal (Storz et al., 2001). Our analysis indicated no evidence of inbreeding in the existing population of Hainan gibbons. The excessive heterozygotes (FIS <0) reveal that mating in the current population is biased toward individuals with relatively distant relationships. Combining kinship analysis with behavioral field observation, the genetic pedigrees of the 12 identified Hainan gibbons indicate high levels of relatedness among individuals in Groups A, B, and C (Figure 7). Also, the offspring sex ratio deviates significantly from 1:1; given the large number of males in the population, we anticipate high levels of inbreeding in the future. Inbreeding may build up over a much longer time frame than relatedness. Next, we will use genome technology to deeply analyze the mechanism of inbreeding.
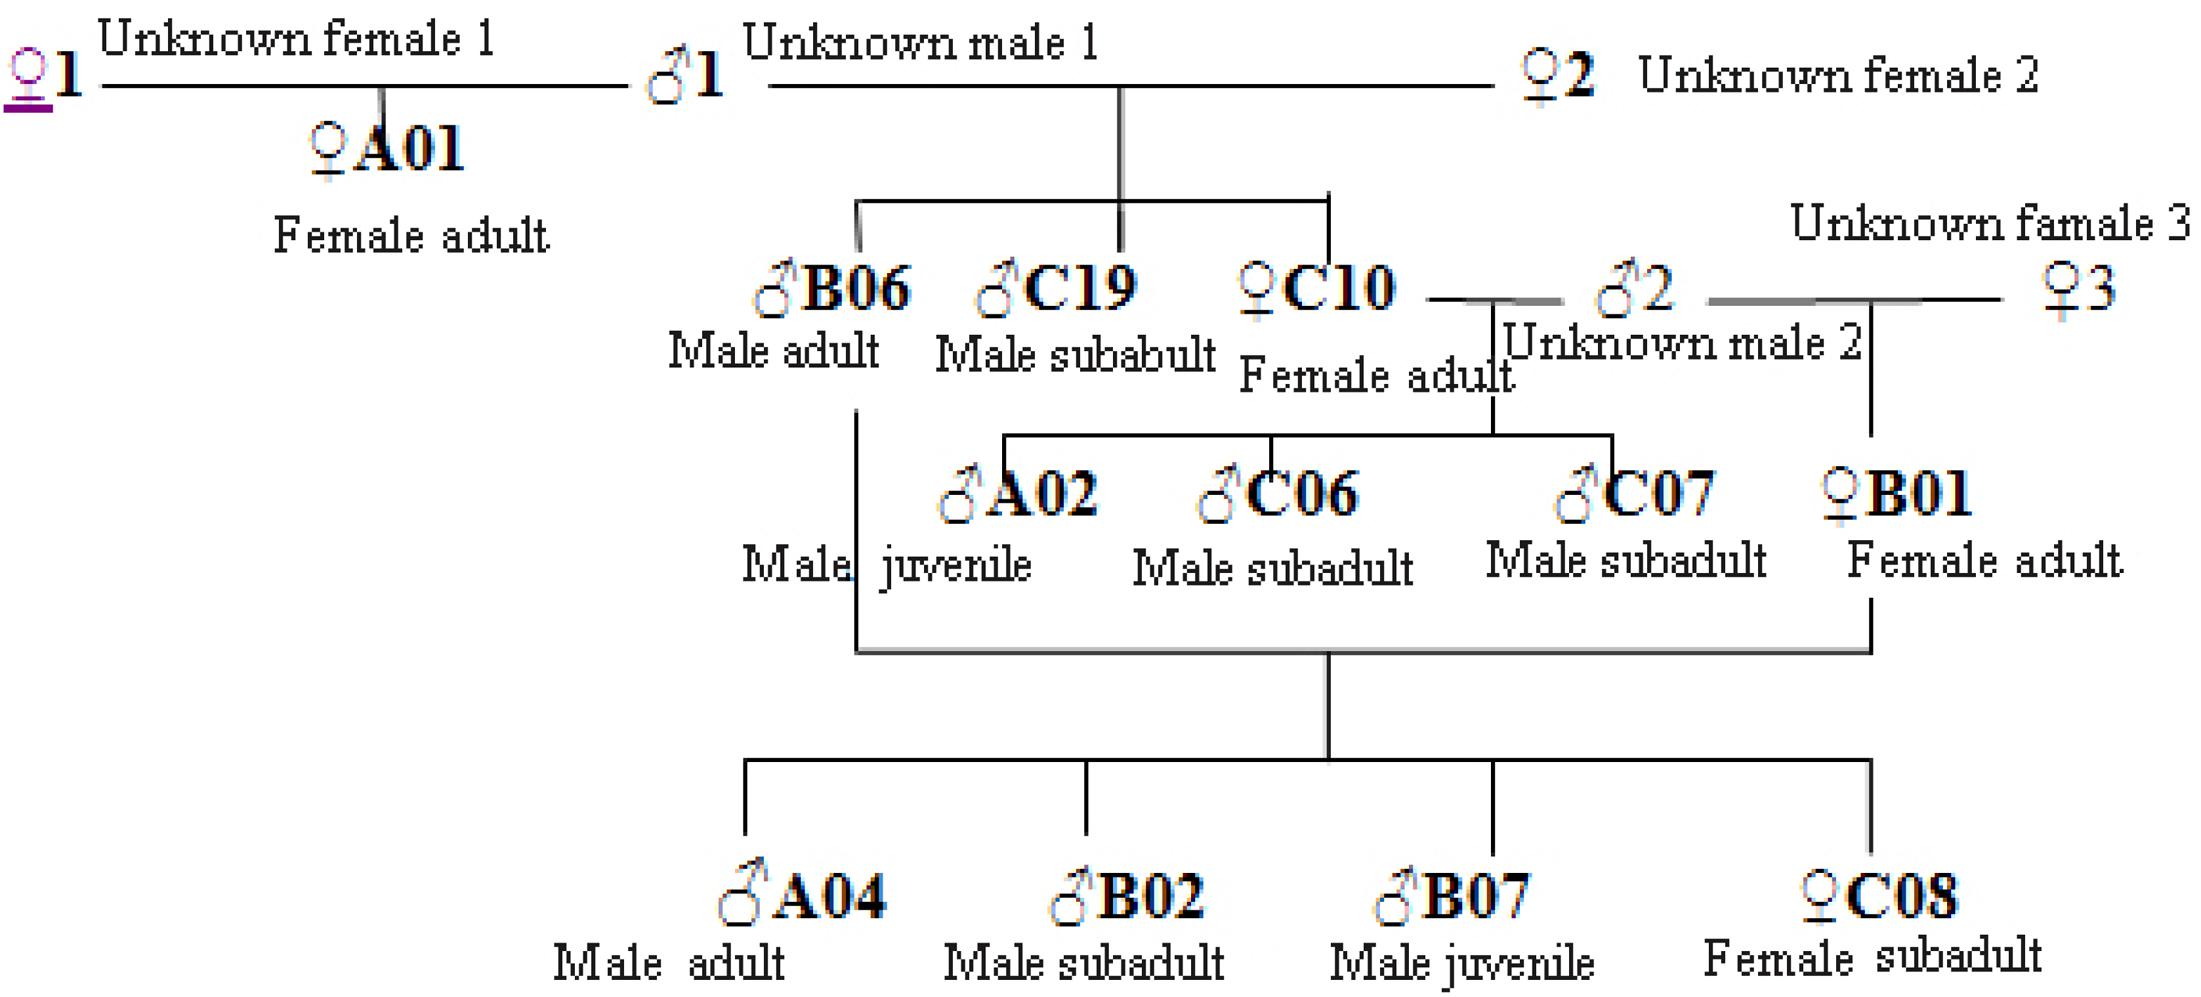
Figure 7. Kinship diagram of individuals in Groups A, B, and C. Based on these results, both males and females transfer between established groups, and given the existence of new groups (D and E), individuals periodically form new groups.
Long-Term Survival Goals
The remaining area of suitable habitat for Hainan Gibbons is extremely small and highly fragmented. Low genetic diversity of the population is likely the result of founder effect and a sharp decline in effective population size (Frankham, 1997; Groombridge et al., 2009). Compared with the effective population size of the historical population (Ne = 1162.96), the effective population size of the existing population (Ne=5.3) has been significantly reduced. When the effective population size (Ne) is <50, population viability decreases significantly (Madsen et al., 1999). The long-term evolutionary survival of any population is expected to require an Ne ≥1000 (Frankham et al., 2014).
In the 1970s, the total Hainan gibbon population in the Bawangling National Nature Reserve was 7–8 individuals (Zhou et al., 2005). It has taken more than 40 years for this population to reach its current size of 33 individuals (rate of 0.625 individuals added to the population per year). Given their relatively slow life history (individuals do not reach adulthood until >9 years of age and females give birth every 2–4 years), the long-term viability of the current Hainan gibbon population remains doubtful unless there is an immediate and significant reforestation effort and targeted programs to protect the remaining Hainan gibbon population.
Conservation and Management
Given their limited remaining habitat, low genetic diversity, extremely small effective population size, and high potential inbreeding for inbreeding, we plan to establish a genetic profile for each of the remaining 33 Hainan gibbons. This will allow us to monitor both behaviorally and genetically the degree of population inbreeding and potential for disease transmission and, if necessary, intervene to promote increased genetic variability and population health. We also propose that the Bawangling National Nature Reserve immediately initiates a program to professionally train reserve staff so that they can continuously monitor the behavior, diet, and demography of individuals in all five gibbon groups and reforest and restore the current fragmented habitat in ways to minimize the negative impact of human disturbance on gibbon survivorship. Finally, efforts must be made to strengthen communication and cooperation among all stakeholders and reach a scientifically based consensus on measures that must be taken to ensure the long-term survival of the last remaining Hainan gibbon population.
Data Availability Statement
The datasets presented in this study can be found in online repositories. The names of the repository/repositories and accession number(s) can be found in the article/Supplementary Material.
Ethics Statement
Ethical review and approval was not required for the animal study because Noninvasive sampling method.
Author Contributions
JZ, JC, and NX designed the study. YG wrote the manuscript and analyzed the data. LH completed the experiments and analyzed the data. PG wrote the manuscript. TL and GL conducted the field investigations. All authors contributed to the article and approved the submitted version.
Funding
This work was supported by the project of the National Natural Science Foundation Project of Research on Conservation Genetics of Hainan Gibbon (31770456); Ministry of Science and Technology of the People’s Republic of China major project (2016YFC0503200); Science and Technology Program of Guizhou Province: the Key Project of Science and Technology Program of Guizhou Province (20182780); Science and Technology Program of Guizhou Province: Ecological Study on Viruses Carried by Bats in Guizhou Province (20161004); Strategic Priority Research Program of the Chinese Academy of Sciences (XDA23080201); Biodiversity Survey, Monitoring and Assessment Project of Ministry of Ecology and Environment, China (2019HB2096001006); The Project for National Top Discipline Construction of Guizhou Province: Geography in Guizhou Normal University (201785-01); and Reproductive Biology of Hainan Gibbon of Hainan National Park Research Institute.
Conflict of Interest
The authors declare that the research was conducted in the absence of any commercial or financial relationships that could be construed as a potential conflict of interest.
Acknowledgments
We thank Chrissie, Sara, Jenni, and Dax for their continued support and insights into the importance of kinship in understanding primate evolution.
Supplementary Material
The Supplementary Material for this article can be found online at: https://www.frontiersin.org/articles/10.3389/fgene.2020.608633/full#supplementary-material
References
Andie, A., Amrita, S., Rudolf, M., Tuong, B. L., Quyet, K. L., and Herbert, C. (2016). No evidence for mitochondrial genetic variability in the largest population of critically endangered tonkin snub-nosed monkeys in vietnam. Primates. 57, 449–453. doi: 10.1007/s10329-016-0571-x
Benoit, G., Reeta, S., Nurzhafarina, O., Célia, K. R., Rosdi, S. M. A., Laurentius, N. A., et al. (2016). Habitat fragmentation and genetic diversity in natural populations of the bornean elephant: implications for conservation. Biol. Conserv. 196, 80–92. doi: 10.1016/j.biocon.2016.02.008
Bolechova, P., Jecminkova, K., and Hradec, M. (2016). Sex determination in gibbons of genus Nomascus using non-invasive method. Act. vet. Brno. 85, 363–366. doi: 10.2754/avb201685040363
Botstein, D., White, R. L., Skolnick, M., and Davis, R. W. (1980). Construction of a genetic linkage map in man using restriction fragment length polymorphisms. Am. J. Hum. Genet. 32, 314–331.
Bryant, J. V., Gottelli, D., Zeng, X., Hong, X., Chan, B. P., Fellowes, J. R., et al. (2016a). Assessing current genetic status of the hainan gibbon using historical and demographic baselines: implications for conservation management of species of extreme rarity. Mol. Ecol. 25, 3540–3556. doi: 10.1111/mec.13716
Bryant, J. V., Brule, A., and Wong, M. H. G. (2016b). Detection of a new Hainan gibbon (Nomascus hainanus) group using acoustic call playback. Int J Primatol. 37, 534–547. doi: 10.1007/s10764-016-9919-8
Butler, J. M., Ruitberg, C. M., and Vallone, P. M. (2001). Capillary electrophoresis as a tool for optimization of multiplex PCR reactions. Fresen J Anal Chem. 369, 200–205. doi: 10.1007/s002160000641
Chambers, K. E., Reichard, U. H., and Moller, A. (2004). Cross-species amplification of human microsatellite markers using noninvasive samples from white-handed gibbons (Hylobates lar). Am. J. Primatol. 64, 19–27. doi: 10.1002/ajp.20058
David, H. R., and Richard, F. (2003). Correlation between fitness and genetic diversity. Conserv. Biol. 17:230e237. doi: 10.1046/j.1523-1739.2003.01236.x
Deng, H. Q., Zhang, M. X., and Zhou, J. (2015). Recovery of the critically endangered Hainan gibbon Nomascus hainanus. Fau Flo In. 51, 161–165. doi: 10.1017/S0030605315000678
Estrada, A., Garber, P. A., Rylands, A. B., Roos, C., Fernandez-Duque, E., Fiore, A., et al. (2017). Impending extinction crisis of the world’s primates: why primates matter. Sci Adv. 3:e1600946. doi: 10.1126/sciadv.1600946
Fan, P. F., Fei, H. L., and Luo, A. D. (2013). Ecological extinction of the critically endangered northern white-checked gibbon Nomascus leucogenys in china. Fau Flo In. 48, 52–55. doi: 10.1017/S0030605312001305
Frankham, R. (1997). Do island populations have less genetic variation than mainland populations? Heredity 78, 311–327. doi: 10.1038/hdy.1997.46
Frankham, R., Ballou, J. D., and Briscoe, D. A. (2009). An Introduction to Conservation Genetics. Cambridge: Cambridge University Press.
Frankham, R., Bradshaw, C. J. A., and Brook, B. W. (2014). Genetics in conservation management: revised recommendations for the 50/500 rules. red list criteria and population viability analyses. Biol. Conserv. 170, 56–63. doi: 10.1016/j.biocon.2013.12.036
Goudet, J. (2001). FSTAT, a program to estimate and test gene diversities and fixation indices (version 2.9.3). Available Online at: http://www.unil.ch/izea/softwares/fstat.html.
Groombridge, J. J., Dawson, D. A., Burke, T., Prys-Jones, R., Brooke, M., de, L., et al. (2009). Evaluating the demographic history of the Seychelles kestrel (Falco araea): genetic evidence for recovery from a population bottleneck following minimal conservation management. Biol. Conserv. 142, 2250–2257. doi: 10.1016/j.biocon.2009.04.026
Hartl, D. L., and Clark, A. G. (1997). Principles of population genetics, 3rd Edn. (Sutherland: Sinauer Associates).
Hemmings, N. L., Slate, J., and Birkhead, T. R. (2012). Inbreeding causes early death in apasserine bird. Nat. Commun. 3:863. doi: 10.1038/ncomms1870
Hoelzel, A. R. (1997). Molecular ecology of pinnipeds. In: Molecular genetics of marine mammals. Special Publication, 3. (Lawrence, USA: Society for Marine Mammalogy).
Hou, X., Xu, P. W., and Jackson, J. D. U. (2018). An integrated tool for microsatellite isolation and validation from the reference genome and their application in the study of breeding turover in an endangered avian population. Integr. Zool. 13, 553–568. doi: 10.1111/1749-4877.12305
Iucn (2020). The IUCN Red List of Threatened Species. Version 2020-2. Available Online at: https://www.iucnredlist.org/
Jacob, C., Dunn, A. S. G., Jurgi, C. A., Liliana, C. O., Ernesto, R. L., and Leslie, A. K. (2014). Limited genetic diversity in the critically endangered mexican howler monkey (Alouatta palliata mexicana) in the selva zoque. Mexico. Primates. 55, 155–160. doi: 10.1007/s10329-013-0399-6
Jones, O. R., and Wang, J. L. (2010). COLONY: a program for parentage and sibship inference from multilocus genotype data. Mol. Ecol. Resour. 10, 551–555. doi: 10.1111/j.1755-0998.2009.02787.x
Li, B., Li, M., Li, J., Fan, P., Ni, Q., Lu, J., et al. (2018). The primate extinction crisis in china: immediate challenges and a way forward. Biodivers. Conserv. 27, 3301–3327. doi: 10.1007/s10531-018-1614-y
Li, Z. G., Wei, F. W., and Zhou, J. (2010). Sequence analysis of mitochondrial D-loop region of hainan gibbon and population rejuvenation. Biodiversity 18, 523–527. doi: 10.3724/SP.J.1003.2010.523
Lindsey, H. A., Gallie, J., Taylor, S., and Kerr, B. (2013). Evolutionary rescuefrom extinction is contingent on a lower rate of environmental change. Nature 494, 463–467. doi: 10.1038/nature11879
Liu, Z. H., Zhang, Y. Z., Jiang, H. S., and Southwick, C. H. (1989). Population structure of hylobates concolor in bawanglin nature reserve, hainan, china. Am. J. Primatol. 19, 247–254. doi: 10.1002/ajp.1350190406
Liu, Z. J., Liu, G. J., Roos, C., Wang, Z. M., Xiang, Z. F., Zhu, P. F., et al. (2015). Implications of genetics and current protected areas for conservation of 5 endangered primates in china. Conserv. Biol. 29, 1508–1517. doi: 10.1111/cobi.12581
Madsen, T., Shine, R., and Olsson, M. (1999). Conservation biology: restoration of an inbred adder population. Nature. 402, 34–35. doi: 10.1038/46941
Miquel, C., Bellemain, E., and Poillot, C. (2006). Quality indexes to assess the reliability of genotypes in studies using noninvasive sampling and multiple-tube approach. Mol Ecol Notes. 6, 985–988. doi: 10.1111/j.1471-8286.2006.01413.x
Oka, T., and Takenaka, O. (2001). Wild gibbons’ parentage tested by non-invasive DNA sampling and PCR-amplified polymorphic microsatellites. Primates 42, 67–73. doi: 10.1007/BF02640690
Palle, V., and Tina, F. (2006). Fast and non-invasive PCR sexing of primates: apes, old world monkeys, new world monkeys and strepsirrhines. BMC Ecol. 6:8. doi: 10.1186/1472-6785-6-8
Park, S. J. (2001). Microsatellite toolkit for Excel. Smurfit Institute of Genetics. (Ireland: Trinity College. Universityof Dublin).
Siddle, H. V., Kreiss, A., Eldridge, M. D., Noonan, E., Clarke, C. J., Pyecroft, S., et al. (2007). Transmission of a fatal clonal tumor by biting occurs due to depleted MHC diversity in a threatened carnivorous marsupial. PNAS 104, 16221–16226. doi: 10.1073/pnas.0704580104
Storz, J. F., Bhat, H. R., and Kunz, T. H. (2001). Genetic consequences of polygyny and social structure in an indian fruit bat. cynopterus sphinx. i. inbreeding, outbreeding, and population subdivision. Evolution 55, 1215–1223. doi: 10.1111/j.0014-3820.2001.tb00641.x
Su, B., Monda, K., Wang, W., Jiang, X., Wang, Y., Woodruff, D. S., et al. (1995). “Molecular phylogeny of Chinese concolor gibbons (subgenus Nomascus) using noninvasive DNA genotyping,” in Primate Research and Conservation, eds W. Xia and Y. Zhang (Beijing: China Forestry Publishing House).
Swinnerton, K. J., Groombridge, J. J., Jones, C. G., Burn, R. W., and Mungroo, Y. (2004). Inbreeding depression and founder diversity among captive and free-living populations of the endangered pink pigeon columba mayeri. Anim. Conserv. 7, 353–364. doi: 10.1017/S1367943004001556
Taberlet, P., and Luikart, G. (1999). Non-invasive genetic sampling and individual indentification. Bio. J. Linn. Soci. 68, 41–55. doi: 10.1111/j.1095-8312.1999.tb01157.x
Tajima, F. (1982). Evolutionary relationship of DNA sequences in finite populations. Genetics 105, 437–460.
Thinh, V. N., Mootnick, A. R., Geissmann, T., Li, M., Ziegler, T., Agil, M., et al. (2010a). Mitochondrial evidence for multiple radiations in the evolutionary history of small apes. BMC Evol. Biol. 10:74. doi: 10.1186/1471-2148-10-74
Thinh, V. N., Rawson, B., and Hallam, C. (2010b). Phylogeny and distribution of crested gibbons (genus Nomascus) based on mitochondrial cytochrome b gene sequence data. Am. J. Primatol. 72, 1047–1054. doi: 10.1002/ajp.20861
Thomas, O. (1892). XXIII.–Note on the gibbon of the island of hainan (Hylobates hainanus sp. n.). J. Nat. Hist. 9, 145–146. doi: 10.1080/00222939208677291
Valiere, N. (2002). GIMLET:a computer program for analysis genetic individual identification data. Mol. Ecol. Notes 2, 377–379. doi: 10.1046/j.1471-8286.2002.00228.x-i2
Waits, L. P., Luikart, G., and Taberlet, P. (2001). Estimating the probability of identity among genotypes in natural populations: cautions and guidelines. Mol. Ecol. 10, 249–256. doi: 10.1046/j.1365-294X.2001.01185.x
Wang, J., and Santure, A. W. (2009). Parentage and sibship inference from multi-locus genotype data under polygamy. Genetics 181, 1579–1594. doi: 10.1534/genetics.108.100214
Wang, J. L. (2017). User’s guide for software COLONY Version 2.0.6.4. (London: Zoological Society of London).
Wei, F. W., Hu, Y. B., Zhu, L., Bruford, M. W., Zhan, X., and Zhang, L. (2012). Black and white and read all over: the past, present and future of giant panda genetics. Mol. Ecol. 21, 5660–5674. doi: 10.1111/mec.12096
Wultsch, C., Waits, L. P., and Kelly, M. J. (2014). Noninvasive individual and species identification of jaguars (Panthera onca), pumas (Puma concolor) and ocelots (Leopardus pardalis) in Belize, Central America using cross-species microsatellites and faecal DNA. Mol. Ecol. Res. 14, 1171–1182. doi: 10.1111/1755-0998.12266
Yang, Y., Groves, C., Garber, P., Wang, X. W., Li, H., Long, Y. C., et al. (2019). First insights into the feeding habits of the Critically endangered black snub−nosed monkey, rhinopithecus strykeri (Colobinae, Primates). Primates 60, 143–153. doi: 10.1007/s10329-019-00717-0
Zhan, X. J., Zhang, Z. J., Wu, H., Goossens, B., Li, M., Jiang, S. W., et al. (2007). Molecualr analysis of dispersal in giant pandas. Mol. Ecol. 16, 3792–3800. doi: 10.1111/j.1365-294X.2007.03450.x
Zhang, Y. (1995). “A molecular phylogeny of gibbons based on DNA sequences,” in Primate Research and Conservation, eds W. Xia and Y. Zhang (Beijing: China Forestry Publishing House), 50–54.
Zhou, J., Wei, F. W., and Li, M. (2005). Hainan black-crested gibbon is headed for extinction. Am. J. Primatol. 26, 453–465. doi: 10.1007/s10764-005-2933-x
Keywords: critically endangered, genetic status, population size, Hainan gibbon, conservation
Citation: Guo Y, Chang J, Han L, Liu T, Li G, Garber PA, Xiao N and Zhou J (2020) The Genetic Status of the Critically Endangered Hainan Gibbon (Nomascus hainanus): A Species Moving Toward Extinction. Front. Genet. 11:608633. doi: 10.3389/fgene.2020.608633
Received: 21 September 2020; Accepted: 30 October 2020;
Published: 04 December 2020.
Edited by:
Deyan Ge, Institute of Zoology, Chinese Academy of Sciences (CAS), ChinaReviewed by:
John Lau, Key Laboratory of Animal Ecology and Conservation Biology, Institute of Zoology (CAS), ChinaShingo Kaneko, Fukushima University, Japan
Copyright © 2020 Guo, Chang, Han, Liu, Li, Garber, Xiao and Zhou. This is an open-access article distributed under the terms of the Creative Commons Attribution License (CC BY). The use, distribution or reproduction in other forums is permitted, provided the original author(s) and the copyright owner(s) are credited and that the original publication in this journal is cited, in accordance with accepted academic practice. No use, distribution or reproduction is permitted which does not comply with these terms.
*Correspondence: Jiang Zhou, emhvdWppYW5nQGlvei5hYy5jbg==
†These authors share first authorship