- 1Triticeae Research Institute, Sichuan Agricultural University, Chengdu, China
- 2School of Life Sciences and Technology, Henan Institute of Science and Technology, Xinxiang, China
- 3Rice Research Institute, Sichuan Agricultural University, Chengdu, China
- 4College of Resources, Sichuan Agricultural University, Chengdu, China
- 5State Key Laboratory of Crop Gene Exploration and Utilization in Southwest China, Chengdu, China
Plant height (PH) plays a pivotal role in plant morphological architecture and is associated with yield potential in wheat. For the quantitative trait locus (QTL) analysis, a recombinant inbred line population was developed between varieties differing significantly in PH. Two major QTL were identified on chromosomes 4B (QPh.sicau-4B) and 6D (QPh.sicau-6D) in multiple environments, which were then validated in two different backgrounds by using closely linked markers. QPh.sicau-4B explained 10.1–21.3% of the phenotypic variance, and the location corresponded to the dwarfing gene Rht-B1. QPh.sicau-6D might be a novel QTL for PH, explaining 6.6–13.6% of the phenotypic variance and affecting spike length, thousand-kernel weight, and spikelet compactness. Three candidate genes associated with plant growth and development were identified in the physical interval of QPh.sicau-6D. Collectively, we identified a novel stable and major PH QTL, QPh.sicau-6D, which could aid in the development of closely linked markers for marker-assisted breeding and cloning genes underlying this QTL.
Introduction
Bread wheat (Triticum aestivum L.) is an important staple crop, ranking the third after maize and rice in terms of yield in China (Edae et al., 2014; Liu et al., 2018). According to the Food and Agriculture Organization of the United Nations1, the global wheat grain yield in 2017 was 771.7 million tons, contributing to approximately 20% of the calories consumed by humans. Plant height (PH) is an important yield component trait associated with plant morphological architecture and other yield-related traits, such as spike length, spikelet number per spike, spikelet compactness (SC), and thousand-kernel weight (TKW), thus affecting the yield potential (Sakamoto and Matsuoka, 2004; Gao et al., 2015; Kowalsk et al., 2016; Guan et al., 2018). To develop high grain yield lines, Donald (1968) proposed the idea of breeding crop ideotypes with a relatively short PH, single culm, strong stem, and large and erect ear.
In view of the importance of PH in wheat yield, it is imperative to identify more candidate genes responsible for PH from wheat germplasm resources. In the past two decades, numerous major and minor QTL influencing PH have been identified on 21 chromosomes in wheat, and some of them have been applied in wheat breeding (Peng et al., 1999; Liu et al., 2002; Griffiths et al., 2012; Würschum et al., 2015; Tian et al., 2017; Hassan et al., 2019). Additionally, several PH genes have been cloned, such as Rht-B1 and Rht-D1 (located on chromosome 4B and 4D, respectively), and highly adopted in breeding practices during the green revolution; they encode the DELLA proteins, participating in gibberellin signaling, and thereby affecting PH (Peng et al., 1999; Pearce et al., 2011). Rht18 encodes a gibberellic acid (GA) 2-oxidase protein, which regulates the balance of GA intermediates and inactive GA, leading to a semi-dwarf phenotype in wheat (Ford et al., 2018). In Arabidopsis, extensively studied dwarf mutants such as the yda and pat10 mutants, which are defective in growth and development, have been shown to significantly differ from the wild-type plants in terms of PH (Lukowitz et al., 2004; Zhou et al., 2013).
In this study, a recombinant inbred lines (RILs) population was used for QTL mapping of PH with a genetic map using the 90K SNP array and phenotyping in six environments to identify major QTL for PH. The effects of the major QTL for PH were further assessed in different genetic backgrounds.
Materials and Methods
Plant Materials
Three populations of RILs were generated by single-seed descent in the field in Sichuan Agricultural University, Wenjiang (103°51′E, 30°43′N), with H461 as a common parent. These three populations were as follows: H461/CN16 (HCN; 249 F8 lines), H461/CM107 (HCM; 200 F7 lines), and H461/MM37 (HMM; 142 F6 lines).
The HCN population was used for QTL mapping, whereas the other populations (HCM and HMM) were used for validating the major QTL identified in the HCN population.
Phenotypic Evaluation
The three populations were planted in six different environments for phenotypic evaluation: Wenjiang in 2015 and 2019 (2015WJ and 2019WJ); Chongzhou (103°38′E, 30°32′N) in 2015, 2017, and 2019 (2015CZ, 2017CZ, and 2019CZ); and Ya’an (103°0′E, 29°58′N) in 2015 (2015YA). Each plot consisted of three rows, with a length of 1.5 m and an inter-row spacing of 30 cm; the sowing density was 15 seeds per row. For each plot, five plants were randomly chosen to measure PH, from the plant base to the tip of the spike, and calculate the mean PH. The main spike of five plants were selected to measure the spikelet number per spike (SN) and spike length (SL). The TKW was measured using an electronic balance with three replications. Flowering time (FT) was recorded as the date when half of the plants in each plot flowered after sowing. The SC was calculated by dividing the SL by the SN.
Analysis of variance (ANOVA) and calculation of Pearson’s correlation coefficients among different environments were performed using SPSS 22 (IBM SPSS, Armonk, NY, United States). Frequency distribution was processed using MS Excel, and the best linear unbiased prediction (BLUP) for target traits was calculated using R version 3.5.2 (Team, 2013). Broad-sense heritability (h2) was calculated across environments as described by Smith et al. (1998). The correlations between PH and the factors SN, SL, SC, TKW, and FT were calculated based on the BLUP values, and Student’s t-test was performed to determine significant differences between two groups using SPSS 22.
QTL Mapping
The HCN population was used for constructing a whole-genome genetic linkage map using the 90K SNP array (Wang et al., 2016) for QTL mapping, consisting of 7808 SNP polymorphic markers in parents distributed in 50 linkage groups and covers a total genetic distance of 3486.44 cM, with an average distance of 0.45 cM between the adjacent markers.
MapQTL 6.0 (Van Ooijen and Kyazma, 2009) was used for the QTL analysis. Kruskal–Wallis test was used to evaluate the degree of association between markers and PH. Interval mapping (IM) was then used to identify major QTL and markers significantly associated with PH. For each trial, a test of 1000 permutations was performed to identify the LOD threshold corresponding to a genome-wide false discovery rate of 1%. Based on the permutation test, threshold LOD values between 2.4 and 3.3 were used to confirm the presence of a QTL. The QTL were named based on the International Rules of Genetic Nomenclature2. “Ph” and “sicau” stand for “plant height” and “Sichuan Agricultural University,” respectively.
Validation of the Major QTL
The flanking markers of the major QTL were mapped to the physical map of the wheat cultivar Chinese Spring (IWGSC RefSeq v1.0), and the sequence information in the QTL interval was obtained. To develop Kompetitive allele specific PCR (KASP) markers closely linked to the QTL, the partial sequence information of the QTL interval was amplified in CN16 and H461 by PCR to search for polymorphic sites. The newly developed KASP markers were remapped into the genetic map.
The markers closely linked to the QTL were used for identifying alleles in different genetic backgrounds (populations HCM and CMM). The lines were classified into two groups: genotypes with homozygous alleles from H461 (designated AA) and those with homozygous alleles from alternative parents (designated BB). The mean PH from homozygotes was used for measuring the QTL effects, and Student’s t-test was used to determine the significance of differences between the two groups in each population.
Predicted Candidate Genes
The gene information of the QTL interval was obtained from IWGSC RefSeq v1.1 annotation. Expression values as transcripts per million (TPM) were obtained from the expVIP Wheat Expression Browser3 (Borrill et al., 2016), genes with a low expression (TPM < 0.5) in various tissues were excluded and the mean expression values were visualized by TBtools (Chen et al., 2020). The remaining genes were annotated by KOBAS v3.0 (Ai and Kong, 2018) BLAST against the corresponding protein sequences in rice and Arabidopsis thaliana. The genomic DNA of parents was extracted from the leaf samples using the Plant Genomic DNA kit (Biotechnologies, CA) and used to amplify candidate genes for sequence analysis.
Results
Phenotyping of the HCN Population
In different environments, the PH of H461 ranged from 79.00 to 88.22 cm, and that of CN16 ranged from 61.60 to 76.75 cm. Moreover, significant differences in PH were observed between H461 and CN16 (Table 1). The frequency of PH in the HCN population showed continuous distribution, ranging from 51.50 to 124.2 cm (Table 1 and Supplementary Figure S1); this implied that PH was affected by multiple loci. The h2 of PH was 0.83, and Pearson’s correlation coefficients between the different environments ranged from 0.232 to 0.872 (P < 0.01; Table 2).
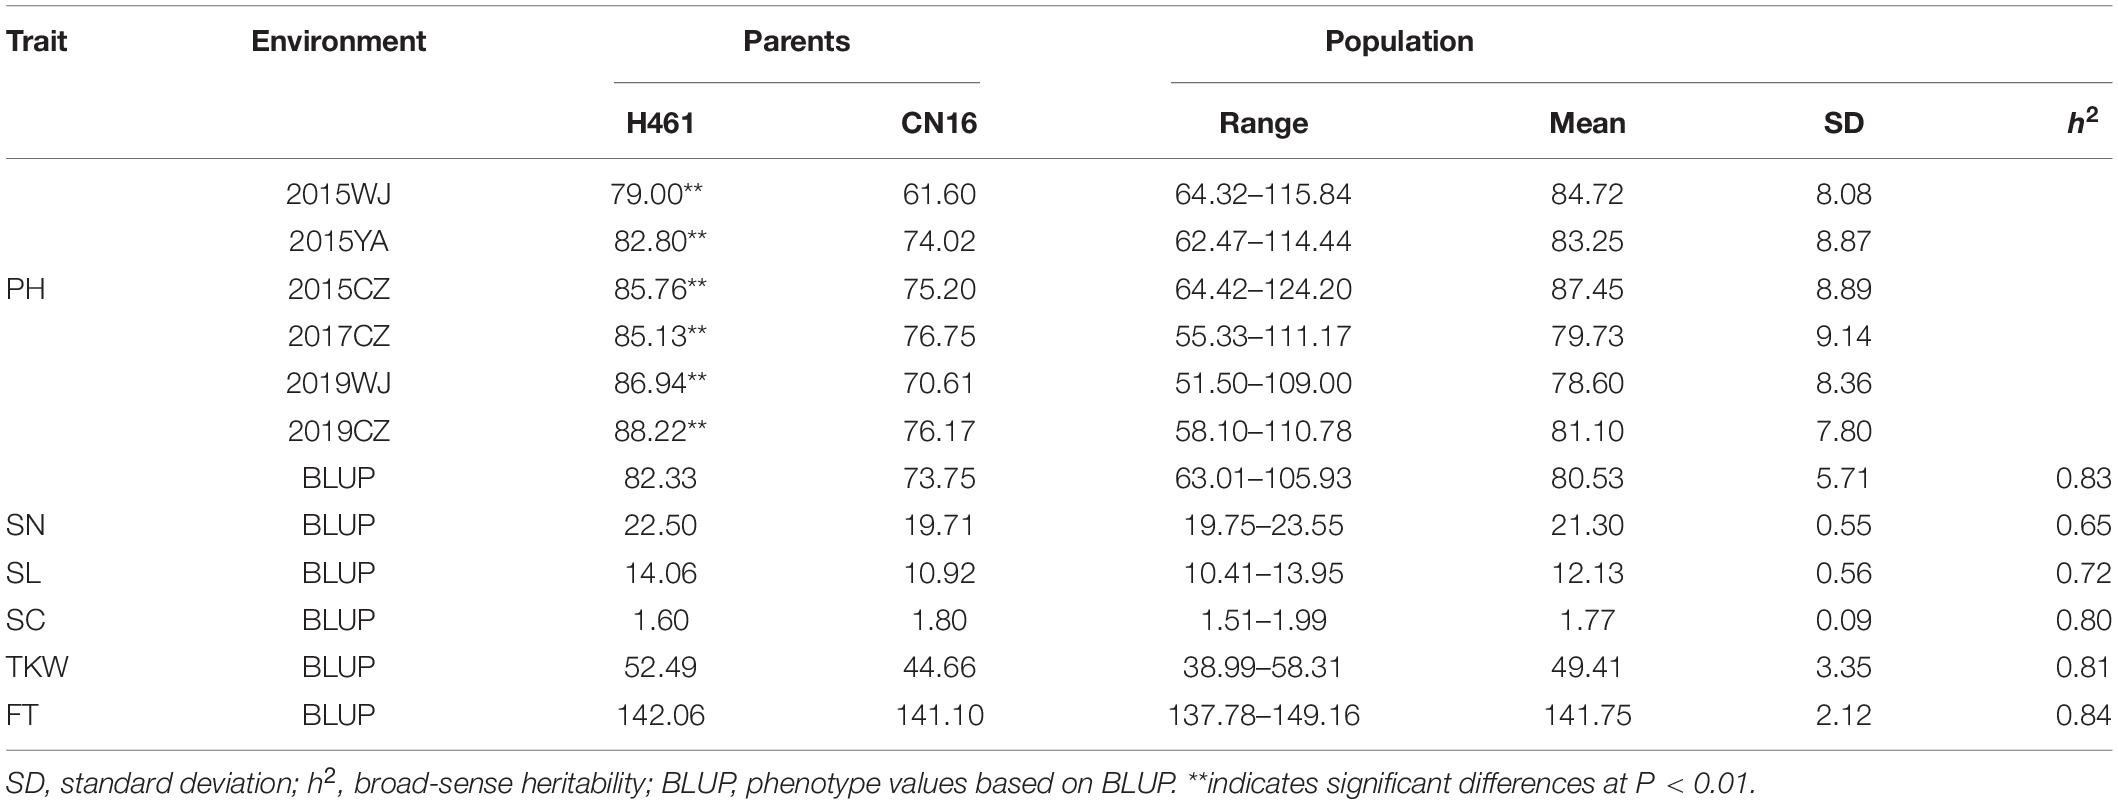
Table 1. Phenotypic variation of the mapping population H461 × CN16 and parental lines in different environments.
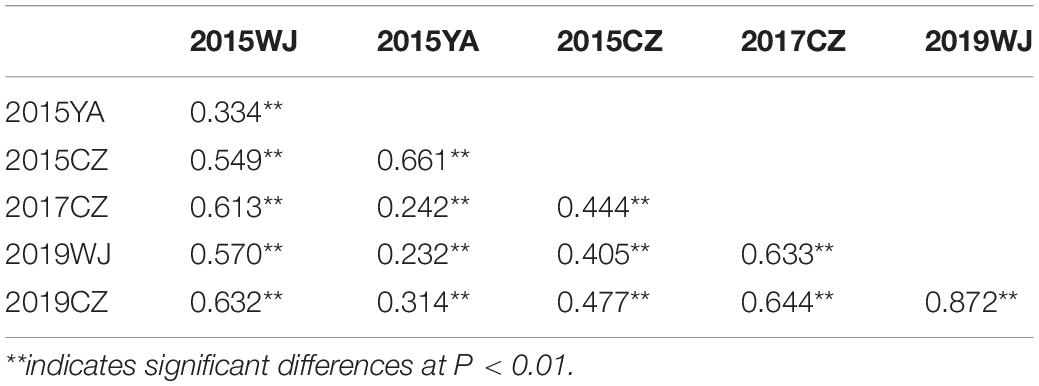
Table 2. Correlation coefficients for plant height (PH) in the HCN population evaluated in different environments.
The BLUP values of PH, SN, SL, SC, TKW, and FT are shown in Table 1. Phenotypic correlation coefficients between PH and other spike-related traits were obtained based on the BLUP values (Table 3). PH was highly significantly correlated with the TKW (P < 0.01) and significantly correlated with the SN and SL (P < 0.05). No significant correlation was observed between PH and SC or FT (Table 3).
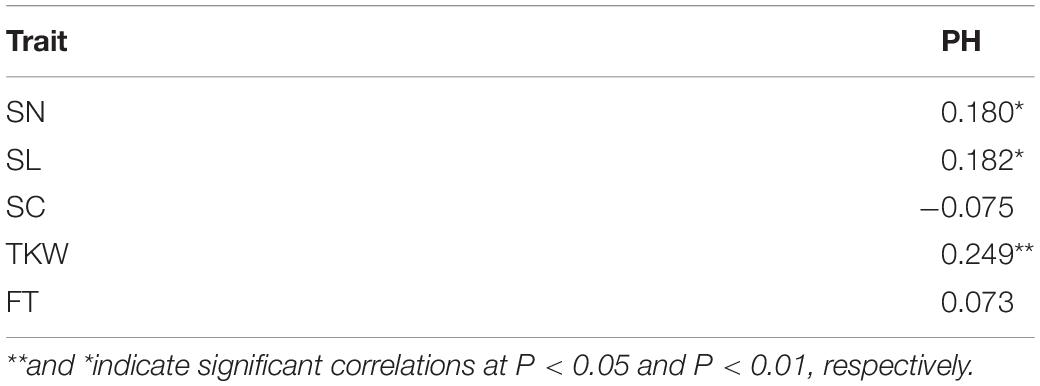
Table 3. Correlation coefficients among the BLUP value for plant height (PH) with spikelet number per spike (SN), spike length (SL), spikelet compactness (SC), thousand kernel weight (TKW) and flowering time (FT).
Identification of QTL for PH
Three QTL for PH were identified using the IM analysis (Table 4). The first QTL (QPh.sicau-4B) was located on the short arm of chromosome 4B, between the markers Tdurum_contig64772_417 and Excalibur_rep_c113261_400. QPh.sicau-4B was a stable major QTL with the additive effects from H461, and it explained 10.1–21.3% of the phenotypic variance, with LOD values ranging from 4.15 to 9.39. It was identified in five environments and the combined analysis (BLUP). The second QTL (QPh.sicau-6D) was located on the short arm of chromosome 6D, between the markers IACX10982 and BS00063175_51. QPh.sicau-6D was a stable major QTL with the additive effects from H461; it explained 6.6%–13.6% of the phenotypic variance, with LOD values ranging from 2.67 to 5.80, identified in all environments and using BLUP. The third QTL (QPh.sicau-3B) was located on 3B, identified only in 2017CZ, and it explained 7.9% of the phenotypic variance.
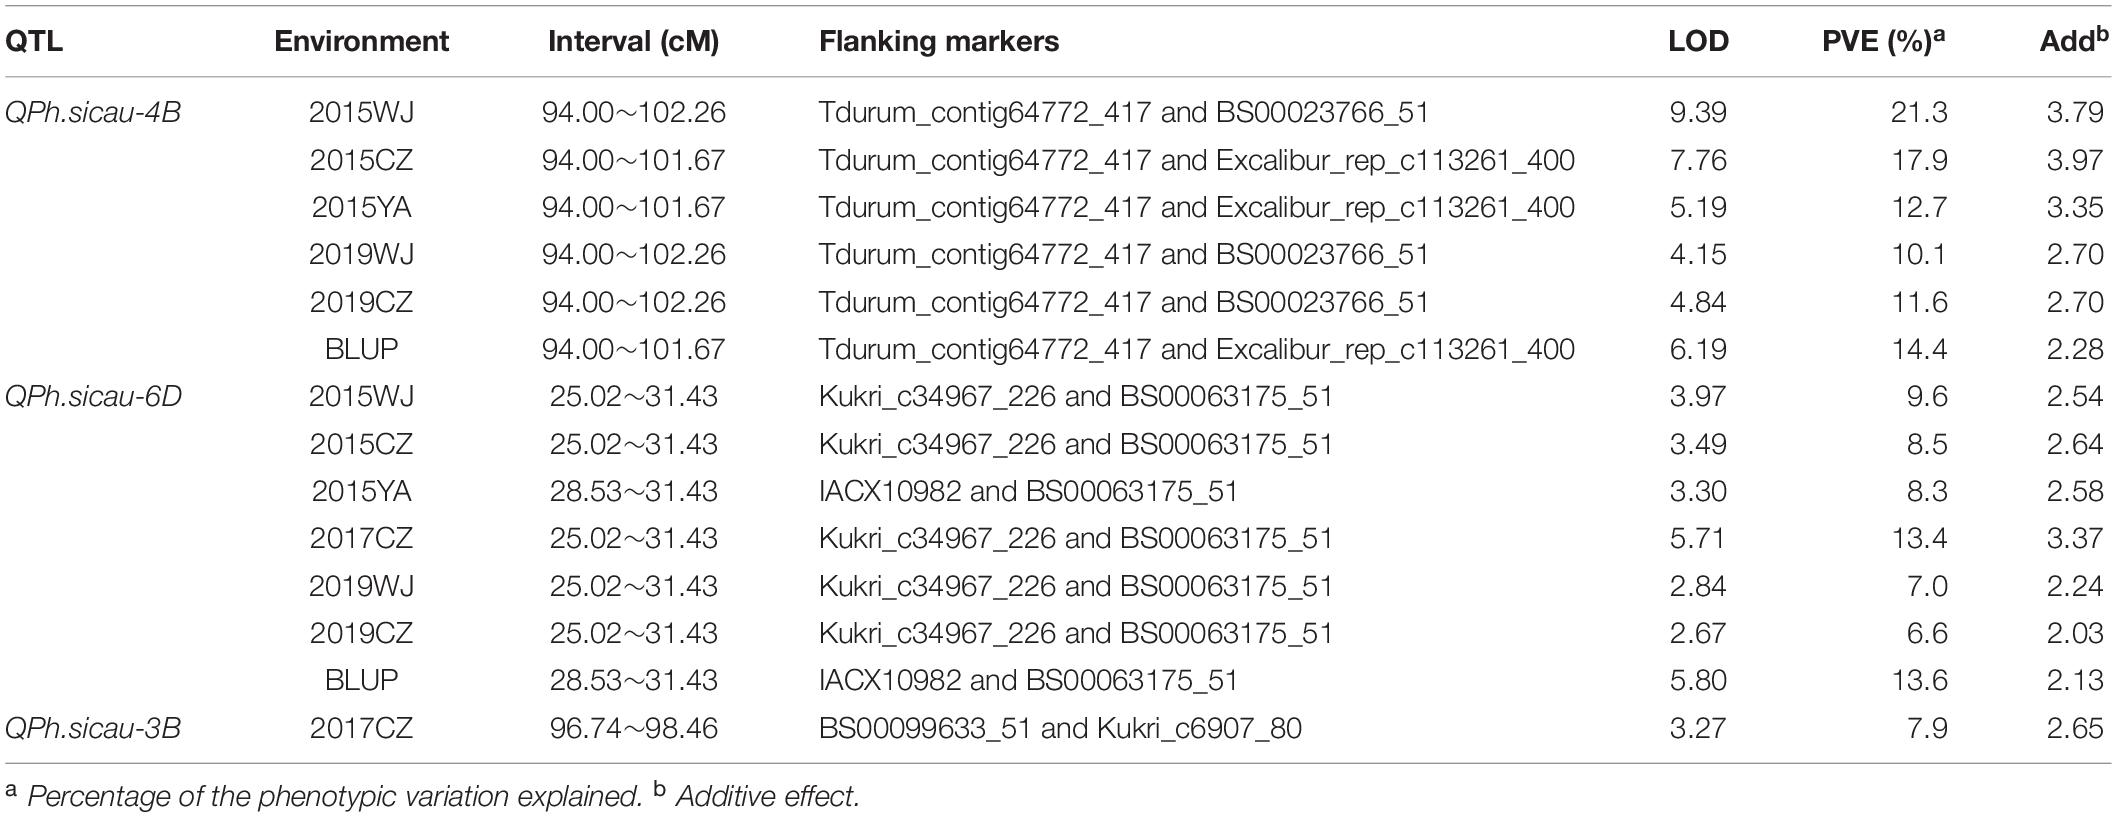
Table 4. Quantitative trait loci (QTL) for plant height identified in the H461 × CN16 recombinant inbred line population evaluated in different environments.
Effects of the Two Major PH QTL on PH and Other Panicle Traits
To identify the effect of the two major PH QTL (QPh.sicau-4B and QPh.sicau-6D) for other panicle traits, the BLUP values across six environments were used. For QPh.sicau-4B, lines with homozygous alleles from H461 and lines with homozygous alleles from CN16, classified into two groups, showed a significant difference (P < 0.05) for FT (Supplementary Figure S2). For QPh.sicau-6D, lines with homozygous alleles from H461 and those with homozygous alleles from CN16, classified into two groups, showed significant differences (P < 0.05) for SL, SC, and TKW (Supplementary Figure S3).
For PH, the HCN population could be divided into the following four groups based on markers: (A) carrying both the additive alleles of two major QTL, (B) only carrying the additive allele of QPh.sicau-4B, (C) only carrying the additive allele of QPh.sicau-6D, and (D) not carrying the additive alleles of QPh.sicau-4B and QPh.sicau-6D. Comparative analyses among the four groups showed that the group A had the highest effect on PH, which was significantly higher than that of the groups B, C, and D. Furthermore, the groups B and C had significantly higher effects than that of the group D. Thus, QPh.sicau-4B and QPh.sicau-6D might significantly affect PH, with both having a significant effects on PH (Figure 1).
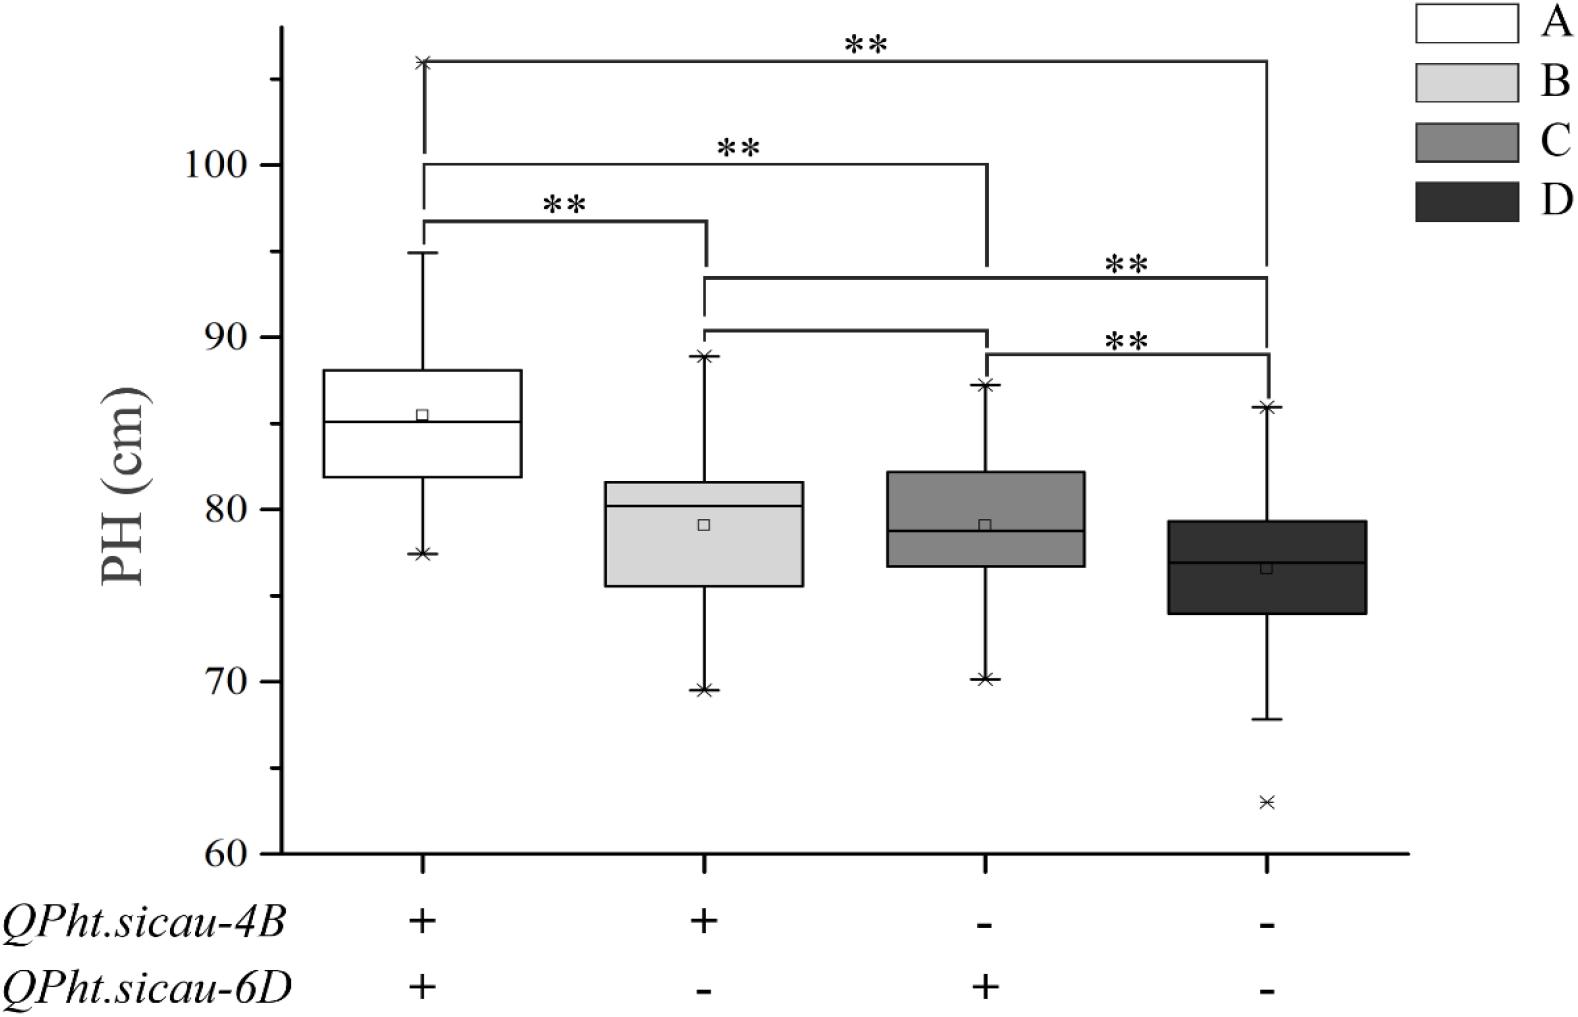
Figure 1. Effects of the QPh.sicau-4B and QPh.sicau-6D on PH in HCN population (A: carrying both the additive alleles of the two major QTL; B: only carrying the additive allele of QPh.sicau-4B; C: only carrying the additive allele of QPh.sicau-6D; and D: not carrying the additive alleles of the two major QTL). **indicates significant differences at P < 0.01.
Validation of QTL in Different Genetic Backgrounds
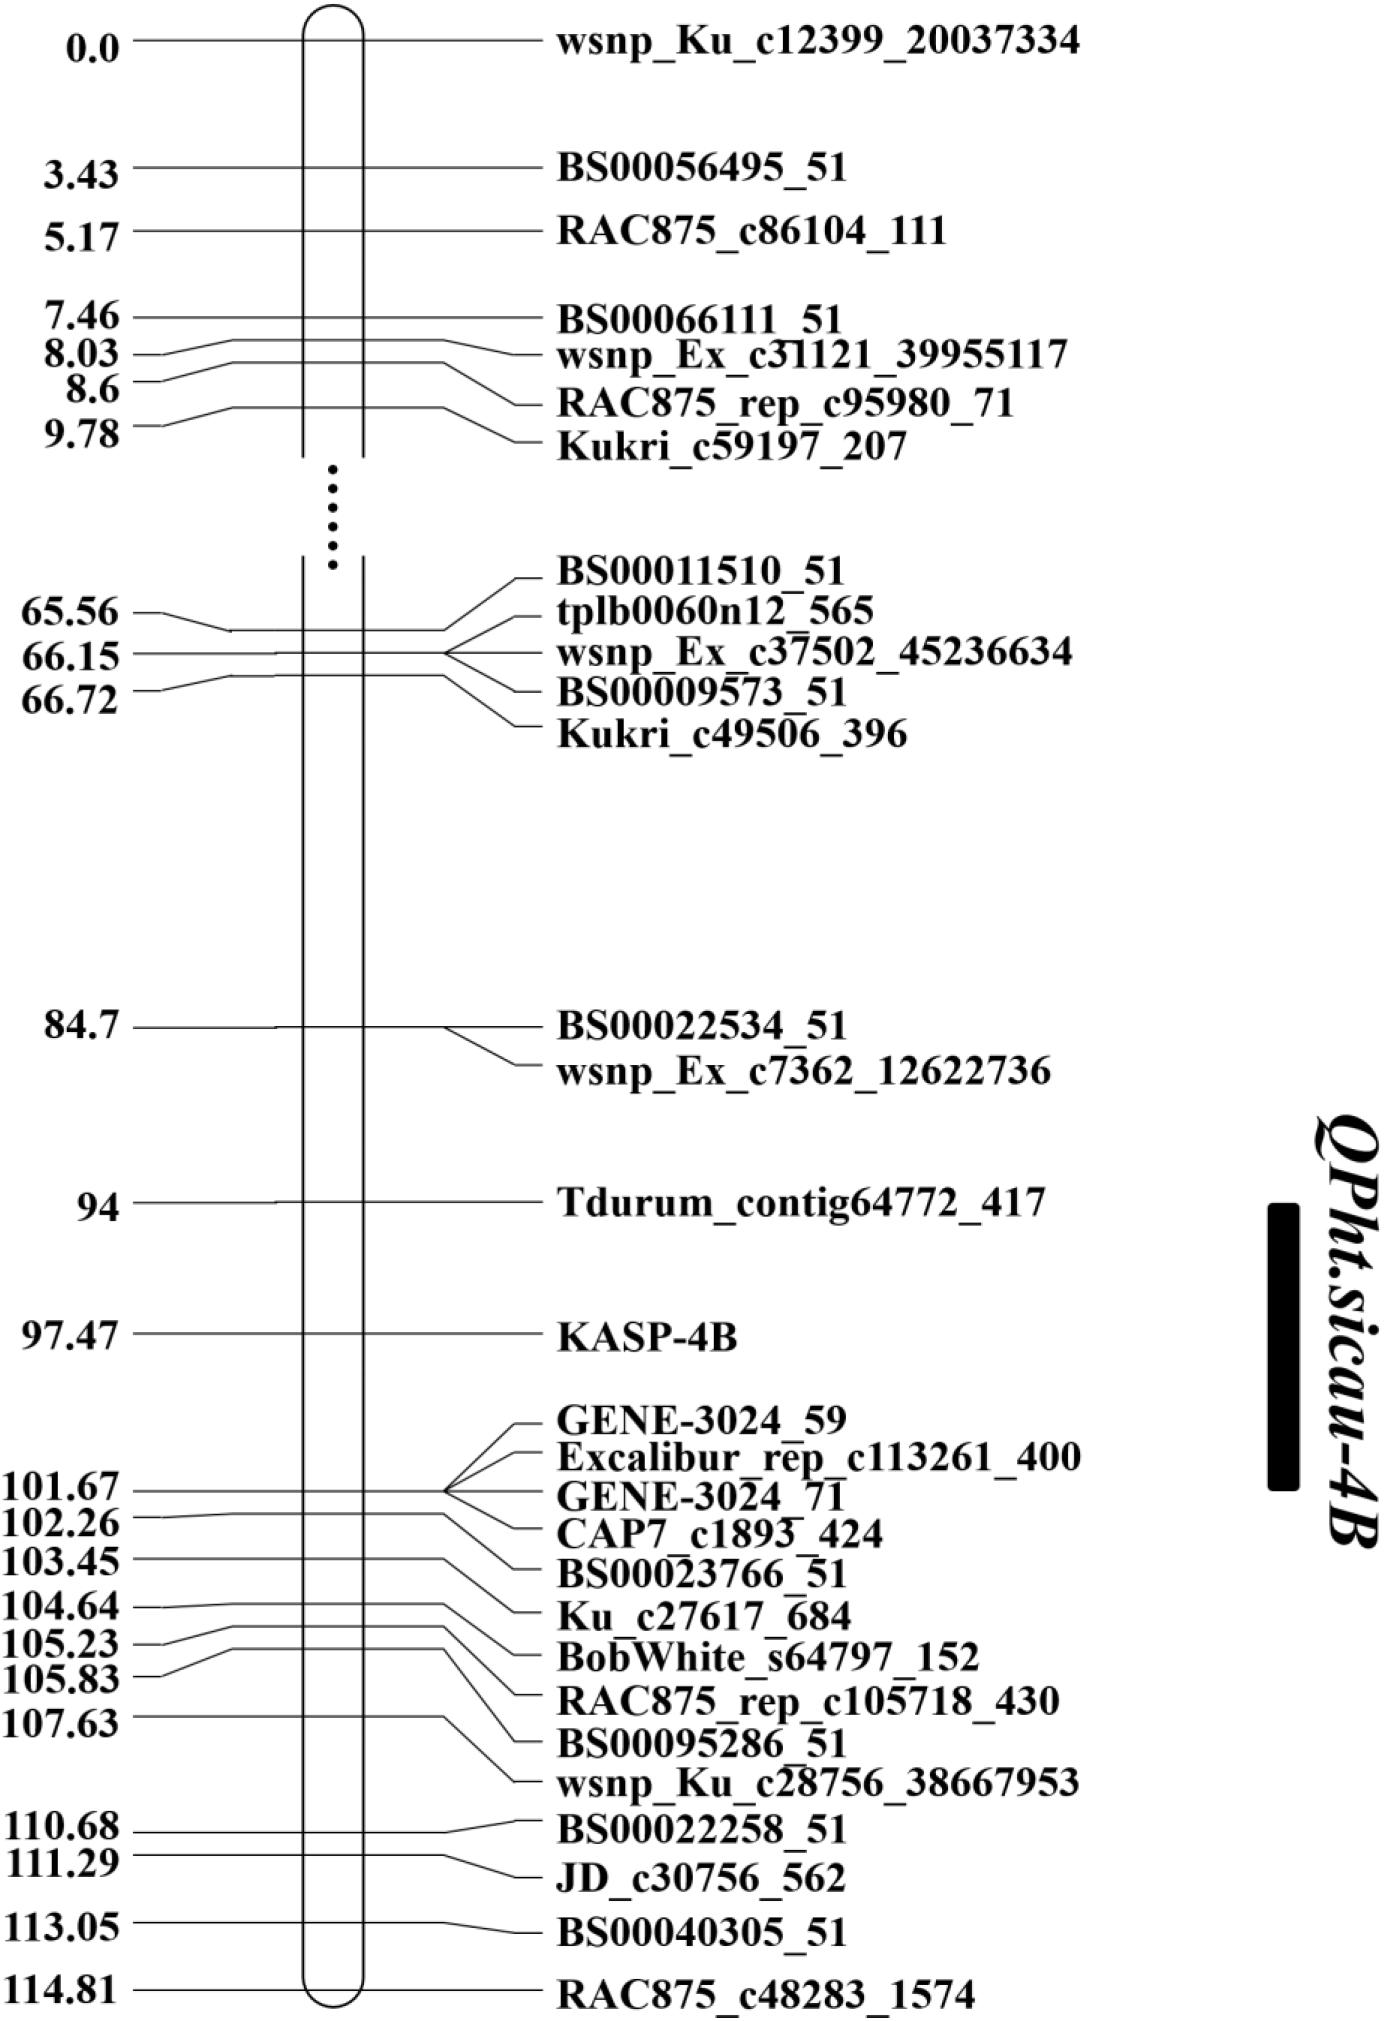
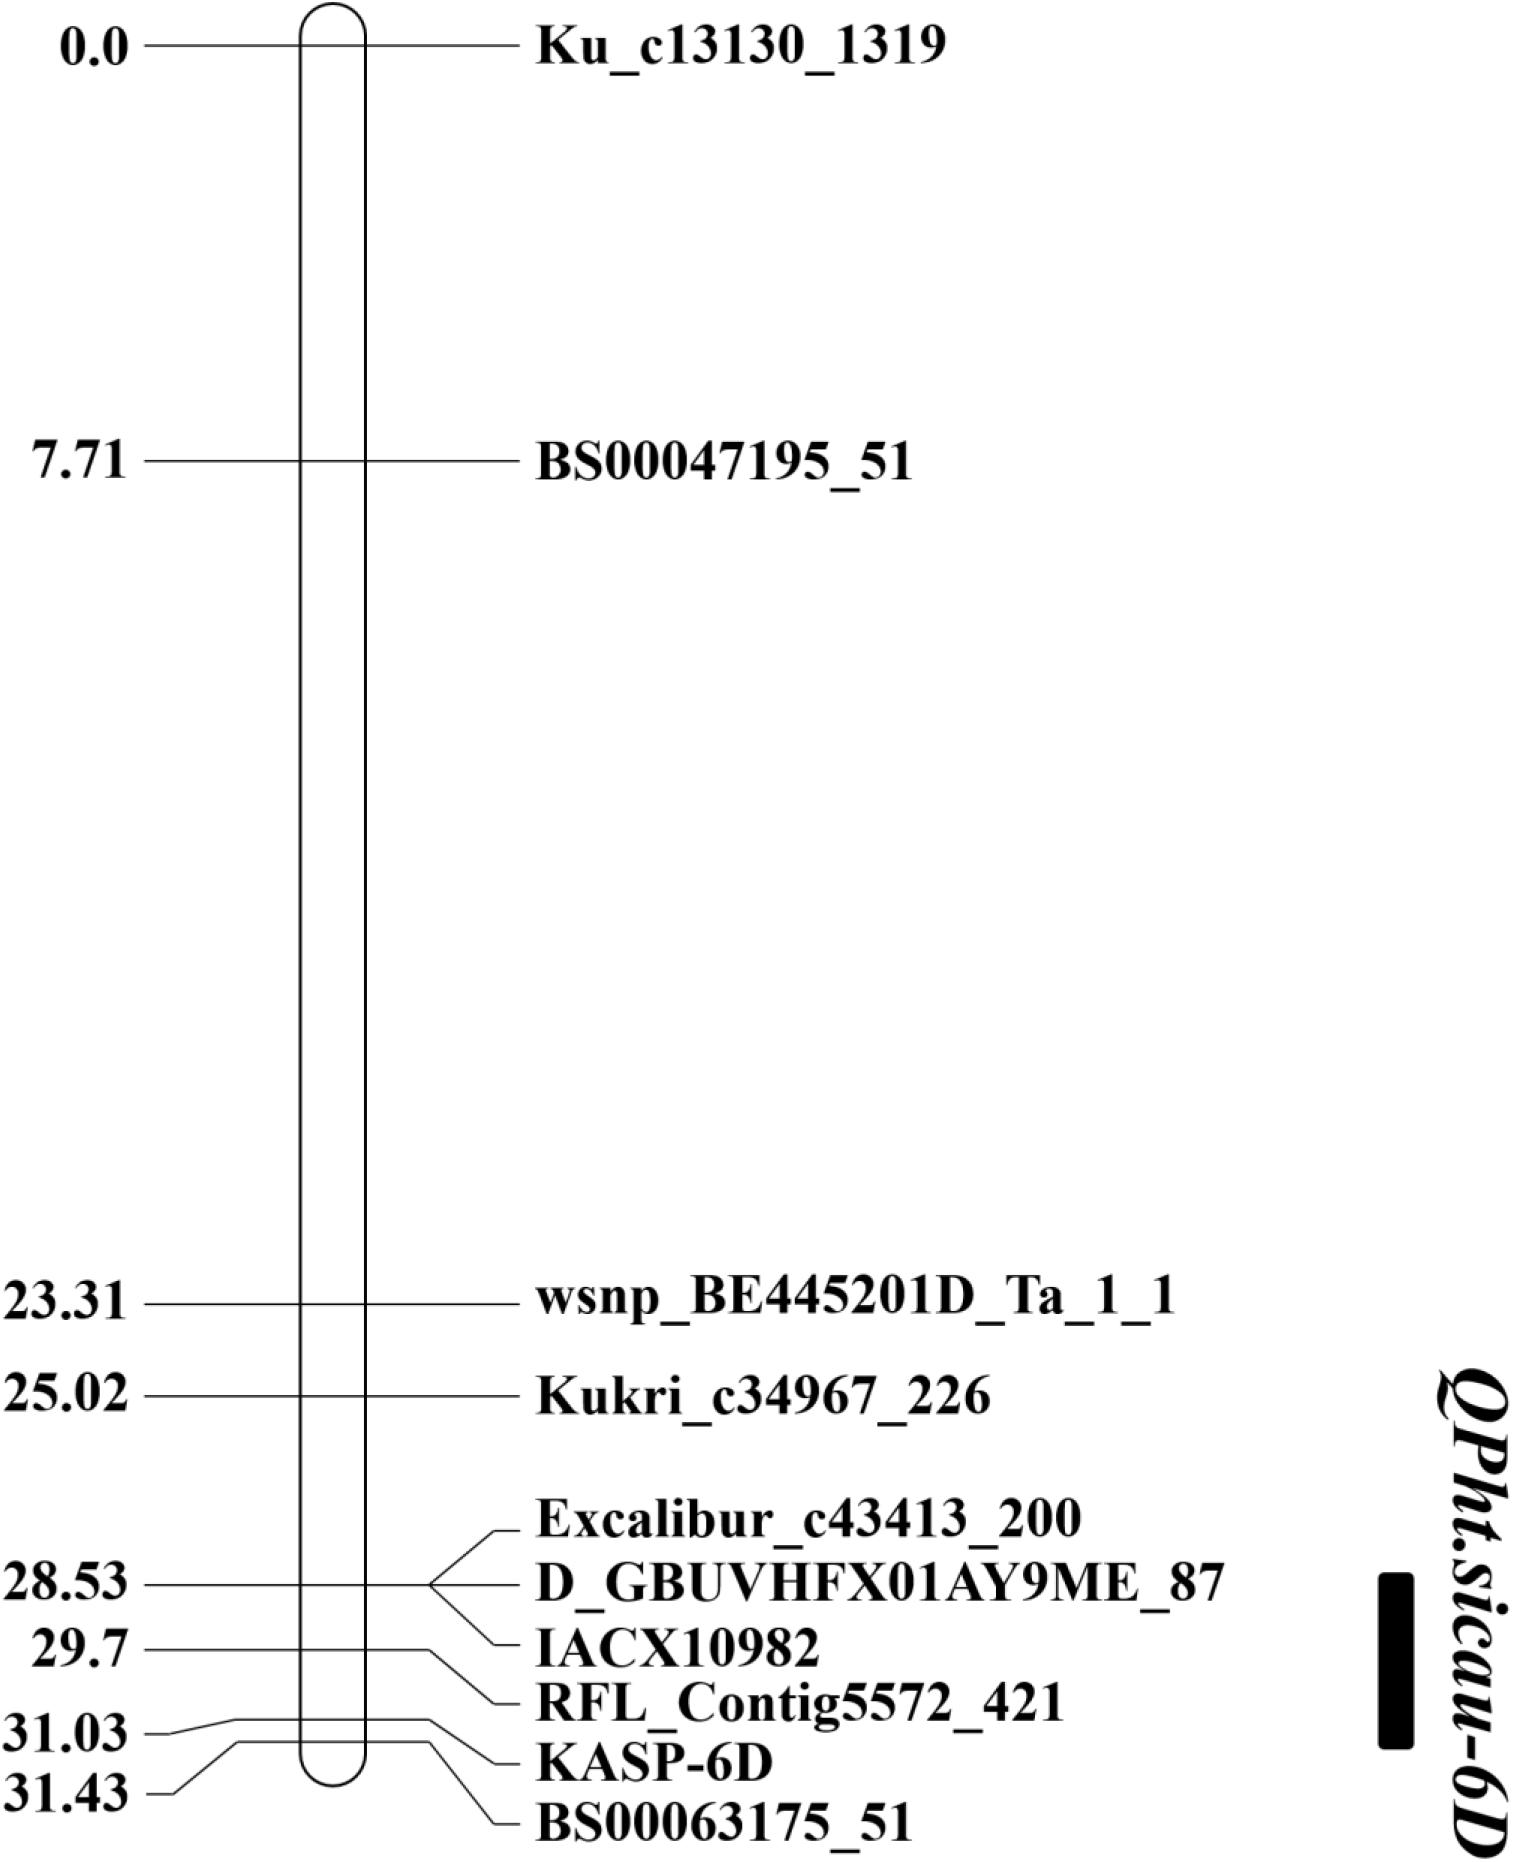
Based on the QTL mapping results and Sanger sequencing of the PCR products of H461 and CN16, two KASP markers (KASP-4B and KASP-6D, Supplementary Table S1) were developed and used to reconstruct the genetic map. The KASP-4B marker was found to be closely linked to QPh.sicau-4B, whereas the KASP-6D marker was closely linked to QPh.sicau-6D (Figures 2,3).
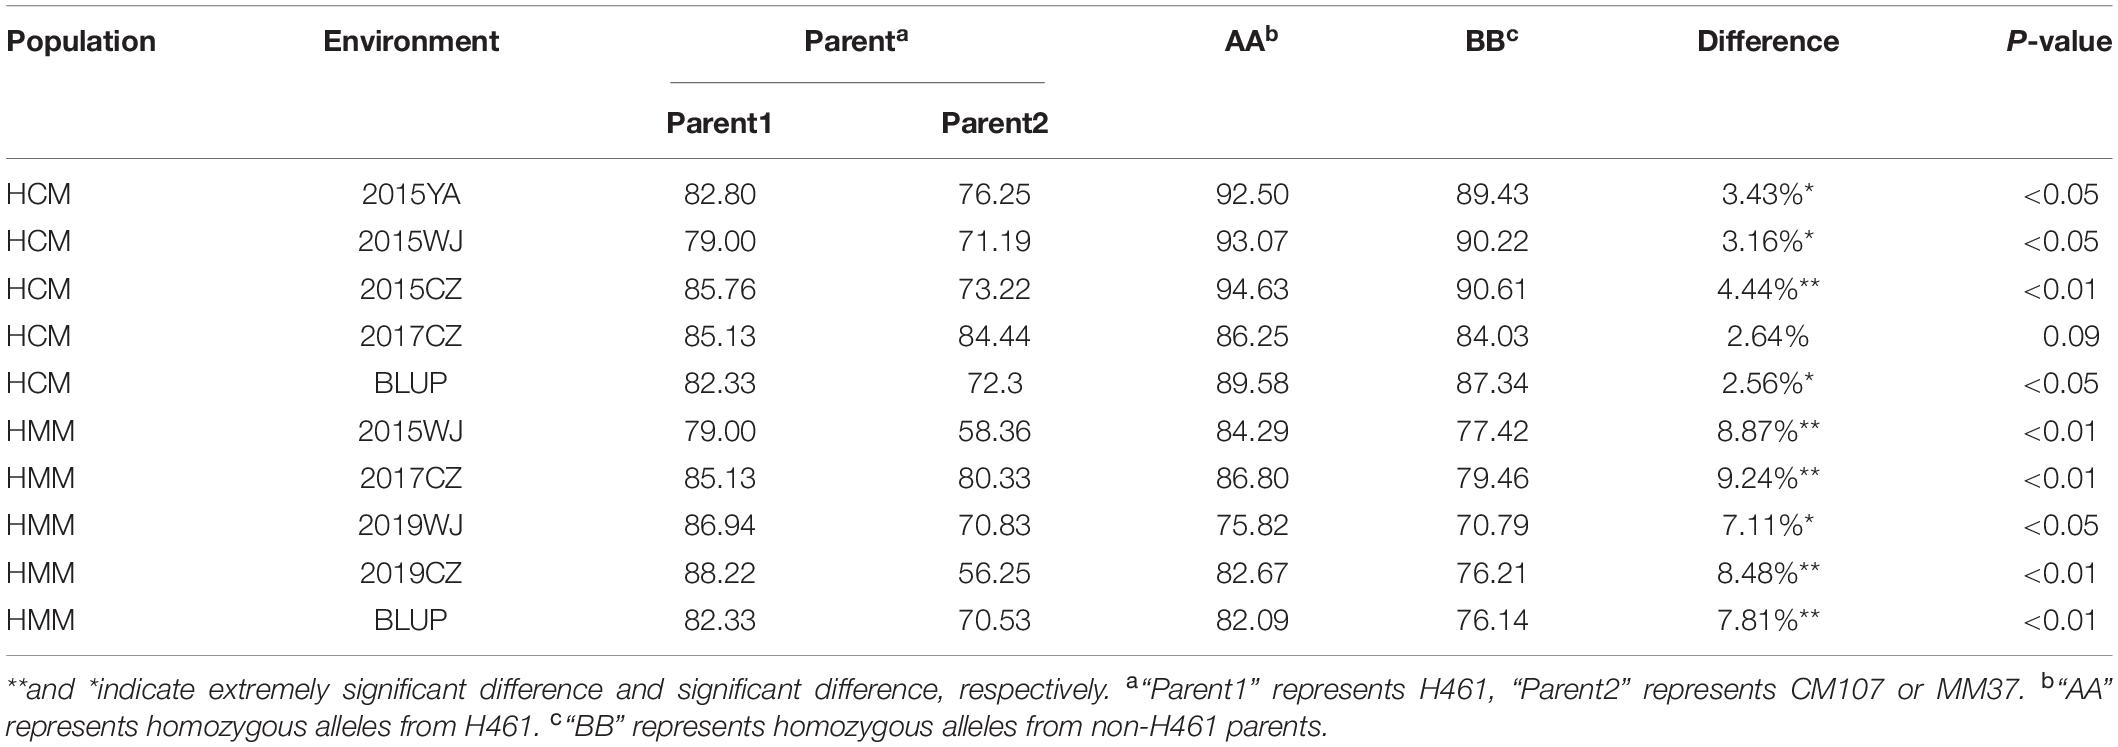
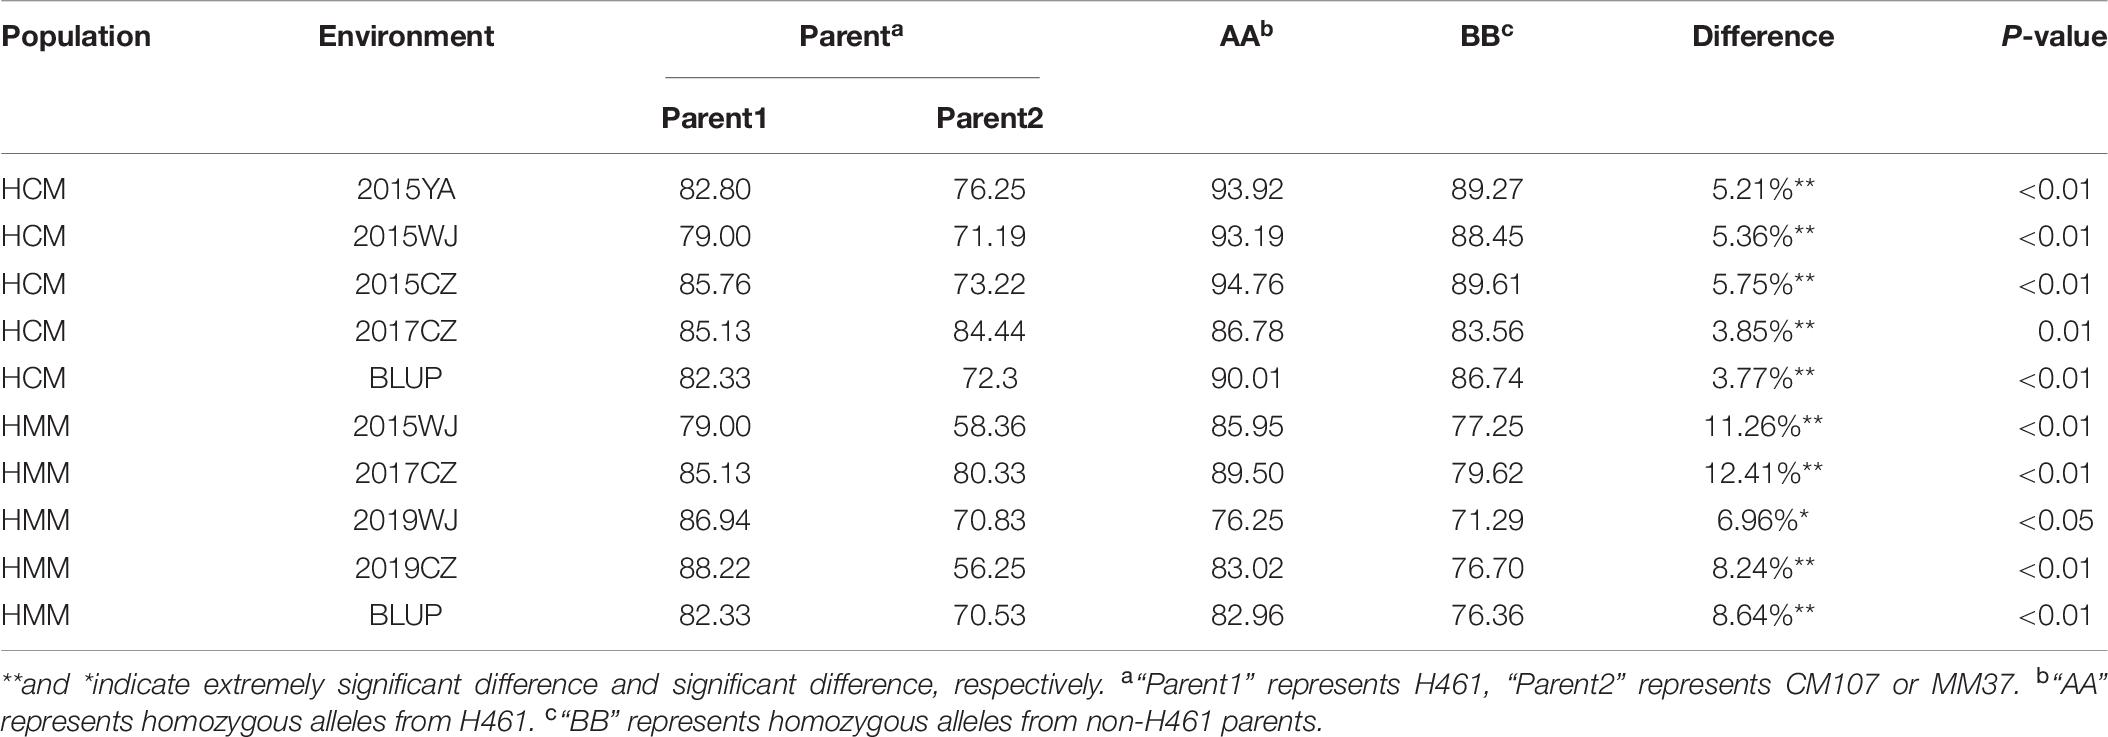
Two populations (HCM and HMM) were used for evaluating the effects of the two major QTL in different genetic backgrounds, and the KASP markers were used to identify the genotype. For QPh.sicau-4B, KASP-4B was used to identify the alleles in the HCM and HMM populations and were classified into two groups. Significant differences (P < 0.05) were detected between “AA” and “BB” genotypes in three environments for HCM and four environments for HMM (Table 5). The differences in PH ranged from 2.56 to 9.24% in the HCM and HMM populations. For QPh.sicau-6D, KASP-6D was used to identify the alleles in the HCM and HMM populations and were classified into two groups. Significant differences (P < 0.05) were detected between “AA” and “BB” genotypes in four environments for HCM and four environments for HMM (Table 6). The differences in PH ranged from 3.77 to 12.41% in the HCM and HMM populations. And the effects of Qph.sicau-6D was higher than Qph.sicau-4B in the validation populations, which may be responsible by different genetic backgrounds.
Potential Candidate Genes
A total of 224 high-confidence (HC) genes were selected from the QPh.sicau-4B and QPh.sicau-6D intervals, and 62 HC genes with low expression in various tissues were excluded (Figure 4). Finally, 47 HC genes from QPh.sicau-4B were selected for gene annotation, including Rht-B1. And 115 HC genes from QPh.sicau-6D were selected for gene annotation, including YDA, BUB1, and PAT10 (Supplementary Table S2 and Table 7).
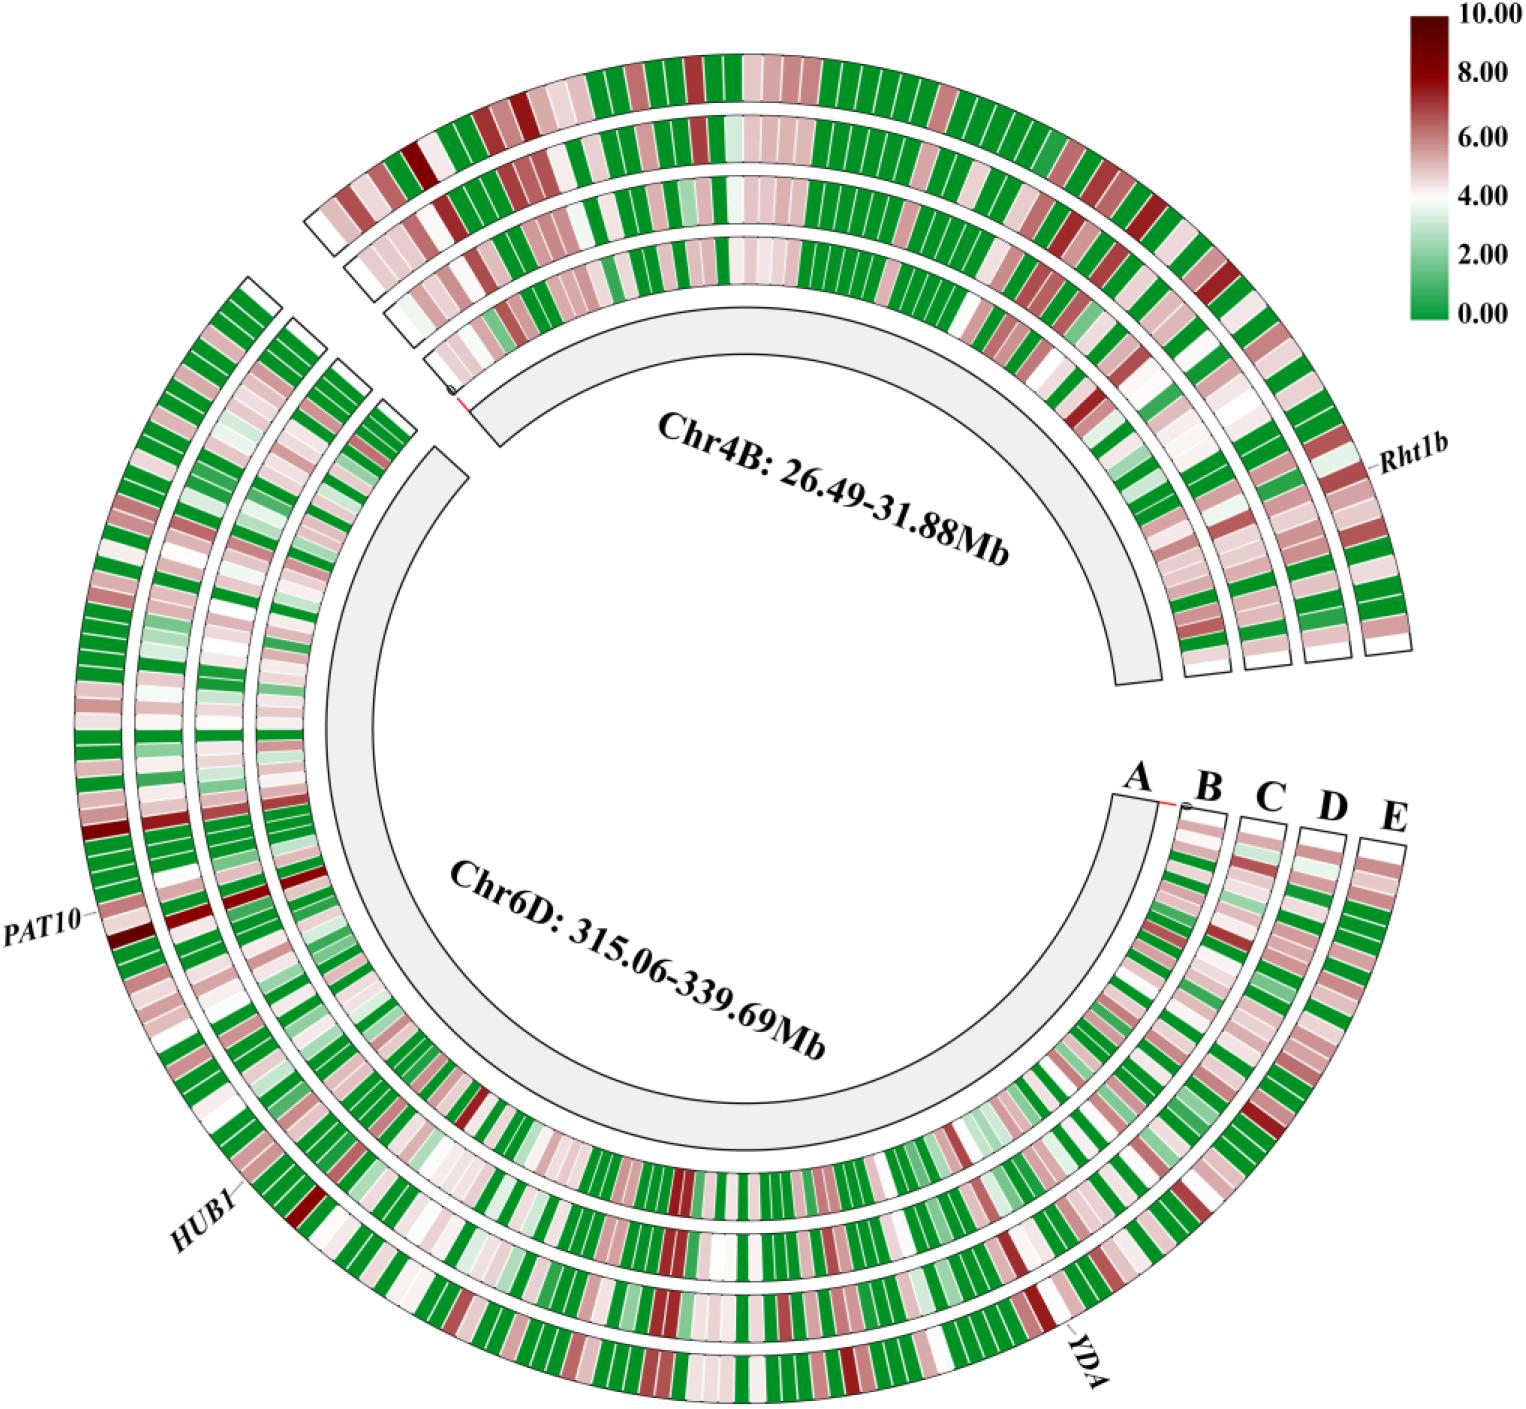
Figure 4. The genes expression of in various tissues in the QPh.sicau-4B interval and QPh.sicau-6D interval from the expVIP Wheat Expression Brower (A: physical map of chromosome 4B and chromosome 6D, B: root, C: leaf, D: spike, E: grain).
Sequence analysis of the four candidate genes, revealed 2 SNPs and 1 insertion/deletion (indel) between H461 and CN16 for Rht-B1, one T for C substitution (C(190)T) converts the codon (CGA) to a translational stop codon (TGA) in CN16 (Figure 5A). For TraesCS6D02G227300, 1 SNP in the intron region between H461 and CN16 was found (Figure 5B). Five SNPs in the coding sequence, 4 SNPs in the intron region, and 1 SNP in the promoter region for TraesCS6D02G233000 were detected between H461 and CN16 (Figure 5C). However, no sequence variation between H461 and CN16 was identified for TraesCS6D02G234900.
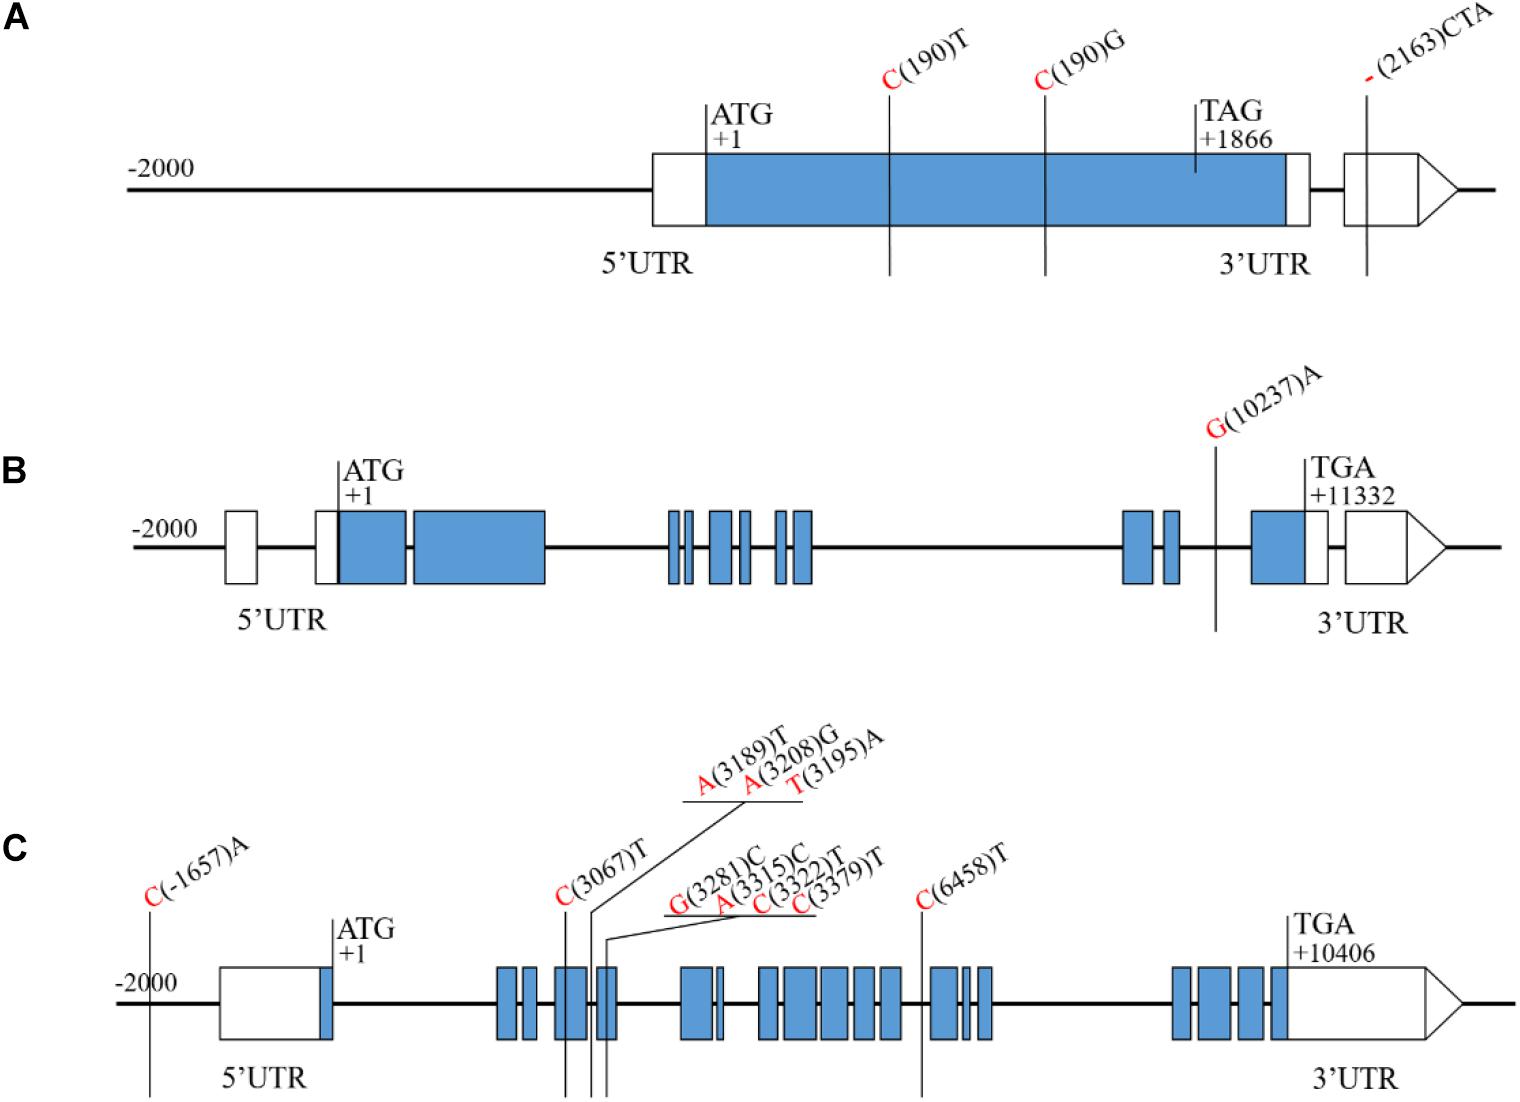
Figure 5. Sequence analysis of the candidate genes showing the SNPs and Indels between H461 and CN16. The nucleotide of H461 and CN16 are shown in red and black, respectively (A: Rht-1B, B: TraesCS6D02G227300, C: TraesCS6D02G233000).
Discussion
Plant height is a critical trait that influences plant architecture and grain yield potential in wheat, and it is controlled by multiple genes functioning together (Spielmeyer et al., 2007; Singh et al., 2016). Exploring PH QTL and genes is essential for wheat breeding, and the identification of QTL associated with PH on different chromosomes has been widely reported (Zhang et al., 2010; Liu et al., 2014; Gao et al., 2015; Chai et al., 2018). In this study, two stable and major QTL for PH were identified in different environments and were validated in different genetic backgrounds. QPh.sicau-4B was located in a 7.67-cM interval and mapped between 26.49 and 31.88 Mb on the physical map of chromosome 4B (Figures 2, 4). QPh.sicau-6D was located in a 2.9-cM interval and mapped between 315.06 and 339.69 Mb on the physical map of chromosome 6D (Figures 3, 4).
QPh.sicau-6D Is a Novel QTL for PH
QPh.sicau-6D was physically mapped between 315.06 and 339.69 Mb of chromosome 6D. Several known QTL responsible for PH have been mapped on chromosome 6D, including QPh.spa-6D, and QPh.cau-6D (Supplementary Table S3). We tried to compare the physical positions of these QTL to assess their relationship with QPh.sicau-6D. Physical mapping showed that QPh.spa-6D (Singh et al., 2016) was mapped to intervals 3.6–5.8 Mb of the chromosome 6D, was far away from QPh.sicau-6D, indicating that they were different loci. The confidence interval of QPh.cau-6D (Guan et al., 2018) was mapped between 283.97 and 292.07 Mb on the physical map. No physical interval of QPh.cau-6D overlapped with QPh.sicau-6D, verifying that they were different loci. These comparisons implied that QPh.sicau-6D was likely a novel QTL for PH.
QPh.cau-4B.2 (Guan et al., 2018) and QPH.caas-4BS.2 (Gao et al., 2015) were mapped to intervals 29.0–35.5 Mb and 21.4–46.6 Mb, respectively, in the 4B chromosome physical map (Supplementary Table S3). Furthermore, the two QTL overlapped with QPh.sicau-4B, implying that QPh.sicau-4B was likely the same locus as QPh.cau-4B.2 and QPH.caas-4BS.2.
Correlations Between the Major PH QTL and Other Spike-Related Traits
Gao et al. (2015) and Guan et al. (2018) reported that PH was significantly positively correlated with the TKW but not with the other spike-related traits. Zhai et al. (2016) reported that PH was positively correlated with the SL but negatively correlated with the SN and SC. In this study, Pearson’s correlation analysis showed that PH was positively correlated with the SL, SN, and TKW (Table 3). This might be because of lines carrying different PH QTL that affect the correlation of PH with other traits. Further analysis of QTL responsible for significant differences in the SL, SC, and TKW between lines with different alleles at QPh.sicau-6D (Supplementary Figure S3) suggested that QPh.sicau-6D confers pleiotropic effects on the SL, TKW, and SC. This interesting perspective warrants further investigation. Additionally, QPh.sicau-4B and QPh.sicau-6D demonstrated superimposed effects on PH (Figure 1), which will allow these two QTL to be simultaneously applied for modifying plant morphological architecture.
Candidate Genes for QPh.sicau-4B and QPh.sicau-6D
In wheat, several reduced height (Rht) genes have been cloned, e.g., Rht-b1, Rht-d1 (Peng et al., 1999), and Rht18 (Ford et al., 2018). Rht-B1 encodes a DELLA transcription factor protein, which participates in gibberellin signaling and thus confers the dwarfing trait to the plant (Peng et al., 1999; Sun, 2010). In the QPh.sicau-4B interval, 24 genes with low expression were removed (Figure 4), and 47 genes were further annotated using KOBAS 3.0 (Supplementary Table S2), which included Rht-B1. The sequence analysis of the Rht-B1 region revealed that a T for C substitution (C(190)T) converts the codon (CGA) to a translational stop codon (TGA) in CN16 (Figure 5), which corresponded to dwarfing gene Rht-B1b (Pearce et al., 2011). Thus, QPh.sicau-4B possibly corresponded to dwarfing gene Rht-B1.
In the QPh.sicau-6D interval, 38 genes with low expression were removed (Figure 4), and 115 genes were further annotated using KOBAS 3.0 (Supplementary Table S2). Among these genes, three have been reported to be involved in plant growth and development and to affect PH in Arabidopsis and rice. YDA encodes a ubiquitously expressed MAPKK kinase and is sensitive to the hormone signal transduction pathway in dwarf phenotype mutants (Lukowitz et al., 2004). PAT10 encodes an S-acyltransferase protein, which is critical for development, and the pat10 mutant demonstrates characteristics such as slow cell expansion and cell division and dwarfism (Zhou et al., 2013). HUB1 is an important regulatory gene for normal plant development as it is involved in histone H2B monoubiquitination; the hub1 mutants showed a dwarf phenotype compared with the wild type in Arabidopsis and rice (Fleury et al., 2007; Cao et al., 2015). Of these three candidate genes (TraesCS6D02G227300, TraesCS6D02G233000, and TraesCS6D02G234900) for QPh.sicau-6D, TraesCS6D02G233000 has five SNPs in the coding sequence and five SNPs in the non-coding sequence between H461 and CN16 (Figure 5), which led to the substitution of three amino acids (V/A, R/G, T/N). Thus, the gene TraesCS6D02G233000 might be the candidate gene for further research on QPh.sicau-6D.
Conclusion
In conclusion, two major stable QTL controlling PH were identified in the HCN population across different environments and were validated in the HCM and HMM populations. QPh.sicau-4B possibly corresponded to dwarfing gene Rht-B1. QPh.sicau-6D appears to be a novel QTL for PH, with pleiotropic effects on the SL, TKW, and SC, and thus, QPh.sicau-6D is a potential locus worth exploring further for genetic improvement in wheat breeding programs.
Data Availability Statement
The raw data supporting the conclusions of this article will be made available by the authors, without undue reservation.
Author Contributions
ZW and HH drafted and revised the manuscript. XJ, YT, YL, FW, and SH conducted phenotype data analysis and contributed to QTL analysis. CL performed the phenotypic evaluation and helped with data analysis. SL and GC helped to draft the manuscript. YXL designed and coordinated this study and revised the manuscript. All authors have read and approved the final manuscript.
Funding
This study was supported by the National Natural Science Foundation of China (31771794), the National Key Research and Development Program of China (2016YFD0101004 and 2017YFD0100900), the outstanding Youth Foundation of the Department of Science and Technology of Sichuan Province (2016JQ0040), the Key Technology Research and Development Program of the Department of Science and Technology of Sichuan Province (2016NZ0057), and the International Science & Technology Cooperation Program of the Bureau of Science and Technology of Chengdu China (No. 2015DFA306002015-GH03-00008-HZ).
Conflict of Interest
The authors declare that the research was conducted in the absence of any commercial or financial relationships that could be construed as a potential conflict of interest.
Supplementary Material
The Supplementary Material for this article can be found online at: https://www.frontiersin.org/articles/10.3389/fgene.2020.602495/full#supplementary-material
Supplementary Figure 1 | Frequency distribution of PH in the HCN population.
Supplementary Figure 2 | Student’s test the groups carry the alleles from H461 or CN16 at QPh.sicau-4B for spikelet number per spike (SN), spike length (SL), spikelet compactness (SC), thousand kernel weight (TKW), anthesis date FT.
Supplementary Figure 3 | Student’s test the groups carry the alleles from H461 or CN16 at QPh.sicau-6D for spikelet number per spike (SN), spike length (SL), spikelet compactness (SC), thousand kernel weight (TKW), anthesis date FT.
Supplementary Table 1 | The primers used in validation population.
Supplementary Table 2 | The HC-genes in the QPh.sicau-4B interval and QPh.sicau-6D interval.
Supplementary Table 3 | Comparison of the locations of reported PH quantitative trait loci on chromosome 4B with QPh.sicau-4B and chromosome 6D with QPh.sicau-6D.
Footnotes
- ^ http://www.fao.org/faostat/en/#data
- ^ http://wheat.pw.usda.gov/ggpages/wgc/98/Intro.htm
- ^ http://www.wheat-expression.com/
References
Ai, C., and Kong, L. (2018). CGPS: a machine learning-based approach integrating multiple gene set analysis tools for better prioritization of biologically relevant pathways. J. Genet. Genomics 45, 489–504. doi: 10.1016/j.jgg.2018.08.002
Borrill, P., Ramirez-Gonzalez, R., and Uauy, C. (2016). expVIP: a customizable RNA-seq data analysis and visualization platform. Plant Physiol. 170, 2172–2186. doi: 10.1104/pp.15.01667
Cao, H., Li, X., Wang, Z., Ding, M., Sun, Y. Z., Dong, F. Q., et al. (2015). Histone H2B monoubiquitination mediated by HISTONE MONOUBIQUITINATION1 and HISTONE MONOUBIQUITINATION2 is involved in anther development by regulating tapetum degradation-related genes in rice. Plant Physiol. 168, 1389–1405. doi: 10.1104/pp.114.256578
Chai, L. L., Chen, Z. Y., Bian, R., Zhai, H. J., Cheng, X. J., Peng, H. R., et al. (2018). Dissection of two quantitative trait loci with pleiotropic effects on plant height and spike length linked in coupling phase on the short arm of chromosome 2D of common wheat (Triticum aestivum L.). Theor. Appl. Genet. 131, 2621–2637. doi: 10.1007/s00122-018-3177-4
Chen, C. J., Chen, H., Zhang, Y., Thomas, H. R., Frank, M. H., He, Y. H., et al. (2020). TBtools - an integrative toolkit developed for interactive analyses of big biological data. Mol. Plant 13, 1194–1202. doi: 10.1016/j.molp.2020.06.009
Edae, E. A., Byrne, P. F., Haley, S. D., Lopes, M. S., and Reynolds, M. P. (2014). Genome-wide association mapping of yield and yield components of spring wheat under contrasting moisture regimes. Theor. Appl. Genet. 127, 791–807. doi: 10.1007/s00122-013-2257-8
Fleury, D., Himanen, K., Cnops, G., Nelissen, H., Boccardi, T. M., Maere, S., et al. (2007). The Arabidopsis thaliana homolog of yeast BRE1 has a function in cell cycle regulation during early leaf and root growth. Plant Cell 19, 417–432. doi: 10.1105/tpc.106.041319
Ford, B., Foo, E., Sharwood, R., Karafiatova, M., Vrána, J., MacMillan, C., et al. (2018). Rht18 semi-dwarfism in wheat is due to increased expression of GA 2-oxidaseA9 and lower GA content. Plant Physiol. 177, 168–180. doi: 10.1104/pp.18.00023
Gao, F. M., Wen, W., Liu, J. D., Rasheed, A., Yin, G. H., Xia, X. C., et al. (2015). Genome-wide linkage mapping of QTL for yield components, plant height and yield-related physiological traits in the chinese wheat cross zhou 8425B/chinese spring. Front. Plant Sci. 6:1099. doi: 10.3389/fpls.2015.01099
Griffiths, S., Simmonds, J., Leverington, M., Wang, Y. K., Fish, L., Sayers, L., et al. (2012). Meta-QTL analysis of the genetic control of crop height in elite European winter wheat germplasm. Mol. Breeding 29, 159–171. doi: 10.1007/s11032-010-9534-x
Guan, P. F., Lu, L. H., Jia, L. J., Kabir, M. R., Zhang, J. B., Lan, T. Y., et al. (2018). Global QTL analysis identifies genomic regions on chromosomes 4A and 4B harboring stable loci for yield-related traits across different environments in wheat (Triticum aestivum L.). Front. Plant Sci. 9:529. doi: 10.3389/fpls.2018.00529
Hassan, M. A., Yang, M. J., Fu, L. P., Rasheed, A., Zheng, B. Y., Xia, X. C., et al. (2019). Accuracy assessment of plant height using an unmanned aerial vehicle for quantitative genomic analysis in bread wheat. Plant Methods 15:37. doi: 10.1186/s13007-019-0419-7
Kowalsk, A. M., Gooding, M., Ferrante, A., Slafer, G. A., Orford, S., Gasperini, D., et al. (2016). Agronomic assessment of the wheat semi-dwarfing gene Rht8 in contrasting nitrogen treatments and water regimes. Field Crops Res. 191, 150–160. doi: 10.1016/j.fcr.2016.02.026
Liu, D. C., Gao, M. Q., Guan, R. X., Li, R. Z., Cao, S. H., Guo, X. L., et al. (2002). Mapping quantitative trait loci for plant height in wheat (Triticum aestivum L.) using a F2: 3 population. Acta Genet. Sin. 29, 706–711.
Liu, G., Jia, L. J., Lu, L. H., Qin, D. D., Zhang, J. P., Guan, P. F., et al. (2014). Mapping QTL of yield-related traits using RIL population derived from common wheat and Tibetan semi-wild wheat. Theor. Appl. Genet. 127, 2415–2432. doi: 10.1007/s00122-014-2387-7
Liu, Y. X., Tao, Y., Wang, Z. Q., Guo, Q. L., Wu, F. K., Yang, X. L., et al. (2018). Identification of QTL for flag leaf length in common wheat and their pleiotropic effects. Mol. Breeding 38:11. doi: 10.1007/s11032-017-0766-x
Lukowitz, W., Roeder, A., Parmenter, D., and Somerville, C. (2004). A MAPKK kinase gene regulates extra-embryonic cell fate in Arabidopsis. Cell 116, 109–119. doi: 10.1016/S0092-8674(03)01067-5
Pearce, S., Saville, R., Vaughan, S. P., Chandler, P. M., Wilhelm, E. P., Sparks, C. A., et al. (2011). Molecular characterization of Rht-1 dwarfing genes in hexaploid wheat. Plant Physiol. 157, 1820–1831. doi: 10.1104/pp.111.183657
Peng, J. R., Richards, D. E., Hartley, N. M., Murphy, G. P., Devos, K. M., Flintham, J. E., et al. (1999). ‘Green revolution’genes encode mutant gibberellin response modulators. Nature 400:256. doi: 10.1038/22307
Sakamoto, T., and Matsuoka, M. (2004). Generating high-yielding varieties by genetic manipulation of plant architecture. Curr. Opin. Biotechnol. 15, 144–147. doi: 10.1016/j.copbio.2004.02.003
Singh, A., Knox, R. E., DePauw, R. M., Singh, A. K., Cuthbert, R. D., Kumar, S., et al. (2016). Genetic mapping of common bunt resistance and plant height QTL in wheat. Theor. Appl. Genet. 129, 243–256. doi: 10.1007/s00122-015-2624-8
Smith, S. E., Kuehl, R. O., Ray, I. M., Hui, R., and Soleri, D. (1998). Evaluation of simple methods for estimating broad-sense heritability in stands of randomly planted genotypes. Crop Sci. 38, 1125–1129. doi: 10.2135/cropsci1998.0011183X003800050003x
Spielmeyer, W., Hyles, J., Joaquim, P., Azanza, F., Bonnett, D., Ellis, M. E., et al. (2007). A QTL on chromosome 6A in bread wheat (Triticum aestivum) is associated with longer coleoptiles, greater seedling vigour and final plant height. Theor. Appl. Genet. 115, 59–66. doi: 10.1007/s00122-007-0540-2
Sun, T. P. (2010). Gibberellin-GID1-DELLA: a pivotal regulatory module for plant growth and development. Plant Physiol. 154, 567–570. doi: 10.1104/pp.110.161554
Team, R. C. (2013). R: A language and Environment for Statistical Computing. Vienna: R Foundation for Statistical Computing.
Tian, X. L., Wen, W. E., Xie, L., Fu, L. P., Xu, D. G., Fu, C., et al. (2017). Molecular mapping of reduced plant height gene Rht24 in bread wheat. Front. Plant Sci. 8:1379. doi: 10.3389/fpls.2017.01379
Van Ooijen, J. W., and Kyazma, B. V. (2009). MapQTL 6. Software for the Mapping of Quantitative Trait Loci in Experimental Populations of Diploid Species Kyazma BV. Wageningen: Wageningen University.
Wang, Z. Q., Liu, Y. X., Shi, H. R., Mo, H. J., Wu, F. K., Lin, Y., et al. (2016). Identification and validation of novel low-tiller number QTL in common wheat. Theor. Appl. Genet. 129, 603–612. doi: 10.1007/s00122-015-2652-4
Würschum, T., Langer, S. M., and Longin, C. F. H. (2015). Genetic control of plant height in European winter wheat cultivars. Theor. Appl. Genet. 128, 865–874. doi: 10.1007/s00122-015-2476-2
Zhai, H. J., Feng, Z. Y., Li, J., Liu, X. Y., Xiao, S. H., Ni, Z. F., et al. (2016). QTL analysis of spike morphological traits and plant height in winter wheat (Triticum aestivum L.) using a high-density SNP and SSR-based linkage map. Front. Plant Sci. 7:1617. doi: 10.3389/fpls.2016.01617
Zhang, L. Y., Liu, D. C., Guo, X. L., Yang, W. L., Sun, J. Z., Wang, D. W., et al. (2010). Genomic distribution of quantitative trait loci for yield and yield-related traits in common wheat. J. Integr. Plant Biol. 52, 996–1007. doi: 10.1111/j.1744-7909.2010.00967.x
Keywords: wheat, plant height, quantitative trait locus, validation, candidate gene
Citation: Wang Z, Hu H, Jiang X, Tao Y, Lin Y, Wu F, Hou S, Liu S, Li C, Chen G and Liu Y (2020) Identification and Validation of a Novel Major Quantitative Trait Locus for Plant Height in Common Wheat (Triticum aestivum L.). Front. Genet. 11:602495. doi: 10.3389/fgene.2020.602495
Received: 03 September 2020; Accepted: 02 October 2020;
Published: 22 October 2020.
Edited by:
Penghao Wang, Murdoch University, AustraliaReviewed by:
Hai Long, Chinese Academy of Sciences, ChinaZehou Liu, Sichuan Academy of Agricultural Sciences, China
Zitong Yu, Kansas State University, United States
Copyright © 2020 Wang, Hu, Jiang, Tao, Lin, Wu, Hou, Liu, Li, Chen and Liu. This is an open-access article distributed under the terms of the Creative Commons Attribution License (CC BY). The use, distribution or reproduction in other forums is permitted, provided the original author(s) and the copyright owner(s) are credited and that the original publication in this journal is cited, in accordance with accepted academic practice. No use, distribution or reproduction is permitted which does not comply with these terms.
*Correspondence: Yaxi Liu, bGl1eWF4aUBzaWNhdS5lZHUuY24=; orcid.org/0000-0001-6814-7218
†These authors have contributed equally to this work
 Zhiqiang Wang1†
 Yaxi Liu