
95% of researchers rate our articles as excellent or good
Learn more about the work of our research integrity team to safeguard the quality of each article we publish.
Find out more
ORIGINAL RESEARCH article
Front. Genet. , 04 September 2020
Sec. Genomics of Plants and the Phytoecosystem
Volume 11 - 2020 | https://doi.org/10.3389/fgene.2020.580452
This article is part of the Research Topic Pan-Genome Level Genotype and Phenotype Prediction: Advances in Precision Agriculture View all 15 articles
 Shangqing Gao1†
 Jiaqi Xia1†
 Shu Yuan1Youjie Shen1Xinting Zhong1Senfeng Zhang1Yuhang Li1Deyi Hu1
 Jian Zeng1Ting Lan1
 Yaxi Liu2
 Guangdeng Chen1*
Phosphorus (P) deficiency in agricultural soil is a major constraint for crop production and increasing P acquisition efficiency (PAE) of plants is considered as one of the most cost-effective solutions for yield increase. The objective of this study was to detect quantitative trait loci (QTL) controlling (PAE) and P utilization efficiency (PUE) in barley under applied (+P) and non-applied P (−P) conditions. Based on the analysis of a recombinant inbred lines (RILs) population derived from a cross between a malting barley variety and a wild barley accession, 17 QTL controlling PAE, PUE and yield traits were detected. The phenotypic variation explained by each of these QTL ranges from 11.0 to 24.7%. Significant correlation was detected between most of P-related traits and yield traits. Five QTL clusters were identified on four different chromosomes (1H, 3H, 5H, and 7H). Two of the QTL clusters, located on chromosome 1H (for GPUP/PUP) and 7H (for SPUE/SPC), respectively, are novel. Fourteen genes located in the interval harboring the major QTL were identified as candidates associated with P efficiency. The stable QTL for PAE, PUE and yield-related traits could be important for breeding P-efficient barley varieties.
Phosphorus (P) is one of the most important mineral nutrient elements for plant development and it plays an irreplaceable role in agricultural productions (Su et al., 2006; Wang and Yan, 2010; Noack et al., 2014). Although agronomic inputs of P fertilizer and manure collectively exceeded P removal by harvested crops at the global scale, P deficits covered almost 30% of the global cropland area (Macdonald et al., 2011). The application of P fertilizers is one of the most effective methods to alleviate soil P deficiency (Shen et al., 2011). However, most of the applied P may be immobilized by calcium (Ca) and magnesium (Mg) in alkaline soils or by ferrum (Fe) and aluminum (Al) in acid soils (Holford, 1997; Yang et al., 2011). Thus only 10–20% P could be absorbed in the year of application (Yang et al., 2011). The mineral phosphate is non-renewable (Sattari et al., 2012) and the un-absorbed P will run-off into surface water to cause eutrophication (Carpenter, 2008). It is widely believed that developing cultivars with high-efficiency P acquisition and utilization in P-deficient soils is one of the most economical and sustainable solutions in crop breeding programs worldwide (Yan et al., 2006; Liang et al., 2010).
It has been reported that P efficiency in crops was affected by a number of quantitative trait loci (QTL) (Yang et al., 2011). Based on mechanisms developed by plants to acquire and utilize P from the soils (Yang et al., 2011), the mapped QTL could be classified into two major types: for P acquisition efficiency (PAE) and for P utilization efficiency (PUE) (Yang et al., 2011). QTL for P efficiency have been identified in several crops including common wheat (Triticum aestivum) (Su et al., 2006), maize (Zea mays) (Cai et al., 2012), and rice (Oryza sativa) (Nishida et al., 2018). In wheat, a large number of P efficiency-related QTL have been detected. For example, Su et al. (2006) detected several QTL on seven different chromosomes (3B, 4B, 5A, 5D, 6A, 6B, and 7A, respectively) for PUE under P deficient and sufficient conditions. Four important QTL clusters controlling PAE and PUE were found at both seedling and mature stages of plant development (Yuan et al., 2017) (Six QTL for PAE were co-located with the QTL for zinc concentration or content in wheat grains (Shi et al., 2008). Therefore, genome-wide scanning for QTL controlling PAE and PUE could be an important work in crop breeding programs.
Barley (Hordeum vulgare L.) is the fourth largest cereal crop worldwide, and it is widely used as animal feed and in brewing industry (Schulte et al., 2009). Numerous QTL or genes for important traits of barley have been mapped, fine mapped or even cloned, and they showed great potential in MAS (Peighambari et al., 2005; Tavakol et al., 2015; Li et al., 2016). However, only a limited number of QTL for P efficiency have been reported (Gong et al., 2016; Guo et al., 2017), especially from mature plants. In the present study, the whole genome linkage map of a recombinant inbred lines (RIL) population derived from the cross between a wild barley accession and a cultivar was used to detect QTL for PAE, PUE and yield at maturity stage under both P applied and non-applied soil conditions. Overall, the objective of our study was to focus on excavating the major and stable QTL or QTL clusters that could provide available information for the barley breeding programs.
An RIL population consisting of 128 F7:9 lines derived from a cross between Baudin, a high yielding malting variety adjust to a longer season, higher rainfall cropping region and parts of the medium rainfall cropping region of Western Australia and a wild barley (H. spontaneum) accession, CN4027 was used in this study.
The calcareous alluvial soil used in pot trials was collected from Shuangbai village, Dujiangyan city in Sichuan, China. The physicochemical properties of the soil were shown in Table 1. Two pot trials were carried out (one from November 2016 to June 2017 and the other from November 2017 to June 2018) in the rainproof screenhouses of Sichuan Agricultural University. Each of the trials consisted of two treatments [P deficiency (−P, without P application) and P sufficiency (+P, 30 mg phytate P was applied per kilogram soil)] with three replications. Split plot arrangement was used in these trials. Twelve kg air-dried soil with 1.5 g N and 1.5 g K was crushed and uniformly mixed.
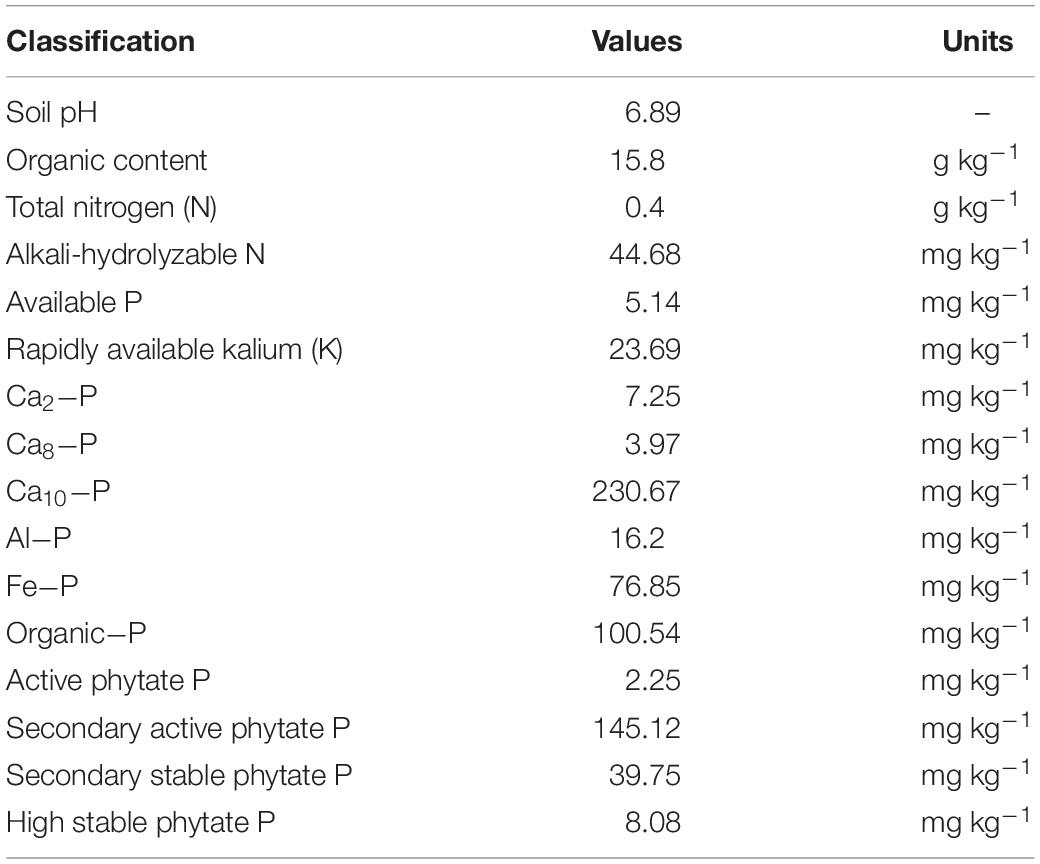
Table 1. Physicochemical property of the experimental soil.
For each replication, 10 uniformly sized seeds of each of RILs as well as the parents were surface-sterilized by soaking in a 10% solution of hydroperoxide (H2O2) for 30 min followed by washing in deionized water. The disinfected seeds were placed in a chamber with constant temperature humidity (20°C, 60% humidity) for germination. Five germinated seeds were planted in each of the pots. Seedlings were thinned at 3-leaf stage and three seedlings were retained in each pot and used for further experiments.
Data for grain yield (GY), straw yield (SY), and dry matter (DM) were collected at maturity (Table 2). Harvested kernels and straws were placed in an over at 105°C for 30 min and then dried at 75°C until constant weights were reached. The dried materials were weighed and grounded to powder for determining phosphorus content with the H2SO4-H2O2-molybdenum antimony colorimetric method (Guo et al., 2017). The evaluated traits were listed in Table 2.
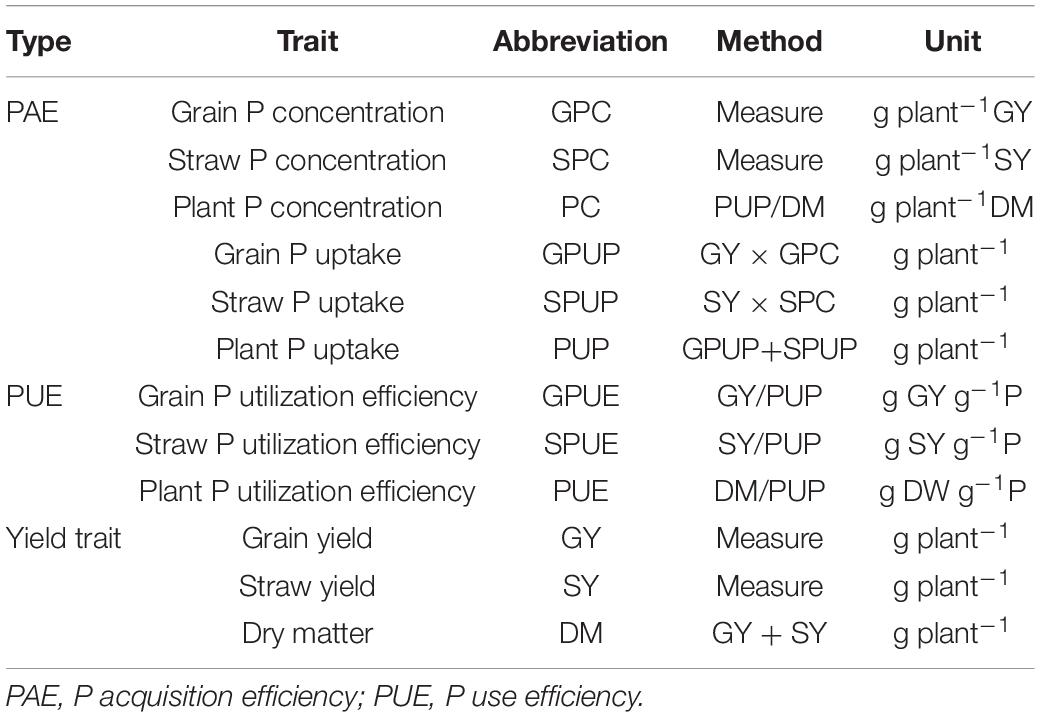
Table 2. The investigated traits and the measurements in this study.
Means of the traits for each RIL from the three replications were used to detect QTL. The genetic linkage map obtained from this population in an earlier study (Guo et al., 2017) was used for QTL mapping. Linkage analysis was carried out using the computer package JoinMap®4.0 (Van Ooijen, 2006). Segregation ratios of assessed markers were tested by Chi-square goodness-of-fit to a 1:1 ratio at the significance level of p = 0.01. LOD thresholds from 3 to 10 were tested and an optimum threshold was obtained. The Kosambi mapping function was used to convert recombination ratios to map distances. MapQTL® 5.0 (Van Ooijen, 2004) was used for QTL analysis. QTL were named following recommendations from the International Rules of Genetic Nomenclature1.
To identify candidate genes for P-related loci, sequences of DArT markers linked closely to QTL were selected from the DArT genotyping provided by the Triticarte Pty. Ltd2. The database Ensembl Plants3 was exploited to determine the physical positions and contigs of the P-related loci. Candidate genes were then further retrieved using physical position and contigs by database BARLEX searches (the Barley Draft Genome Explorer4). Orthologous genes for the candidate genes in other cereals and Arabidopsis were obtained from the PGSB database5.
Phenotype values for each trait were significantly influenced by the application of P. GY, SY, and DM of the parents at −P were significantly lower than those under +P (Table 3). At the same P condition, significant differences between parents were detected for GY, SY, and DM. The cultivated barley Baudin exhibited higher values for each of the traits compared with those for the wild barley genotype CN4027 (Table 3). The coefficient of variation (CV) for the yield-related traits between the two treatments ranged from 28.30 to 52.99% (Table 3). Transgressive segregation in the RIL population was observed for all three traits (Table 3). Continuous variations with approximately normal distributions were detected for these traits.
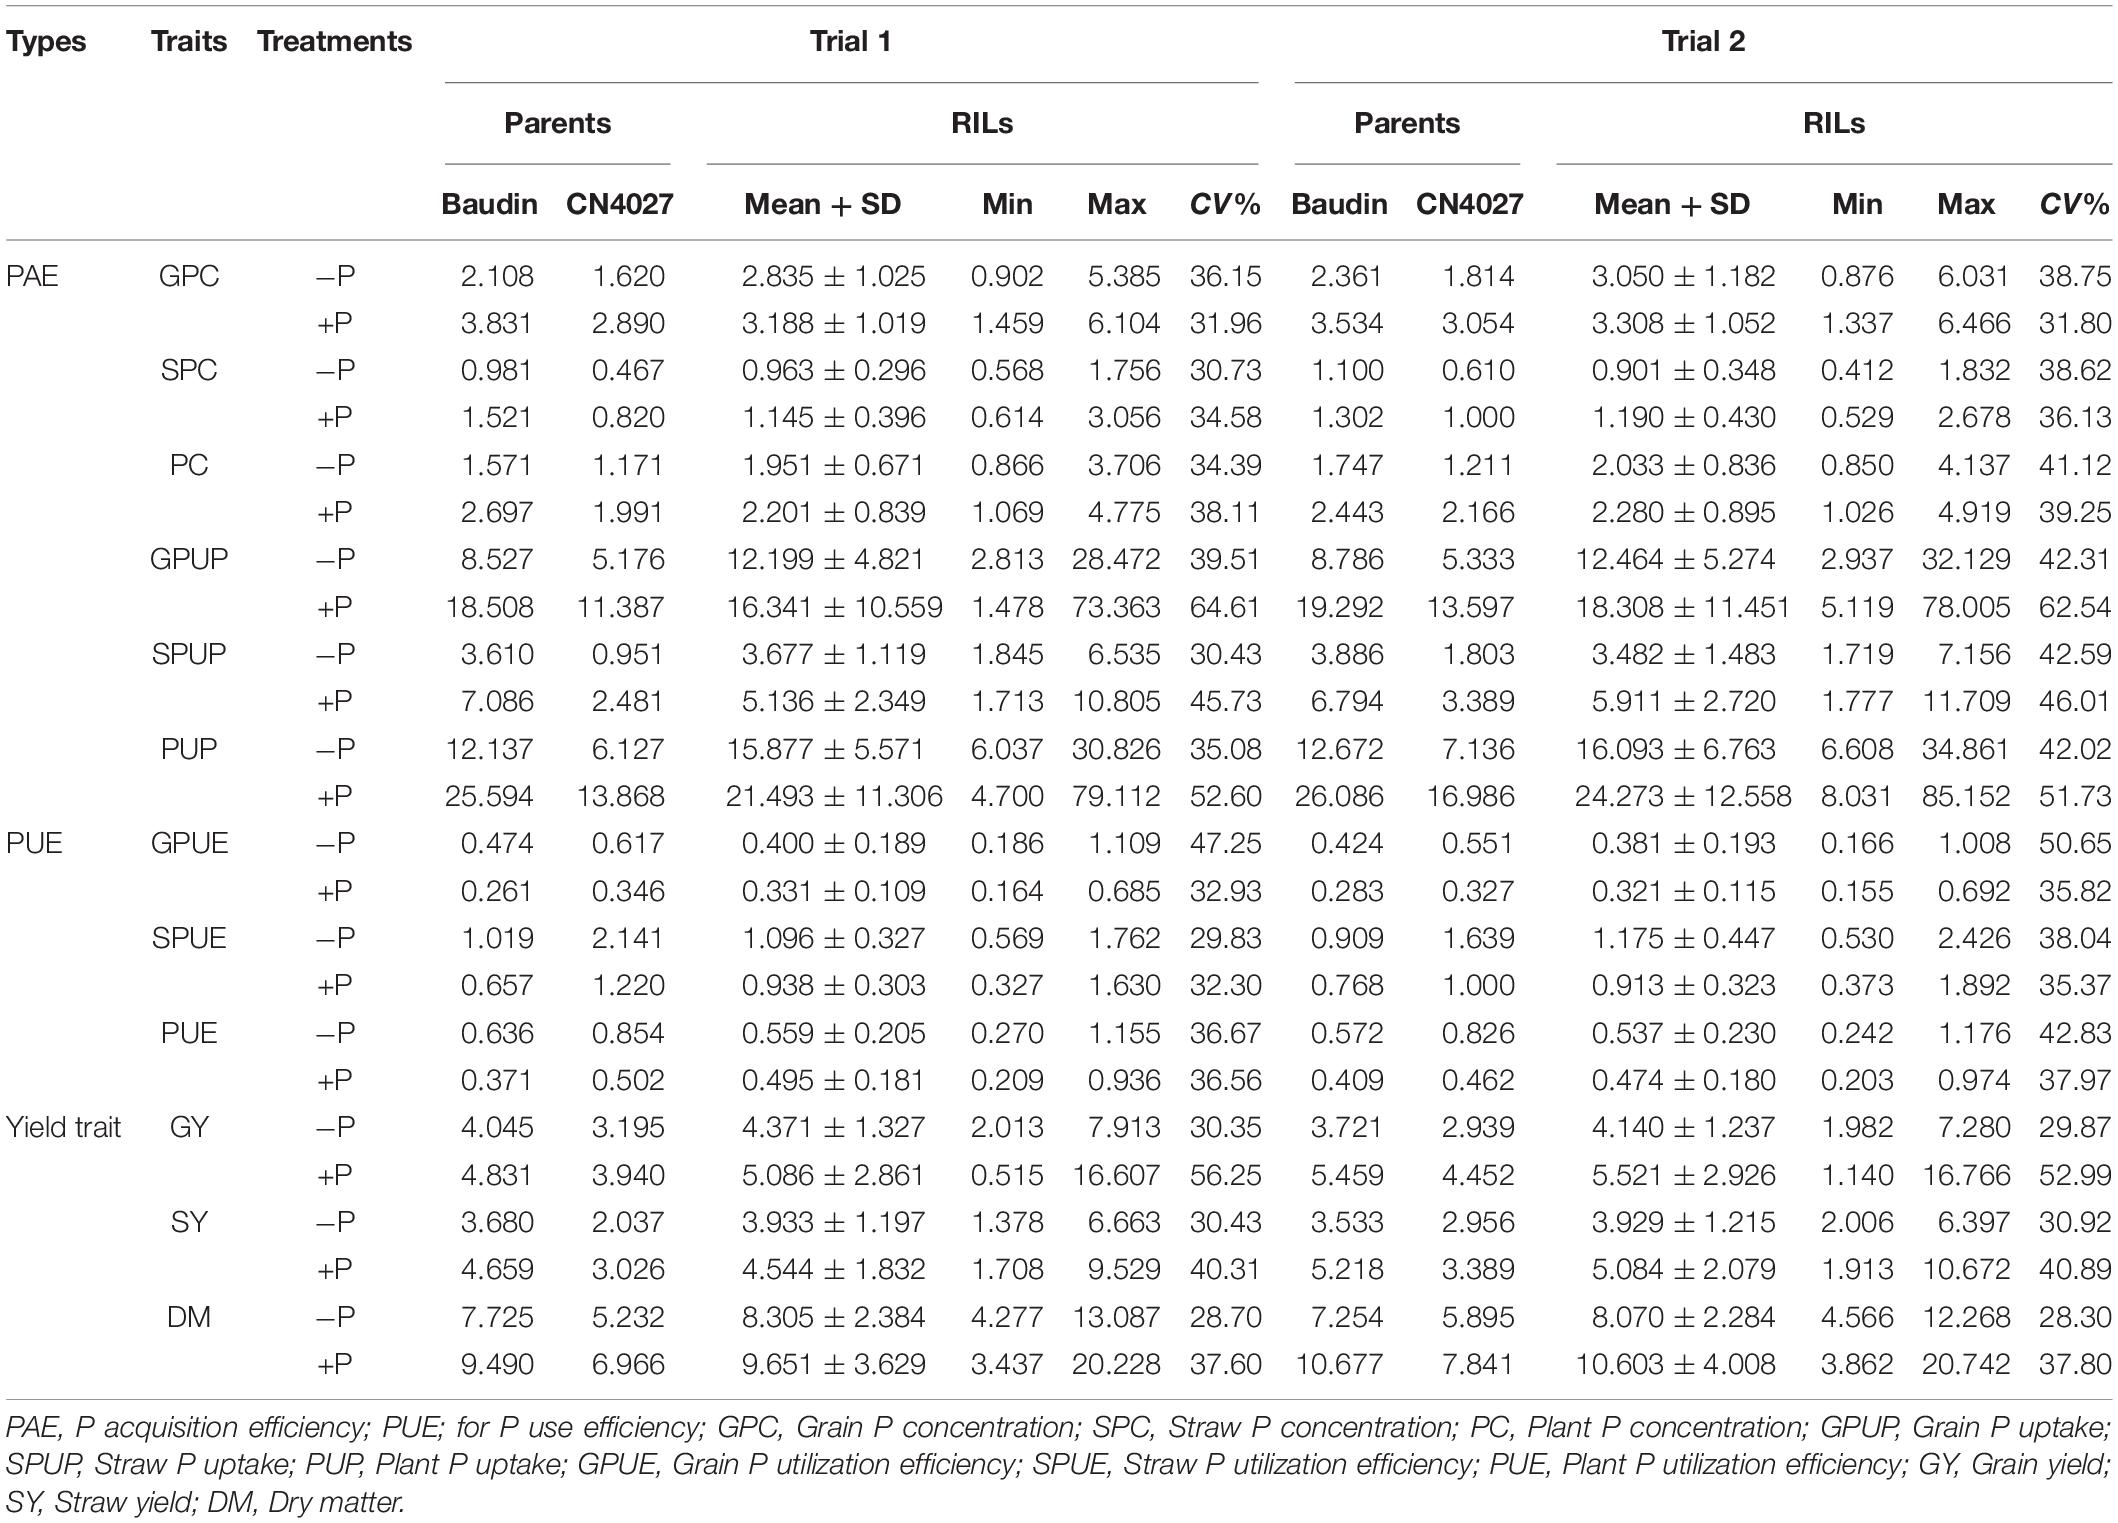
Table 3. Variations of evaluated traits for the RIL population and their parents at maturity.
Compared with those at −P, higher values were obtained for grain P concentration (GPC), straw P concentration (SPC), grain P uptake (GPUP), straw P uptake (SPUP) and plant P uptake (PUP) at +P. However, the values for grain P utilization efficiency (GPUE), straw P utilization efficiency (SPUG), and plant P utilization efficiency (PPUE) were higher at −P (Table 3). There were significant differences in these traits between the two parents under the two different treatments. Compared with the wild barley genotype CN4027, Baudin showed higher values for GPC, SPC, GPUP, SPUP, and PUP but lower values for GPUE, SPUG, and PUE (Table 3). The CV of the seven PAE- and PUE-related traits in the population between the two treatments also showed a wide distribution ranging from 31.80 to 62.54%. The transgressive segregation and approximately normal distributions could be also detected for the P-related traits (Table 3).
Phenotypic correlations between P-related and yield traits under the two treatments were presented in Table 4. Significant correlations were detected between each of the three yield traits and most of the P-related traits under both P conditions (P < 0.01 or 0.05). P-concentrations related traits, including GPC, SPC, and PC, were significantly and negatively correlated with the three yield traits (GY, SY, and DM) under the −P treatment except SPC, PC in trial 2. P-uptake related traits, including GPUP, SPUP and PUP, were significantly and positively correlated with the three yield-related traits (GY, SY, and DM) except GPUP in trial 1 and GPUP and PUP in trial 2 (Table 4). Traits associated with PUE, including SPUE and PUE, showed a significantly positive correlation with two of the yield-related traits (SY and DM) with coefficients ranging from 0.205 to 0.508 (P < 0.05). PC was significantly and negatively correlated with GY and SY under +P treatment. Traits related with P-uptake, including GPUP, SPUP, and PUP, were significantly and positively correlated with DM in both trials with coefficients ranging from 0.362 to 0.748 (P < 0.01).
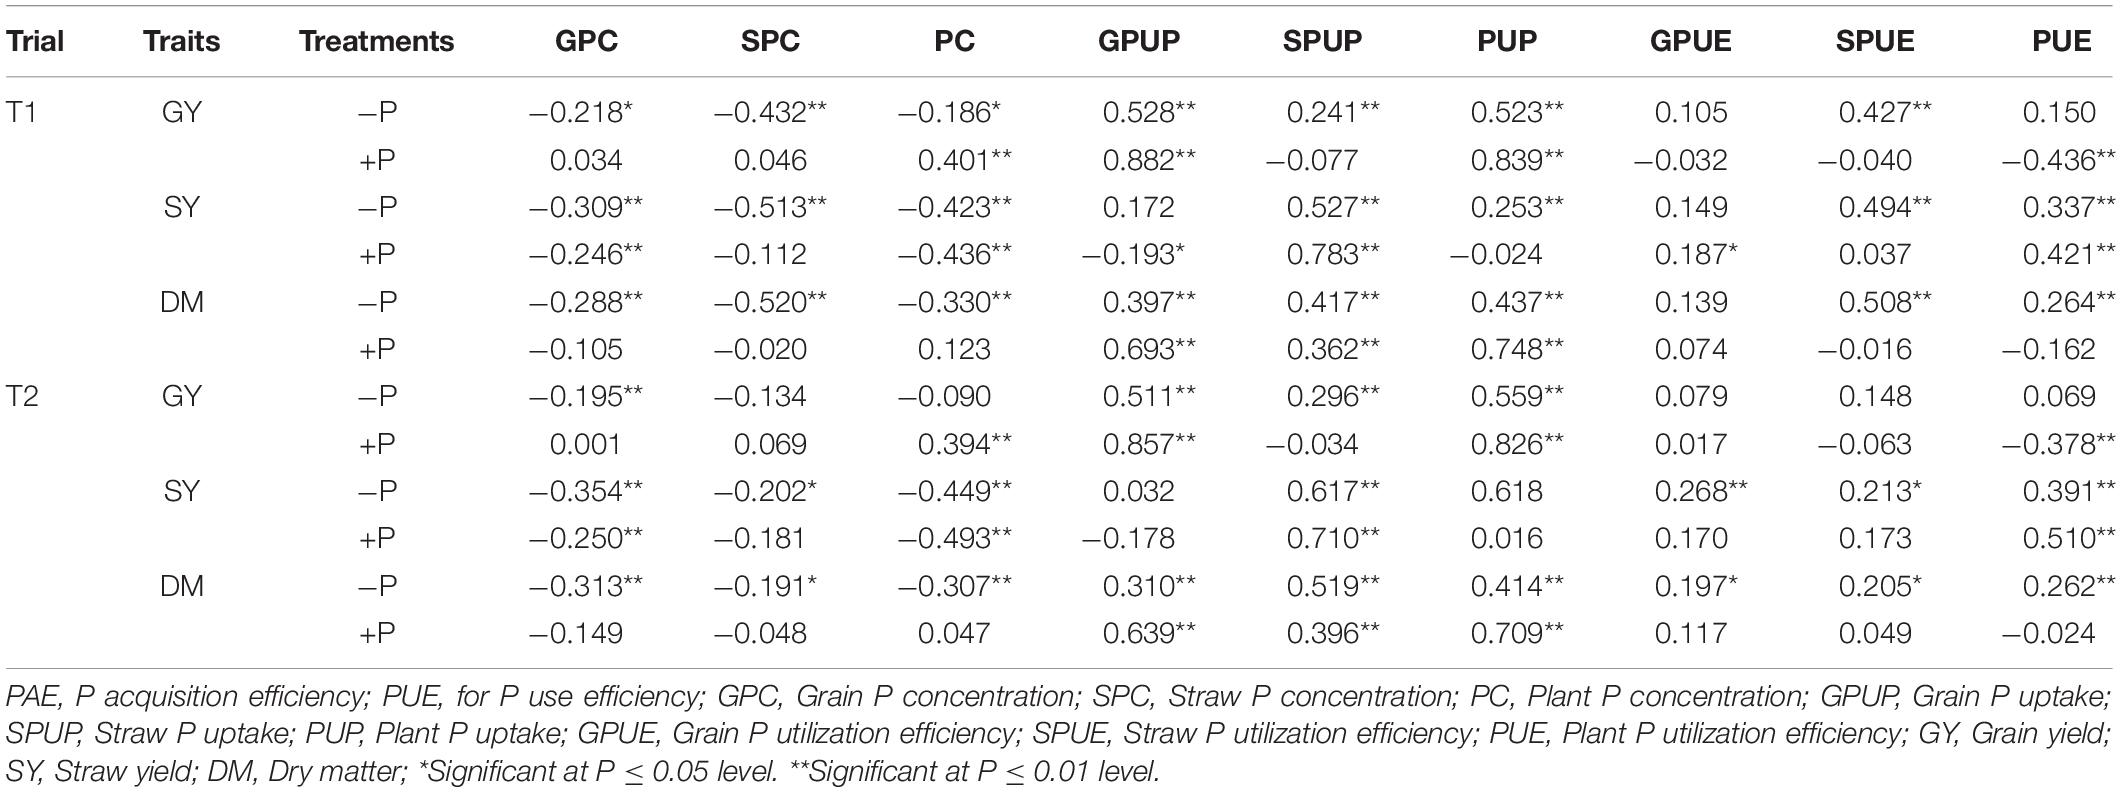
Table 4. Correlations between P- and yield-related traits in the RIL population at maturity in barley.
A total of 17 QTL for P- and yield-related traits were identified. Phenotypic variations explained by these loci varied from 11.0 to 24.7% (Table 5 and Figure 1). LOD values for these loci ranged from 3.03 to 7.31 (Table 5). The 17 QTL were distributed on 4 chromosomes, including 1H (2 QTL), 3H (9 QTL), 5H (2 QTL), and 7H (4 QTL). Positive alleles for eight of these QTL were contributed by Baudin, while the remaining nine were contributed by CN4027. In addition, nine of these 17 QTL were detected in two trials, and three of them were detected at the two P conditions.
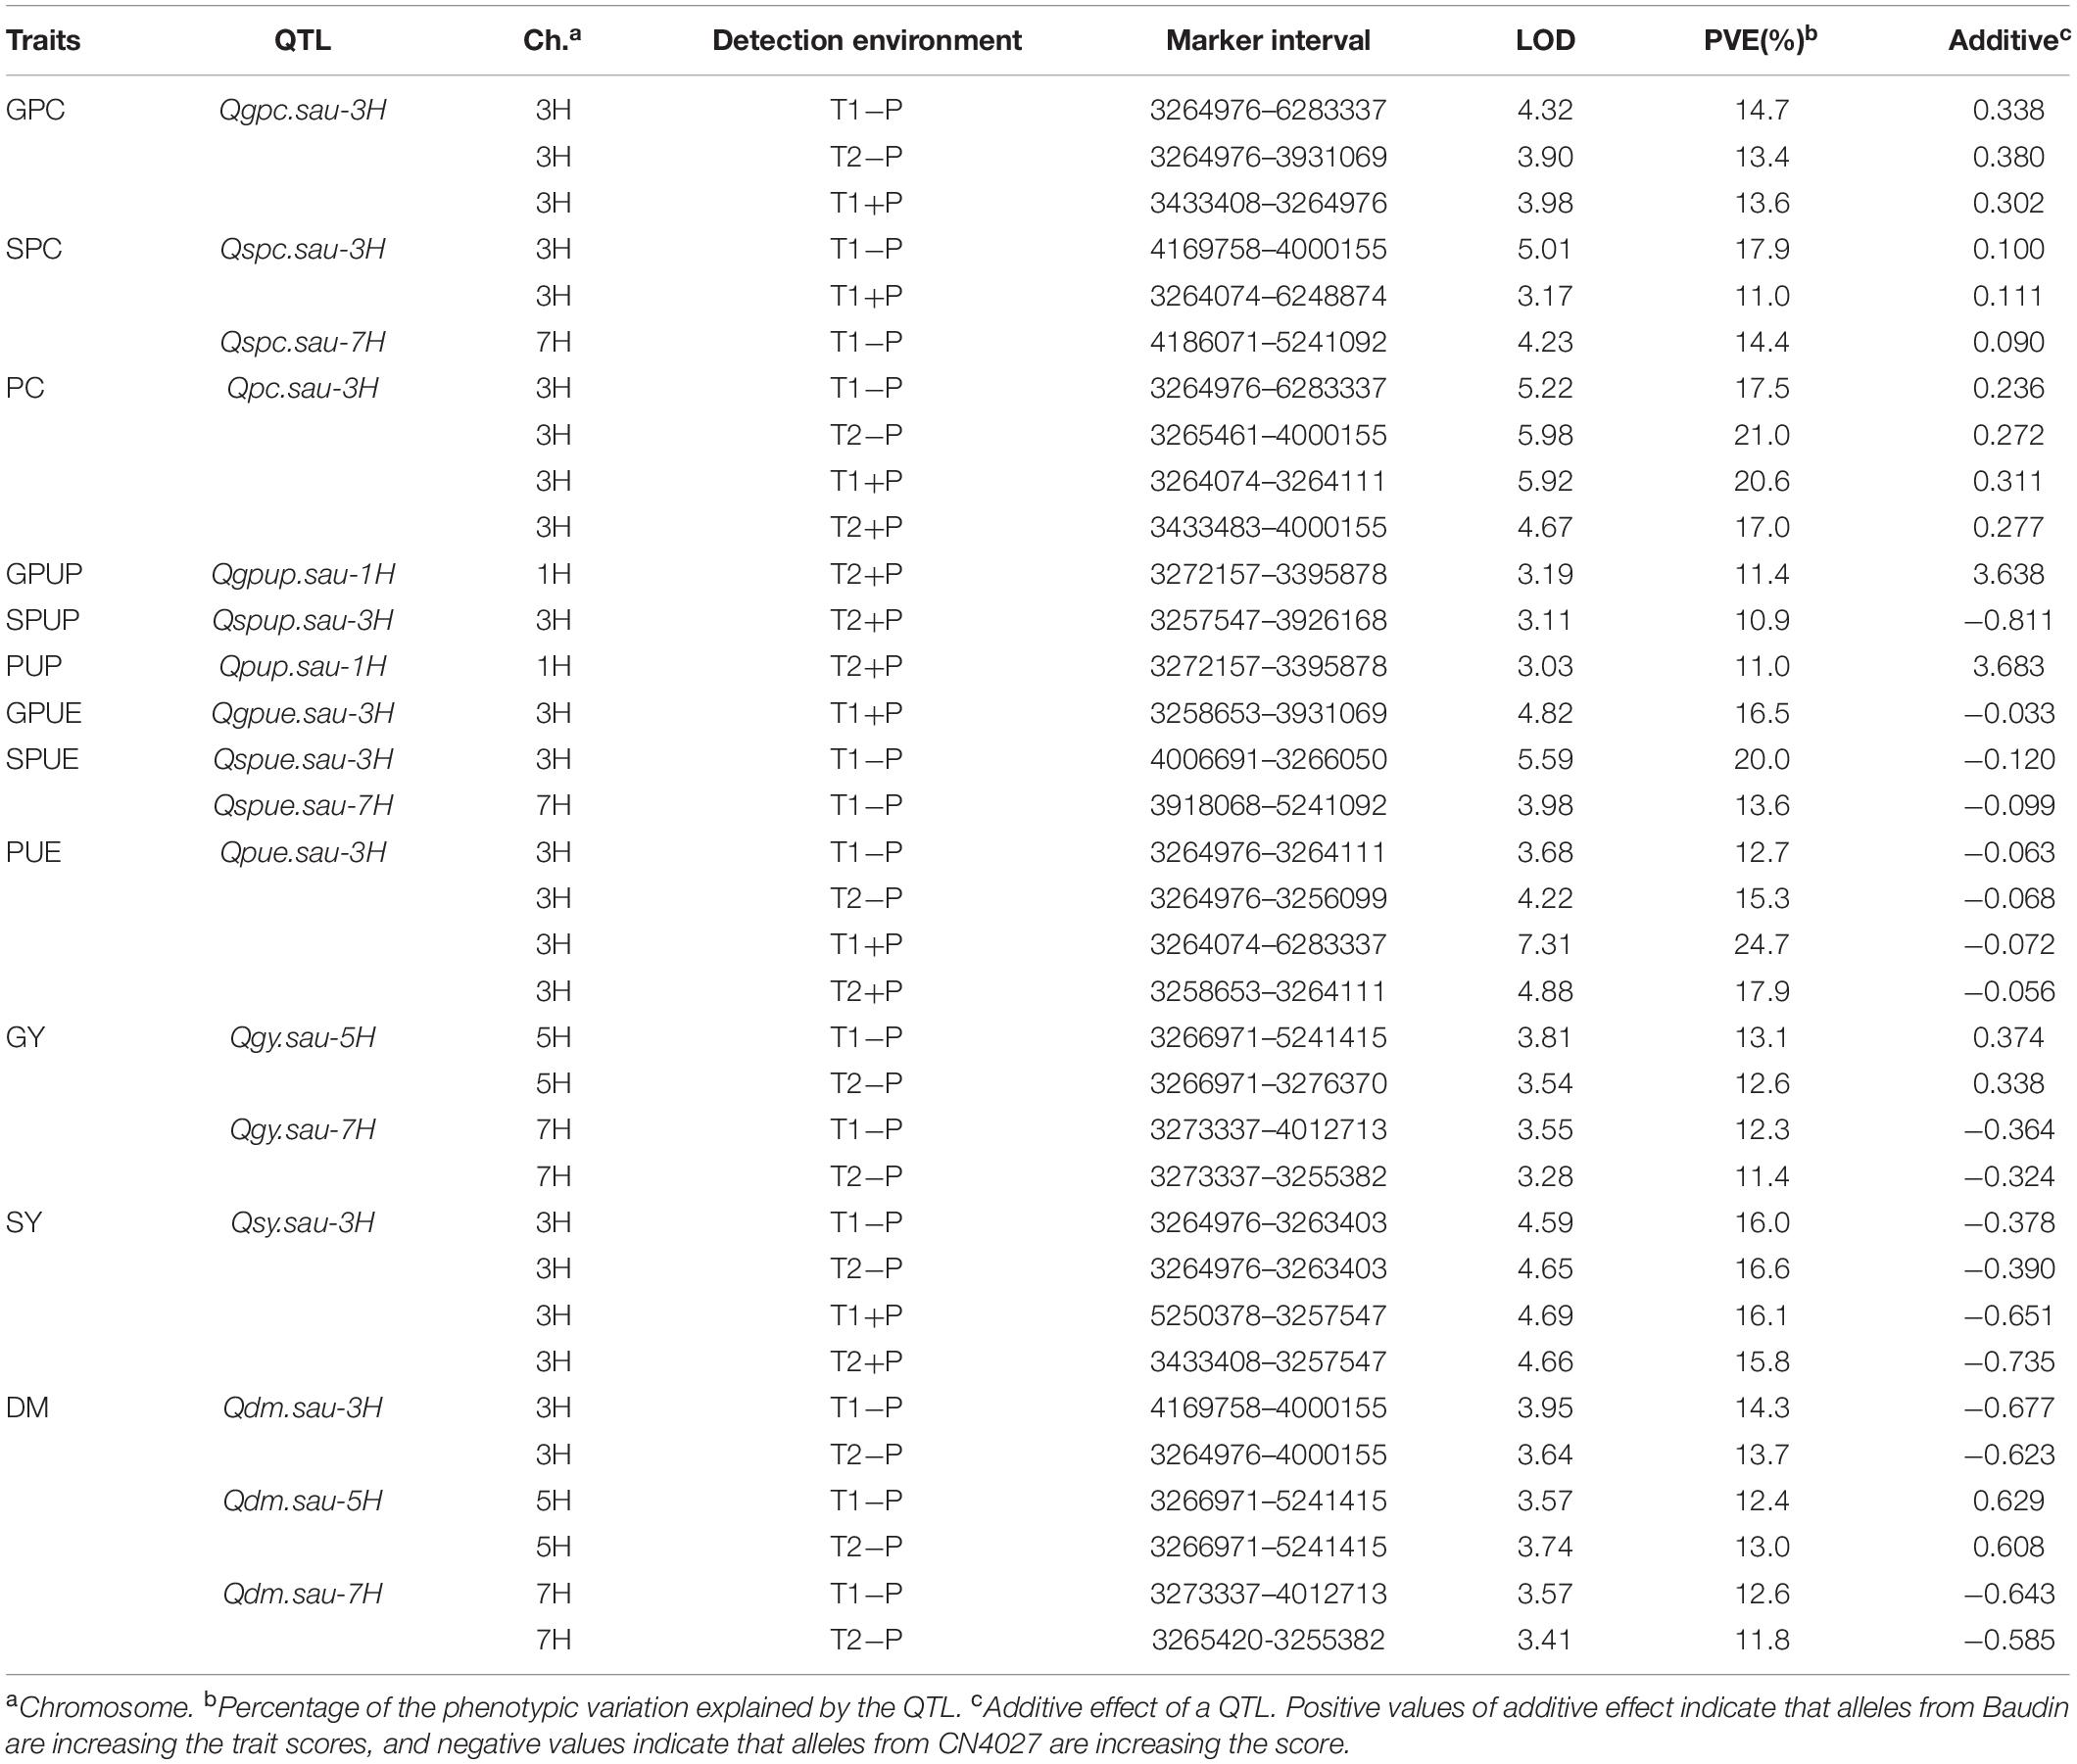
Table 5. QTL for P- and yield traits at maturity in barley.
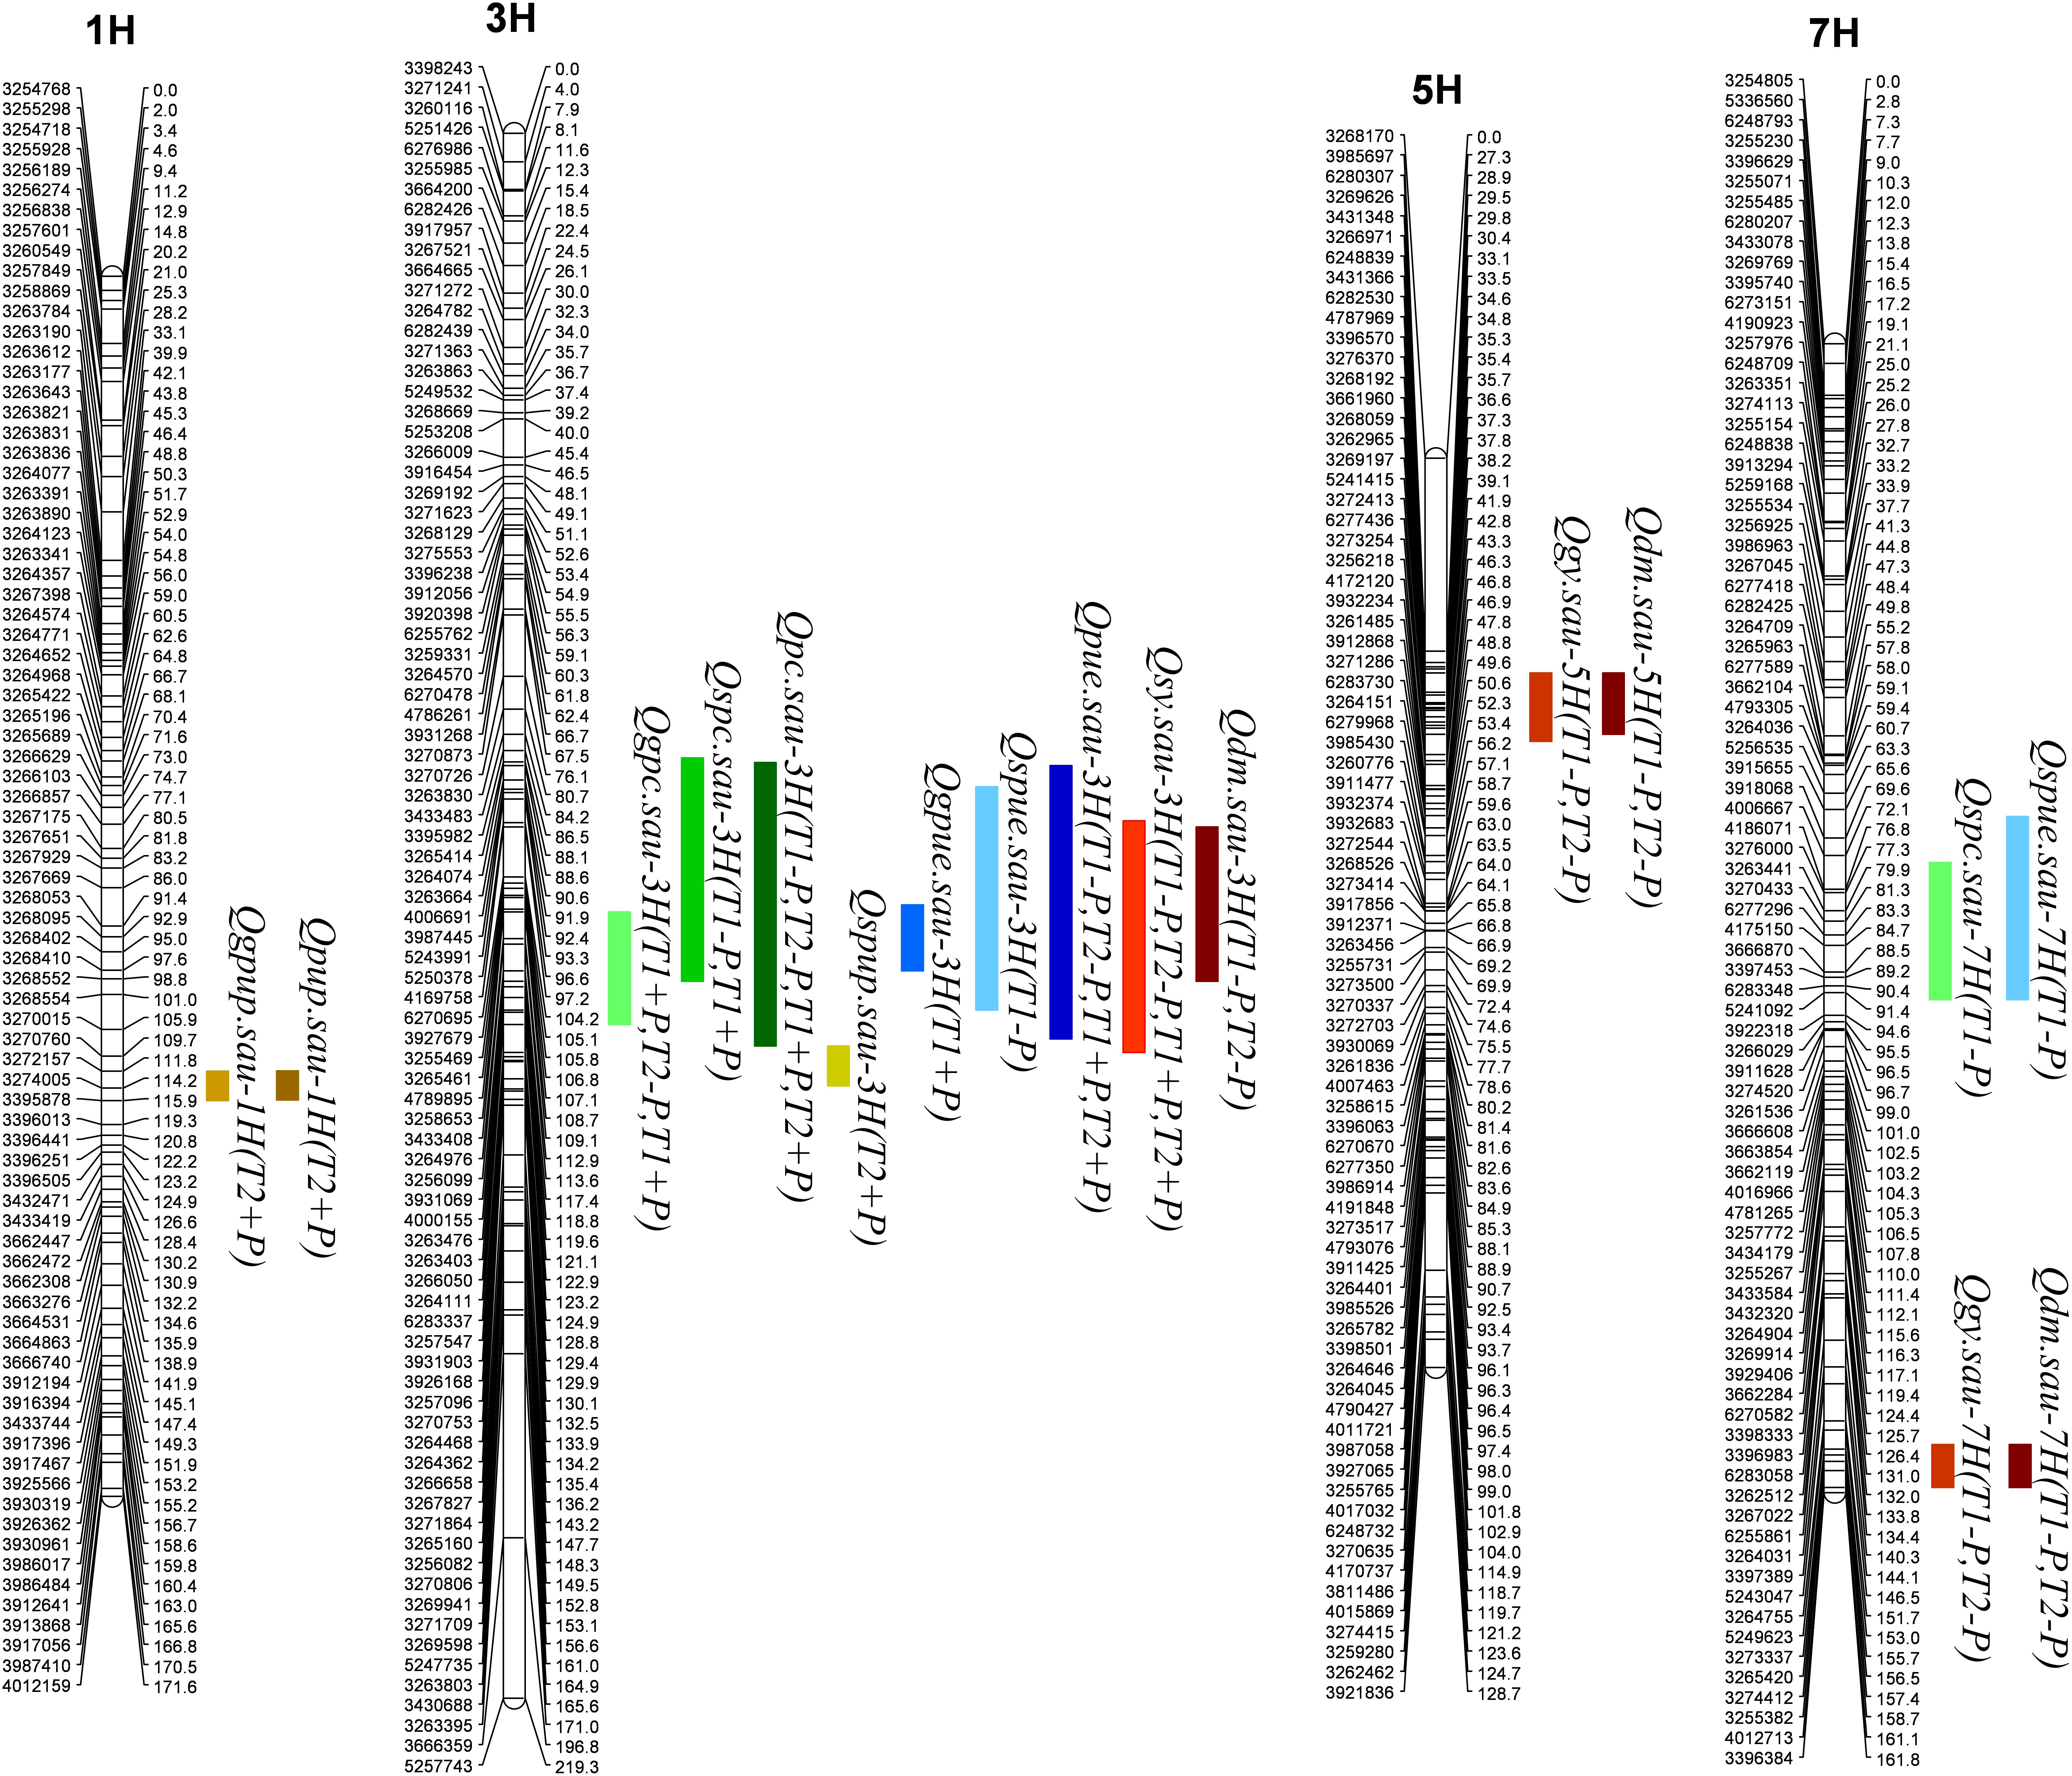
Figure 1. QTL for P- and yield-related traits detected in the RIL population.
One QTL (Qgpc.sau-3H) for GPC was detected on 3H, and its positive allele was derived from Baudin (Figure 1 and Table 5). Qgpc.sau-3H was detected under the two different P conditions in Trial 1 but only under −P condition in Trial 2. Phenotypic variations explained by this locus varied from 13.4 – 14.7 %. Two QTL for SPC were detected and they were mapped on chromosomes 2H and 7H, respectively. The positive alleles for both loci were contributed by Baudin (Figure 1 and Table 5). Qspc.sau-3H was detected at both +P and −P conditions in Trial 1, explaining 17.9 and 11.0% of the phenotypic variation, respectively. Qspc.sau-7H was detected at −P condition in Trial 1 and it explained 14.4% of the phenotypic variation. One significant QTL (Qpc.sau-3H) for PC was detected on chromosome 3H (Figure 1 and Table 5) under both P conditions in both trials conducted. The phenotypic variation explained by these QTL ranged from 17.0 to 21.0% (Table 5). The positive allele of Qpc.sau-3H was contributed by Baudin.
One QTL (Qgpup.sau-1H) for GPUP was detected on 1H under the +P condition from Trial 2, and its positive allele was derived from Baudin (Figure 1 and Table 5). This locus explained 11.4% of the phenotypic variation. One QTL (Qspup.sau-3H) for SPUP was detected on 3H, and the positive allele of it was derived from CN4027 (Figure 1 and Table 5). Qspup.sau-3H was detected at +P condition in Trial 1, and it explained 10.9% of the phenotypic variation. One QTL (Qpup.sau-1H) for PUP was detected on 1H under the +P condition from Trial 2, and its positive allele was also derived from Baudin (Figure 1 and Table 5). This locus explained 11.0% of the phenotypic variation.
One QTL (Qgpue.sau-3H) for GPUE was located on 3H under the +P condition from Trial 1 (Figure 1 and Table 5). This locus explained 16.5% of the phenotypic variation and its positive allele was derived from CN0427. Two QTL for SPUE were located, on 3H and 7H chromosome, respectively. Positive alleles for both QTL were derived from CN0427 (Figure 1 and Table 5). They explained 20.0 and 13.6% of the phenotypic variation, respectively. One stable QTL for PUE (Qpue.sau-3H) was detected on 3H under both P conditions from both Trial 1 and Trial 2 (Figure 1 and Table 5). It explained 12.7 – 24.7% of the phenotypic variation. The positive allele of this locus was derived from CN0427.
Three QTL (Qdm.sau-3H, Qdm.sau-7H, and Qdm.sau-7H) for DM were detected under the −P condition from the two trials. They were mapped on chromosomes 3H, 5H and 7H, respectively (Figure 1 and Table 5). The phenotypic variation explained by these QTL ranged from 11.8 to 14.3% (Table 5). The positive alleles of Qdm.sau-3H and Qdm.sau-7H were contributed by CN4027 and that of Qdm.sau-5H was contributed by Baudin. Two QTL (Qgy.sau-5H and Qgy.sau-7H) for GY were detected and they were mapped on chromosomes 5H and 7H, respectively (Figure 1 and Table 5). Qgy.sau-5H explained 12.6 and 13.1% of the phenotypic variation, respectively, and its positive alleles were contributed by Baudin. Qgy.sau-7H explained 11.4 and 12.3% of the phenotypic variation, respectively, and its positive allele was contributed by CN4027. A stable QTL (Qsy.sau-3H) for SY was detected on chromosome 3H under both the −P and +P conditions from both trials (Figure 1 and Table 5). It was derived from CN4027, and explained 15.8 – 16.6% of the phenotypic variation.
A total of fourteen candidate genes located in intervals harboring the P-related loci were detected by searching the BARLEX database. These candidate genes could be divided into four categories: acid phosphatase, phosphate transporter, acid phosphatase/vanadium-dependent haloperoxidase-related protein, and phospholipid metabolism (Table 6). The acid phosphatase gene (AK354580) and phosphate transporter gene (MLOC_61737.2) were identified in the intervals harboring Qspue.sau-7H and Qspc.sau-7H for PUE and PC. The candidate genes for the other two categories were located on three chromosomes and they confer PUE, PUP, and PC, respectively. One, one and two genes encoding acid phosphatase/vanadium-dependent haloperoxidase-related proteins were identified on 1H, 3H, and 7H, respectively. Two, two, and three genes associated with phospholipid metabolisms were identified on 1H, 3H, and 7H, respectively.
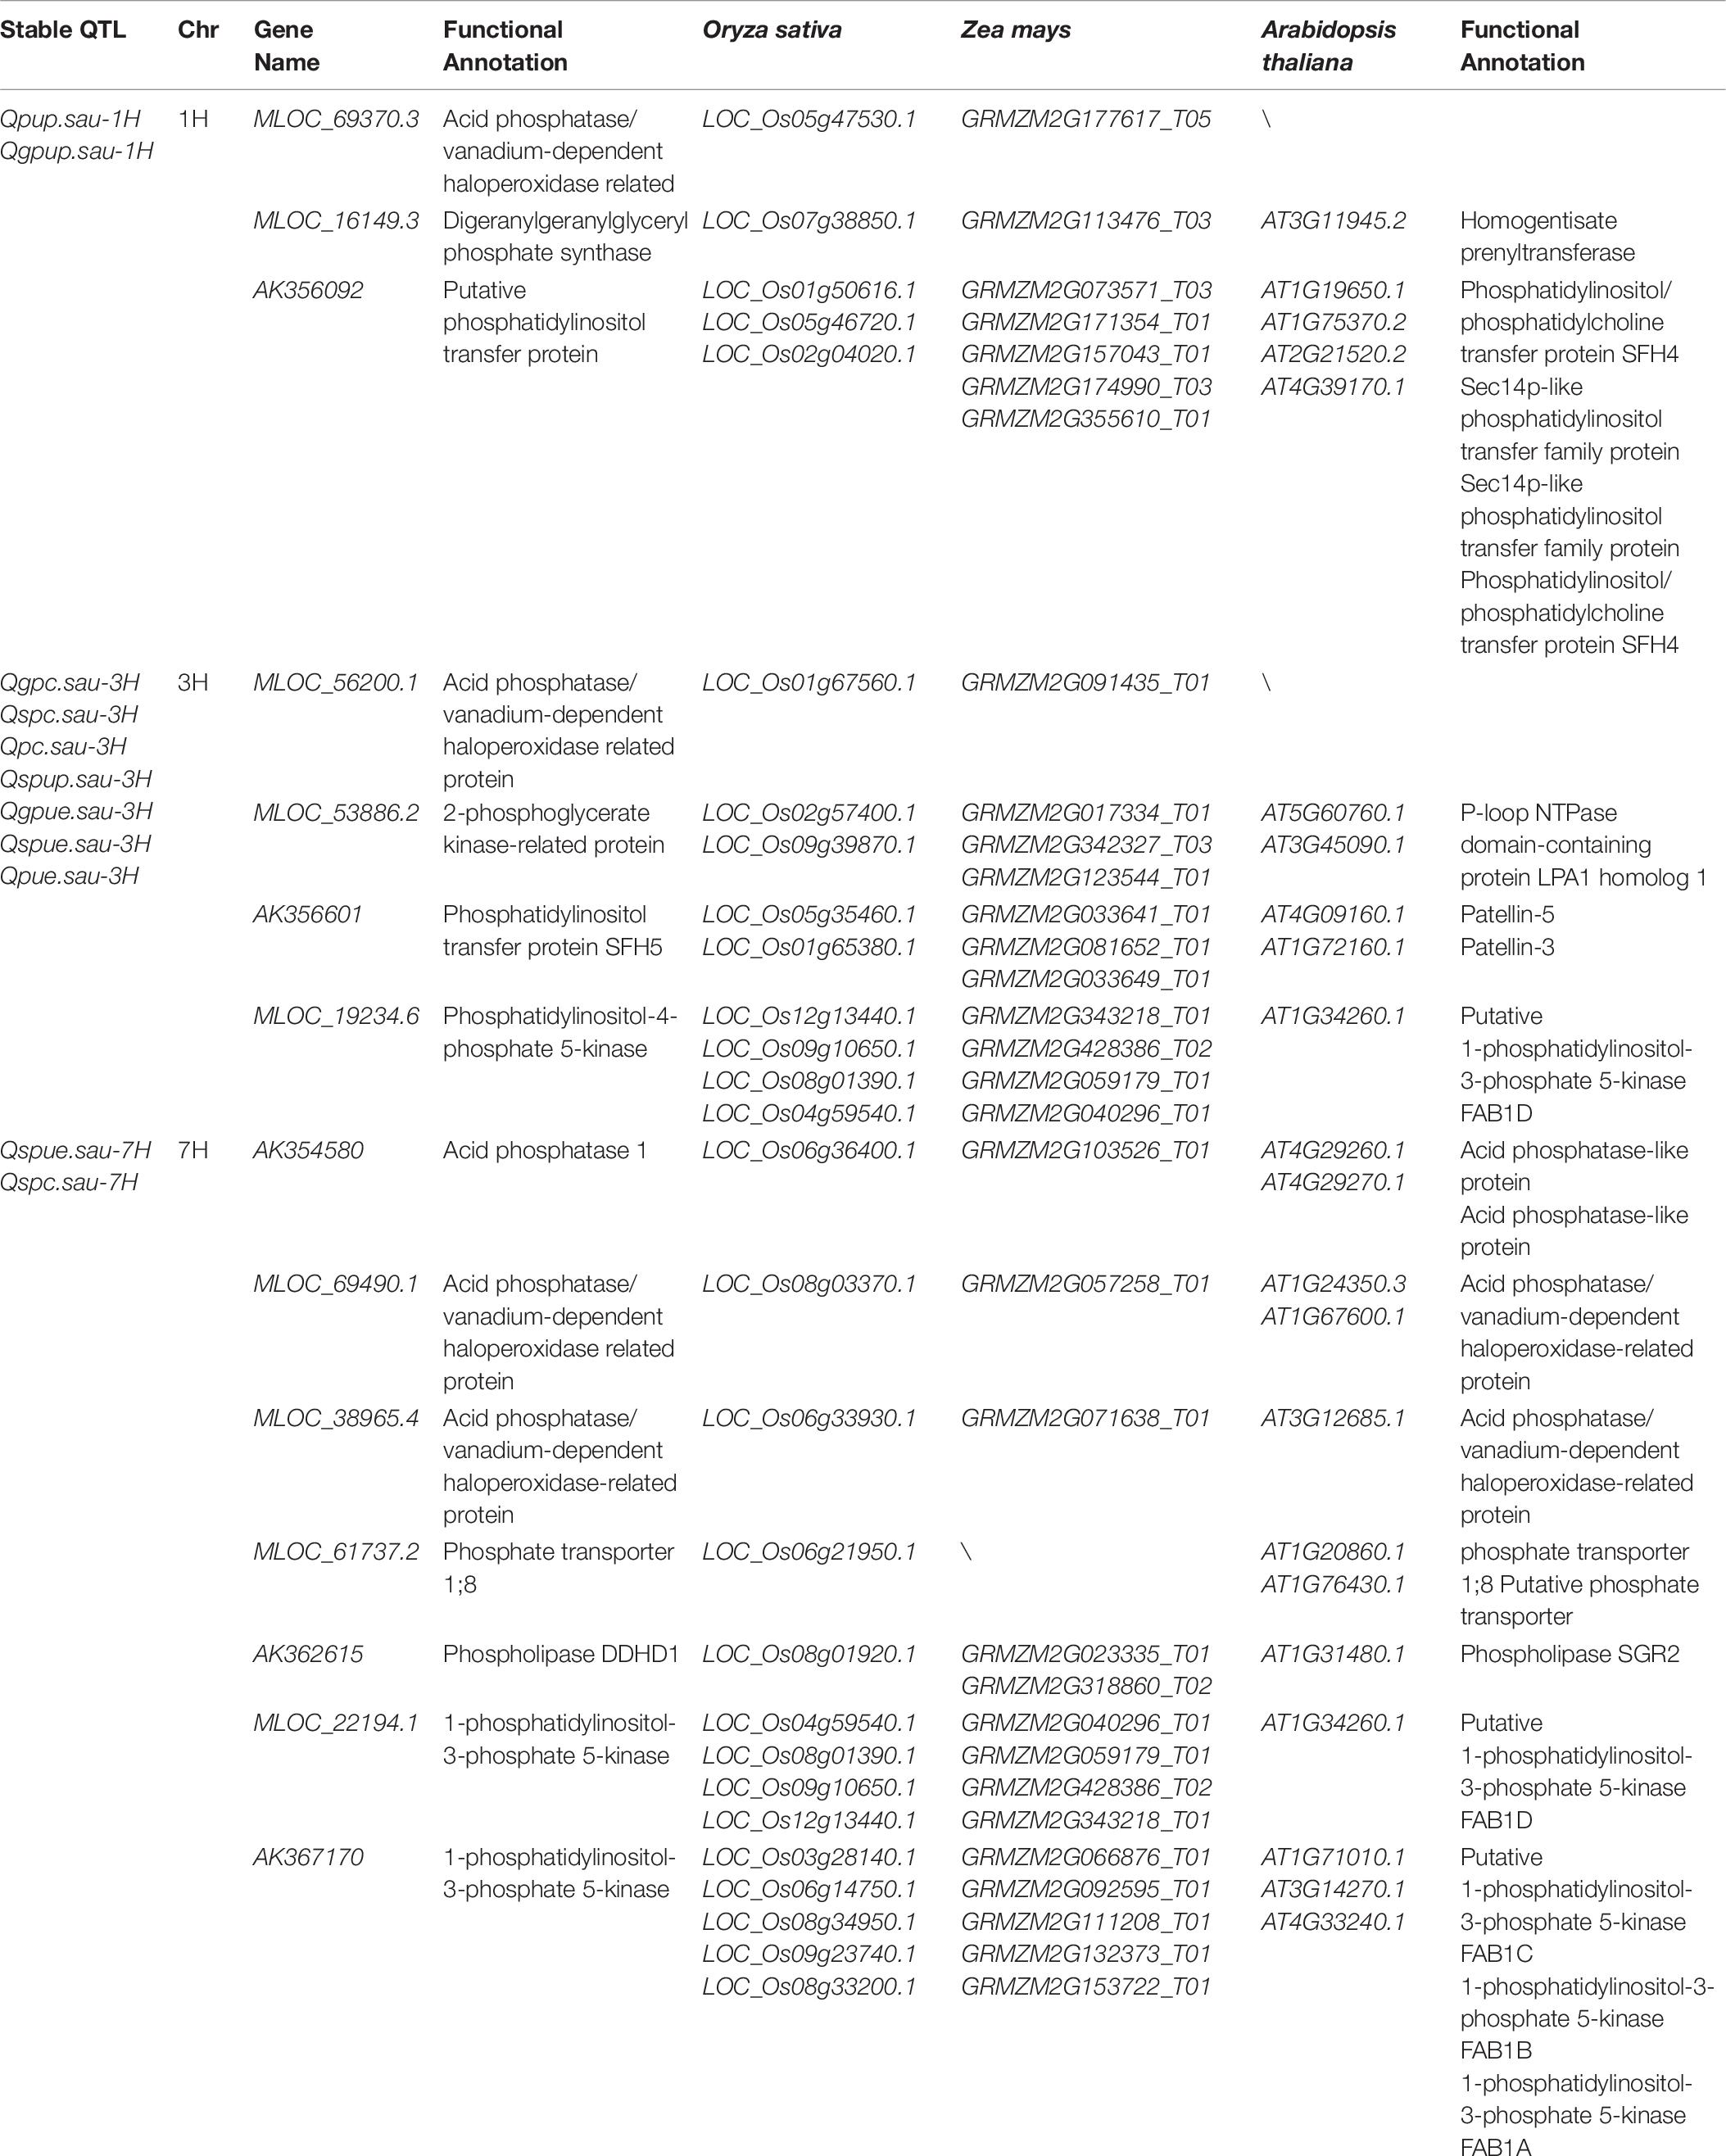
Table 6. Candidate genes or proteins in chromosomal intervals containing the various P-related loci at maturity in barley.
P is one of the macroelements for plants, and it was non-substitutable in many physiological and biochemical metabolisms. Plant production could be reduced or even fail completely when soil P is deficient. As most of the applied P cannot be absorbed by plants, improving P uptake and use could offer a better sustainable method than only relying on fertilizer application (Gong et al., 2016). To explore desirable genes for P efficiency in barley, we investigated several P-related traits based on a RIL population derived from a cross between the wild barley CN4027 and the barley cultivar Baudin under −P and +P conditions. A total of 17 QTL, forming five clusters, were detected on chromosomes 1H, 3H, 5H, and 7H under the two different P conditions. Two of the QTL clusters, located on 1H (for GPUP/PUP) and on 7H (for SPUE/SPC), respectively, are novel as no other QTL conferring P-relative traits has ever been reported on these chromosomes.
The two parents of the mapping population used in this study showed relatively large differences in each of the investigated traits at maturity under both P conditions studied. The wild barley genotype CN4027 showed higher P utilization efficiency (GPUE, SPUE, PUE), while Baudin showed higher values in P acquisition efficiency traits (including GPC, SPC, PC, GPUP, SPUP, and PUP). The results from the phenotypic analysis were consistent with those from QTL identification in this study. QTL mapping revealed that positive alleles for most of the loci of PAE were derived from Baudin, indicating that this genotype had higher P acquisition efficiency than that of CN4027. Furthermore, positive alleles for QTL conferring GPUE and PUE were contributed by CN4027, implying that this genotype showed greater P utilization efficiency than that of Baudin.
The yield traits including GY, SY, and DM were significantly and positively correlated with PAE (GPUP, SPUP, and PUP) and PUE (GPUE, SPUE, and PUE) at both the −P and +P conditions (Table 4). This finding was highly consistent with those obtained at seeding stage in this population (Guo et al., 2017). And a similar result was observed in wheat (Su et al., 2009) and Brassica napus (Yang et al., 2011). While P concentrations including GPC, SPC, and PC were significantly and negatively correlated with most of three yield traits (Table 4). Thus, we think it will be challengeable to develop a cultivar with improved both PAE (PC and PUP) and PUE.
In this study, a total of 17 QTL for PAE, PUE, and yield traits were detected on five QTL clusters under two P conditions. A novel QTL cluster for SPUE/SPC was located on 7H under −P condition. Various candidate genes located in this QTL cluster were detected using database BARLEX searching as described in sorghum (Mahmoud et al., 2018). The acid phosphatase (AK354580) and phosphate transporter (MLOC_61737.2) genes located in this QTL cluster were identified in the interval of Qspue.sau-7H and Qspc.sau-7H (Table 6). The phosphate transporter 1;8 was a high affinity phosphate transporter which was reportedly a kind of phosphate transporter induced by low phosphorus (Raghothama, 2000). The acid phosphatase 1 was also induced by low phosphorus (Baldwin et al., 2001; Zhang et al., 2014). Thus, these two genes were likely important candidates for the QTL cluster for SPUE/SPC on 7H.
Three QTL clusters containing seven QTL for PAE and four QTL for PUE were identified on chromosomes 1H, 3H, and 7H. Candidate genes related to the acid phosphatase/vanadium-dependent haloperoxidase-related protein and phospholipid metabolism were located on these three QTL clusters. As an important phosphorus component in plants, phospholipid played a major role in phosphorus metabolic process. The expression of phospholipid metabolism genes was significantly different under the different P treatments (Pariascatanaka et al., 2009; Ren et al., 2011). However, the mechanisms of PAE and PUE regulated by phospholipid and acid phosphatase/vanadium-dependent haloperoxidase-related protein have not yet been reported, providing valuable clues for further dissecting their molecular mechanisms for P efficiency in barley.
It was reported that high P efficiency in plants could be achieved through improving PAE or PUE (Parentoni and Junior, 2008). Some scientists held the view that P efficiency was mainly determined by PAE (Parentoni and Junior, 2008; Richardson et al., 2009). While Veneklaas et al. (2012) hypothesized that PUE might play a major role in P efficiency. And it was reported that PUE and PAE were intrinsically linked (Su et al., 2006). The identified QTL clusters for several different traits might explain their significant correlations. For example, PAE and PUE showed significant correlation to three yield traits, and the QTL for these traits were all located in the same interval on 3H, indicating that they were linked closely or even be controlled by a same gene. Additionally, several QTL for PAE and PUE have been detected in the same region on 3H at seeding stage in barley (Guo et al., 2017). The QTL for PAE were also detected on 3A and 3B of bread wheat (Shi et al., 2008; Su et al., 2009). Chromosome 3H of barley was homologous to 3A, 3B and 3D of wheat (Islam and Shepherd, 1992), and the genes were highly conserved between wheat and barley (Devos, 2005). These results further verified the existence of a QTL cluster for P efficiency on 3H.
An ideal P efficient genotype is usually characterized by high capacity to acquire more P in the P-deficient environment (i.e., PAE) and/or by high ratio of biomass and P content (i.e., PUE) (Guo et al., 2012). Results from the correlation analysis and QTL mapping indicated that enhancing PAE (including PUP, GPUP, and SPUP) and PUE would improve yield of barley under both +P and −P conditions. However, we observed that GPC and SPC would reduce yield at both +P and −P conditions. This means that it is not easy to simultaneously improve PAE and PUE. This finding is consistent with the results from Su et al. (2009) who reported that PAE and PUE were negatively correlated in wheat. A large number of QTL for P-efficiency have been reported in the last decade. However, few researches were utilized in crop breeding. We thus need to accelerate identifying major and stable QTL for PAE or PUE and developing their linked markers for MAS in barley breeding.
The raw data supporting the conclusions of this article will be made available by the authors, without undue reservation.
SG, JX, and SY developed the RIL population. SG, JX, YS, XZ, and GC performed the pot trials and tested yield traits. YuL, DH, JZ, TL, and YaL determined the P content of plant materials and soils. SG, JX, SY, and GC analyzed the data. SG, JX, and GC wrote the manuscript. GC conceived and designed the experiments. All the authors read and approved the final manuscript.
The research reported in this article was partially funded by the National Natural Science Foundation of China (No. 31971944), Science and Technology Project of Sichuan Province (No. 2019YFN0150), Project of Sichuan Province Youth Science and Technology Innovation Team (20CXTD0062), and the Key Science and Technology Program of Chengdu (2019-YF09-00082-SN).
The authors declare that the research was conducted in the absence of any commercial or financial relationships that could be construed as a potential conflict of interest.
Baldwin, J. C., Karthikeyan, A. S., and Raghothama, K. G. (2001). LEPS2, a phosphorus starvation-induced novel acid phosphatase from tomato. Plant Physiol. 125, 728–737. doi: 10.1104/pp.125.2.728
Cai, H., Chu, Q., Gu, R., Yuan, L., Liu, J., Zhang, X., et al. (2012). Identification of QTLs for plant height, ear height and grain yield in maize (Zea mays L.) in response to nitrogen and phosphorus supply. Plant Breed. 131, 502–510. doi: 10.1111/j.1439-0523.2012.01963.x
Carpenter, S. R. (2008). Phosphorus control is critical to mitigating eutrophication. Proc. Natl. Acad. Sci. U.S.A. 105, 11039–11040. doi: 10.1073/pnas.0806112105
Devos, K. M. (2005). Updating the ‘crop circle’. Curr. Opin. Plant Blot. 8, 155–162. doi: 10.1016/j.pbi.2005.01.005
Gong, X., Wheeler, R., Bovill, W. D., and Mcdonald, G. K. (2016). QTL mapping of grain yield and phosphorus efficiency in barley in a Mediterranean-like environment. Theor. Appl. Genet. 129, 1657–1672. doi: 10.1007/s00122-016-2729-8
Guo, J., Chen, G., Zhang, X., Li, T., Yu, H., and Chen, H. (2017). Mapping quantitative trait loci for tolerance to phosphorus-deficiency at the seedling stage in barley. Euphytica 213:114. doi: 10.1007/s10681-017-1907-3
Guo, Y., Kong, F., Xu, Y., Zhao, Y., Liang, X., Wang, Y. Y., et al. (2012). QTL mapping for seedling traits in wheat grown under varying concentrations of N, P and K nutrients. Theor. Appl. Genet. 124, 851–865. doi: 10.1007/s00122-011-1749-7
Holford, I. C. R. (1997). Soil phosphorus: its measurement, and its uptake by plants. Soil Res. 35, 227–240. doi: 10.1071/s96047
Islam, A. K. M. R., and Shepherd, K. W. (1992). Substituting ability of individual barley chromosomes for wheat chromosomes 1. substitutions involving barley chromosomes 1, 3 and 6. Plant Breed. 109, 141–150. doi: 10.1111/j.1439-0523.1992.tb00164.x
Li, K., Hegarty, J., Zhang, C., Wan, A., Wu, J., Guedira, G. B., et al. (2016). Fine mapping of barley locus Rps6 conferring resistance to wheat stripe rust. Theor. Appl. Genet. 129, 845–859. doi: 10.1007/s00122-015-2663-1
Liang, Q., Cheng, X., Mei, M., Yan, X., and Liao, H. (2010). QTL analysis of root traits as related to phosphorus efficiency in soybean. Ann. Bot. 106, 223–234. doi: 10.1093/aob/mcq097
Macdonald, G. K., Bennett, E. M., Potter, P., and Ramankutty, N. (2011). Agronomic phosphorus imbalances across the world’s croplands. Proc. Natl. Acad. Sci. U.S.A. 108, 3086–3091. doi: 10.1073/pnas.1010808108
Mahmoud, A. F., Abouelwafa, S. F., and Shehzad, T. (2018). Identification of charcoal rot resistance QTLs in sorghum using association and in silico analyses. J. Appl. Genet. 59, 243–251. doi: 10.1007/s13353-018-0446-5
Nishida, S., Dissanayaka, D. M. S. B., Honda, S., Tateishi, Y., Chuba, M., Maruyama, H., et al. (2018). Identification of genomic regions associated with low phosphorus tolerance in japonica rice (Oryza sativa L.) by QTL-Seq. Soil Sci. Plant Nutr. 64, 278–281. doi: 10.1080/00380768.2017.1412238
Noack, S. R., Mclaughlin, M. J., Smernik, R. J., Mcbeath, T. M., and Armstrong, R. (2014). Phosphorus speciation in mature wheat and canola plants as affected by phosphorus supply. Plant Soil 378, 125–137. doi: 10.1007/s11104-013-2015-3
Parentoni, S., and Junior, C. (2008). Phosphorus acquisition and internal utilization efficiency in tropical maize genotypes. Pesqui. Agropecu. Bras. 43, 893–901. doi: 10.1590/s0100-204x2008000700014
Pariascatanaka, J., Satoh, K., Rose, T. J., Mauleon, R., and Wissuwa, M. (2009). Stress response versus stress tolerance: a transcriptome analysis of two rice lines contrasting in tolerance to phosphorus deficiency. Rice 2, 167–185. doi: 10.1007/s12284-009-9032-0
Peighambari, S. A., Samadi, B. Y., Nabipour, A., Charmet, G., and Sarrafi, A. (2005). QTL analysis for agronomic traits in a barley doubled haploids population grown in Iran. Plant Sci. 169, 1008–1013. doi: 10.1016/j.plantsci.2005.05.018
Raghothama, K. G. (2000). Phosphate transport and signaling. Curr. Opin. Plant Biol. 3, 182–187. doi: 10.1016/s1369-5266(00)00062-5
Ren, F., Chen, L., Guo, Q., Zhong, H., Wu, Y., Chang, Y.-Y., et al. (2011). Identification and expression analysis of genes induced by phosphate starvation in leaves and roots of Brassica napus. Plant Growth Regul. 65, 65–81. doi: 10.1007/s10725-011-9575-0
Richardson, A. E., Hocking, P. J., Simpson, R. J., and George, T. S. (2009). Plant mechanisms to optimise access to soil phosphorus. Crop Pasture Sci. 60, 124–143. doi: 10.1071/CP07125
Sattari, S. Z., Bouwman, A. F., Giller, K. E., and Van Ittersum, M. K. (2012). Residual soil phosphorus as the missing piece in the global phosphorus crisis puzzle. Proc. Natl. Acad. Sci. U.S.A. 109, 6348–6353. doi: 10.1073/pnas.1113675109
Schulte, D., Close, T. J., Graner, A., Langridge, P., Matsumoto, T., Muehlbauer, G., et al. (2009). The international barley sequencing consortium—at the threshold of efficient access to the barley genome. Plant Physiol. 149, 142–147. doi: 10.1104/pp.108.128967
Shen, J., Yuan, L., Zhang, J., Li, H., Bai, Z., Chen, X., et al. (2011). Phosphorus dynamics: from soil to plant. Plant Physiol. 156, 997–1005. doi: 10.1104/pp.111.175232
Shi, R., Li, H., Tong, Y., Jing, R., Zhang, F., and Zou, C. (2008). Identification of quantitative trait locus of zinc and phosphorus density in wheat (Triticum aestivum L.) grain. Plant Soil 306, 95–104. doi: 10.1007/s11104-007-9483-2
Su, J., Xiao, Y., Ming, L., Liu, Q., Li, B., Tong, Y., et al. (2006). Mapping QTLs for phosphorus-deficiency tolerance at wheat seedling stage. Plant Soil 281, 25–36. doi: 10.1007/s11104-005-3771-5
Su, J., Zheng, Q., Li, H., Li, B., Jing, R., Tong, Y.-P., et al. (2009). Detection of QTLs for phosphorus use efficiency in relation to agronomic performance of wheat grown under phosphorus sufficient and limited conditions. Plant Sci. 176, 824–836. doi: 10.1016/j.plantsci.2009.03.006
Tavakol, E., Okagaki, R. J., Verderio, G., Shariati, J. V., Hussien, A., Bilgic, H., et al. (2015). The barley uniculme4 gene encodes a BLADE-ON-PETIOLE-like protein that controls tillering and leaf patterning. Plant Physiol. 168, 164–174. doi: 10.1104/pp.114.252882
Van Ooijen, J. W. (2004). MapQTL 5, Software for the Mapping of Quantitative Trait Loci in Experimental Populations. Netherlands: Kyazma, B.V.
Van Ooijen, J. W. (2006). JoinMap®4, Software for the Calculation of Genetic Linkage Maps in Experimental Populations. Netherlands: Kyazma, B.V.
Veneklaas, E. J., Lambers, H., Bragg, J. G., Finnegan, P. M., Lovelock, C. E., Plaxton, W. C., et al. (2012). Opportunities for improving phosphorus−use efficiency in crop plants. New Phytol. 195, 306–320. doi: 10.1111/j.1469-8137.2012.04190.x
Wang, X., and Yan, X. (2010). Genetic improvement for phosphorus efficiency in soybean: a radical approach. Ann. Bot. 106, 215–222. doi: 10.1093/aob/mcq029
Yan, X., Wu, P., Ling, H., Xu, G., Xu, F., and Zhang, Q. (2006). Plant nutriomics in china: an overview. Ann. Bot. 98, 473–482. doi: 10.1093/aob/mcl116
Yang, M., Ding, G., Shi, L., Xu, F., and Meng, J. (2011). Detection of QTL for phosphorus efficiency at vegetative stage in Brassica napus. Plant Soil. 339, 97–111. doi: 10.1007/s11104-010-0516-x
Yuan, Y., Gao, M., Zhang, M., Zheng, H., Zhou, X., Guo, Y., et al. (2017). QTL mapping for phosphorus efficiency and morphological traits at seedling and maturity stages in wheat. Front. Plant Sci. 8:614. doi: 10.3389/fpls.2017.00614
Keywords: barley, phosphorus deficiency, phosphorus acquisition, phosphorus utilization, quantitative trait loci
Citation: Gao S, Xia J, Yuan S, Shen Y, Zhong X, Zhang S, Li Y, Hu D, Zeng J, Lan T, Liu Y and Chen G (2020) Novel QTL Conferring Phosphorus Acquisition and Utilization Efficiencies in Barley. Front. Genet. 11:580452. doi: 10.3389/fgene.2020.580452
Received: 06 July 2020; Accepted: 12 August 2020;
Published: 04 September 2020.
Edited by:
Penghao Wang, Murdoch University, AustraliaReviewed by:
Meixue Zhou, University of Tasmania, AustraliaCopyright © 2020 Gao, Xia, Yuan, Shen, Zhong, Zhang, Li, Hu, Zeng, Lan, Liu and Chen. This is an open-access article distributed under the terms of the Creative Commons Attribution License (CC BY). The use, distribution or reproduction in other forums is permitted, provided the original author(s) and the copyright owner(s) are credited and that the original publication in this journal is cited, in accordance with accepted academic practice. No use, distribution or reproduction is permitted which does not comply with these terms.
*Correspondence: Guangdeng Chen, Z2RjaGVuQHNpY2F1LmVkdS5jbg==
†These authors have contributed equally to this work
Disclaimer: All claims expressed in this article are solely those of the authors and do not necessarily represent those of their affiliated organizations, or those of the publisher, the editors and the reviewers. Any product that may be evaluated in this article or claim that may be made by its manufacturer is not guaranteed or endorsed by the publisher.
Research integrity at Frontiers
Learn more about the work of our research integrity team to safeguard the quality of each article we publish.