 Su-Han Jin
 Jian-Guo Zhou
 Xiao-Yan Guan1
 Liang-Wen Chen
95% of researchers rate our articles as excellent or good
Learn more about the work of our research integrity team to safeguard the quality of each article we publish.
Find out more
ORIGINAL RESEARCH article
Front. Genet. , 16 December 2020
Sec. Computational Genomics
Volume 11 - 2020 | https://doi.org/10.3389/fgene.2020.577585
This article is part of the Research Topic Decoding Connections between Phenotype and Genotype using Machine Learning View all 7 articles
Periodontitis progression is accompanied by irreversible alveolar bone absorption and leads to tooth loss. Early diagnosis is important for tooth stability and periodontal tissue preservation. However, there is no recognized miRNA diagnostic signature with convincing sensitivity and specificity for periodontitis. In this study, we obtained miRNA array expression profiles of periodontitis from the Gene Expression Omnibus (GEO) database. After screening for differentially expressed miRNAs, the least absolute shrinkage and selection operator (LASSO) method was performed to identify and construct a 17-miRNA-based diagnostic signature (hsa-miR-3917, hsa-mir-4271, hsa-miR-3156, hsa-miR-3141, hsa-miR-1246, hsa-miR-125a-5p, hsa-miR-671-5p, hcmv-mir-UL70, hsa-miR-650, hsa-miR-497-3p, hsa-miR-145-3p, hsa-miR-141-3p, hsa-miR-210-3p, hsa-miR-204-3p, hsa-miR-203a-5p, hsa-miR-99a-3p, and hsa-miR-30a-3p). Periodontal tissue samples with higher risk scores were more likely to show symptoms of periodontitis. Then, the receiver operating characteristic (ROC) curves were used to assess the diagnostic value of the miRNA signature, which indicated that the optimum cutoff value in periodontitis diagnosis was 0.5056 with an area under the ROC curve (AUC) of 0.996, a sensitivity of 97.3%, a specificity of 100.0% in the training cohort; in the testing cohort, the corresponding values were as follows: an AUC of 0.998, a sensitivity of 97.9%, and a specificity of 91.7%. We next evaluated the efficacy of the signature in differentiating disease subtype and affected range. Furthermore, we conducted functional enrichment analysis of the 17 miRNA-targeted mRNAs, including the regulation of mTOR activity and cell autophagy, Th1/Th2 cell balance and immunoregulation, cell apoptosis, and so on. In summary, our study identified and validated a 17-miRNA diagnostic signature with convincing AUC, sensitivity, and specificity for periodontitis.
Periodontitis, reported as one of the most prevalent diseases worldwide (Kassebaum et al., 2014), begins with damage to periodontal tissue, with typical symptoms, including gingival recession, attachment loss, and alveolar bone resorption, and eventually leads to tooth loss (Gross et al., 2017; Papapanou and Susin, 2017). Tooth loss from aggressive periodontitis (AP) is 0.05–0.12 per patient-year (Nibali et al., 2013; Clark et al., 2017). Periodontitis identified at an early stage carries a much-improved prognosis compared to advanced-stage disease because of the irreversible alveolar bone absorption that occurs during progression (Hienz et al., 2015). Thus, the early diagnosis of periodontitis is crucial for alveolar bone preservation and tooth stability.
At present, numerous inflammatory cytokines, such as proinflammatory cytokines, tumor necrosis factor, anti-inflammatory cytokines, and host factor matrix metalloproteinase, are considered as biomarkers for periodontitis (Cafiero et al., 2013; Kinney et al., 2014; Luan et al., 2018). However, there are limited reports on non-coding RNAs as biomarkers for periodontitis. Recently, miRNAs have emerged as a novel class of highly sensitive and specific biomarkers and have been reported to play critical regulatory roles in periodontal homeostasis and during periodontitis progression (Sugatani and Hruska, 2007; Hung et al., 2010; Liu et al., 2011; Chen et al., 2014; Guo et al., 2014; Zhou et al., 2016; Luan et al., 2018). Thus, miRNAs are promising biomarkers for periodontitis diagnosis or prognosis (Schmalz et al., 2016; Saito et al., 2017; Luan et al., 2018; Mico-Martinez et al., 2018).
A variety of miRNAs are dysregulated in periodontitis tissue compared to healthy tissue, such as upregulated miR-15a, miR-29b, miR-125a, miR-146a, miR-148/148a, and miR-223 and downregulated miR-92 (Luan et al., 2018). However, there is no recognized miRNA diagnostic signature for periodontitis, with convincing sensitivity and specificity, until now (Arias-Bujanda et al., 2019). In this study, we compared the miRNA profiles between disease and control samples and identified an miRNA diagnostic signature with high sensitivity and specificity for periodontitis.
The Gene Expression Omnibus (GEO1) database was searched to find datasets related to periodontitis, using “Homo sapiens [porgn: txid9606] and periodontitis”; 14 datasets met the criteria. Only five datasets collected miRNA profiles. To reduce random error, we limited the target to datasets with a sample size greater than 100, and eventually GSE54710 was screened out.
The clinical characteristics and miRNA profiling data of periodontitis samples (GSE54710), obtained with whole-genome microarray analysis (U-133 Plus 2.0; Affymetrix, Santa Clara, CA, United States), were downloaded from the GEO database.
The data contained 159 disease samples (gingival samples showing periodontitis, with attachment level ≥3 mm) and 41 control samples (healthy gingival samples, with attachment level ≤2 mm) (Stoecklin-Wasmer et al., 2012). The miRNA microarray data were annotated with GPL15159. All miRNAs differentially expressed between the disease and control samples were analyzed using the Linear Models for Microarray data (Limma, version 3.30.0) package in R. MicroRNAs with the parameters absolute log2 fold change >0.45 and P value < 0.05 (Zhang et al., 2015) were regarded as differently expressed miRNAs (DE-miRNAs). The DE-miRNA expression value was log2 transformed for next data processing.
The outcome measure was periodontitis/control classification. Two hundred samples were randomly divided into a training cohort (112 disease and 29 control samples) and a testing cohort (47 disease and 12 control samples) at a ratio of 7:3.
Afterward, we used least absolute shrinkage and selection operator (LASSO) regression analysis for DE-miRNA selection and reduction using the glmnet package (version 3.0) (Gao et al., 2010) in R. This LASSO method shrinks coefficients toward zero, and eliminates unimportant terms entirely, thus reducing prediction error and minimizing overfitting. The sensitivity and specificity were evaluated for each DE-miRNA and were validated within the internal validation samples. Afterward, diagnosis-associated DE-miRNAs with nonzero coefficients were selected to build a diagnostic miRNA signature. We obtained diagnostic models according to a variety of evaluation variables, all with accuracy ≥ 0.95, sensitivity ≥ 0.95, specificity ≥ 0.9, and recall ≥ 0.9. DE-miRNA-based receiver operating characteristic (ROC) curves were constructed to assess the optimal signature model in the training set with the pROC (version 1.15.3) package. The ROC figure was plotted using the ggplot2 and ggfortify packages. Area under the ROC curve (AUC) was calculated to quantify the diagnostic accuracy (Sauerbrei et al., 2007) of the signature. Then, the cutoff value was identified according to the ROC curve, using the local maxima method of the pROC package. Thereafter, the diagnostic value of the signature was further validated in the testing set (Xu et al., 2017; Liu et al., 2019).
To further explore the prognostic function of the signature, we utilized the miRNA signature for assessing the disease subtype and affected range. According to the clinical features of different subtypes, all samples were divided into AP and chronic periodontitis (CP). AP is a subtype of periodontitis with a prevalence of 0.6–2.2% (Ababneh et al., 2012; Catunda et al., 2019) and is characterized by rapid periodontal attachment loss and bone resorption (Susin et al., 2014). According to the number of affected teeth, the samples were grouped into localized periodontitis with gingival attachment loss and bone resorption sites ≤30% of all teeth, and generalized periodontitis with affected tooth sites >30%. The risk score was calculated for each sample and used to classify each sample into a high expression group (with risk scores above the cutoff value) and a low expression group (with risk scores below the cutoff value). The associations between risk scores and various clinical characteristics were analyzed with the chi-square test (Yao et al., 2018).
The functions of the DE-miRNAs of the diagnostic signature were explored using the competing endogenous RNA (ceRNA; lncRNA–miRNA–mRNA) network. The sequences of the identified DE-miRNAs were obtained from Ensembl and put into miRcode2 and starBase v 2.03 to predict their lncRNA targets. To improve the data reliability, lncRNAs that have not been annotated by GENCODE4 were omitted. Furthermore, the mRNAs shown to be targeted by miRNAs with experimental support were then identified using miRTarBase5. Only miRNAs with target RNAs in these four databases were used to construct the ceRNA network. We built the ceRNA network based on the abovementioned data and used the ggalluvial (version 0.9.1) package to visualize the network (Jin et al., 2019).
To gain further insights into the biological pathways involved in the miRNA diagnostic signature, we conducted Gene Ontology (GO) and Kyoto Encyclopedia of Genes and Genomes (KEGG) pathway analysis. An original list of the DE-mRNAs of the corresponding DE-miRNAs was predicted through miRTarBase. In addition, we obtained the differentially expressed mRNAs for periodontitis by analyzing the GSE16134 in our previous work (Jin et al., 2019). In order to appropriately restrict the number of DE-mRNAs for periodontitis, the original list of DE-mRNAs was overlapped with the differentially expressed mRNAs from GSE16134; the overlapping mRNAs between these two cohorts are shown in Supplementary Table 3. We then annotated the overlapping mRNAs using GO and KEGG pathway enrichment analysis with the clusterProfiler package (Ma et al., 2019) in R.
The sensitivity, specificity, and AUC values of the diagnostic signature were quantified based on the ROC curve. The association between the miRNA signature risk scores and categorical clinical characteristics was analyzed with the chi-square test. All statistical tests were two-sided, and P < 0.05 represented statistically significant results. Statistical analyses were performed with R (version 3.5.26).
We initially compared the miRNA profiles of 159 disease samples with 41 control samples (Figure 1). A total of 72 miRNAs, including 47 upregulated and 25 downregulated, were identified as significantly differentially expressed between the disease and control samples (Supplementary Table 1). The relative expression values of all the DE-miRNAs (Figure 2A) and the 72 significantly DE-miRNAs (Figure 2B) are illustrated, demonstrating substantial variation. The 200 samples were randomly divided into the training set (112 disease and 29 control samples) and testing set (47 disease and 12 control samples). A LASSO regression analysis was used to select and reduce variables within the 72 DE-miRNAs in the training cohort. Seventeen miRNAs were identified as variables.
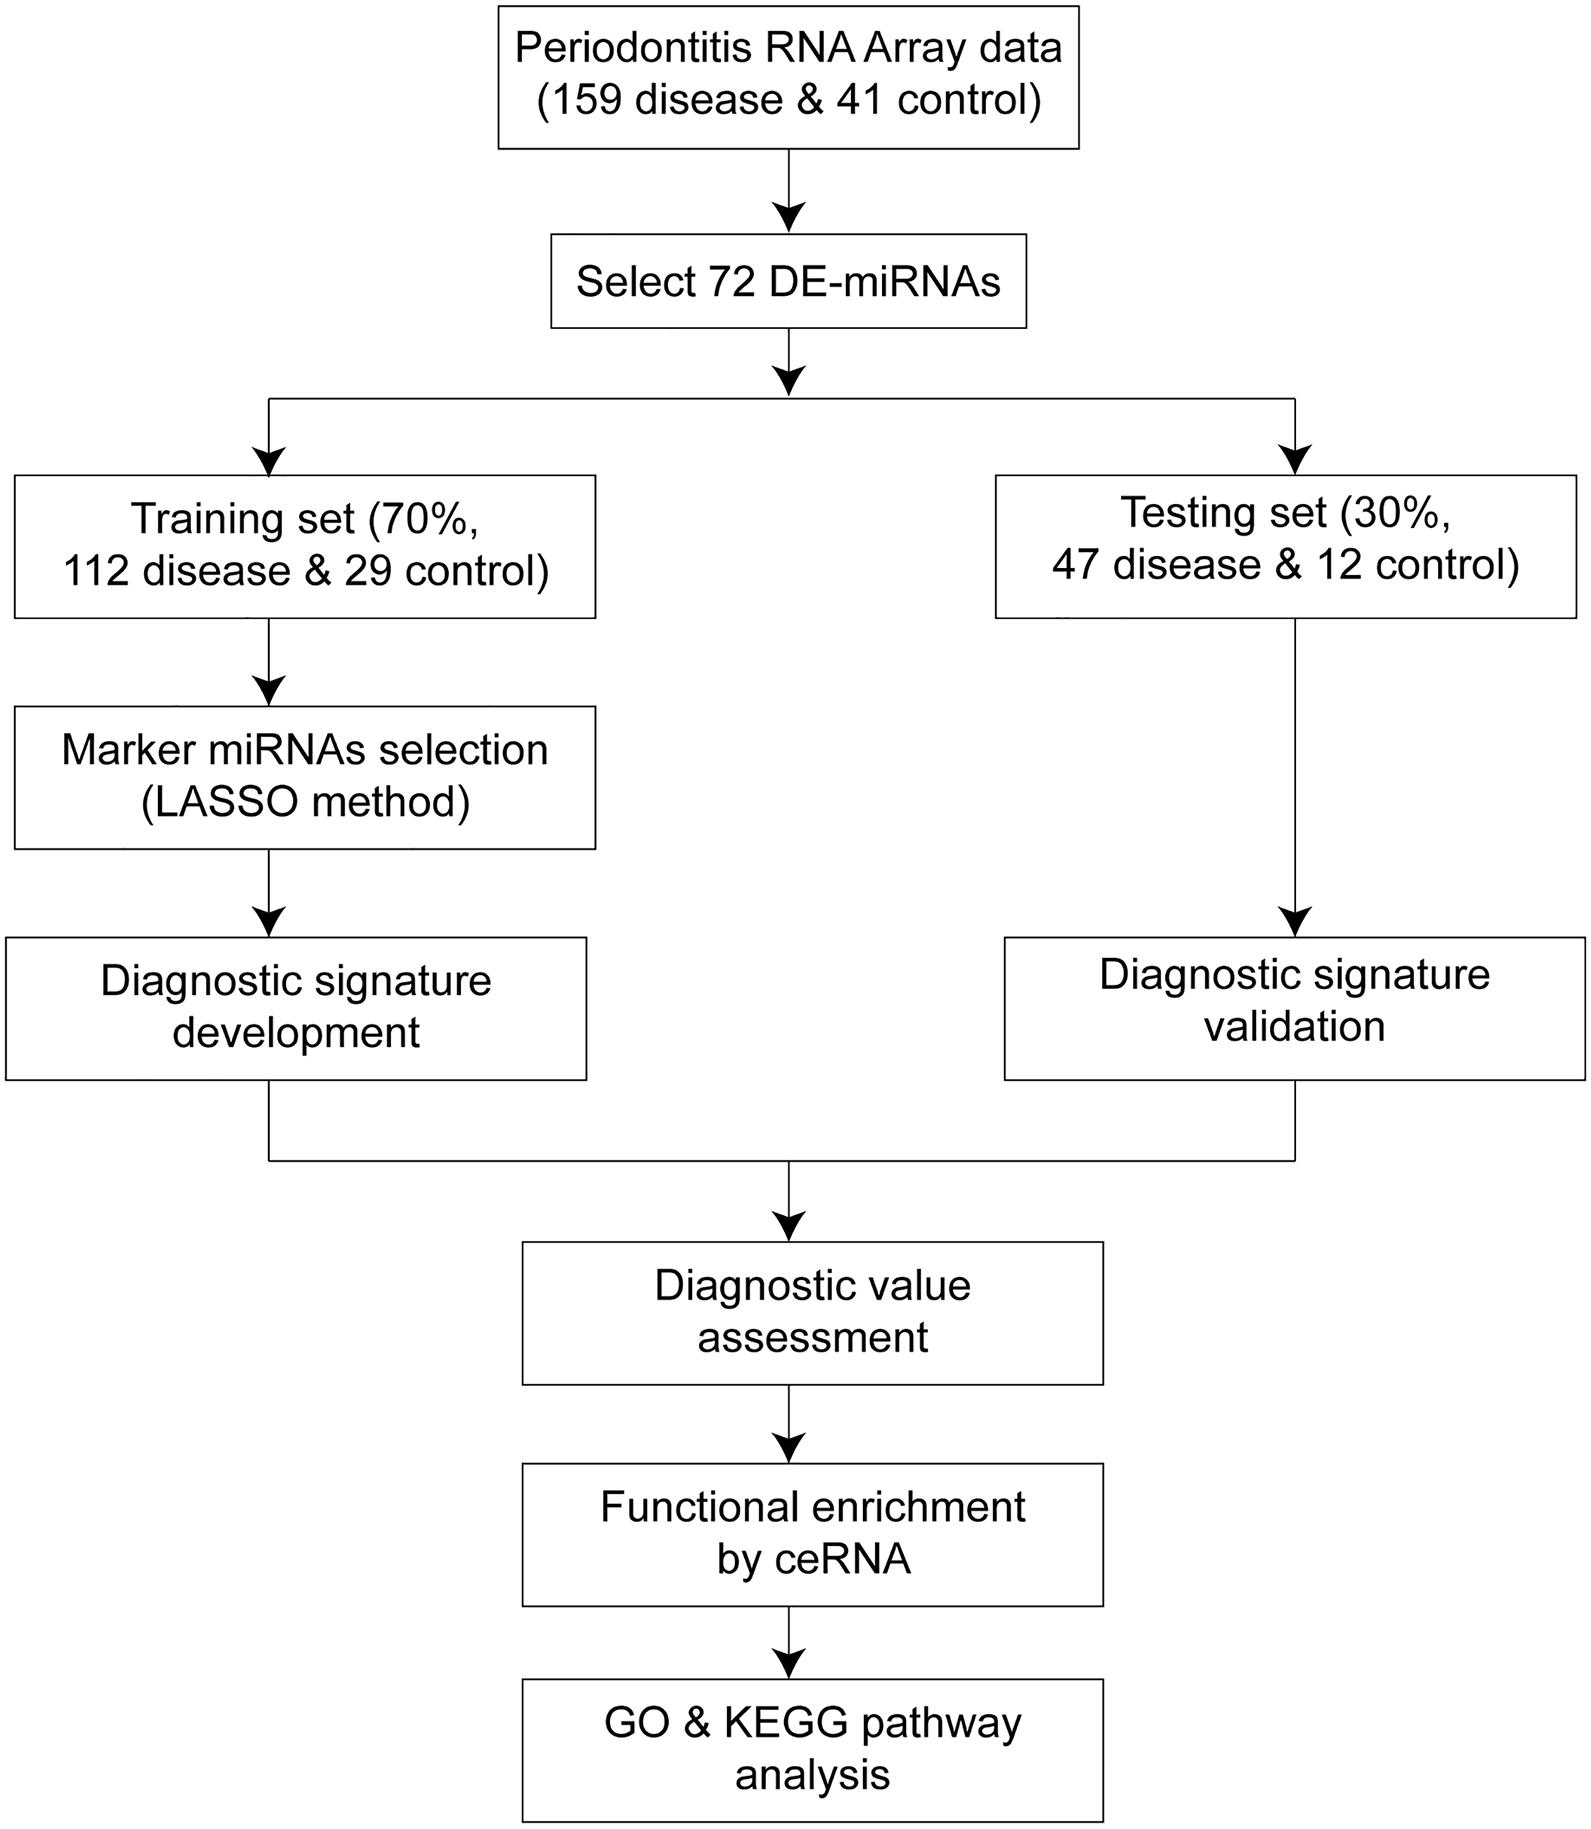
Figure 1. Workflow of the whole study. The overall process of diagnostic signature development, validation, assessment, and functional analysis.
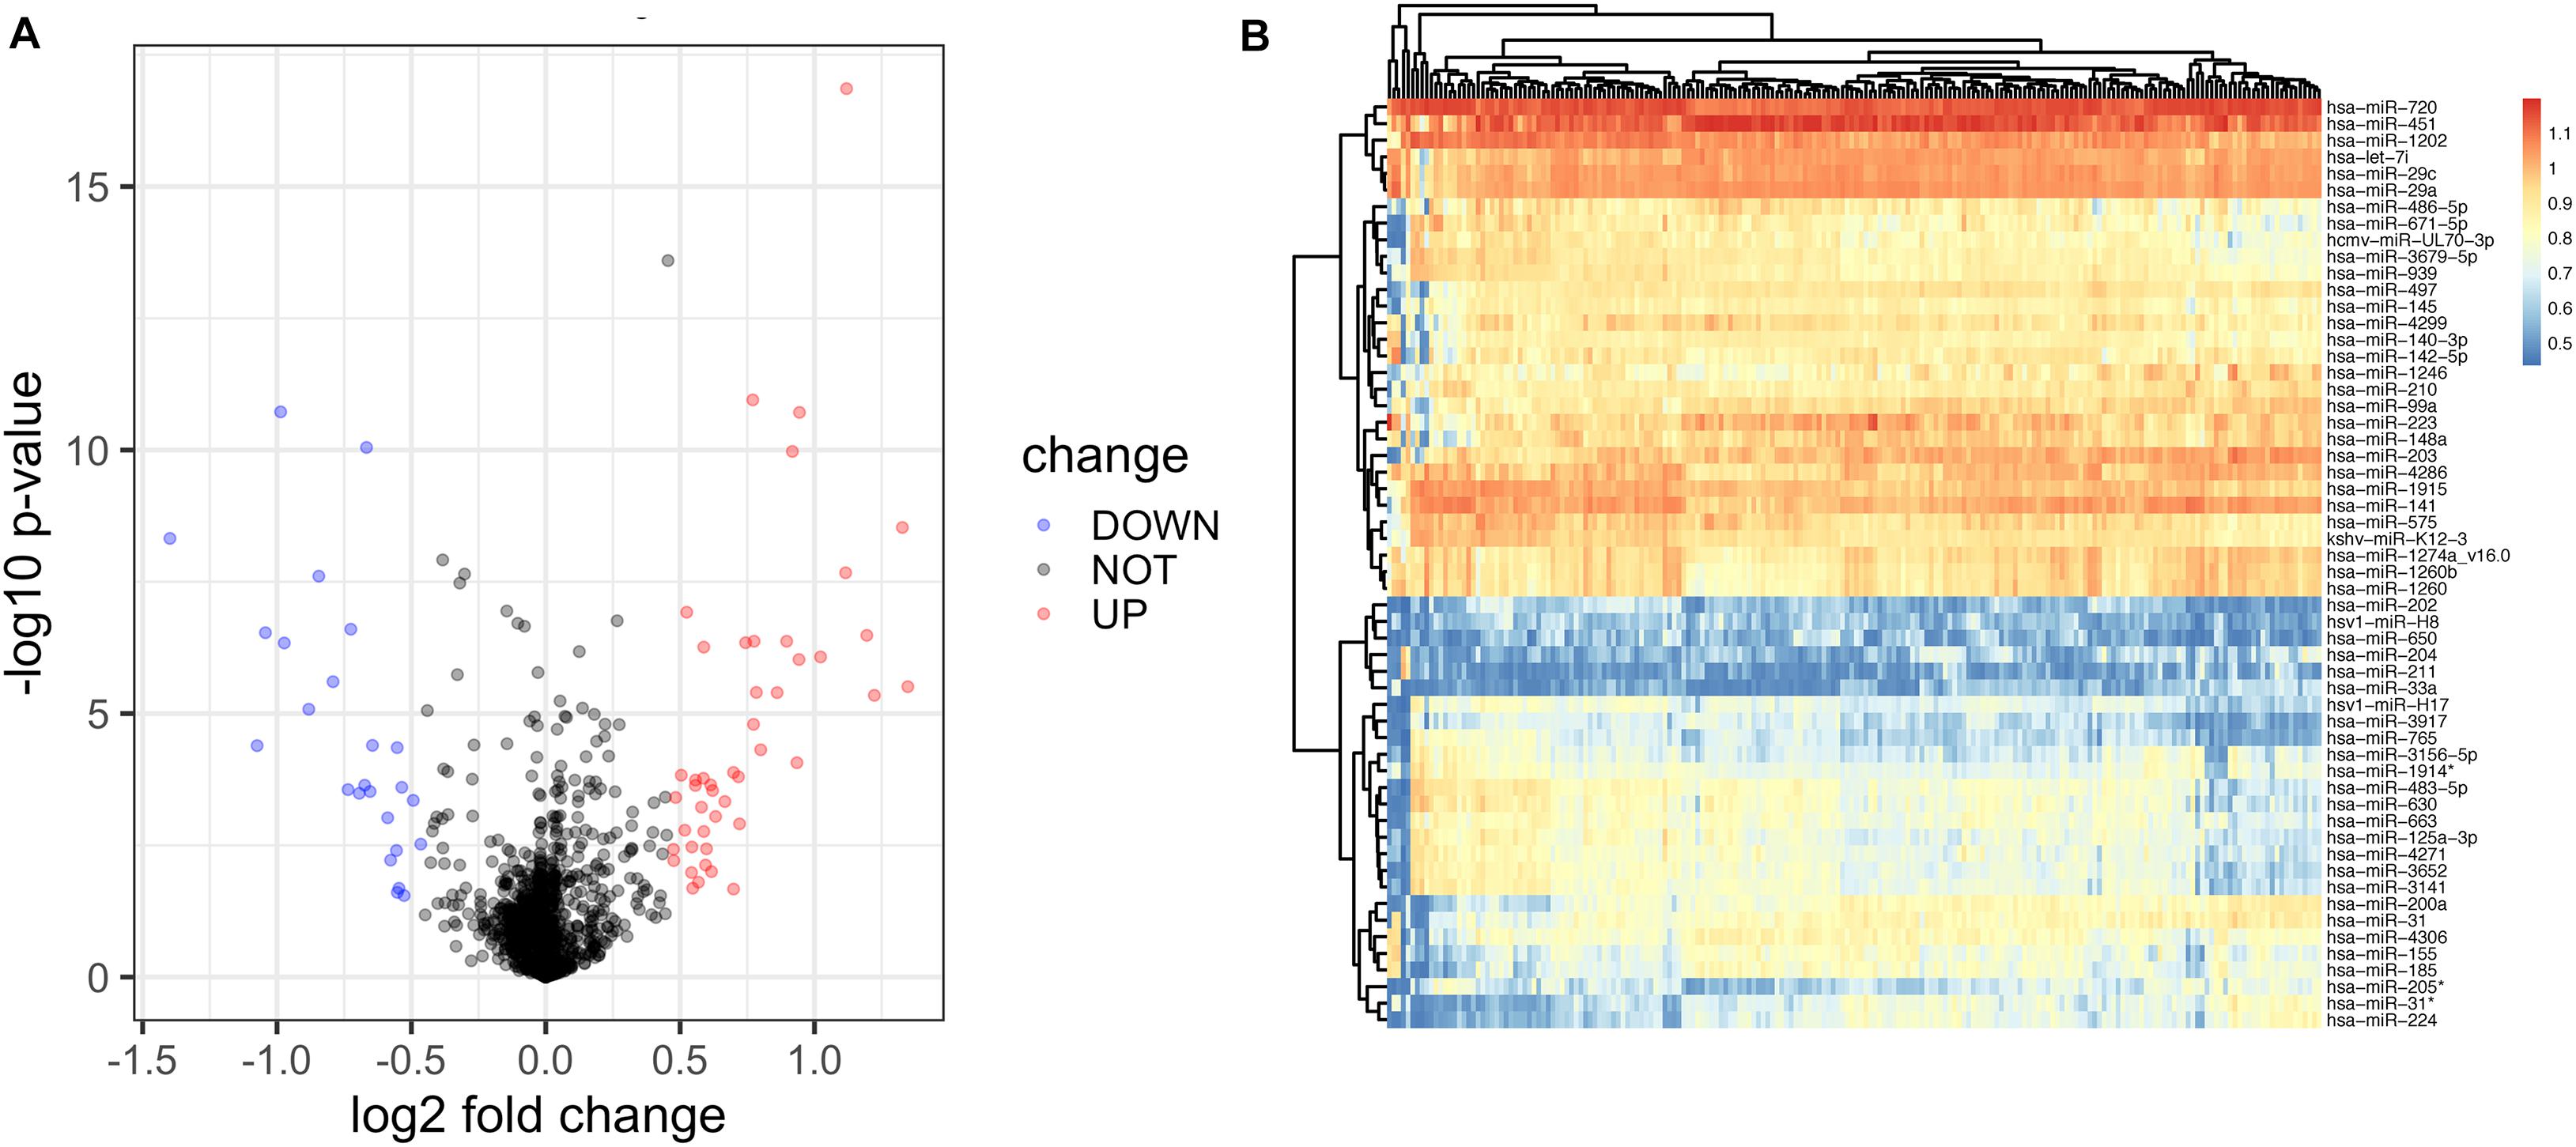
Figure 2. Identification of differentially expressed miRNAs of diseased gingiva from control samples using the miRNA array. (A) The volcano map of all DE-miRNAs. (B) The hierarchical clustering heat map of the 72 significant DE-miRNAs, including 47 upregulated and 25 downregulated ones.
Next, the best risk coefficients for these miRNAs were calculated using the multivariable logistic regression method, resulting in a diagnostic signature. Our diagnostic signature obtained from the training cohort was used to establish the following formula: risk score = (0.3348278 × hsa-miR-3917) + (3.6230776 × hsa-mir-4271) + (−4.3906260 × hsa-miR-3156) + (0.1870440 × hsa-miR-3141) + (1.0495169 × hsa-miR-1246) + (1.8215707 × hsa-miR-125a-5p) + (2.1134420 × hsa-miR-671-5p) + (1.3936642 × hcmv-mir-UL70) + (0.8620107 × hsa-miR-650) + (8.5144859 × hsa-miR-497) + (6.2927132 × hsa-miR-145) + (−5.1714717 × hsa-miR-141) + (−1.4265602 × hsa-miR-210) + (−2.8905885 × hsa-miR-204) + (−7.4759805 × hsa-miR-203a) + (−3.9084222 × hsa-miR-99a) + (0.7008474 × hsa-miR-30a) (Table 1). In this signature, miR-3156, miR-141, miR-210, miR-204, miR-203a, and miR-99a have negative coefficients, while others have positive coefficients. As shown in the results, a further high signature score was diagnostic of periodontitis in the training cohort (P = 1.508 × 10–36; Table 1).
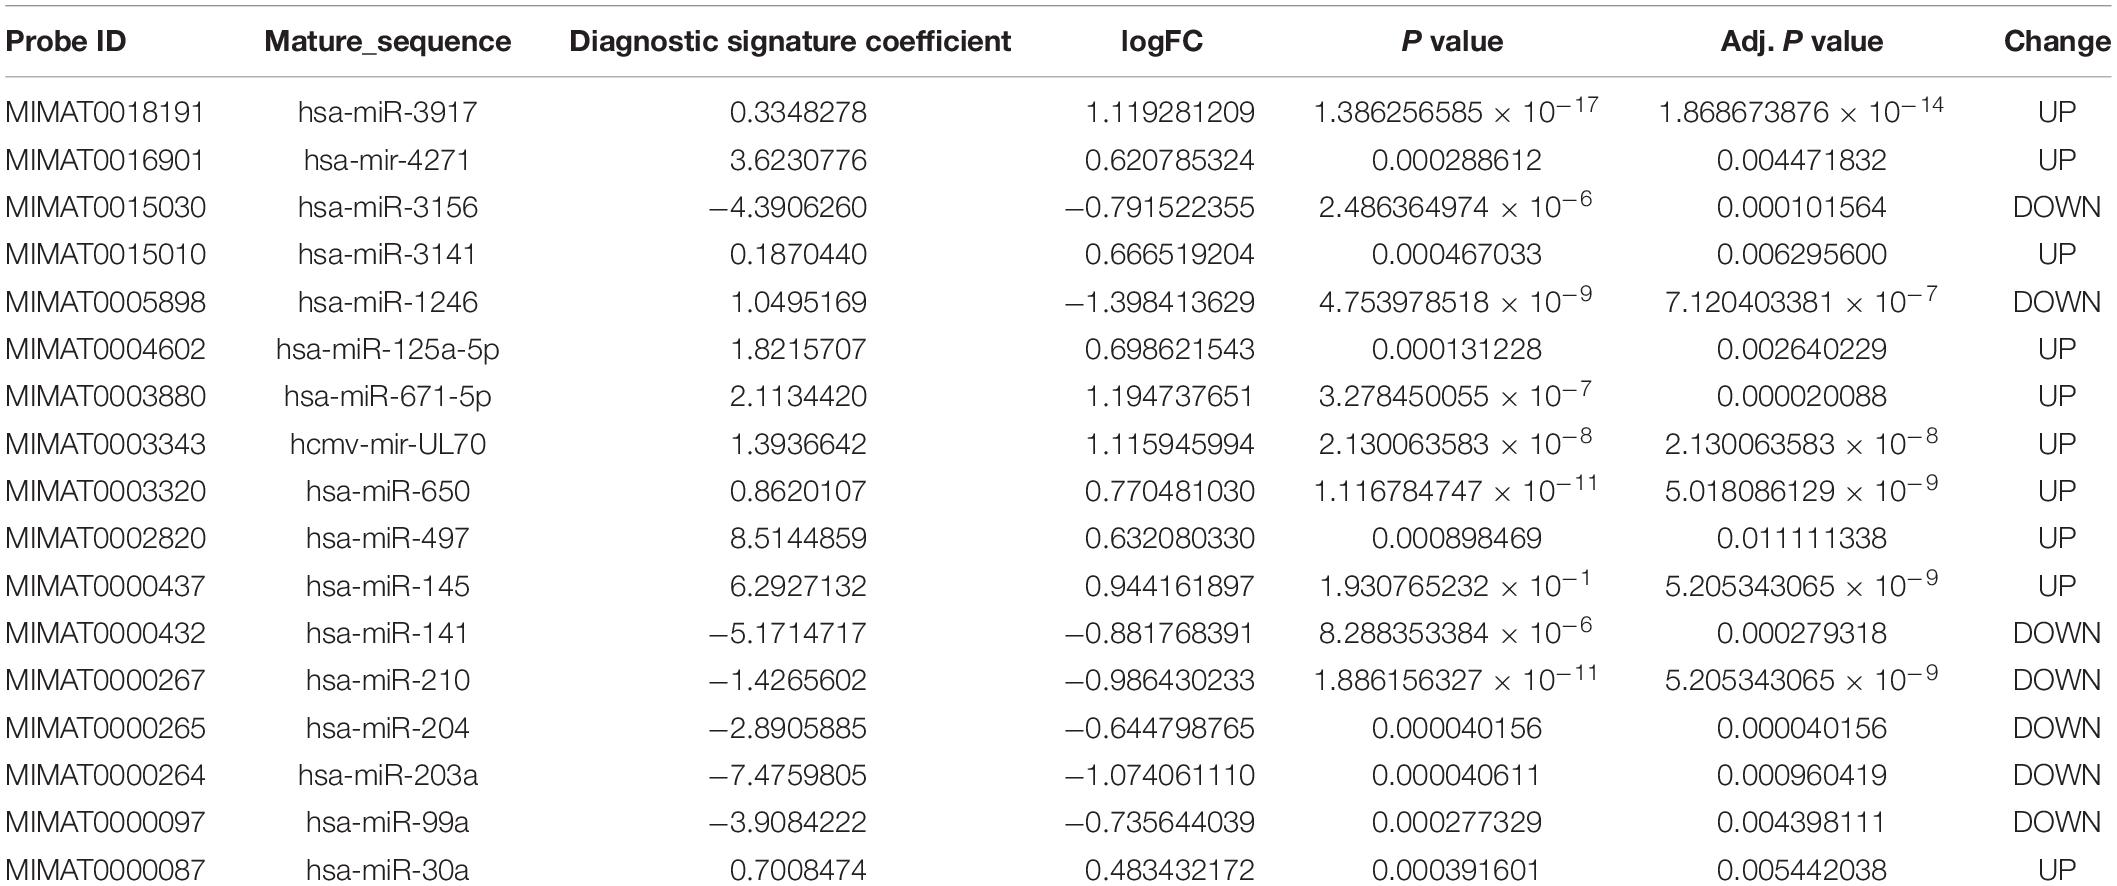
Table 1. Eleven miRNAs used in the diagnostic signature for periodontitis prediction.
In the training set, the AUC of the signature for periodontitis diagnosis was 0.996 (95% CI: 0.990–1.000; Figure 3A). The ROC curve was used to determine the best cutoff value in periodontitis diagnosis, which was 0.5056. Applying the miRNA signature yielded a sensitivity of 97.3% and a specificity of 100.0% in the training dataset (Figure 3B). To validate the diagnostic value of the signature in the testing cohort, we used the equation above to compute risk scores with the clinical outcome and miRNA profile data. The distribution of risk scores for the testing set was very similar to that of the training set. In the testing set, the area under the ROC curve for the signature was 0.998 (95% CI: 0.993–1.000; Figure 3C). Applying the miRNA signature yielded a sensitivity of 97.9% and a specificity of 91.7% (Figure 3D). The 17 miRNAs in the training set (Figure 3E) and testing set (Figure 3F) were able to distinguish periodontally diseased gingiva from normal controls.
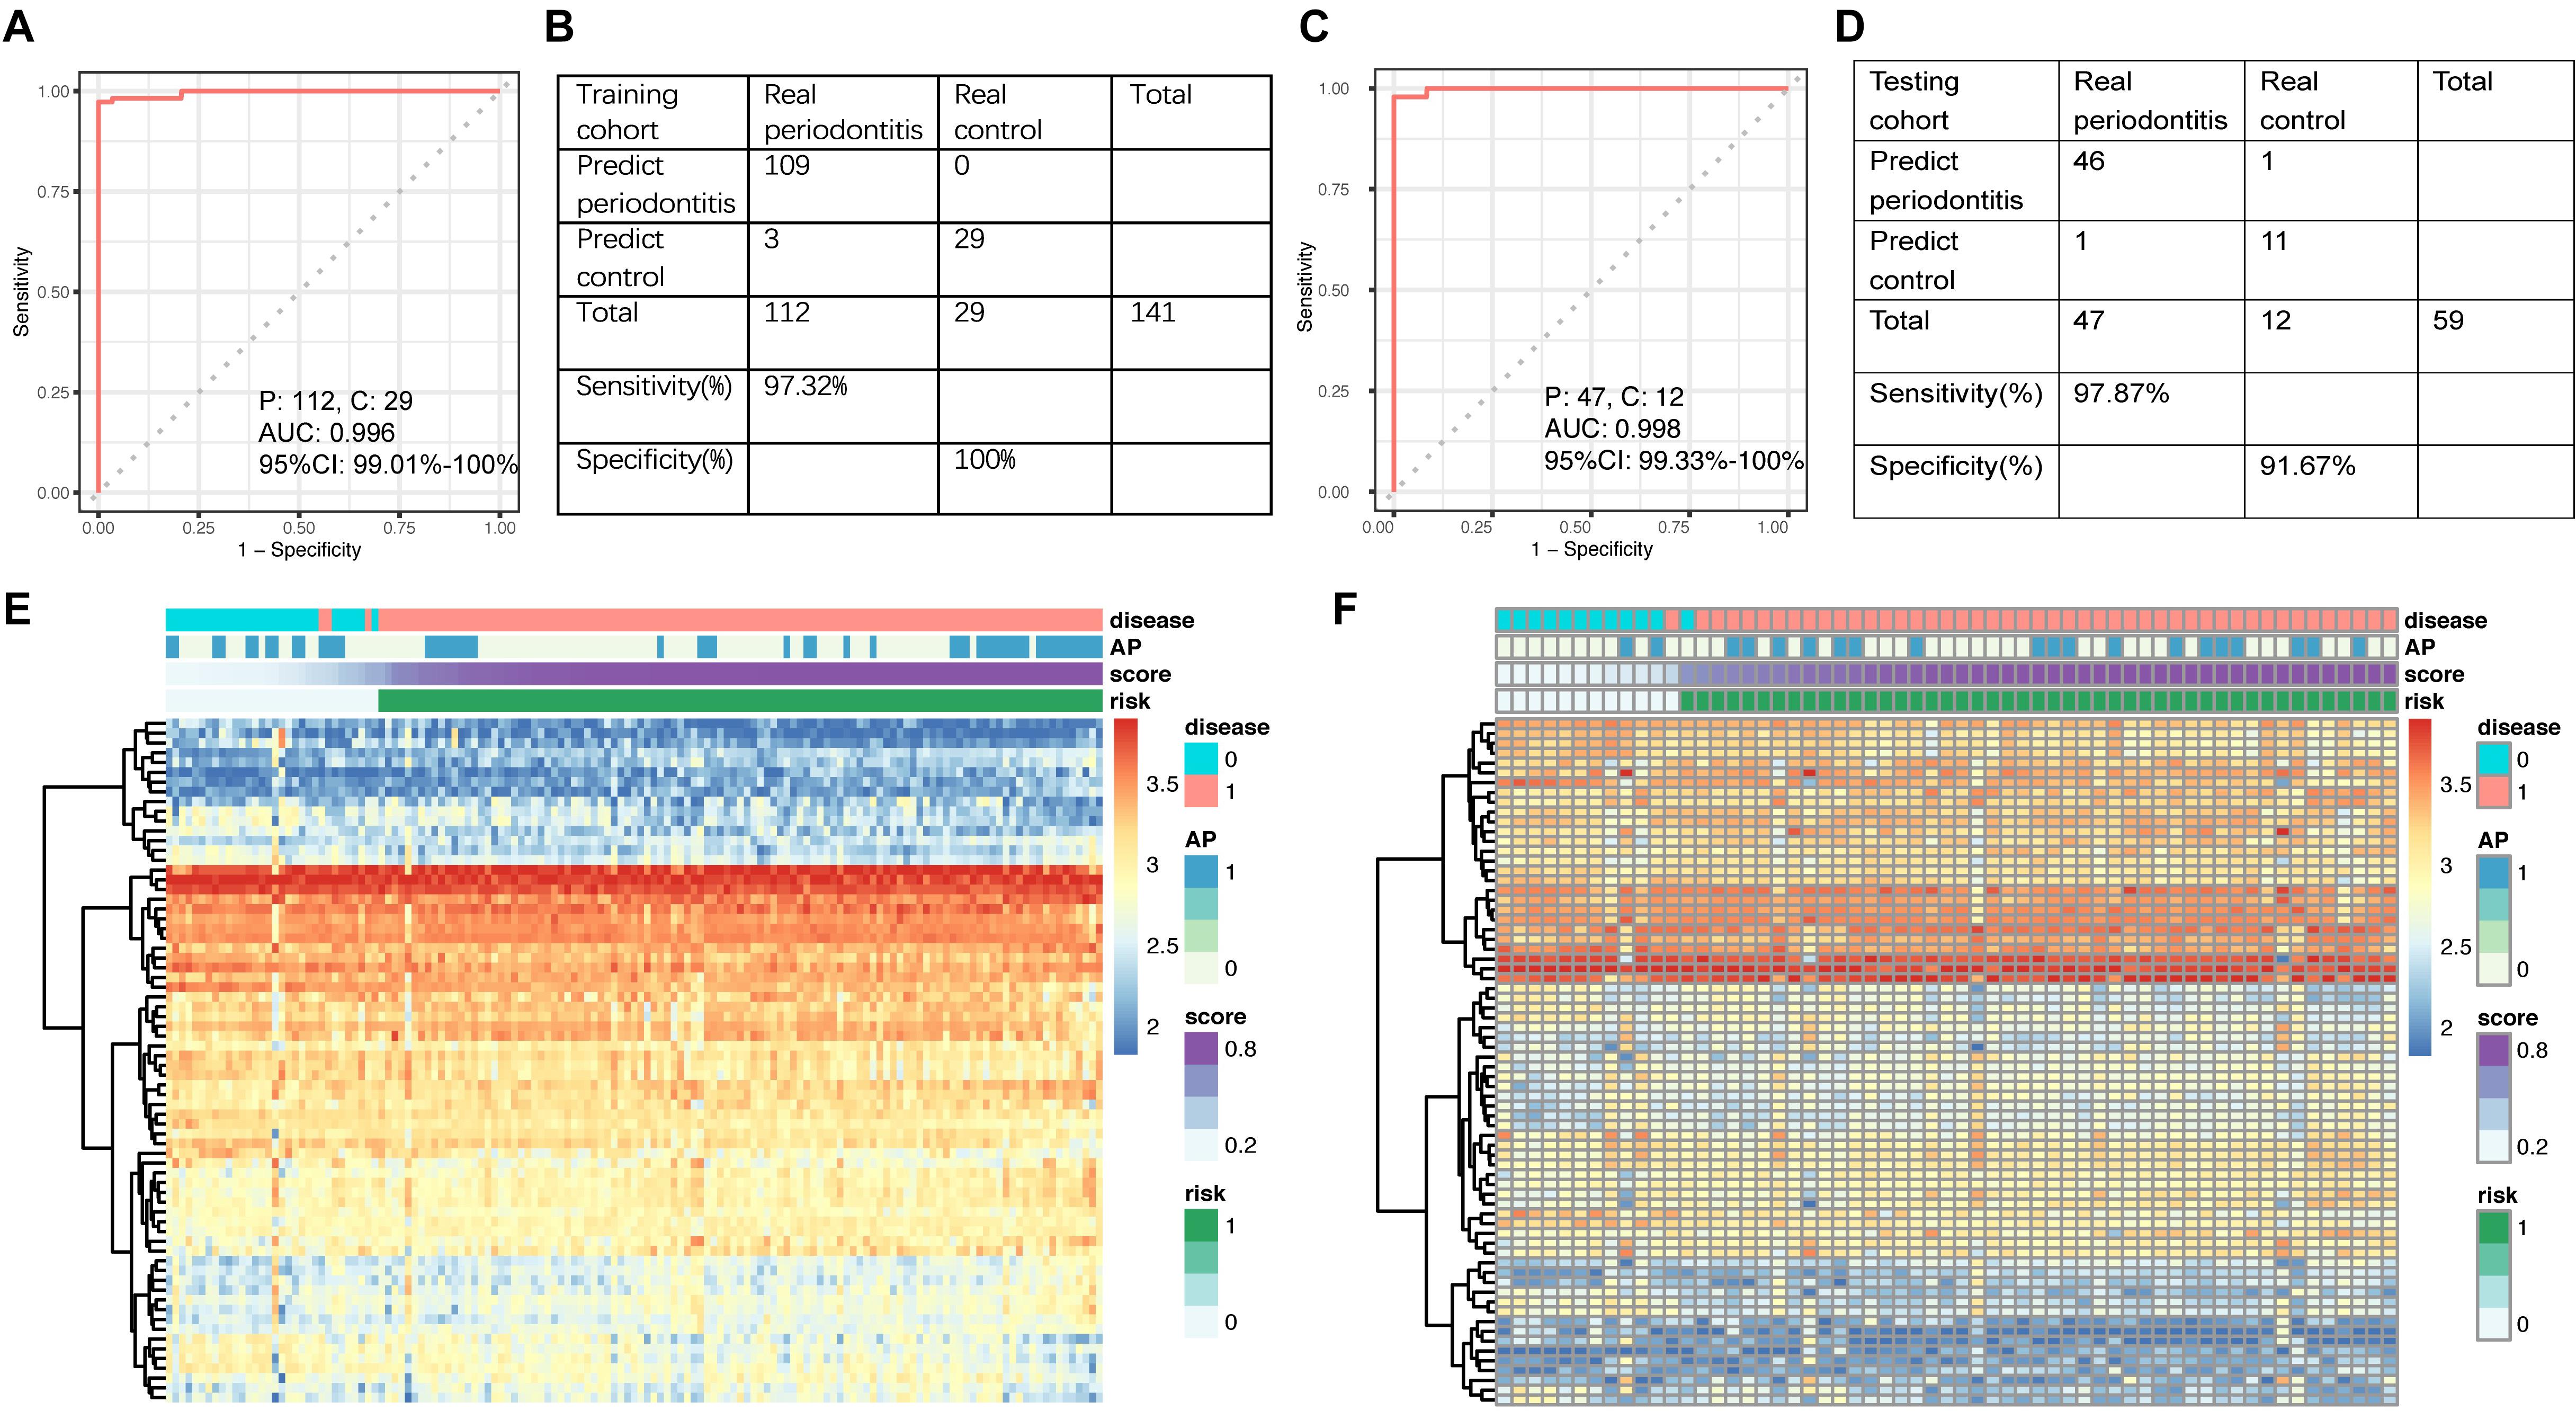
Figure 3. (A) ROC curve of the diagnostic signature in the training set. (B) Confusion table of binary results of the diagnostic signature in the training set. (C) ROC curve of the diagnostic signature in the testing set. (D) Confusion table of binary results of the diagnostic signature in the testing set. Unsupervised hierarchical clustering of 17 miRNA markers selected for use in the diagnostic signature in the (E) training and (F) testing set.
We next assessed the efficacy of the miRNA signature in differentiating control vs. disease samples, CP vs. AP, and localized vs. generalized range. The risk scores were calculated for each sample. Then, the cutoff value was used to divide 200 samples into two groups: 156 cases showed high risk scores, and 44 showed low risk scores (Table 2). The diagnostic signature could differentiate disease samples from control samples (P = 1.508 × 10–36, Figure 4A), as well as the affected range of periodontitis (P = 0.015, Figure 4C). In general, periodontal tissue samples with high risk scores were more likely to show symptoms of periodontitis. In contrast, the disease subtype (P = 0.138, Figure 4B) was not significantly associated with the signature scores.
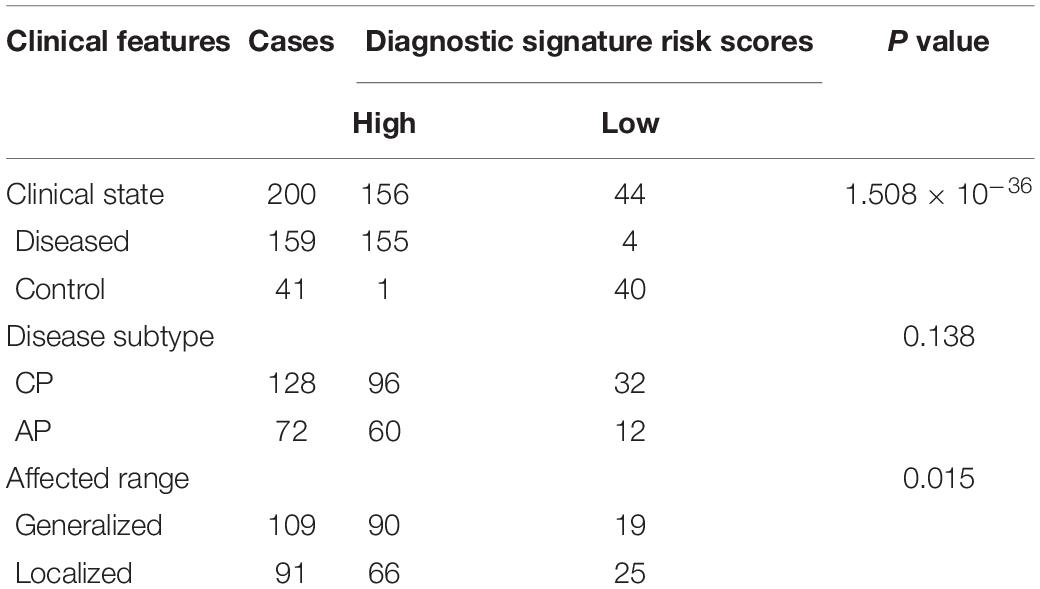
Table 2. Association of the diagnostic signature risk scores with clinical characteristics.
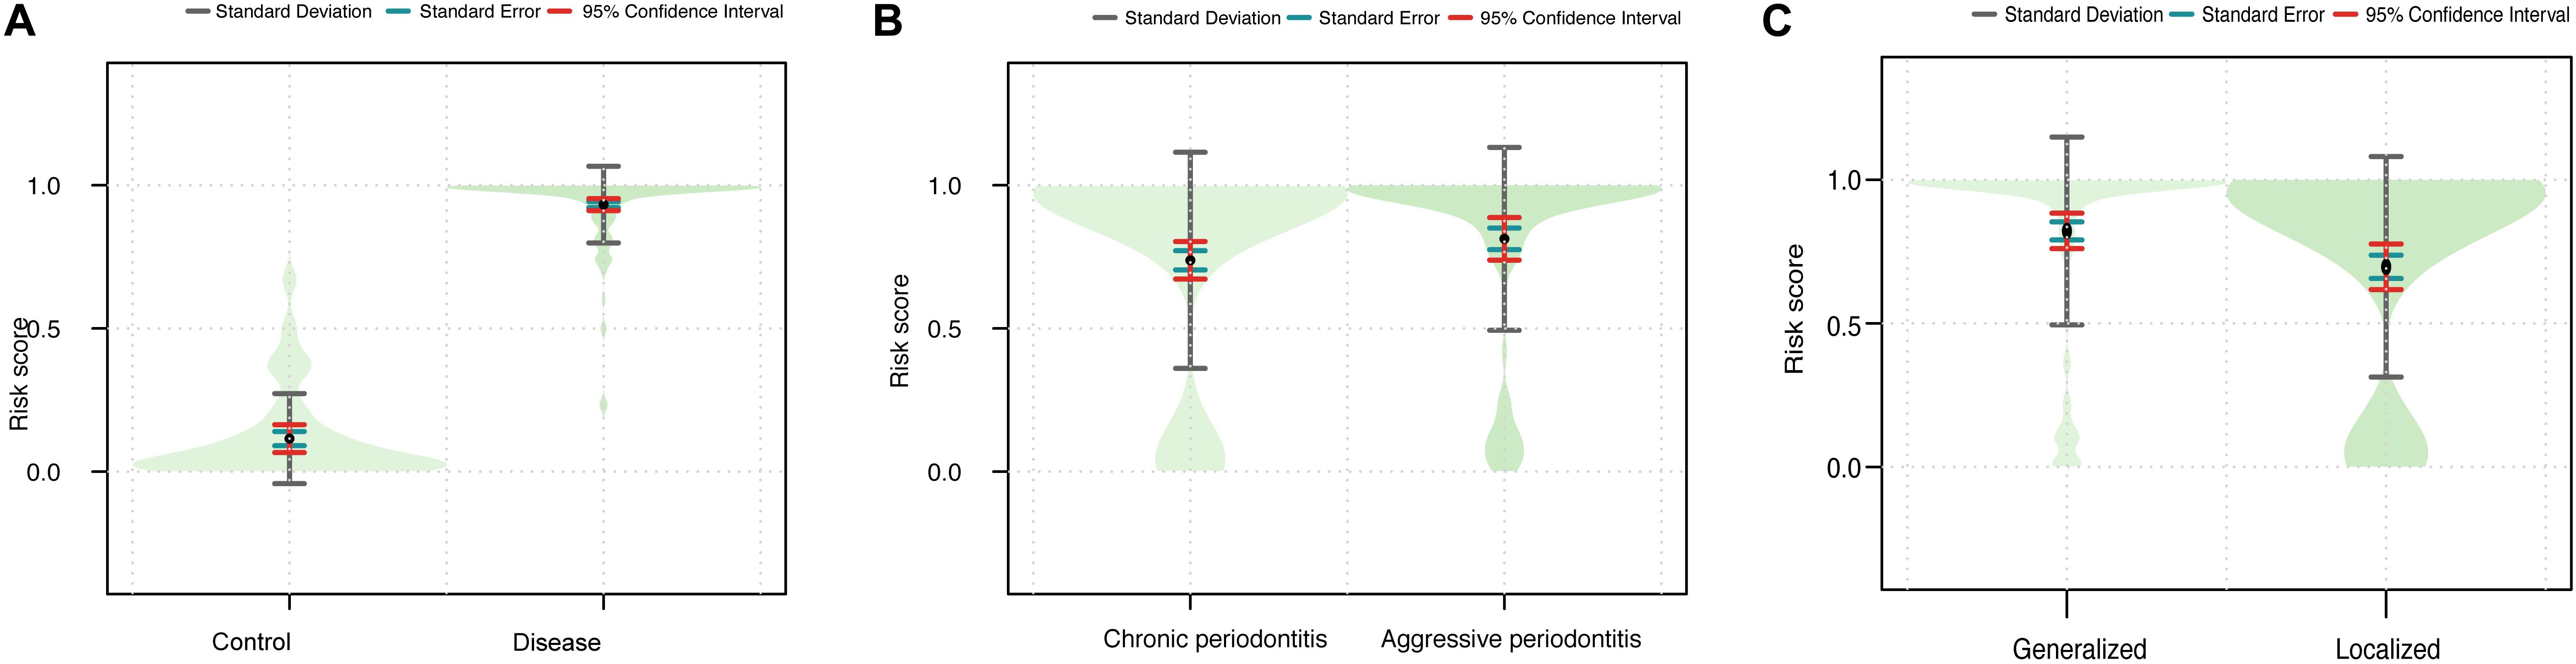
Figure 4. Violin plots showing the relationship between the signature and the clinical outcomes. (A) The combined risk score in the disease vs. control group. (B) The combined risk score in the CP vs. AP group. (C) The combined risk score in the generalized vs. localized group.
The 17 DE-miRNAs of the signature were put into the miRcode and starBase v 2.0 databases to predict their lncRNA targets. Then, the corresponding coding genes of the DE-miRNAs were predicted through miRTarBase. After removing results that did not meet the screening criteria, 5 miRNAs, 13 lncRNAs, and 32 mRNAs were used to establish a ceRNA network (Figure 5A). The detailed data of all 81 ceRNA network components are shown in Supplementary Table 2. Furthermore, the degree of connection of each gene by topology was calculated to illustrate its importance in the ceRNA network (Figure 5A).
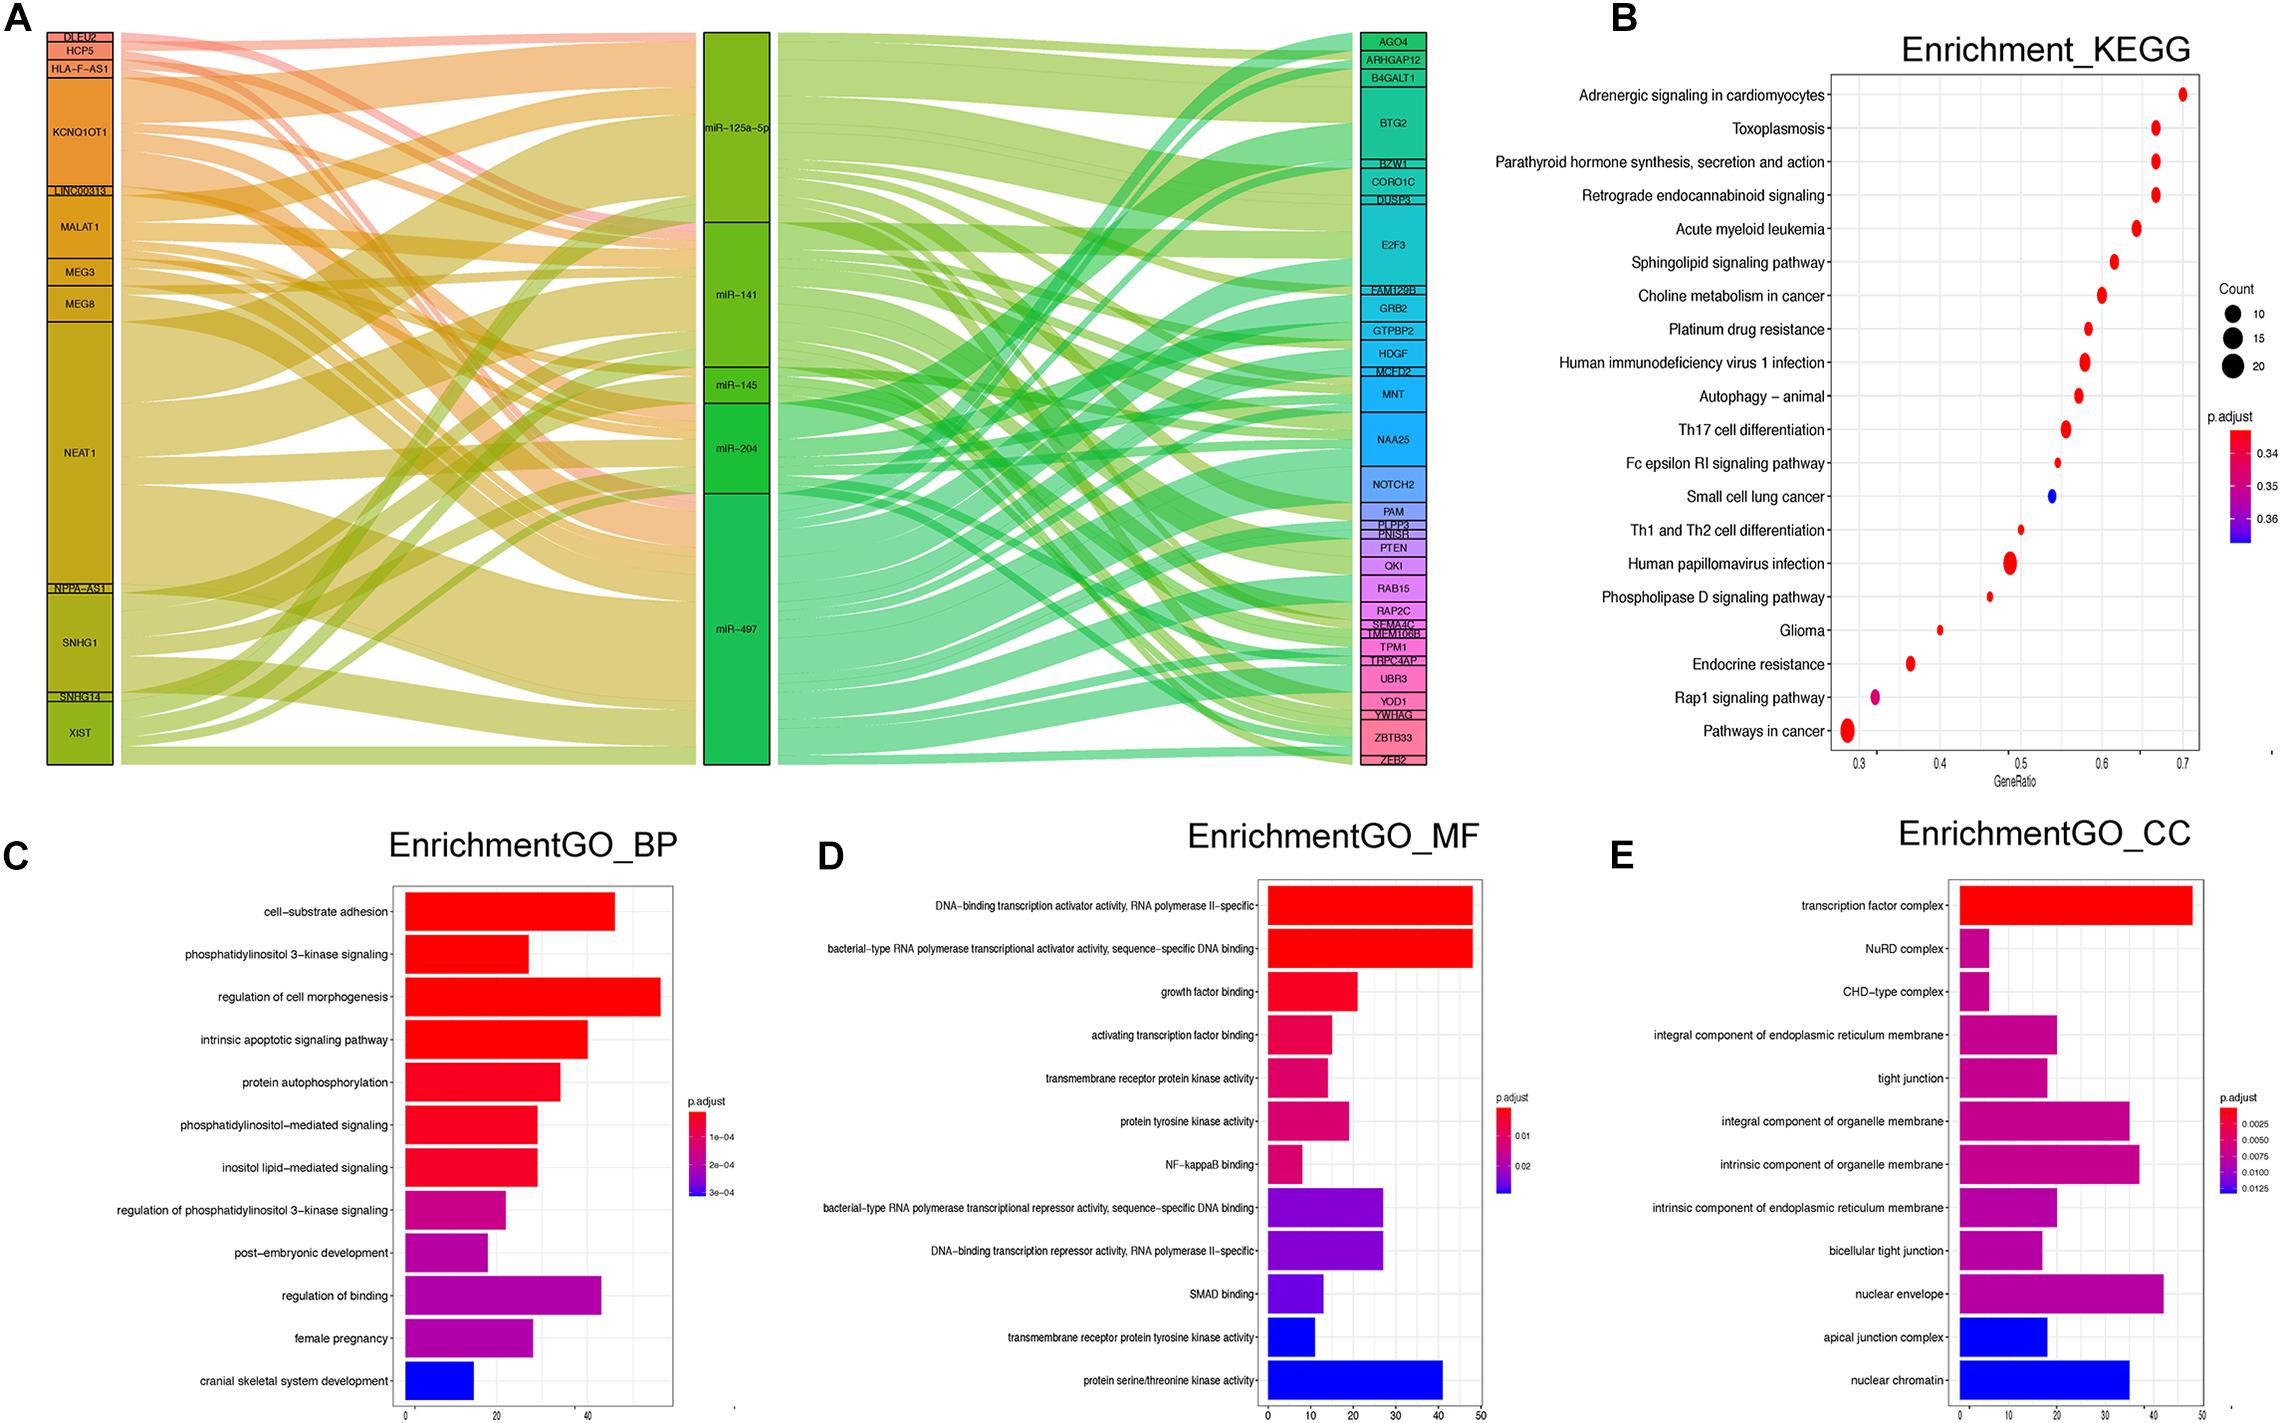
Figure 5. (A) Sankey diagram for the ceRNA network analysis. Each rectangle represents a gene, and the connection degree of each gene is visualized based on the size of the rectangle. (B) Top 20 KEGG signaling pathway enrichment of the 17 miRNA-targeted mRNAs. (C–E) Top 12 GO functional enrichment of the 17 miRNA-targeted mRNAs.
There were 1,107 overlapping mRNAs between the previously mentioned two cohorts (Supplementary Table 3). Functional enrichment analysis identified 441 GO terms in the biological process (BP) category, 19 GO terms in the cellular component (CC) category, 16 GO terms in the molecular function (MF) category, and 48 KEGG pathways (Supplementary Table 4). The top 12 GO results and top 20 KEGG results are shown in Figure 5. Regarding BP, the DE-mRNAs were involved in cell–substrate adhesion, the intrinsic apoptotic signaling pathway, and regulation of cell morphogenesis (Figure 5C). In terms of MF, the DE-mRNAs were mainly associated with DNA-binding transcription activator activity, bacterial-type RNA polymerase transcriptional activator activity, and bacterial-type RNA polymerase transcriptional repressor activity, among other associations. The CCs of the DE-mRNAs were transcription factor complex, nuclear envelope, intrinsic component of organelle membrane, and so on. In addition, the KEGG results showed enrichment in the rap 1 signaling pathway, phospholipase D signaling pathway, autophagy animal, and Th1 and Th2 cell differentiation, and so on.
The early diagnosis of periodontitis helps to preserve teeth and improve quality of life. However, clinical monitoring is time-consuming, is subject to considerable measurement error, and is often poorly tolerated by patients (Miller et al., 2010; Kinane et al., 2017). Thus, objectively quantifiable biomarkers are needed for periodontitis diagnosis.
For single molecules, the highest reported values of sensitivity were obtained by IL-1β (78.7%) (De Luca Canto et al., 2015), MMP-8 (75.5%) (Alassiri et al., 2018), IL-6 (72%) (Lee et al., 2018), and hemoglobin (72%) (Nomura et al., 2016). The highest reported values of specificity were obtained by IL-1β (78.0%) and MMP-9 (77.0%) (Kim et al., 2016). For the combination diagnostic models, the combination of IL-1β, IL-1ra, and MMP exhibited the highest AUC (0.853) with high sensitivity (73.3%) and specificity (88.9%) (Wu et al., 2018). The TdPiTfAaFnPm bacterial cluster-based model has an AUC ≥ 0.787 with a sensitivity and specificity ≥ 80.0% (Tomas et al., 2017). However, there are limited reports on non-coding RNAs as biomarkers for periodontitis.
Previous studies have highlighted a single miRNA biomarker of periodontitis, such as miR-143-3p (P ≤ 0.05) (Nisha et al., 2019) or miR-1226 (P < 0.05) (Mico-Martinez et al., 2018). However, the analysis of single miRNAs cannot provide a complete picture of the existing physiological and pathological state. Multi-miRNA signatures may have higher AUC, sensitivity, and specificity values. Therefore, for the first time, we developed and validated a multiple miRNA-based diagnostic signature for periodontitis, obtaining an AUC of 0.996 in the training set and an AUC of 0.998 in the testing set, which is very convincing for periodontitis biomarkers, to the best of our knowledge.
These results demonstrate that the signature can effectively assess disease vs. control. The signature also can differentiate affected range, which may be because these two diagnoses have similarities. The main criterion of affected range is affected tooth number. Thus, the more tooth positions show symptoms of periodontitis, the higher the risk score will be. However, the signature cannot assess AP vs. CP, which may be because both AP and CP belong to disease samples, and hence cannot be distinguished effectively.
The signaling pathway enrichment analysis indicated that the 17 miRNA-targeted mRNAs play important roles in the rap 1 signaling pathway, phospholipase D signaling pathway, and autophagy animals, which are closely related to the regulation of mTOR activity and cell autophagy (Liu et al., 2013; Zhao et al., 2015; Chen et al., 2018). The other enriched pathways include Th1 and Th2 cell differentiation and Th17 cell differentiation; these pathways are directly connected to Th1/Th2 balance and immunoregulation (Yun et al., 2003; Orozco et al., 2007). In addition, the Fc epsilon RI signaling pathway induces NF-kappa B activation in mast cells and mast cell degranulation (Klemm and Ruland, 2006), which is related to cell apoptosis. Their involvement with pathways in cancer confirmed an association between various types of cancer and clinical signs of periodontitis, combined with poor oral health (Hoare et al., 2019).
There are limitations to our research. Although the AUC, sensitivity, and specificity of the diagnostic signature are convincing for non-coding RNA-based signatures, the samples came from periodontal gingival tissue, which is difficult to collect. Further research should focus on miRNA-based diagnostic signatures of gingival crevicular fluid for periodontitis. Besides, available data are not enough for external verification, which needs future work to be perfected.
Our study identified a 17-miRNA-based diagnostic signature for periodontitis, and it warrants large-scale clinical validation in the future.
The dataset presented in this study can be found in online repositories. The names of the repository/repositories and accession number(s) can be found in the article/ Supplementary Material.
S-HJ drafted the manuscript. J-GZ analyzed the data. X-YG and G-HB interpreted the data. J-GL revised the work critically. L-WC drafted the manuscript and gave final approval of the version to be published. All authors had made substantial contributions to conception and design of the study.
The research was supported by the National Key Research and Development Program of China (Project No. 2016YFC1102800), the Natural Science Foundation of Guizhou Province [No. QKHJC (2019)1333], the Research Programs of Health Commission Foundation of Guizhou Province (Grant Nos. gzwjkj2019-1-073 and gzwjkj2019-1-172), the Supervisors Workshop Program of Zunyi Medical University (No. ZDG003), and the Fundamental Research Funds for the Central Universities (No. 2042018kf0129).
The authors declare that the research was conducted in the absence of any commercial or financial relationships that could be construed as a potential conflict of interest.
The authors express their appreciation to Stoecklin-Wasmer C., Guarnieri P., Celenti R., Demmer R. T., Kebschull M., and Papapanou P. N. for kindly sharing the precious data on GEO database. The authors report no conflicts of interest related to this study.
The Supplementary Material for this article can be found online at: https://www.frontiersin.org/articles/10.3389/fgene.2020.577585/full#supplementary-material
Supplementary Figure 1 | Violin plots showing the relationship between 17 miRNAs selected for use in the diagnostic signature and the clinical outcomes.
Supplementary Table 1 | Comparison of patient characteristics between diseased and control samples within 72 DE-miRNAs.
Supplementary Table 2 | The detailed data of all ceRNA network components.
Supplementary Table 3 | The detailed data of overlapping DE-mRNAs.
Supplementary Table 4 | The functional enrichment assay identified 441 GO terms in BP, 19 GO terms in CC, 16 GO terms in MF, and 48 KEGG pathway.
Ababneh, K. T., Abu Hwaij, Z. M., and Khader, Y. S. (2012). Prevalence and risk indicators of gingivitis and periodontitis in a multi-centre study in North Jordan: a cross sectional study. BMC Oral Health 12:1. doi: 10.1186/1472-6831-12-1
Alassiri, S., Parnanen, P., Rathnayake, N., Johannsen, G., Heikkinen, A.-M., Lazzara, R., et al. (2018). The ability of quantitative, specific, and sensitive point-of-care/chair-side oral fluid immunotests for aMMP-8 to detect periodontal and peri-implant diseases. Dis. Mark. 2018:1306396.
Arias-Bujanda, N., Regueira-Iglesias, A., Balsa-Castro, C., Nibali, L., Donos, N., and Tomas, I. (2019). Accuracy of single molecular biomarkers in saliva for the diagnosis of periodontitis: a systematic review and meta-analysis. J. Clin. Periodontol. 47, 2–18. doi: 10.1111/jcpe.13202
Cafiero, C., Matarasso, M., Marenzi, G., Iorio Siciliano, V., Bellia, L., and Sammartino, G. (2013). Periodontal care as a fundamental step for an active and healthy ageing. ScientificWorldJournal 2013:127905.
Catunda, R. Q., Levin, L., Kornerup, I., and Gibson, M. P. (2019). Prevalence of periodontitis in young populations: a systematic review. Oral Health Prev. Dent. 17, 195–202.
Chen, C., Cheng, P., Xie, H., Zhou, H.-D., Wu, X.-P., Liao, E.-Y., et al. (2014). MiR-503 regulates osteoclastogenesis via targeting RANK. J. Bone Miner Res. 29, 338–347. doi: 10.1002/jbmr.2032
Chen, R., Huang, Z., Wang, J., Chen, X., Fu, Y., and Wang, W. (2018). Silent information regulator 1 negatively regulates atherosclerotic angiogenesis via mammalian target of rapamycin complex 1 signaling pathway. Am. J. Med. Sci. 356, 168–176. doi: 10.1016/j.amjms.2018.04.010
Clark, D., Febbraio, M., and Levin, L. (2017). Aggressive periodontitis: the unsolved mystery. Quintessence Int. 48, 103–111.
De Luca Canto, G., Pacheco-Pereira, C., Aydinoz, S., Major, P. W., Flores-Mir, C., and Gozal, D. (2015). Diagnostic capability of biological markers in assessment of obstructive sleep apnea: a systematic review and meta-analysis. J. Clin. Sleep Med. 11, 27–36. doi: 10.5664/jcsm.4358
Gao, J., Kwan, P. W., and Shi, D. (2010). Sparse kernel learning with LASSO and Bayesian inference algorithm. Neural Netw. 23, 257–264. doi: 10.1016/j.neunet.2009.07.001
Gross, A. J., Paskett, K. T., Cheever, V. J., and Lipsky, M. S. (2017). Periodontitis: a global disease and the primary care provider’s role. Postgrad. Med. J. 93, 560–565. doi: 10.1136/postgradmedj-2017-134801
Guo, L. J., Liao, L., Yang, L., Li, Y., and Jiang, T. J. (2014). MiR-125a TNF receptor-associated factor 6 to inhibit osteoclastogenesis. Exp. Cell Res. 321, 142–152. doi: 10.1016/j.yexcr.2013.12.001
Hienz, S. A., Paliwal, S., and Ivanovski, S. (2015). Mechanisms of bone resorption in periodontitis. J. Immunol. Res. 2015:615486.
Hoare, A., Soto, C., Rojas-Celis, V., and Bravo, D. (2019). Chronic Inflammation as a Link between Periodontitis and Carcinogenesis. Mediat. Inflamm. 2019:10298.
Hung, P. S., Chen, F. C., Kuang, S. H., Kao, S. Y., Lin, S. C., and Chang, K. W. (2010). miR-146a induces differentiation of periodontal ligament cells. J. Dent. Res. 89, 252–257. doi: 10.1177/0022034509357411
Jin, S. H., Zhou, R. H., Guan, X. Y., Zhou, J. G., and Liu, J. G. (2019). Identification of novel key lncRNAs involved in periodontitis by weighted gene co-expression network analysis. J. Periodontal Res. 55, 96–106. doi: 10.1111/jre.12693
Kassebaum, N. J., Bernabe, E., Dahiya, M., Bhandari, B., Murray, C. J., and Marcenes, W. (2014). Global burden of severe periodontitis in 1990-2010: a systematic review and meta-regression. J. Dent. Res. 93, 1045–1053. doi: 10.1177/0022034514552491
Kim, H. D., Shin, M. S., Kim, H. T., Kim, M. S., and Ahn, Y. B. (2016). Incipient periodontitis and salivary molecules among Korean adults: association and screening ability. J. Clin. Periodontol. 43, 1032–1040. doi: 10.1111/jcpe.12607
Kinane, D. F., Stathopoulou, P. G., and Papapanou, P. N. (2017). Periodontal diseases. Nat. Rev. Dis. Primers 3:17038.
Kinney, J. S., Morelli, T., Oh, M., Braun, T. M., Ramseier, C. A., Sugai, J. V., et al. (2014). Crevicular fluid biomarkers and periodontal disease progression. J. Clin. Periodontol. 41, 113–120.
Klemm, S., and Ruland, J. (2006). Inflammatory signal transduction from the Fc epsilon RI to NF-kappa B. Immunobiology 211, 815–820.
Lee, C. H., Chen, Y. W., Tu, Y. K., Wu, Y. C., and Chang, P. C. (2018). The potential of salivary biomarkers for predicting the sensitivity and monitoring the response to nonsurgical periodontal therapy: a preliminary assessment. J. Periodontal Res. 53, 545–554. doi: 10.1111/jre.12544
Liu, W., Li, J., Zhang, P., Hou, Q., Feng, S., Liu, L., et al. (2019). A novel pan-cancer biomarker plasma heat shock protein 90alpha and its diagnosis determinants in clinic. Cancer Sci. 110, 2941–2959. doi: 10.1111/cas.14143
Liu, Y., Kach, A., Ziegler, U., Ong, A. C. M., Wallace, D. P., Arcaro, A., et al. (2013). The role of phospholipase D in modulating the MTOR signaling pathway in polycystic kidney disease. PLoS One 8:e73173. doi: 10.1371/journal.pone.0073173
Liu, Y., Liu, W., Hu, C., Xue, Z., Wang, G., Ding, B., et al. (2011). MiR-17 modulates osteogenic differentiation through a coherent feed-forward loop in mesenchymal stem cells isolated from periodontal ligaments of patients with periodontitis. Stem Cells 29, 1804–1816. doi: 10.1002/stem.728
Luan, X., Zhou, X., Naqvi, A., Francis, M., Foyle, D., Nares, S., et al. (2018). MicroRNAs and immunity in periodontal health and disease. Int. J. Oral Sci. 10:24.
Ma, X., Tao, R., Li, L., Chen, H., Liu, Z., Bai, J., et al. (2019). Identification of a 5microRNA signature and hub miRNAmRNA interactions associated with pancreatic cancer. Oncol. Rep. 41, 292–300.
Mico-Martinez, P., Garcia-Gimenez, J. L., Seco-Cervera, M., López-Roldán, A., Almiñana-Pastor, P.-J., Alpiste-Illueca, F., et al. (2018). miR-1226 detection in GCF as potential biomarker of chronic periodontitis: a pilot study. Med. Oral Patol. Oral Cir. Bucal. 23, e308–e314.
Miller, C. S., Foley, J. D., Bailey, A. L., Campell, C. L., Humphries, R. L., Christodoulides, N., et al. (2010). Current developments in salivary diagnostics. Biomark. Med. 4, 171–189.
Nibali, L., Farias, B. C., Vajgel, A., Tu, Y. K., and Donos, N. (2013). Tooth loss in aggressive periodontitis: a systematic review. J. Dent. Res. 92, 868–875. doi: 10.1177/0022034513501878
Nisha, K. J., Janam, P., and Harshakumar, K. (2019). Identification of a novel salivary biomarker miR-143-3p for periodontal diagnosis: a proof of concept study. J. Periodontol. 90, 1149–1159. doi: 10.1002/jper.18-0729
Nomura, Y., Okada, A., Kakuta, E., Gunji, T., Kajiura, S., and Hanada, N. (2016). A new screening method for periodontitis: an alternative to the community periodontal index. BMC Oral Health 16:64. doi: 10.1186/s12903-016-0216-x
Orozco, A., Gemmell, E., Bickel, M., and Seymour, G. J. (2007). Interleukin 18 and periodontal disease. J. Dent. Res. 86, 586–593. doi: 10.1177/154405910708600702
Papapanou, P. N., and Susin, C. (2017). Periodontitis epidemiology: is periodontitis under-recognized, over-diagnosed, or both? Periodontol 2000 75, 45–51. doi: 10.1111/prd.12200
Saito, A., Horie, M., Ejiri, K., Aoki, A., Katagiri, S., Maekawa, S., et al. (2017). MicroRNA profiling in gingival crevicular fluid of periodontitis-a pilot study. FEBS Open Biol. 7, 981–994. doi: 10.1002/2211-5463.12238
Sauerbrei, W., Royston, P., and Binder, H. (2007). Selection of important variables and determination of functional form for continuous predictors in multivariable model building. Stat. Med. 26, 5512–5528. doi: 10.1002/sim.3148
Schmalz, G., Li, S., Burkhardt, R., Rinke, S., Krause, F., Haak, R., et al. (2016). MicroRNAs as salivary markers for periodontal diseases: a new diagnostic approach? BioMed Res. Int. 2016:1027525.
Stoecklin-Wasmer, C., Guarnieri, P., Celenti, R., Demmer, R. T., Kebschull, M., and Papapanou, P. N. (2012). MicroRNAs and their target genes in gingival tissues. J. Dent. Res. 91, 934–940. doi: 10.1177/0022034512456551
Sugatani, T., and Hruska, K. A. (2007). MicroRNA-223 is a key factor in osteoclast differentiation. J. Cell. Biochem. 101, 996–999. doi: 10.1002/jcb.21335
Susin, C., Haas, A. N., and Albandar, J. M. (2014). Epidemiology and demographics of aggressive periodontitis. Periodontol 2000. 65, 27–45. doi: 10.1111/prd.12019
Tomas, I., Regueira-Iglesias, A., Lopez, M., Arias-Bujanda, N., Novoa, L., Balsa-Castro, C., et al. (2017). Quantification by qPCR of pathobionts in chronic periodontitis: development of predictive models of disease severity at site-specific level. Front. Microbiol. 8:1443. doi: 10.3389/fmicb.2017.01443
Wu, Y. C., Ning, L., Tu, Y. K., Huang, C.-P., Huang, N.-T., Chen, Y.-F., et al. (2018). Salivary biomarker combination prediction model for the diagnosis of periodontitis in a Taiwanese population. J. Formos Med. Assoc. 117, 841–848. doi: 10.1016/j.jfma.2017.10.004
Xu, R. H., Wei, W., Krawczyk, M., Wang, W., Luo, H., Flagg, K., et al. (2017). Circulating tumour DNA methylation markers for diagnosis and prognosis of hepatocellular carcinoma. Nat. Mater. 16, 1155–1161.
Yao, Z. S., Li, C., Liang, D., Jiang, X.-B., Tang, J.-J., Ye, L.-Q., et al. (2018). Diagnostic and prognostic implications of serum miR-101 in osteosarcoma. Cancer Biomark. 22, 127–133. doi: 10.3233/cbm-171103
Yun, L. W., Decarlo, A. A., Collyer, C., and Hunter, N. (2003). Enhancement of Th2 pathways and direct activation of B cells by the gingipains of Porphyromonas gingivalis. Clin. Exp. Immunol. 134, 295–302. doi: 10.1046/j.1365-2249.2003.02287.x
Zhang, B., Lin, T., and He, H. (2015). Comparative analysis of blood and saliva expression profiles in chronic and refractory periodontitis patients. BMC Oral Health 15:166. doi: 10.1186/s12903-015-0150-3
Zhao, R., Chen, M., Jiang, Z., Zhao, F., Xi, B., Zhang, X., et al. (2015). Platycodin-D induced autophagy in non-small cell lung cancer cells via PI3K/Akt/mTOR and MAPK signaling pathways. J. Cancer 6, 623–631. doi: 10.7150/jca.11291
Keywords: periodontitis, miRNA, diagnostic signature, LASSO method, ROC curve
Citation: Jin S-H, Zhou J-G, Guan X-Y, Bai G-H, Liu J-G and Chen L-W (2020) Development of an miRNA-Array-Based Diagnostic Signature for Periodontitis. Front. Genet. 11:577585. doi: 10.3389/fgene.2020.577585
Received: 15 August 2020; Accepted: 09 November 2020;
Published: 16 December 2020.
Edited by:
Dijun Chen, Nanjing University, ChinaReviewed by:
Peijing Zhang, Zhejiang University, ChinaCopyright © 2020 Jin, Zhou, Guan, Bai, Liu and Chen. This is an open-access article distributed under the terms of the Creative Commons Attribution License (CC BY). The use, distribution or reproduction in other forums is permitted, provided the original author(s) and the copyright owner(s) are credited and that the original publication in this journal is cited, in accordance with accepted academic practice. No use, distribution or reproduction is permitted which does not comply with these terms.
*Correspondence: Jian-Guo Liu, bGl1amdfMDAxQDE2My5jb20=; Liang-Wen Chen, a3EwMDIwNDhAd2h1LmVkdS5jbg==
Disclaimer: All claims expressed in this article are solely those of the authors and do not necessarily represent those of their affiliated organizations, or those of the publisher, the editors and the reviewers. Any product that may be evaluated in this article or claim that may be made by its manufacturer is not guaranteed or endorsed by the publisher.
Research integrity at Frontiers
Learn more about the work of our research integrity team to safeguard the quality of each article we publish.