 Barbara Kosińska-Selbi1
 Tomasz Suchocki1,2Christa Egger-Danner3Hermann Schwarzenbacher3Magdalena Frąszczak1
 Joanna Szyda1,2*
- 1Biostatistic Group, Department of Genetics, Wrocław University of Environmental and Life Sciences, Wrocław, Poland
- 2National Research Institute of Animal Production, Balice, Poland
- 3ZuchtData EDV-Dienstleistungen GmbH, Vienna, Austria
Genetic heterogeneity denotes the situation when different genetic architectures underlying diverse populations result in the same phenotype. In this study, we explore the genetic background underlying differences in the incidence of hoof disorders between Braunvieh and Fleckvieh cattle in the context of genetic heterogeneity between the breeds. Despite potentially higher power of testing due to twice as large sample size, none of the SNPs was significantly associated with the total number of hoof disorders in Fleckvieh, while 15 SNPs were significant in Braunvieh. The most promising candidate genes in Braunvieh were as follows: CBLB on BTA1, which causes arthritis in rats; CAV2 on BTA4, which affects skeletal muscles in mice; PTHLH on BTA5, which causes disease phenotypes related to the skeleton in humans, mice, and zebrafish; and SORCS2 on BTA6, which causes decreased susceptibility to injury in mice. Some of the significant SNPs (BTA1, BTA4, BTA5, BTA13, and BTA16) revealed allelic heterogeneity—i.e., different allele frequencies between Fleckvieh and Braunvieh. Some of the significant regions (BTA1, BTA5, BTA13, and BTA16) correlated to inter-breed differences in linkage disequilibrium (LD) structure and may thus represent false-positive heterogeneity. However, positions on BTA6 (SORCS2), BTA14, and BTA24 mark Braunvieh-specific regions. We hypothesize that the observed genetic heterogeneity of hoof disorders is a by-product of different selection goals defined for the analyzed breeds—toward dairy production in Braunvieh and toward beef production in Fleckvieh. Based on the current dataset, it is not possible to unequivocally confirm or exclude the hypothesis of genetic heterogeneity in the susceptibility to hoof disorders between Fleckvieh and Braunvieh. The main reason for the problem is that the potential heterogeneity was explored through SNP–phenotype associations and not through causal mutations, due to a limited SNP density offered by the SNP-chip. The rationale against genetic heterogeneity comprises a limited power of detection of true associations as well as differences in the length of LD blocks and in linkage phase between breeds. On the other hand, different selection goals defined for the analyzed breeds accompanied by no systematic, genome-wide differences in LD structure between the breeds favor the heterogeneity hypothesis at some smaller genomic regions.
Introduction
Genetic heterogeneity denotes the situation when different genetic architectures underlying diverse populations result in the same phenotype. In human genetics, for decades, the concept of genetic heterogeneity has been considered and investigated using genome-wide association studies (GWAS) (Lander and Schork, 1994). One of the most well-known diseases characterized by high degree of genetic heterogeneity is the human autism spectrum disorder (An and Claudianos, 2016). Relatively recently, the concept of genetic heterogeneity has also been considered in the analysis of data from artificially selected plant and livestock species by Bérénos et al. (2015); de los Campos et al. (2015), and Lehermeier et al. (2015). In plants and livestock, an important source of genetic heterogeneity may be their complex population structure, which is typically composed of divergently selected breeds exhibiting high variation in allele frequencies and linkage disequilibrium (LD) patterns (de los Campos and Sorensen, 2014). In cattle, hoof disorders are novel traits represented by a group of different phenotypes varying from binary, directly assessed disease diagnoses, such as a sole ulcer, to composite traits scored on a categorical basis, e.g., a locomotion score. Due to their impact on welfare, productivity, and fertility (Heringstad et al., 2018), the traits rapidly gain importance in cattle breeding schemes. Technically, a common feature of this phenotypic group is a relatively poor definition of traits and lack of routine recording, resulting in a large number of relatively small datasets scattered across various populations. Those features not only cause low power of detection of significant gene (or SNP)–phenotype associations, resulting in a low reproducibility of results (Heringstad et al., 2018) but also imply a potential heterogeneity in the genetic determination of phenotypes due to differences in selection schemes. Underlying differences in LD and allele frequencies between populations cloud proof of potential heterogeneity (Veturi et al., 2019). In this study, we explore the genetic background underlying differences in the incidence of the number of hoof disorders between Austrian breeds Braunvieh and Fleckvieh cattle in the context of genetic heterogeneity of the breeds.
Materials and Methods
Dataset
The analyzed dataset was collected within the frame of the Efficient Cow project and comprised scores of hoof and leg disorders in Austrian 985 Braunvieh and 1999 Fleckvieh cows. In particular, the analyzed phenotype comprised the total number of hoof disorders scored by claw trimmers until the 100th day of lactation. The considered disorders comprised digital dermatitis, double sole, heel horn erosion, interdigital hyperplasia, sole hemorrhage, sole ulcer, and white line separation. In both breeds, the number of disorders varied between none and five, but the distributions differed. The fraction of diseased cows was higher in Fleckvieh (Figure 1). The cows were genotyped with the GeneSeek® Genomic ProfilerTM HD panel consisting of 76,934 SNPs. After quality control based on a minor allele frequency (<0.01) and a per-individual call rate (<99%), for further analysis, 74,762 SNPs remained.
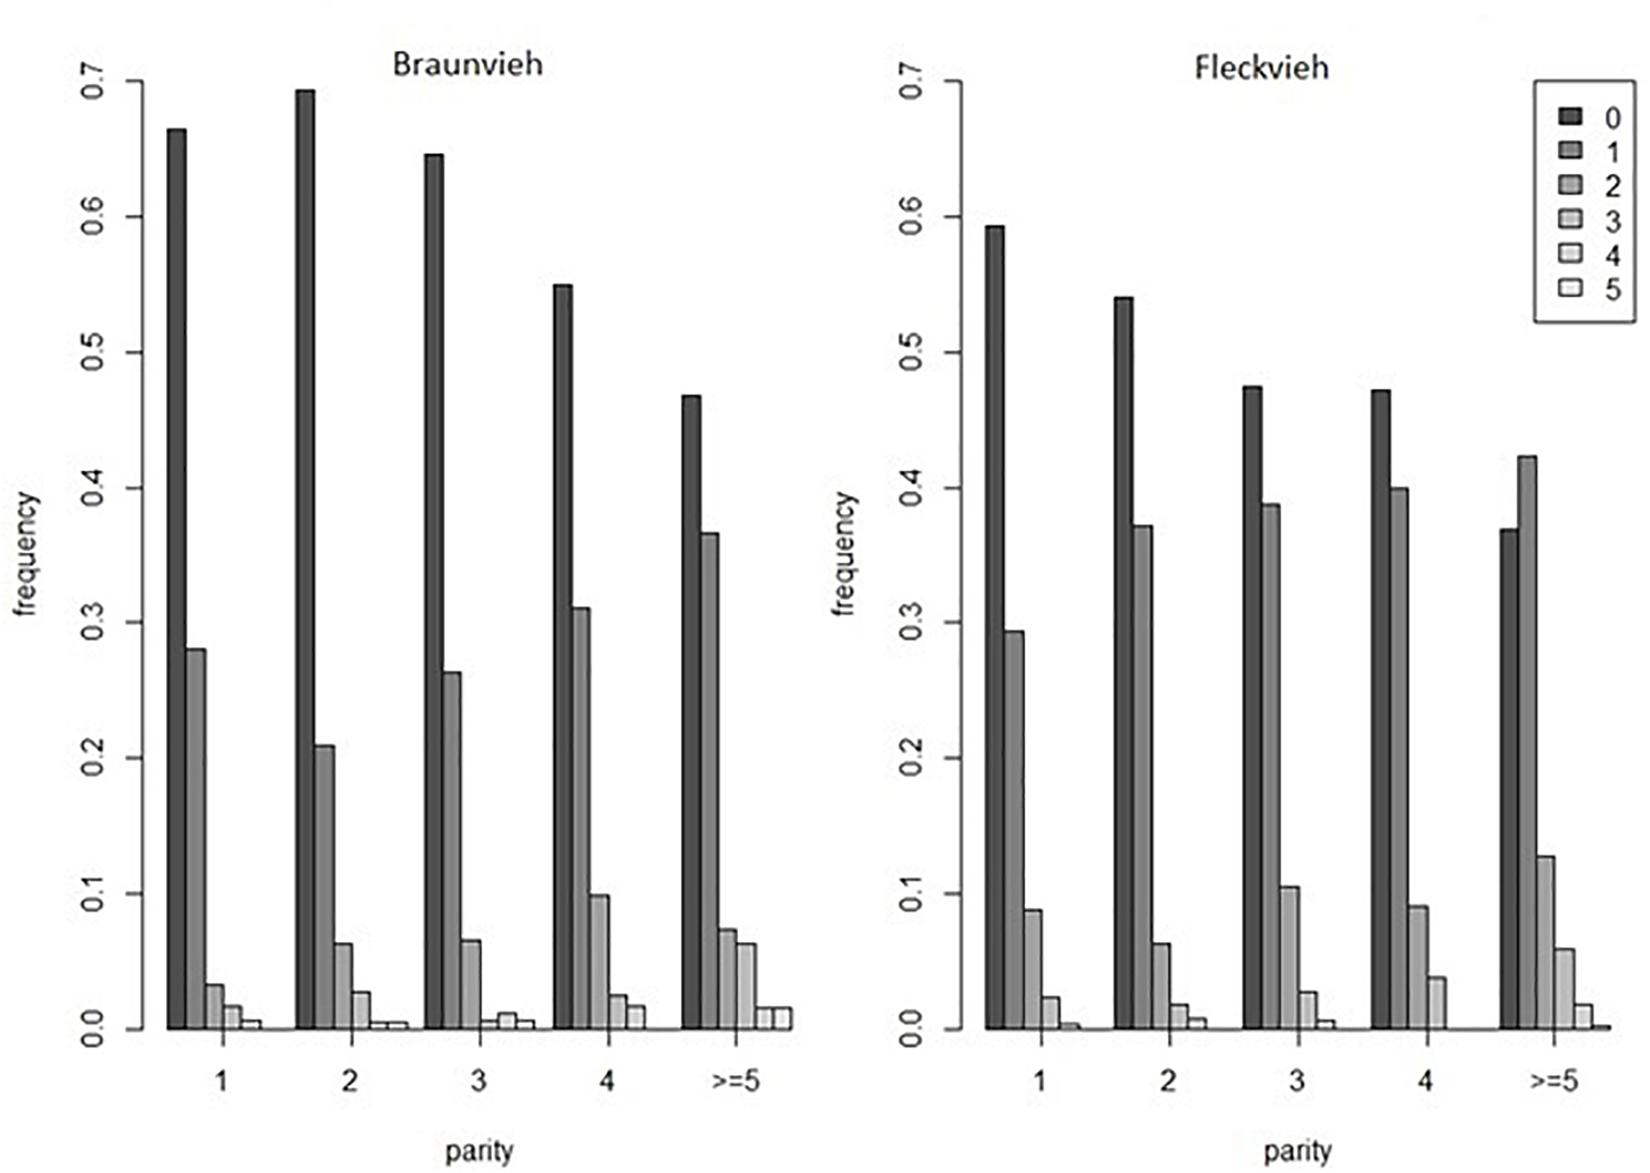
Figure 1. The distribution of the number of hoof disorders in Braunvieh and Fleckvieh.
GWAS and Functional Gene Annotation
The GWAS was performed separately for each breed by applying a single-SNP mixed linear model implemented in the GCTA software (Yang et al., 2011) with pseudophenotypes, expressed by cows’ breeding values, estimated by Suchocki et al. (2020):
where y is a vector of total number of hoof disorders scored until the 100th day of lactation; β is a vector of fixed effects comprising a general mean, breed, parity, calving year-season, percent of non-Holstein-Friesian genes, and a hoof status recording code; u is a random additive polygenic effect of a cow representing her breeding value; v is a random veterinarian effect; p is a random permanent environmental effect; and ε is a vector of random residuals. It was assumed that , ,, and , where A is an additive relationship matrix among individuals calculated based on pedigree; , , and are variances for additive polygenic, veterinarian, permanent environmental, and residual effects, respectively; and Iv, Ip, and Iε are identity matrices. Then, the single-SNP GWAS was based on the following model:
where u is a vector of breeding values estimated as shown above; μ is a general mean; b is a fixed additive effect of a single SNP; X is a corresponding design matrix coded as 0, 1, or 2 for a homozygous, heterozygous, and the other homozygous genotype respectively; is a random additive polygenic effect with the genomic covariance matrix between cows (G) calculated based on SNP genotypes (Yang et al., 2011); Z is an incidence matrix for g; and is a residual. The null hypothesis of b = 0 was tested using the Likelihood Ratio Test with the asymptotic large sample distribution (as implemented in the GCTA). The resulting nominal P-values were transformed into false discovery rates (FDRs) (Benjamini and Hochberg, 1995) to account for multiple testing. Functions of genes, which are marked by significant SNPs, were ascertained based on the following resources: the Mouse Genome Informatics phenotype database,1 the International Mouse Phenotyping Consortium database,2 the Zebrafish Information Network database,3 the human Rare Diseases and Orphan Drugs database,4 and the Deciphering Developmental Disorders database,5 accessed through the Ensembl.
Analysis of Allelic Heterogeneity
For each non-overlapping window of 50 neighboring SNPs, genomic relationship matrices between cows were calculated, which were then decomposed into principal components, using the PCA subroutine implemented in the GCTA (Price et al., 2006). Further on, for each of the windows, differences between the breeds in a 10-dimensional space defined by the first 10 eigenvectors (ε1,ε2,…,ε10) were quantified using the Mahalanobis distance: , with containing differences between averaged eigenvectors for Braunvieh (subscript B) and Fleckvieh (subscript F) and V representing the pooled covariance matrix of ε1 and ε2. The Hotelling test: was used to test the null hypothesis of no differences between Braunvieh and Fleckvieh, where nx is the number of cows representing breed x (Goodpaster and Kennedy, 2011). In order to account for multiple testing, the resulting nominal P-values were transformed into FDRs.
The allelic heterogeneity between breeds was tested by calculating the ratio of minor allele frequencies in Fleckvieh (MAFF) and Braunvieh (MAFB) at significant SNP positions. For hypotheses testing, the natural logarithm of the ratio was used: .
Analysis of Local LD Patterns
Differences in LD patterns between breeds were assessed based on the comparison of LD matrices constructed for non-overlapping windows of 50 neighboring SNPs. LD between the pairs of linked SNPs was quantified using Beagle 4.1 (Browning and Browning, 2016), separately for each breed, by the r2 coefficient given by , with pij corresponding to the frequency of a two-SNP haplotype i,j ∈ {11,12,21,22}, and p1. and p.1 representing the frequency of an alternative allele respectively for the 1st and the 2nd SNP (VanLiere and Rosenberg, 2008). Eigenvectors, which correspond to these LD matrices, were computed separately for each breed. Inter-breed differences in local LD were then quantified by:
where vijk corresponds the i-th element of the 1st principal component vector calculated as the product of the LD matrix of the j-th breed (subscript B for BSW or F for FLV) and the 1st eigenvector of the k-th breed. Following Garcia (2012), S quantifies differences in the variability of LD between two populations. Furthermore, the genome-wide pattern of LD decay with physical distance between pairwise SNPs was binned into nine intervals (0–25, 25–50, 50–75, 75–120, 120–200, 200–500, 500–1500, 1500–3000, and 3000–5000 kbp).
Results
Heterogeneity in Association Signals
Adapting the FDR threshold of 10%, despite potentially higher power of testing due to twice as large sample size, none of the SNPs was significantly associated with the number of hoof disorders in Fleckvieh, while 15 SNPs were significant in Braunvieh (Figure 2). One of the three significant SNPs from BTA1 is located 285,955 bp upstream of CBLB gene, known to cause arthritis in rats. The same SNP is located within a region of a QTL for hindquarter proportions. The two most significant SNPs were located on BTA4. Both were intergenic, but their closest downstream gene encodes caveolin 2 protein, which in the mouse is known to effect skeletal muscles. A SNP on BTA5 falls within four QTL regions responsible for rump conformation traits. One of the most interesting significant annotations points out at another SNP on BTA5, which is located 76,362 bp downstream of PTHLH. In humans and mice, this gene causes multiple disease phenotypes related to the skeleton. In zebrafish, mutations of this gene result in decreased bone mineralization, in humans—in brachydactyly as well as in numerous bone and calcium related disease phenotypes in the mouse including decreased length of long bones, premature bone ossification, and increased osteocyte apoptosis. Another interesting significant annotation points out at the intron of SORCS2 gene on BTA6, which was assigned to decreased susceptibility to injury in the mouse. The effect on muscles, albeit in zebrafish, was assigned to the protein encoded by PIP4K2A, which is located close to the significant SNP on BTA13. The same SNP is also located within a QTL region for rump angle. On BTA16, a significant association points out at ENSBTAG00000009943 involved in inflammatory response. Significant SNPs are summarized in Table 1 except a SNP on BTA6, which could not be placed on the current reference assembly (ARS-UCD1.2).
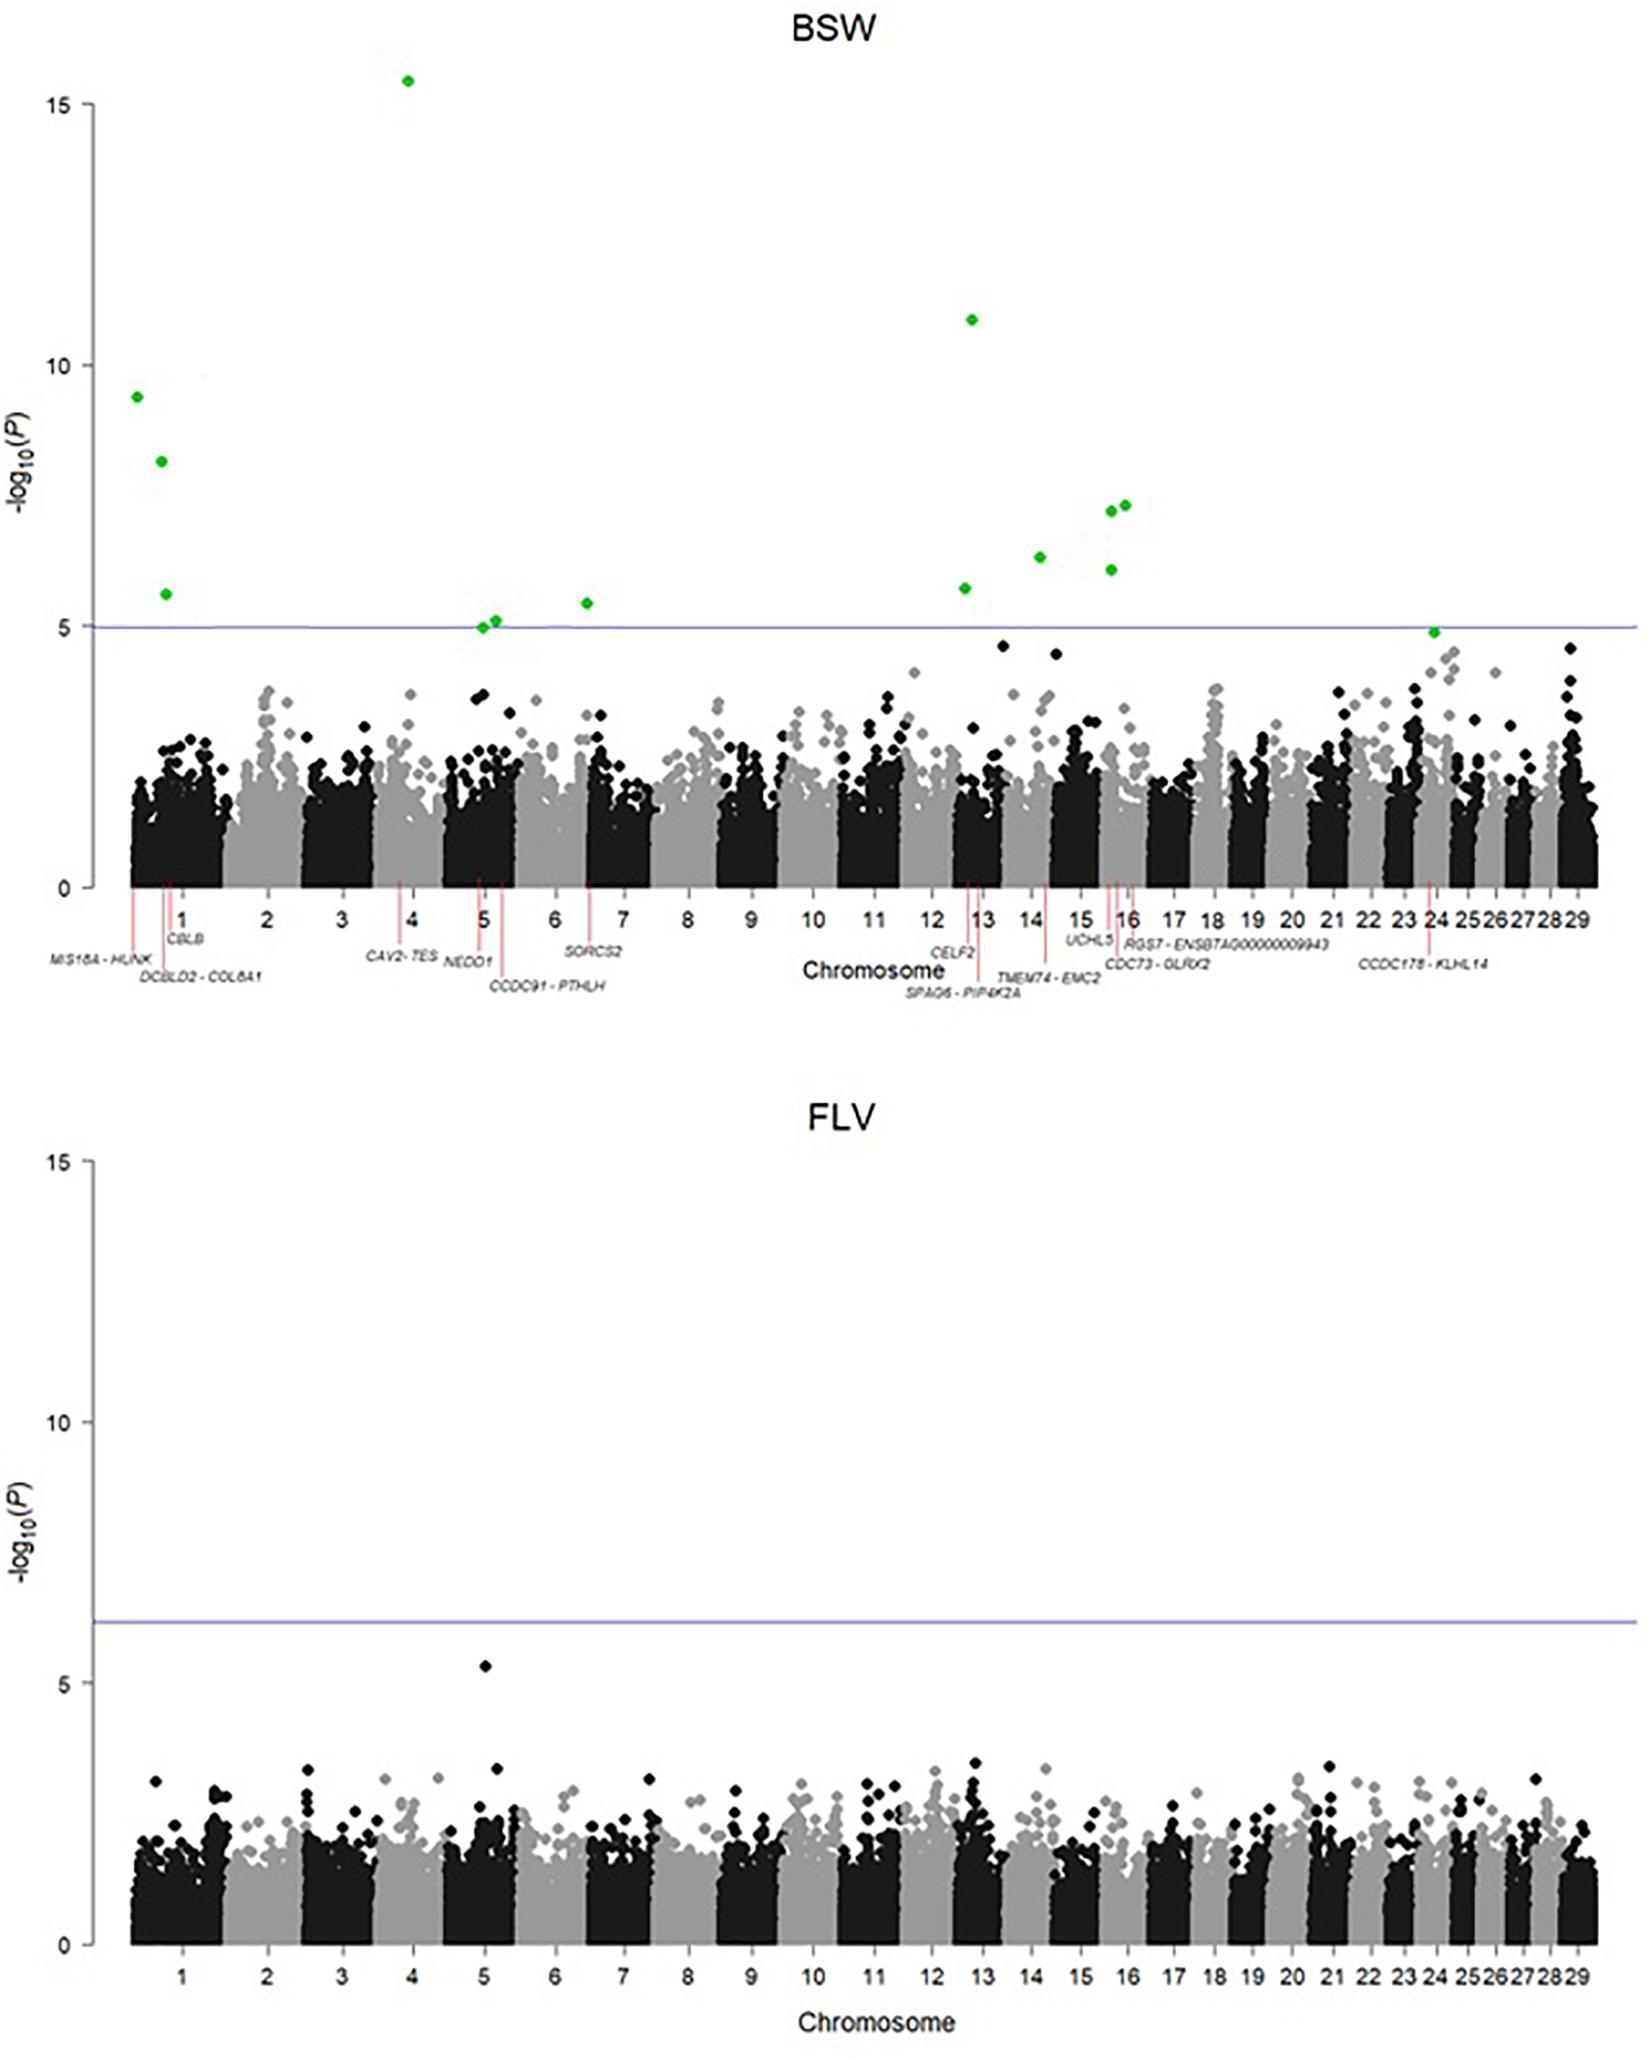
Figure 2. Manhattan plots for the incidence of hoof disorders in Braunvieh and Fleckvieh. The horizontal line corresponds to an FDR of 10%. The significant SNPs were highlighted in green.
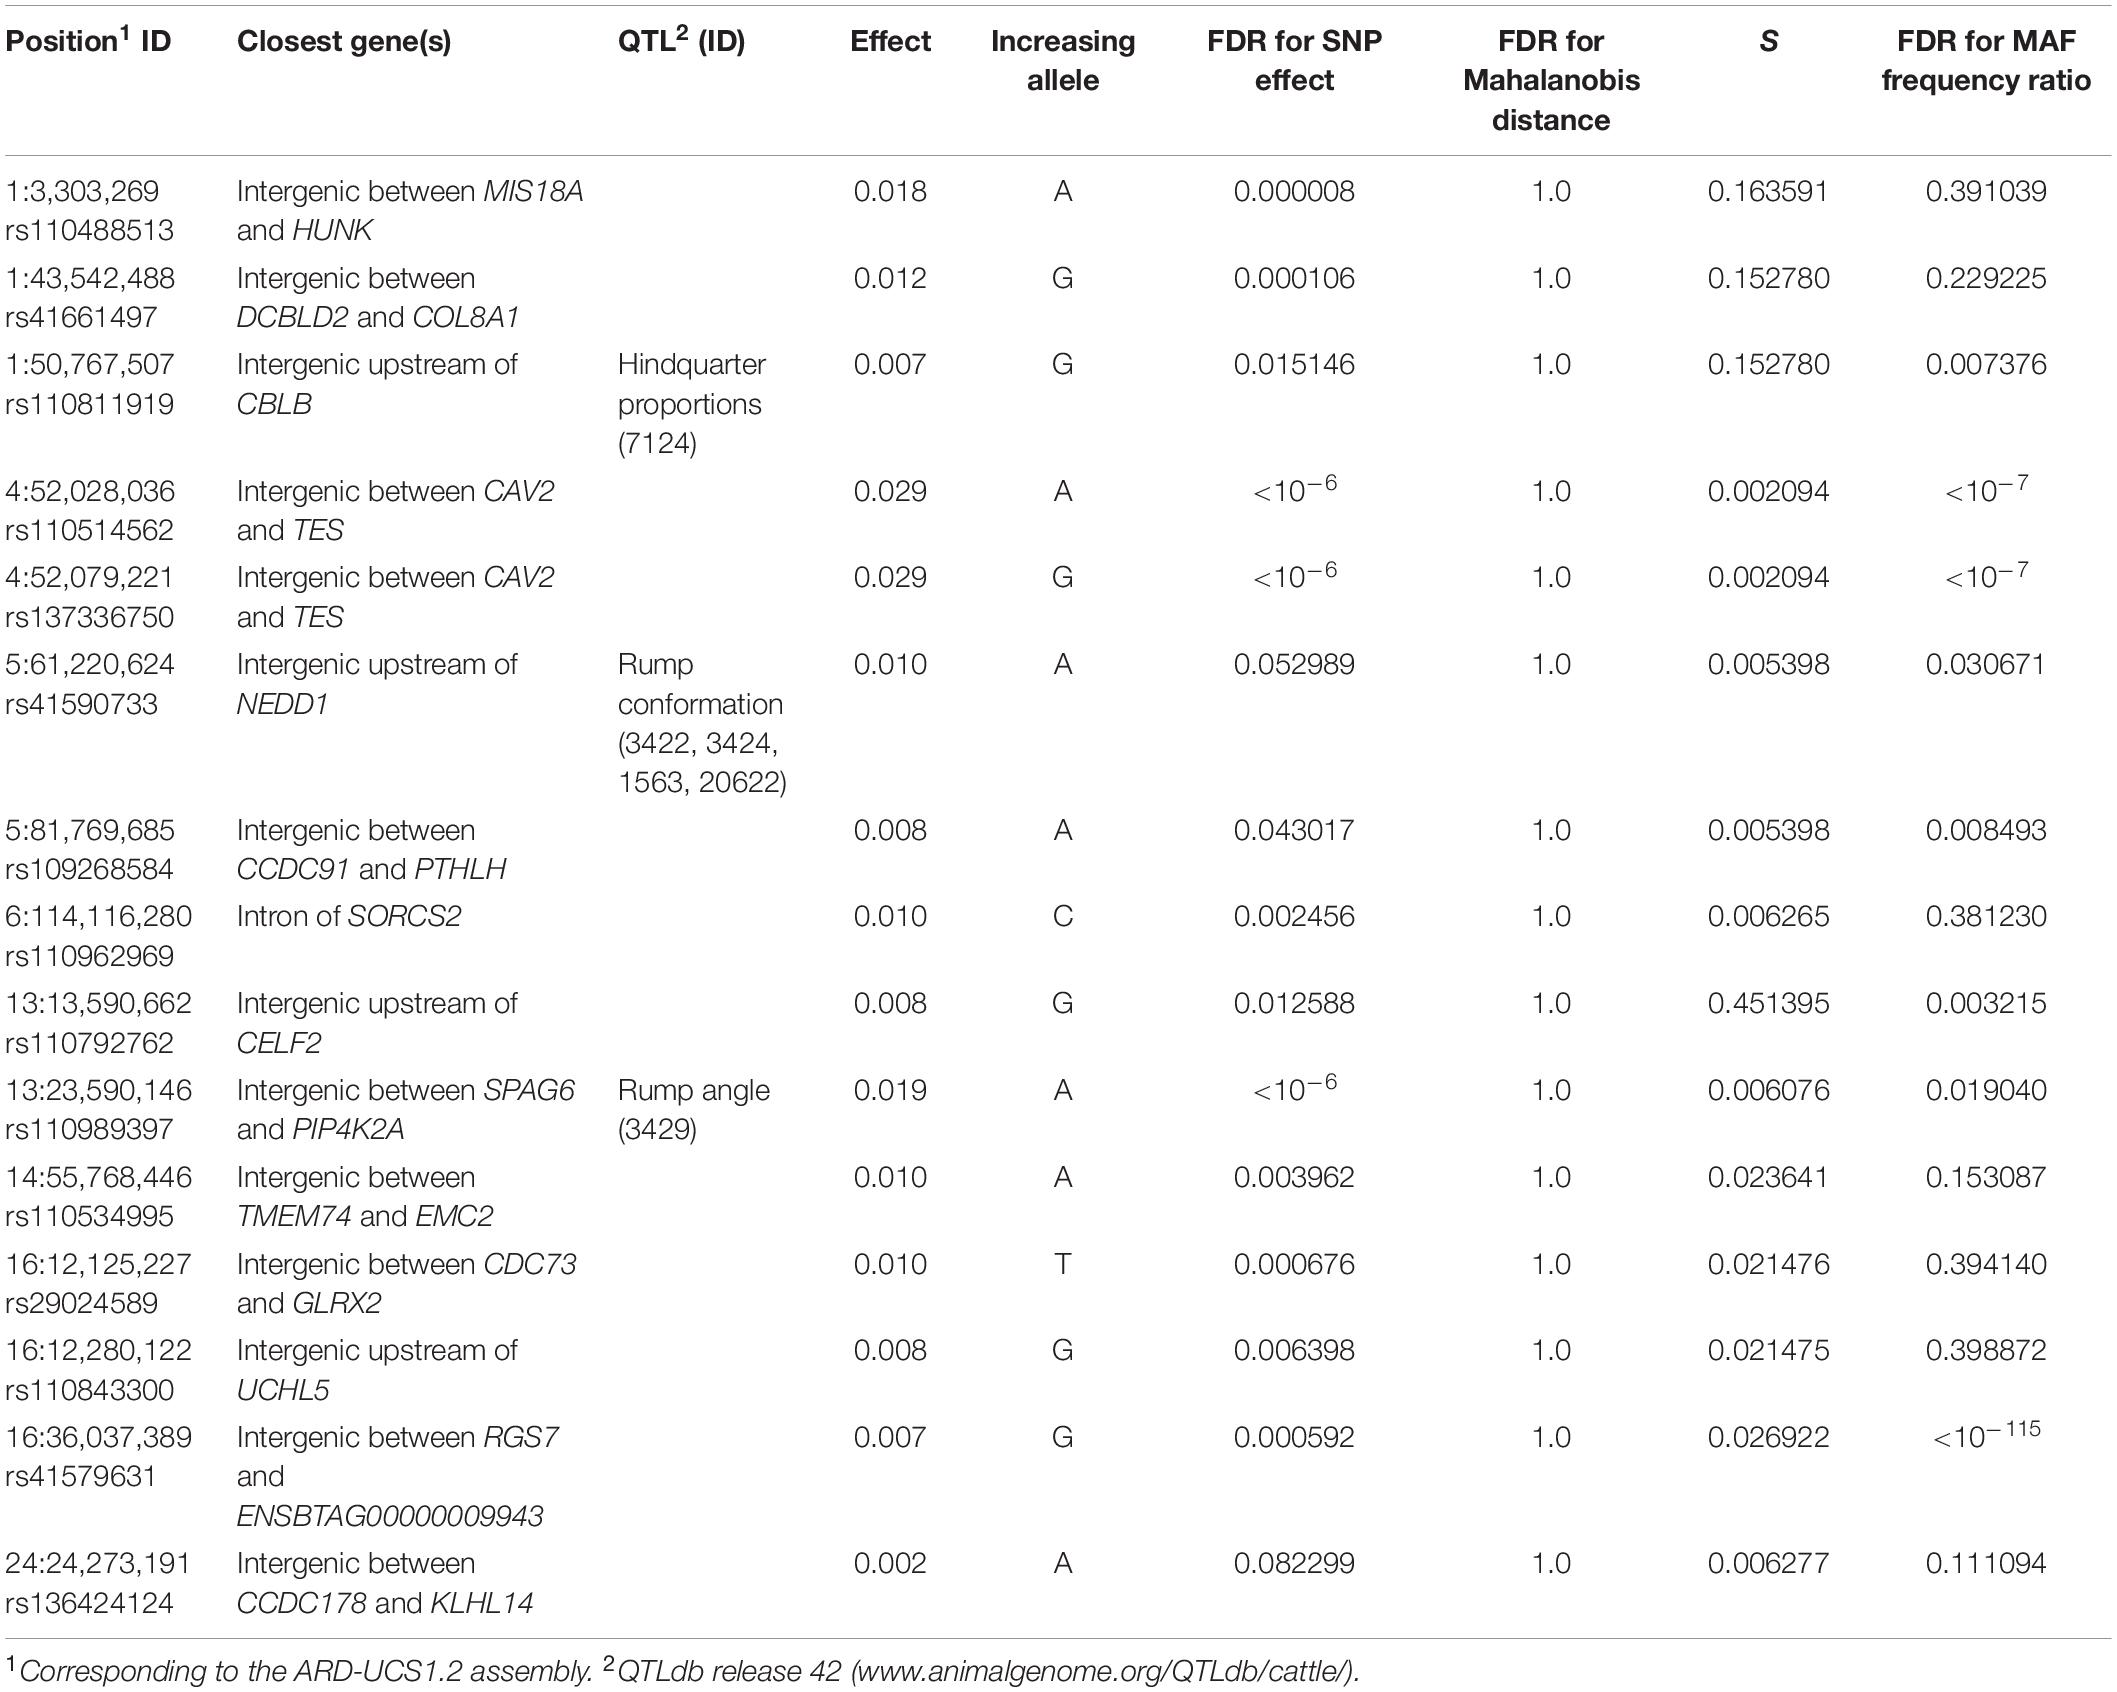
Table 1. SNPs significant in BSW, based on FDR ≤ 0.10.
There was no correlation between P-values observed for SNPs in FLV and BSW, which was estimated to 0.00302 for all SNPs and −0.01494 (−0.08065) for SNPs with 100 smallest P-values in BSW (FLV). In addition, breed-specific SNP effect estimates also revealed a very low correlation of 0.02363.
Heterogeneity in Genetic Structure
Significance of the Mahalanobis distances (expressing differences in SNP genotype variability between breeds) and values of the S statistic (expressing differences in the LD decay pattern between breeds) were visualized in Figure 3. For the Mahalanobis distance, all FDR values at the significant SNP locations are equal to 1, indicating that it was not possible to differentiate between breeds based on SNP genotypes corresponding to the 50-SNP windows. A somewhat different picture emerged when the local inter-breed differences in LD decay were considered. In some, but not all, of the regions, significant SNPs correspond to windows for which a difference in LD structure was indicated by high values of the S statistics—rs110488513 and rs41661497 on BTA1 as well as rs110792762 on BTA13. Some other significant SNPs are located in windows adjacent to such windows—rs110811919 on BTA1, as well as rs29024589, rs110843300, and rs41579631 on BTA16. For eight significant SNPs (rs29024589 on BTA1, both SNPs on BTA4, both SNPs on BTA5, both SNPs on BTA13, and rs41579631 on BTA16), significant allelic heterogeneity was detected (Table 1).
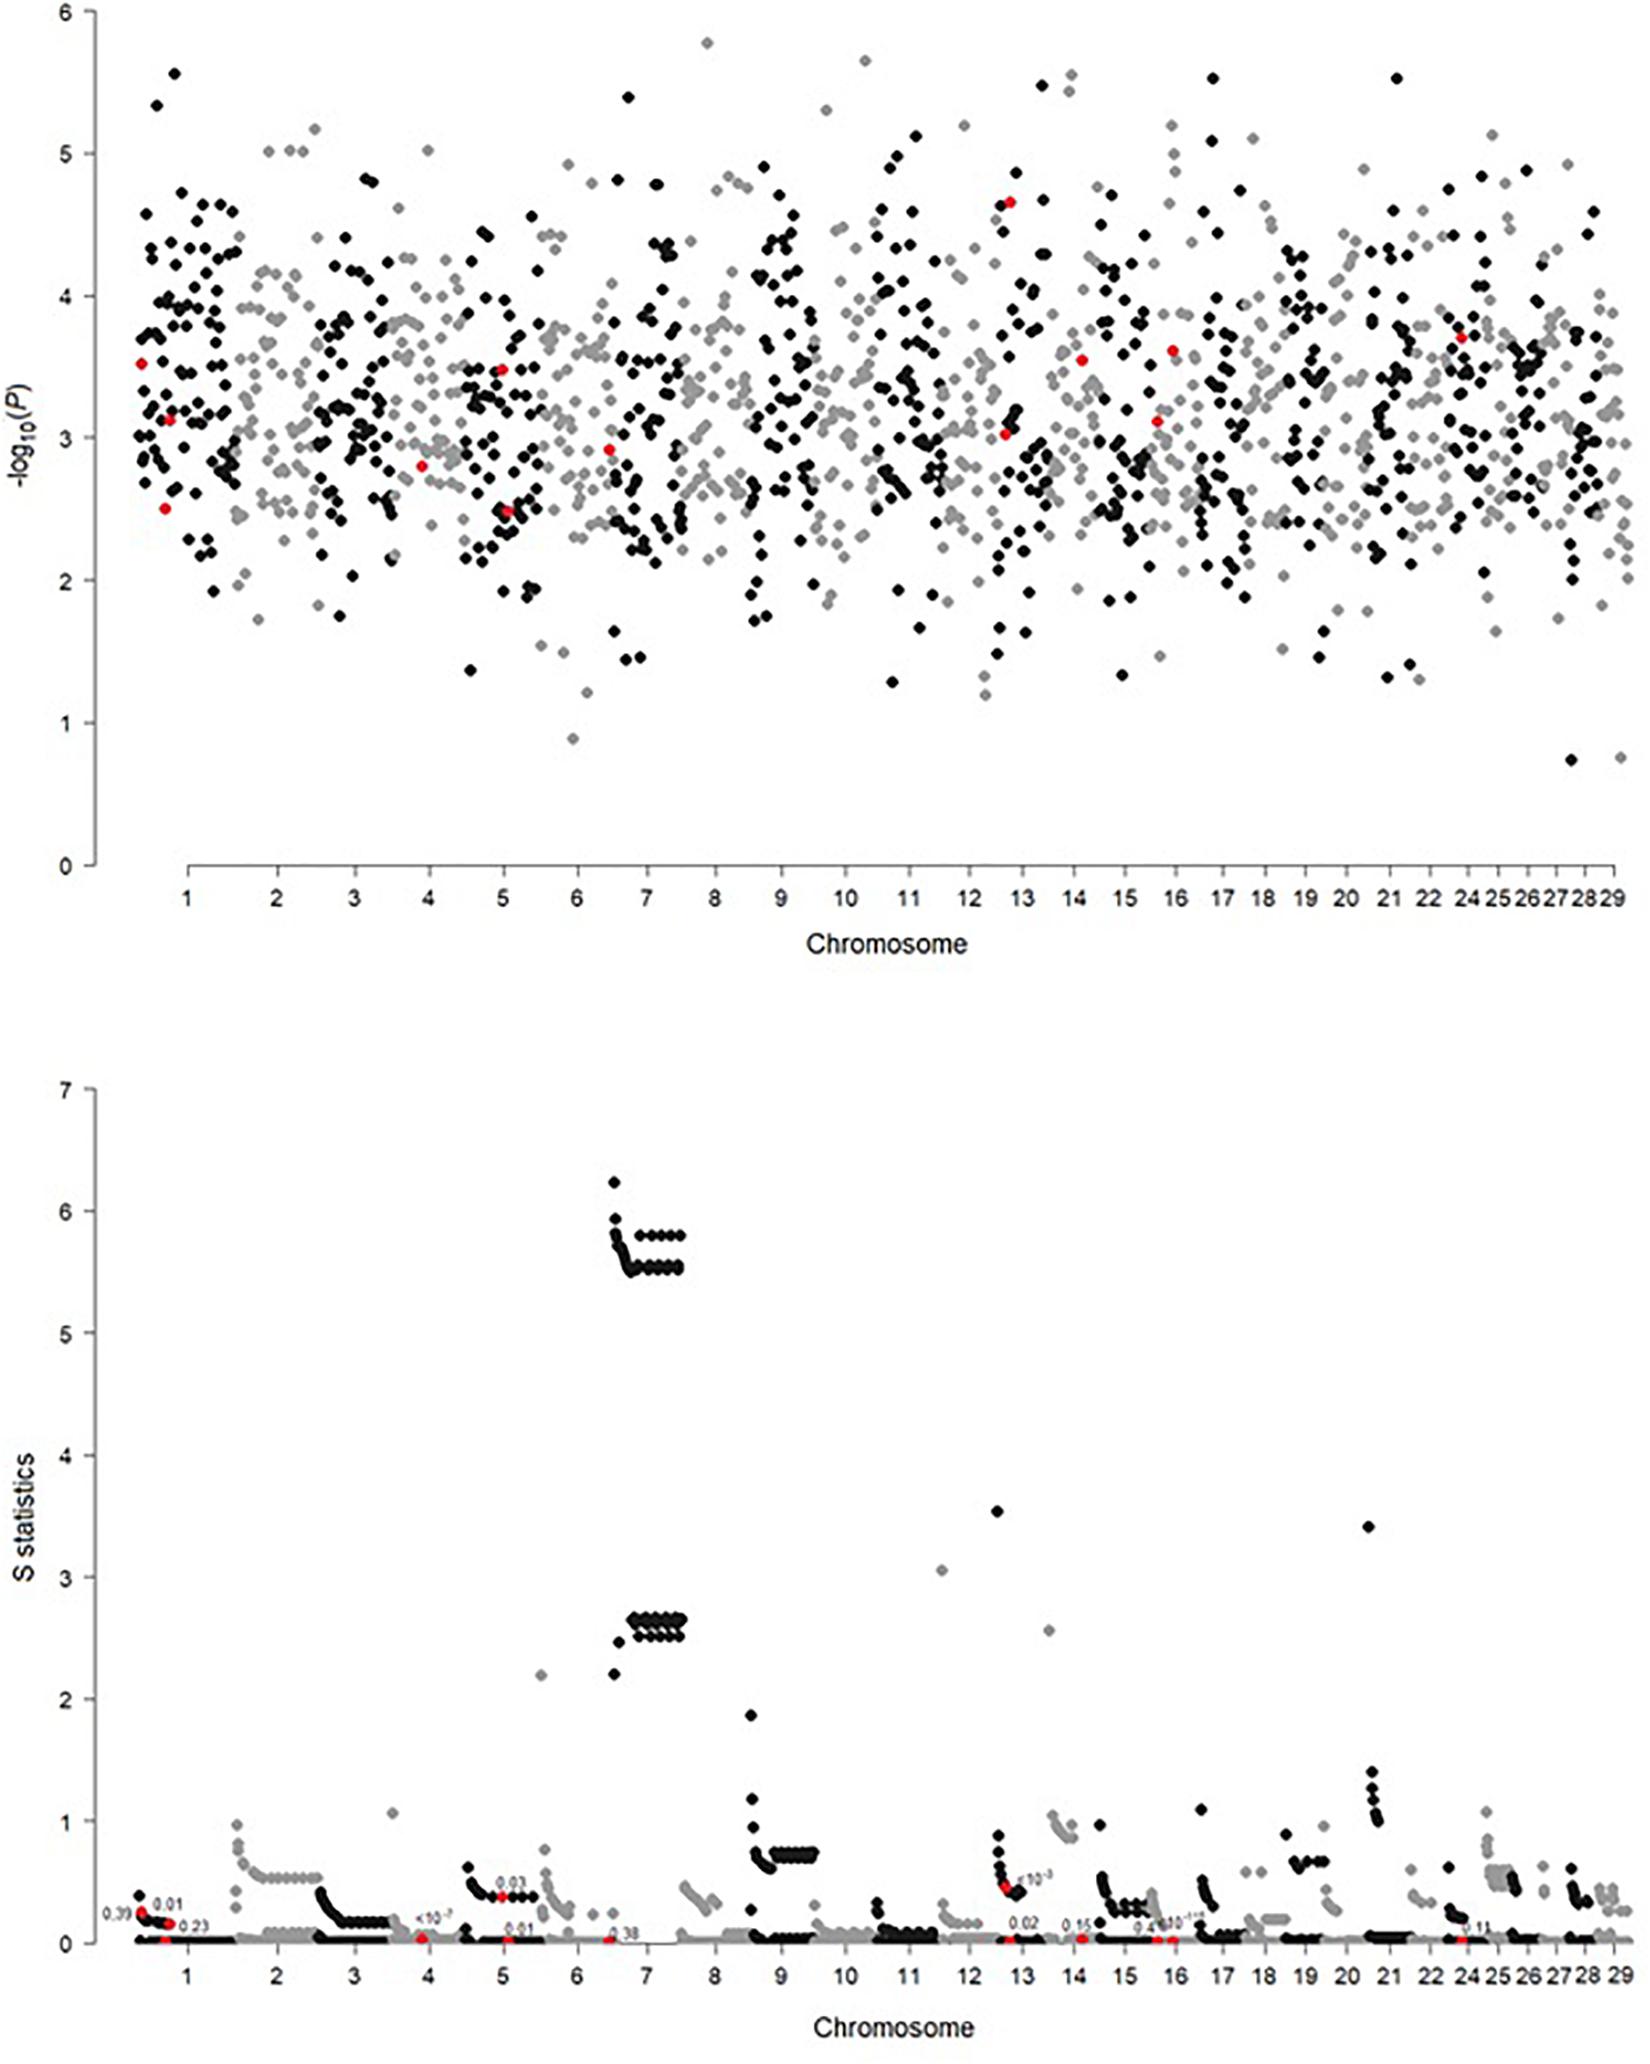
Figure 3. Genome-wide comparison of genetic heterogeneity expressed by significance of the Mahalanobis distance and the S statistic along the windows composed of 50 neighboring SNPs. Each point marked in red indicates a window containing the SNP significant in GWAS.
Discussion
Summarizing the obtained results, in general, heterogeneity on a genome-wide level between breeds was observed; however, it does not explain the differences in GWAS results. Inter-breed differences in SNP effect significance at some of the 15 positions can be explained by inter-breed differences in LD structure (BTA1, BTA5, BTA13, and BTA16) indicated by high values of the S statistics and/or by significant allelic heterogeneity (BTA1, BTA4, BTA5, BTA13, and BTA16). Polymorphisms on BTA6 (marking SORCS2), BTA14 (marking TMEM74 and EMC2), and BTA24 (marking CCDC178 and KLHL14) are good candidates for Braunvieh-specific associations. Although the number of published studies related to GWAS for hoof disorders is very limited, their common feature is the lack of overlap in significant results both between and even within the studies. Similarly to our study, Wu et al. (2016) applied the same GWAS model to feet and leg disorders in three breeds and, depending on breed, identified different significant regions between Danish Red and Danish Holstein, while no significance was observed in Jersey. In addition, earlier, van der Spek et al. (2015) found a very low overlap in significance while analyzing a cow dataset and a bull dataset ascertained from the same population of Holstein-Friesian cattle, with only three SNPs in bulls overlapped with 94 SNPs significant for claw disorders in cows. Vargas et al. (2018) found no overlap between significant regions defined for binary and categorical feet and leg classification scores in Nelore breed. In humans, Coram et al. (2013) reported a similar result regarding loci determining concentration of lipids in blood, where many differences between populations were due to allele frequencies at the candidate SNPs. In our study, we also observed no overlap in significance between Braunvieh and Fleckvieh. The potential basis of this phenomenon is either of a statistical nature—type I/type II errors due to limited sample size, or of a genetic nature—genetic heterogeneity in the susceptibility to hoof diseases between breeds. Exploring the statistical perspective, recently, Suchocki et al. (2020) reported the results of GWAS using a multi-SNP model for the same dataset. For total number of hoof disorders, they found only two significant polymorphisms located on chromosomes 7 and 14. The positions of significant SNPs do not correspond with those detected using the single-SNP model from our study. Different results between single- and multi-SNP models suggested that each approach is capable of uncovering a different subset of QTL. The recommended solution for such situation is a meta-analysis, which allows for taking into account all former results for a given group of traits.
From the genetic perspective, Coram et al. (2013) pointed out at the presence of population-specific significant loci, which, as in our study, can be explained by population-specific selection pressure. Another postulated cause of heterogeneity [see, e.g., An and Claudianos (2016) for their discussion on autism disorder] pointed out at different causal mutations within the common metabolic pathways. Similarly, Wu et al. (2016) in the context of hoof and leg disorders in cattle hypothesized that the breed-specific significance hits represent relatively novel mutations, which occurred after breed separation. The third cause of heterogeneity is differences in genetic architecture between breeds, which are manifested by genome-wide (Figure 4) or local differences in LD, which were detected in our study within some of the regions harboring SNPs significant in Braunvieh. Differences in LD patterns were considered in the context of heterogeneity detected between human populations (Vargas et al., 2018).
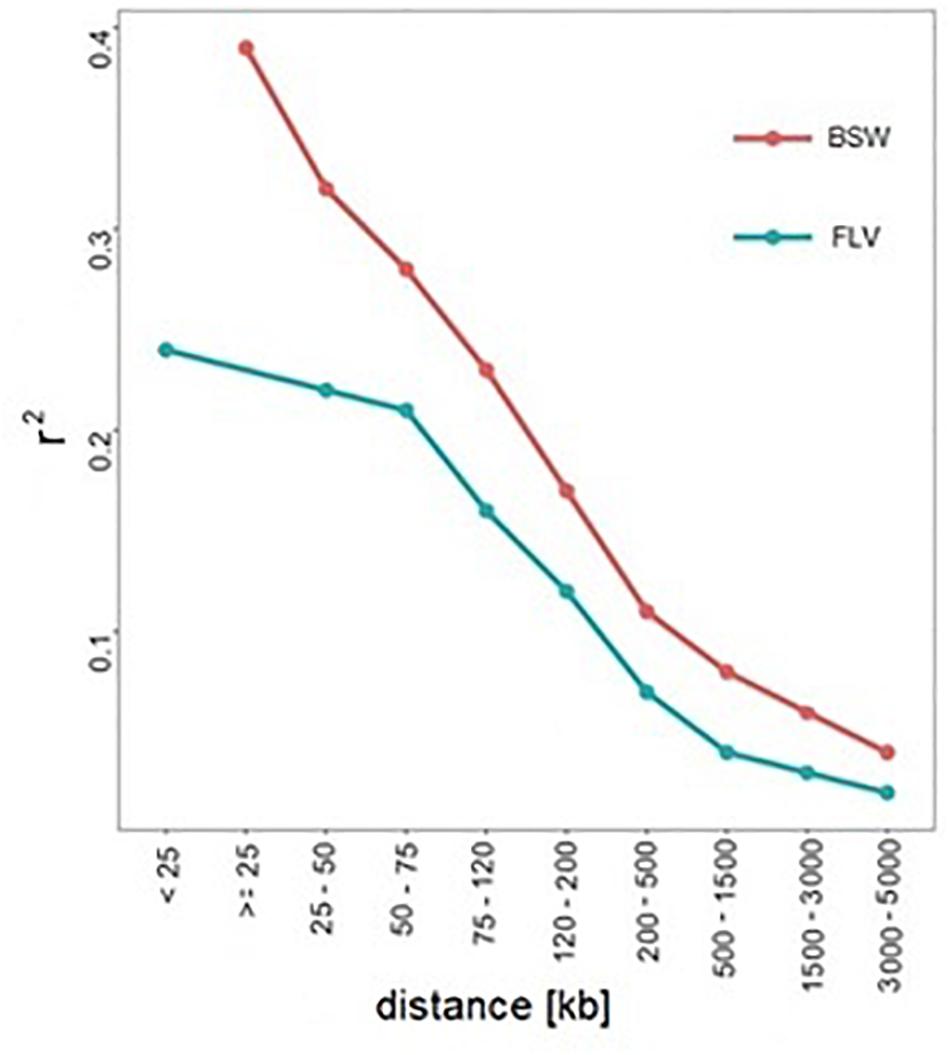
Figure 4. Genome-wide LD decay (represented by r2) in Braunvieh and Fleckvieh.
Conclusion
Based on the current dataset, it is not possible to unequivocally confirm/exclude the hypothesis of genetic heterogeneity in the susceptibility to hoof disorders between Fleckvieh and Braunvieh. The rationales against the hypothesis comprise the following: (i) limited power of detection of true associations if the effect size is not large and therefore high rate of spurious associations among detected SNP; (ii) differences in the length of LD blocks, which imply differences in power of detecting the associations; and (iii) differences in linkage phase between breeds, which may hamper the detection of causal sites in Fleckvieh or Braunvieh, based on the available SNP panel. On the other hand, (i) different selection goals defined for the breeds—toward dairy production in the case of Braunvieh and toward beef production in the case of Fleckvieh, (ii) no significant allelic heterogeneity, and (iii) no systematic differences in LD structure between the breeds remain in favor of the heterogeneity hypothesis at the significant sites on BTA6, BTA14, and BTA24.
The dataset available for the analysis comprises only common SNPs selected for a commercial microarray, so that we can explore only associations and not the causal mutations; therefore, a final verification of the above hypothesis would require a higher resolution of genomic data. However, if the total number of hoof disorders is genetically a different trait in Braunvieh and in Fleckvieh, this should be taken into account in selection strategies and in genomic evaluation programs.
Data Availability Statement
The data analyzed in this study is subject to the following licenses/restrictions: The datasets analyzed for this study are available from the ZuchtData EDV-Dienstleistungen GmbH upon request. Requests to access these datasets should be directed toZWdnZXItZGFubmVyQHp1Y2h0ZGF0YS5hdA==.
Author Contributions
BK-S edited data and performed GWAS and heterogeneity analysis. TS edited data and performed some statistical analyses. CE-D contributed to writing of the manuscript. HS edited raw data and contributed to writing of the manuscript. MF calculated pairwise linkage disequilibrium. JS provided the funding and concept of the study, performed some statistical analyses, and significantly contributed to writing of the manuscript. All authors read and approved the final manuscript.
Funding
The research was supported by the Polish National Science Centre (NCN) grant no. 2015/19/B/NZ9/03725. Dataset was generated within the frame of the “Efficient Cow” project funded by the Austrian Federal Ministry of Agriculture, Forestry, Environment and Water Management; the Federations of Austrian Fleckvieh, Brown-Swiss, and Holstein; the Federation of Austrian Cattle Breeders; and the Federal States of Austria. Genotyping was funded by the GENE2FARM project funded by FP7-KBBE (grant no. 289592).
Conflict of Interest
CE-D and HS were employed by the company ZuchtData EDV-Dienstleistungen GmbH.
The remaining authors declare that the research was conducted in the absence of any commercial or financial relationships that could be construed as a potential conflict of interest.
Acknowledgments
Computations were carried out at the Poznan Supercomputing and Networking Centre. This manuscript has been released as a pre-print at bioRxiv (Kosinska-Selbi et al., 2020).
Footnotes
- ^ www.informatics.jax.org
- ^ www.mousephenotype.org
- ^ zfin.org
- ^ www.orpha.net
- ^ decipher.sanger.ac.uk
References
An, J. Y., and Claudianos, C. (2016). Genetic heterogeneity in autism: from single gene to a pathway perspective. Neurosci. Biobehav. Rev. 68, 442–453. doi: 10.1016/j.neubiorev.2016.06.013
Benjamini, Y., and Hochberg, Y. (1995). Controlling the false discovery rate: a practical and powerful approach to multiple testing. J. R. Stat. Soc. Ser. B 57, 449–518.
Bérénos, C., Ellis, P. A., Pilkington, J. G., Lee, S. H., Gratten, J., and Pemberton, J. M. (2015). Heterogeneity of genetic architecture of body size traits in a free-living population. Mol. Ecol. 24, 1810–1830. doi: 10.1111/mec.13146
Browning, B. L., and Browning, S. R. (2016). Genotype imputation with millions of reference samples. Am. J. Hum. Genet. 98, 116–126. doi: 10.1016/j.ajhg.2015.11.020
Coram, M. A., Duan, Q., Hoffmann, T. J., Thornton, T., Knowles, J. W., Johnson, N. A., et al. (2013). Genome-wide characterization of shared and distinct genetic components that influence blood lipid levels in ethnically diverse human populations. Am. J. Hum. Genet. 92, 904–916. doi: 10.1016/j.ajhg.2013.04.025
de los Campos, G., and Sorensen, D. (2014). On the genomic analysis of data from structured populations. J. Anim. Breed. Genet. 131, 163–164. doi: 10.1111/jbg.12091
de los Campos, G., Veturi, Y., Vazquez, A. I, Lehermeier, C., and Pérez-Rodríguez, P. (2015). Incorporating genetic heterogeneity in whole-genome regressions using interactions. J. Agric. Biol. Environ. Stat. 20, 467–490. doi: 10.1007/s13253-015-0222-5
Garcia, C. (2012). A simple procedure for the comparison of covariance matrices. BMC Evol. Biol. 12:222. doi: 10.1186/1471-2148-12-222
Goodpaster, A. M., and Kennedy, M. A. (2011). Quantification and statistical significance analysis of group separation in NMR-based metabonomics studies. Chemometr. Intell. Lab Syst. 109, 162–170. doi: 10.1016/j.chemolab.2011.08.009
Heringstad, B., Egger-Danner, C., Charfeddine, N., Pryce, J. E., Stock, K. F., Kofler, J., et al. (2018). Invited review: genetics and claw health: opportunities to enhance claw health by genetic selection. J. Dairy Sci. 10, 4801–4821. doi: 10.3168/jds.2017-13531
Kosinska-Selbi, B., Suchocki, T., Egger-Danner, Ch, Schwarzenbacher, H., Fraszczak, M., and Szyda, J. (2020). Exploring the potential genetic heterogeneity in the incidence of hoof and leg disorders in Austrian Fleckvieh and Braunvieh cattle. bioRxiv [Preprint]. doi: 10.1101/2020.01.11.902767
Lander, E. S., and Schork, N. J. (1994). Genetic dissection of complex traits. Science 265, 2037–2048.
Lehermeier, C., Schön, C. C., and de Los Campos, G. (2015). Assessment of genetic heterogeneity in structured plant populations using multivariate whole-genome regression models. Genetics 201, 323–337. doi: 10.1534/genetics.115.177394
Price, A. L., Patterson, N. J., Plenge, R. M., Weinblatt, M. E., Shadick, N. A., and Reich, D. (2006). Principal components analysis corrects for stratification in genome-wide association studies. Nat. Genet. 38, 904–909. doi: 10.1038/ng1847
Suchocki, T., Egger-Danner, C., Schwarzenbacher, H., and Szyda, J. (2020). Two-stage GWAS for the identification of causal variants underlying hoof disorders in cattle. J. Dairy Sci. 103, 4483–4494. doi: 10.3168/jds.2019-17542
van der Spek, D., van Arendonk, J. A., and Bovenhuis, H. (2015). Genome-wide association study for claw disorders and trimming status in dairy cattle. J. Dairy Sci. 98, 1286–1295. doi: 10.3168/jds.2014-8302
VanLiere, J. M., and Rosenberg, N. A. (2008). Mathematical properties of the r2 measure of linkage disequilibrium. Theor. Popul. Biol. 74, 130–137. doi: 10.1016/j.tpb.2008.05.006
Vargas, G., Neves, H. H. R., Camargo, G. M. F., Cardoso, V., Munari, D. P., and Carvalheiro, R. (2018). Genome-wide association study and functional analysis of feet and leg conformation traits in Nellore cattle. J. Anim. Sci. 96, 1617–1627. doi: 10.1093/jas/sky079
Veturi, Y., de Los Campos, G., Yi, N., Huang, W., Vazquez, A. I., and Kühnel, B. (2019). Modeling heterogeneity in the genetic architecture of ethnically diverse groups using random effect interaction models. Genetics 211, 1395–1407. doi: 10.1534/genetics.119.301909
Wu, X., Guldbrandtsen, B., Lund, M. S., and Sahana, G. (2016). Association analysis for feet and legs disorders with whole-genome sequence variants in 3 dairy cattle breeds. J. Dairy Sci. 99, 7221–7231. doi: 10.3168/jds.2015-10705
Keywords: Braunvieh, Fleckvieh, genetic heterogeneity, GWAS, health traits, linkage disequilibrium, principal components
Citation: Kosińska-Selbi B, Suchocki T, Egger-Danner C, Schwarzenbacher H, Frąszczak M and Szyda J (2020) Exploring the Potential Genetic Heterogeneity in the Incidence of Hoof Disorders in Austrian Fleckvieh and Braunvieh Cattle. Front. Genet. 11:577116. doi: 10.3389/fgene.2020.577116
Received: 28 June 2020; Accepted: 21 October 2020;
Published: 17 November 2020.
Edited by:
Jiuzhou Song, University of Maryland, College Park, United StatesReviewed by:
Lingyang Xu, Institute of Animal Sciences (CAS), ChinaXianyong Lan, Northwest A&F University, China
Copyright © 2020 Kosińska-Selbi, Suchocki, Egger-Danner, Schwarzenbacher, Frąszczak and Szyda. This is an open-access article distributed under the terms of the Creative Commons Attribution License (CC BY). The use, distribution or reproduction in other forums is permitted, provided the original author(s) and the copyright owner(s) are credited and that the original publication in this journal is cited, in accordance with accepted academic practice. No use, distribution or reproduction is permitted which does not comply with these terms.
*Correspondence: Joanna Szyda, am9hbm5hLnN6eWRhQHVwd3IuZWR1LnBs; anN6eWRhQGdtYWlsLmNvbQ==