- Institute of Interdisciplinary Integrative Medicine Research, Shanghai University of Traditional Chinese Medicine, Shanghai, China
The causal mechanism of Alzheimer's disease is extremely complex. Achieving great statistical power in association studies usually requires a large number of samples. In this work, we illustrated a different strategy to identify AD risk genes by clustering AD patients into modules based on their single-patient differential expression signatures. The evaluation suggested that our method could enrich AD patients with similar clinical manifestations. Applying this to a cohort of only 310 AD patients, we identified 174 AD risk loci at a strict threshold of empirical p < 0.05, while only two loci were identified using all the AD patients. As an evaluation, we collected 23 AD risk genes reported in a recent large-scale meta-analysis and found that 18 of them were rediscovered by association studies using clustered AD patients, while only three of them were rediscovered using all AD patients. Functional annotation suggested that AD-associated genetic variants mainly disturbed neuronal/synaptic function. Our results suggested module analysis helped to enrich AD patients affected by the common risk variants.
1. Introduction
Alzheimer's disease is a prevalent neurological disease among the aging population. Even with decades of intensive studies, its causal mechanisms remain elusive. Studies of the familial early-onset cases revealed three mutated genes, including APP, PSEN1, and PSEN2 (Lanoiselée et al., 2017). They provided valuable insights into the contribution of the amyloidogenic pathway for AD genesis. Genome-wide association studies (GWAS) of late-onset AD patients discovered more risk genes. Among them, APOE ε4, an apolipoprotein, is a major genetic risk of late-onset AD. It accounts for 3- (heterozygous) to 15-fold (homozygous) increase in AD risk (De Jager et al., 2012). The AlzGene database (http://www.alzgene.org) stores these AD risk genes. Even though many AD risk genes have been discovered, known genes only explain a small proportion of heritability. There is still a great challenge on how to illustrate the AD causal mechanism in an integrated way, limiting their application in drug discovery.
Power is a critical consideration in association studies (Ball, 2013). AD often requires a large sample size to achieve a good power (Belloy et al., 2019; Kunkle et al., 2019). For example, a recent meta-analysis included 71,880 cases and 383,378 controls and identified 25 risk loci, implicating 215 potential causative genes (Jansen et al., 2019). However, such studies are limited by sample collection and cost, which hinders the discovery of more risk variants. To overcome such a problem, a viable strategy is to stratify patients based on some disease-relevant features (Dahl et al., 2019). For AD, the carrier's status of APOE-ε4 had been used to cluster the AD patients in association studies and successfully reported novel features (Marioni et al., 2017). Other factors, e.g., sex (Deming et al., 2018) and age (Lo et al., 2019), have also been used for AD patient stratification and the improved performance supports the values of patient stratification in association studies.
With the increase in multi-omics data, system biology methods show a good potential to unveil the complex mechanism of AD genesis (Wang et al., 2016; Mostafavi et al., 2018; Meng and Mei, 2019). One example is the Accelerating Medicines Partnership–Alzheimer's Disease (AMP-AD) projects, which includes transcriptomics, epigenomics, genetics, and proteomics data from over 2,000 human brain samples. These data allow for AD patient stratification so that the patients affected by the common causal mechanism can be clustered together. Currently, there are some single-patient analysis tools (Vitali et al., 2017). These algorithms integrate gene expression with network or pathway annotation to identify the disease-related changes at a single-patient level (Gardeux et al., 2014; Liu et al., 2014; Schissler et al., 2017). These tools can report disease-relevant genes or pathways at a single-patient level. However, these tools still have some limitations. For example, it is hard to evaluate the generality of reported genes and pathways among different patients, making it less applicable for precise drug discovery.
In this work, we have proposed a new strategy to stratify AD patients by clustering the AD patients with similar differential expression patterns at a single-patient level. Our evaluation suggested that this method could enrich AD patients with common clinical manifestations. We applied it to 310 AD patients for both patient module analysis and genetic association studies. We identified 174 AD risk loci in 143 modules at a strict cutoff of empirical p < 0.05, while there were only two risk loci identified using all the AD patients. Function annotation suggested that identified risk genes were mainly related to neuronal/synaptic functions. We also evaluated 23 known AD risk genes and re-discovered 18 of them in at least one module. Allele frequency studies indicated that module analysis using single-patient DEGs enriched AD patients affected by common risk variants.
2. Materials and Methods
2.1. The Samples and Subjects
The AD and control sample data were collected from the “ROS/MAP” study (De Jager et al., 2012) and “HBTRC” study (Zhang et al., 2013). “ROS/MAP” data included the genotype, expression, and clinical data of 1,788 subjects. The AD-related clinical annotation was provided by the data suppliers. The important one included age, the cognitive score (cts), years of education, ApoE genotype, braak stage (braaksc), and assessment of neuritic plaques (ceradsc). We use the clinical annotation for “cogdx,” a physician's overall cognitive diagnostic category, to select the AD patient (cogdx = 4 or 5) and control subjects (cogdx = 1). After filtering the ones with missing or unclear information for either clinical records or RNA-seq, we found 219 AD patients and 187 control subjects that would be used for module analysis and clinical enrichment studies. “HBTRC” study had both RNA-seq and genotype data for 573 samples, including 311 AD samples. We filtered the one with missed clinical information, RNA-seq, or genotype data. Finally, 310 AD patients and 153 control subjects were used. Detailed information for selected data are publicly available at https://www.synapse.org/#!Synapse:syn5550382.
2.2. Clustering AD Patients Using Single-Patient DEGs
We developed a computational algorithm to cluster AD patients (see Supplementary Figure 1). The main idea behind this tool is that AD patients are highly diverse and can be affected by divergent mechanisms; it is possible to cluster AD patients if they shared a subset of differentially expressed genes (DEGs). This algorithm is implemented in the R package DEComplexDisease. It mainly includes four steps:
• Utilize RNA-seq data of normal subjects to construct reference expression profiles. In this step, the parameters of a negative binomial distribution or Gaussian distribution are estimated to describe the distribution profile of non-disease samples;
• The gene expression of AD patients is transformed into binary differential expression status. In this step, the expression values of genes are fitted against reference expression profiles. Binary differential expression status is assigned as 1, –1, or 0 to indicate upregulation, downregulation, or no difference, respectively;
• Apply a bi-clustering analysis to identify DEGs that are repeatedly observed in multiple AD patients, e.g., n = 5;
• Using the spDEG of each AD patient as the signature, we compute the co-expression correlation and identify the patients with the most similar expression profiles to construct modules.
The R codes are publicly available at https://github.com/menggf/DEComplexDisease.
2.3. Clinical Manifestation Association Analysis
“ROS/MAP” data mainly includes three AD-related clinical features, including cognitive score (cts), CERAD score, and braaksc. “HBTRC” has clinical information for braak and atrophy. Such clinical features can be used to evaluate the disease relevance of modules. Therefore, we applied our tool to generate modules of different sizes, e.g., 40, 60, and 120. For each module, AD patients can be grouped as module patients and non-module patients. We did the Kolmogorov-Smirnov (KS) test to evaluate the clinical manifestation differences between two groups of AD patients.
2.4. Processing Genotype Data
We applied stringent quality control (QC) filters to the genotype data. First, we removed the individuals with missing genotype rates >0.05 and SNPs with missing call rate > 0.05. In the next step, the SNPs with minor allele frequency MAF < 0.1 or Hardy-Weinberg equilibrium p-value < 1.0 × 10⁻⁵ were excluded. The individuals with autosomal heterozygosity above empirically determined thresholds were filtered. We calculated the identity-by-descent (IBD) of all possible gene pairs and removed the ones with potential genetic relatedness. These QC filters were performed for multiple rounds to make sure that no individual or SNP could be filtered anyway. We then performed pre-phasing with SHAPEIT2 (Delaneau et al., 2011), using the 1000 Genome Project data as a reference. Afterwards, we conducted whole-genome imputation using IMPUTE2 (Howie et al., 2012) in 5-Mb segments with filtering of the SNP with MAF less than 0.1 in the EUR population. The imputed data were evaluated for quality control using the thresholds mentioned before. We performed principal component analysis (PCA) on autosomal genotype data and adjustment for stratification.
2.5. Association Study
Association studies were performed for both AD patients and module patients. To simplify it, we only include the definite AD patients and control individuals in the association analysis so that binary disease status could be assigned for each patient. We performed population stratification by use of the principal components of chromosomal genetic variations. Association analysis was performed using a fast score test implemented in the GenABEL package. In this step, the first 10 principal components were used as covariates to remove the effects of population structure to make sure there was no clear evidence of inflation in the association results. To control the false positive discovery, we also estimated the empirical p-values using performing permutation analysis by generating the distribution under the null hypothesis for 1,000 times. In each round of call, the minimal p-value was compared with the original p-values. For an SNP, its empirical p-value is defined as the proportion of times where the minimal p-values of 1,000 resamples was less than the original p-value. We set empirical p-values < 0.05 as the cutoff to selecting the module-associated SNPs. The codes for association studies are available at https://github.com/menggf/spDEG_and_Association.
2.6. Enrichment Analysis
We performed enrichment analysis to find the clinical association of patient modules. Among a total of n patients, k patients were predicted as a module. The number of patients with a clinical manifestation is p, which also includes x module patients. We used Fisher's exact test to evaluate if the observed x patients resulted from random occurrences. We used the following R codes to calculate the p-value:
3. Results
3.1. A New Pipeline to Cluster AD Patients Utilizing Single-Patient DEGs
Considering the diversity of AD patients, we propose a new analysis strategy to cluster the AD patients affected by the common mechanisms. This method is based on differential expression analysis at single-patient levels. Figure 1A and Supplementary Figure 1 describe the schema of the whole analysis pipeline. In our analysis, the reference expression profile was firstly built using the RNA-seq counts or normalized data of the normal individuals, which defined the ranges of gene expression values at a non-disease status. Next, gene expression values of patients were transformed into binary status by fitting to the reference expression profiles. In detail, if the gene expression values of patients exceeded the range of reference expression profiles, 1 or –1 is assigned to indicate up- or downregulation. To improve confidence, a bi-clustering analysis algorithm is applied to perform filtering and cross-validation so that the whole set of single-patient differentially expressed genes (spDEGs) can be repeatedly observed in multiple patients, e.g., n = 5. Finally, using each patient as a seed, we cluster the patients into modules if they carry the same set of spDEGs.
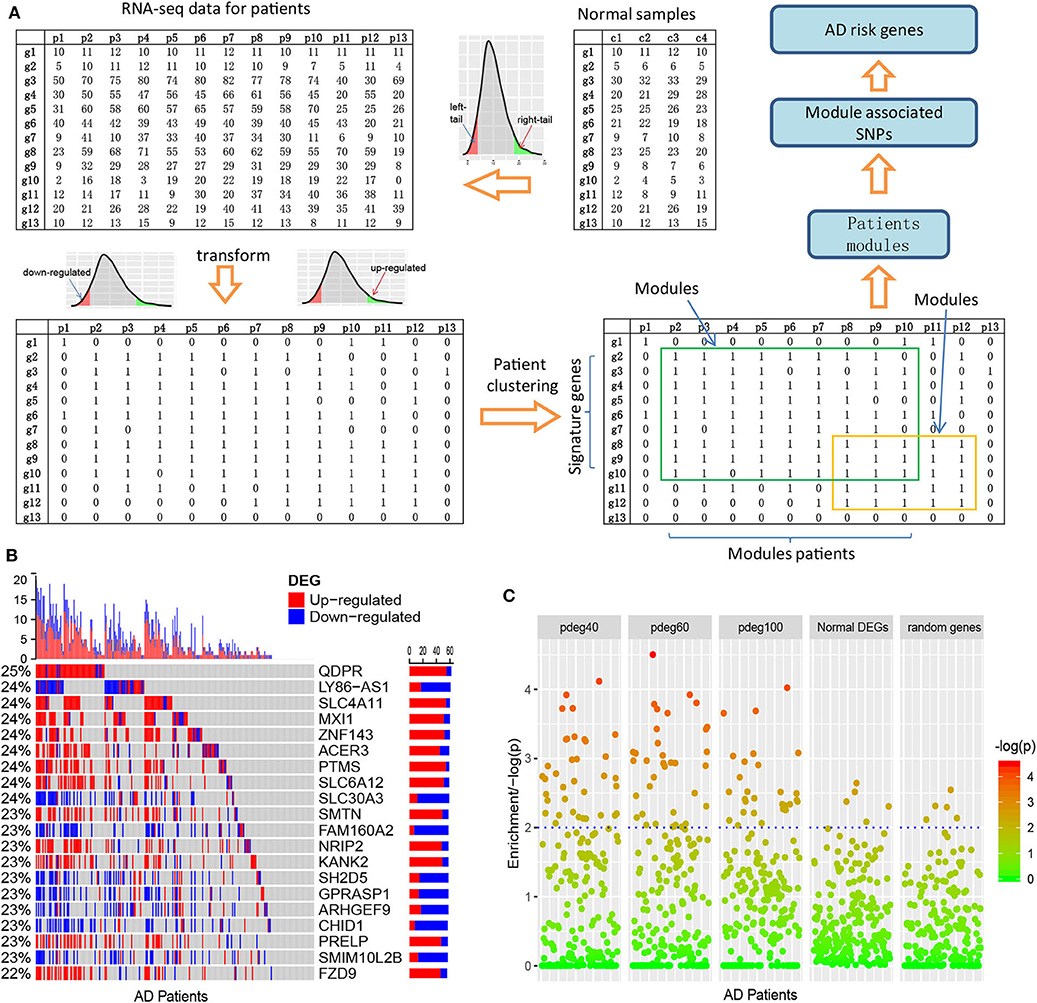
Figure 1. Clustering AD patients into modules based on single-patient differential expression profile similarity. (A) An analysis pipeline to cluster AD patients. The RNA-seq data of AD patients were transformed into binary DEG matrix based on the reference profile built using the data of normal individuals; the AD patients with the shared DEG signatures are clustered as modules using a bi-clustering algorithm; genome-wide association study was performed in each patient module to identify the AD risk loci and genes. (B) Single-patient differential expression analysis indicated the complexity of AD patients, where genes displayed diverse DE status. (C) Module-analysis-enriched AD patients with similar clinical outcomes, e.g., cognitive test scores not by the differentially expressed genes in all AD patients or random genes.
As an evaluation, we applied this pipeline to the dataset collected from the ROS/MAP study (De Jager et al., 2012), which includes 251 AD samples with both RNA-seq data and clinical annotation. We identified cross-validated spDEGs for 171 patients. Among 15,582 brain expressed genes, 3,878 spDEGs were predicted to be differentially expressed in at least one AD patient at a cutoff of p < 0.05. Compared to traditional differential expression analysis using all the AD samples, they covered 93.8% of AD DEGs. We then investigated their differential expression status among all the AD patients. Figure 1B showed the results of the top 20 most observed spDEGs. We did not observe any shared differential expressed genes across all the AD patients. On the contrary, all spDEGs were only differentially expressed in a small proportion of 251 AD patients. Additionally, we also observed inconsistent differential expression directions. Taking the QDPR gene as an example, it was upregulated in 22% of AD patients while also downregulated in 3% AD patients. Similar results were observed with other spDEGs (see Figure 1B). We also performed module analysis using the most observed differential expressed genes and observed distinct differential expression patterns (see Supplementary Figures 2, 3). All these results suggested that AD patients were greatly diverse and that it would be a risk to treat AD patients as a homogeneous whole in any analysis.
Next, we investigated if AD patient clustering could enrich AD patients with common clinical manifestations. We generated patient modules based on spDEG expression profile similarity. The modules were arbitrarily set to have different sizes of AD patients, e.g., 40, 60, and 100, which could be denoted as pdeg40, pdeg60, and pdeg100, respectively. The patients within the same module were supposed to be affected by the common mechanisms. As a control, we also generated modules using randomly selecting genes and DEGs identified by traditional differential expression analysis. Figure 1C showed the evaluation results using cognitive scores (cts). At a cutoff of p < 0.01, 37 “pdeg60” modules were enriched with detrimental cts scores, while only five modules identified by common DEGs or random genes were enriched. The most significant p-value was up to p = 2.51 × 10⁻⁵ in the “pdeg60” module. On the contrary, no module in “common DEG” and "random gene" exceeded the significance of p = 0.001. This result suggested that modules analysis using spDEG better-enriched AD patients with common clinical manifestations.
3.2. More Risk Variants Were Identified in AD Patient Modules
We collected genotyping data from the “hbtrc” study (Zhang et al., 2013), including 310 LOAD patients and 153 non-demented healthy controls. We performed genome-wide association studies (GWAS) using all the AD patients. In this process, we performed a permutation procedure for 1,000 times to estimate empirical p values. We found only two loci to have a significant association with AD at a cutoff of empirical p < 0.05. The significant SNPs included rs2405283 (p = 1.15 × 10⁻⁷) and rs769450 (p = 1.65 × 10⁻⁶) (see Figure 2A). rs769450 was mapped to the second intron of the APOE gene, which is consistent with published reports about the critical roles of APOE.
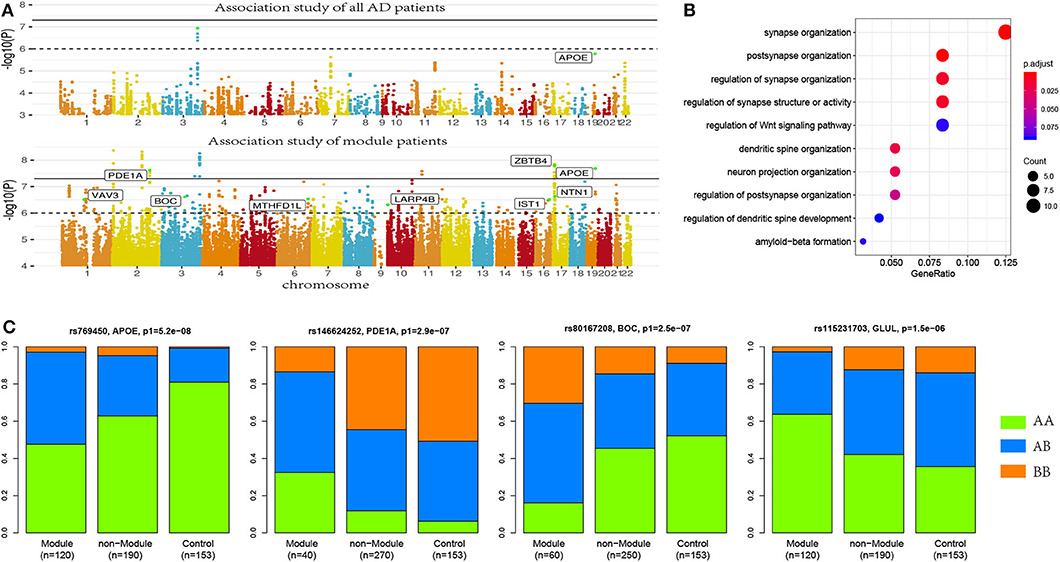
Figure 2. More risk variants were identified in AD patient modules. (A) Manhattan plot for the association studies to both AD patients and patient modules, where more AD risk SNPs were identified in AD modules. (B) Allele frequencies in module patients, non-module patients, and control subjects. More risk allele enrichment was observed in module patients, suggested that module analysis enriched the AD patients affected by common risk variance. (C) Functional annotation to AD risk genes. Here, synaptic-function-related terms were most significantly enriched.
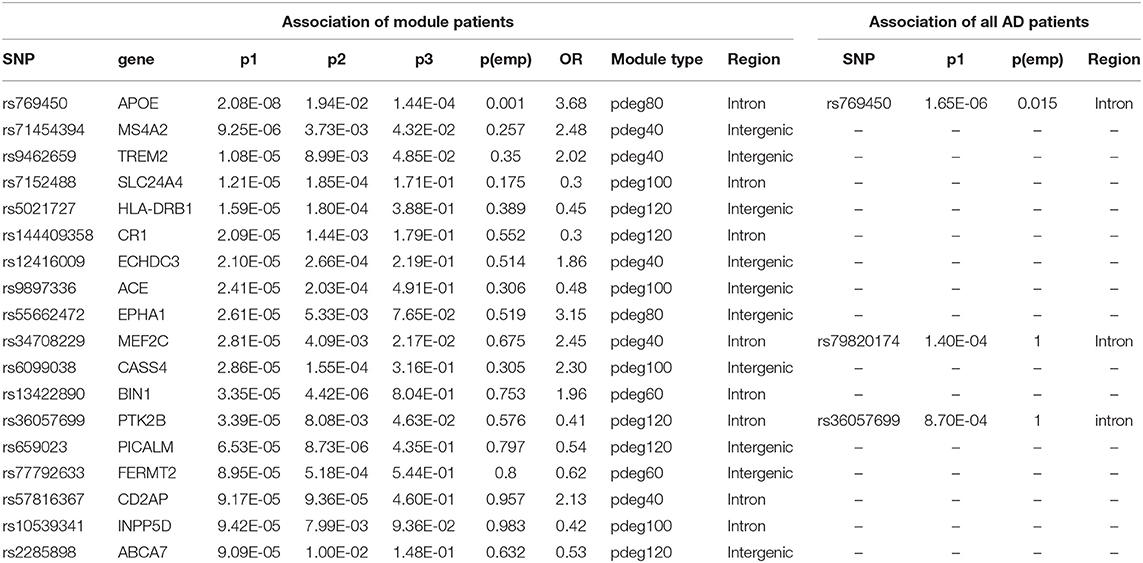
Applying module analysis, we predicted 143 modules of AD patients. Three association tests were performed for each module: (1) module patients against normal control; (2) module patients against non-module patients; and (3) non-module patients against normal control. The p-values were denoted as p1, p2, and p3, respectively. At a strict cutoff of empirical p1 < 0.05, we found 174 loci to have a significant association in at least one of 143 modules (see Figure 2A and Supplementary Table 1). Compared to the results of the association study using all the AD patients, more AD risk loci were observed within module patients. The APOE SNP rs769450 was observed in 41 modules and its association significance was also greatly improved. For example, the significance of rs769450 was up to p1 = 2.08 × 10⁻⁸ in a module of 80 AD patients while the significance for all 310 patients was p1 = 1.65 × 10⁻⁶. Tests between module patients and non-module patients supported allele frequency differences in 165 out of 174 loci at a cutoff of p2 < 0.01. Figure 2B showed the allele frequency for some exemplary SNPs. We observed that allele frequencies of identified risk SNPs were different from the non-module patients and normal individuals. In most cases, non-module patients usually had similar allele frequencies with normal subjects. We checked if module patients were more associated with risk SNPs than non-module patients by comparing p1 and p3 value distribution (see Supplementary Figure 4). We found module patients tended to report more significant associations than non-module patients. It suggested that module analysis enriched the AD patient affected by the common risk SNPs.
We mapped 174 AD risk loci to 107 genes based on genomic proxy and GTEx eQTL annotation (see Supplementary Table 1). Among them, 86 genes were observed in more than one module at a cutoff of empirical p1 < 0.05. APOE is the most observed risk gene, which is significantly associated with AD patients in 41 modules. We searched the published GWAS results and found that 46 genes had been reported for AD or brain-related function (see Table 1). Some of them had been reported in association studies of AD, such as PDE1A, JAM3, DLGAP1, CYYR1, SERPINB11, and MCPH1. To understand their function involvement, we performed Gene Ontology enrichment analysis to 107 AD risk genes (see Figure 2C). We found that the most enriched terms were also related to synaptic and neuronal function, e.g., “synapse organization” (p = 7.65 × 10⁻⁶). It suggested that the identified AD risk genes were related to normal brain function and had potential roles in AD genesis.
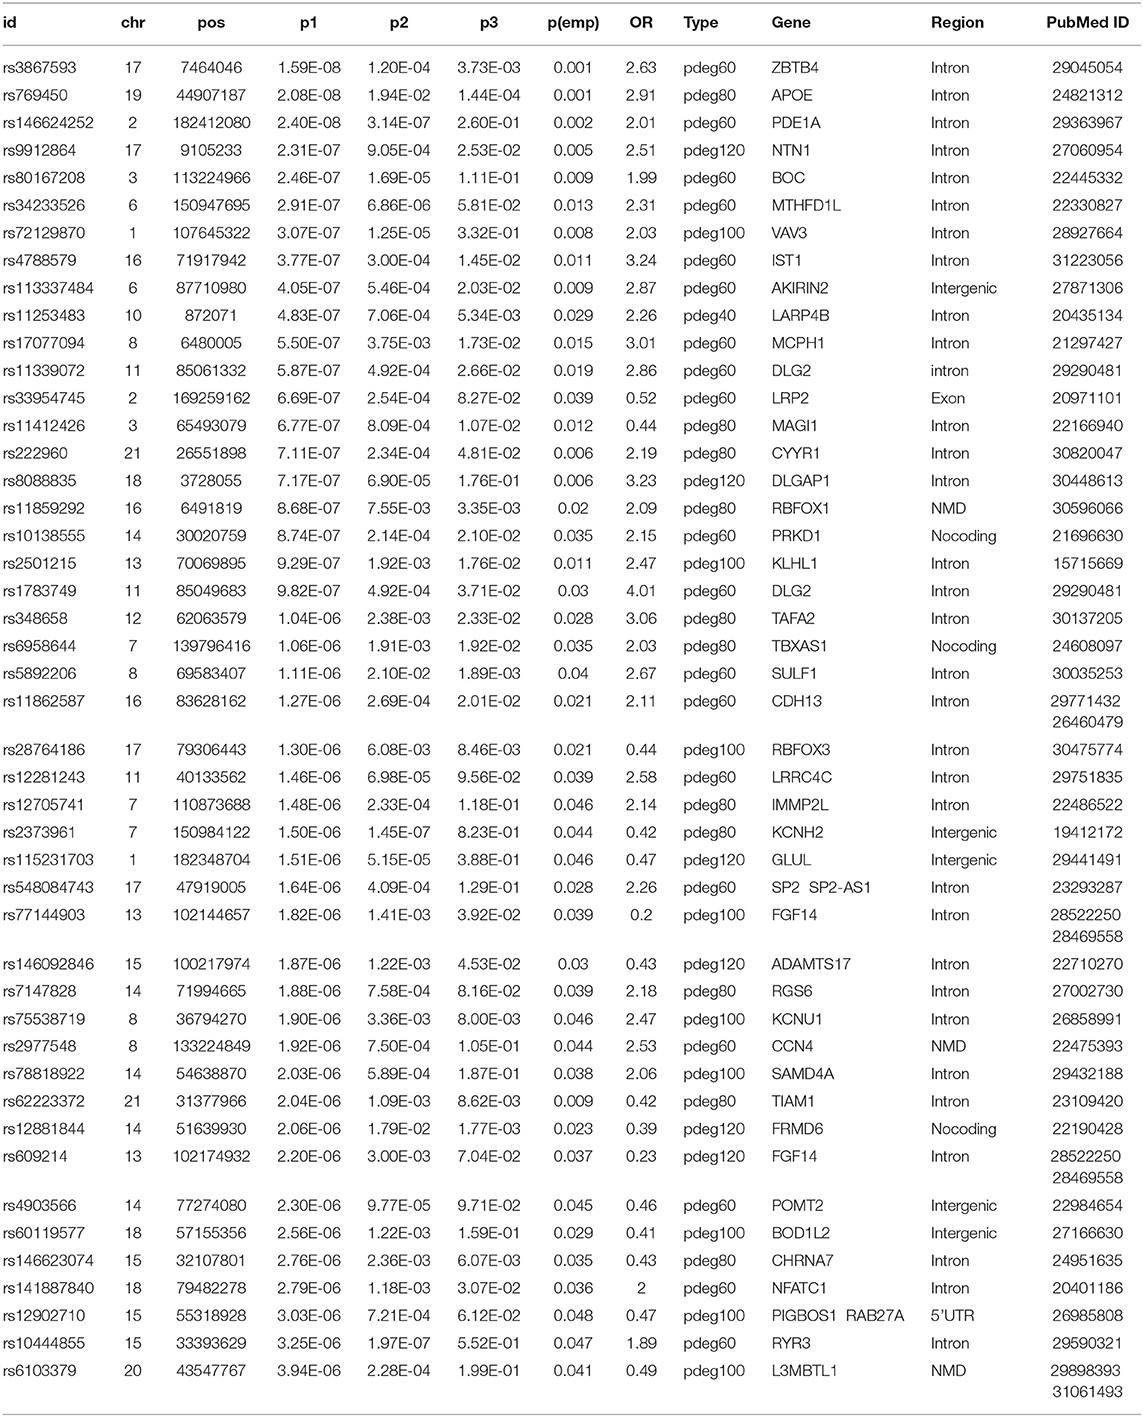
Table 1. The results of association studies using module patients, non-module patients, and control.
In a recent large-scale meta-analysis, 23 AD risk loci were reported (Kunkle et al., 2019). We checked their association using either all patients or module patients. We loosed the cutoffs of significant association by replacing empirical p < 0.05 with p1 < 10−4. Association study using all AD patients failed to identify any extra known AD risk gene to satisfy a threshold of p1 < 10−4. Unlike the results using all AD patients, we observed that 18 out of 23 AD genes have a significant association with AD in at least one module. Table 2 summarized the analysis results using module patients. By checking p2 and p3 values, we found significant allele frequency differences between module patients and no-module patients, supporting the conclusion that module analysis enriched AD patients affected by commonly known risk variants.
3.3. Biological Relevance of AD Risk Genes
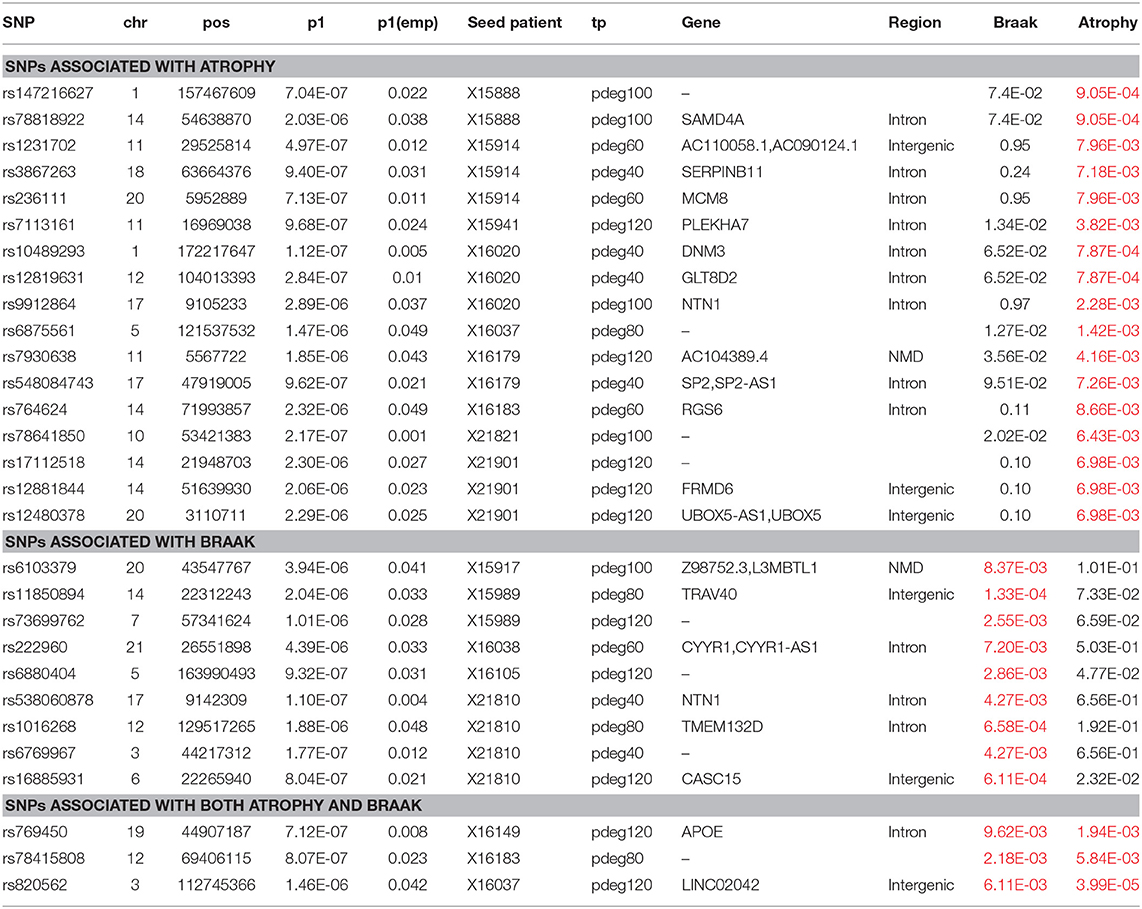
Module-based clustering analysis allows us to bridge AD risk genes to clinical features and affected biological processes. The clinical association of modules is determined by enrichment analysis. In HBRTC's dataset, we identified nine and eight modules to be associated with braak and brain generalized atrophy at a cutoff of p < 0.01, respectively. Among them, three modules were associated with both braak and brain atrophy. Association study to these modules identified eight and 20 loci respectively. In Table 3, we summarized the analysis results. These results supported that some AD risk genes might be more associated with some AD clinical outcomes. For example, the NTN1 gene is a microtubule-associated force-producing protein and it is predicted to be related to the braak stage.
AD patient modules are always associated with a list of spDEG signature genes, which could be used to investigate the biological relevance of AD risk genes. Figure 3 showed the analysis results of functional annotation to module spDEG signature genes. Among the significant terms, "extracellular matrix assembly," "synaptic signaling," "learning and memory," and "protein folding" were more observed or more significant. By text mining studies, we found much published evidence for their close association with AD, supporting that predicted AD risk genes contributed to AD development. For example, the extracellular matrix was observed to have significant changes during the early stages of AD (Lepelletier et al., 2017) and extracellular matrix could induce β-Amyloid Levels (Ma et al., 2019). Among predicted risk genes, APOE, POMT2, FGF14, CDH13, and RBFOX3 display more functional involvements.
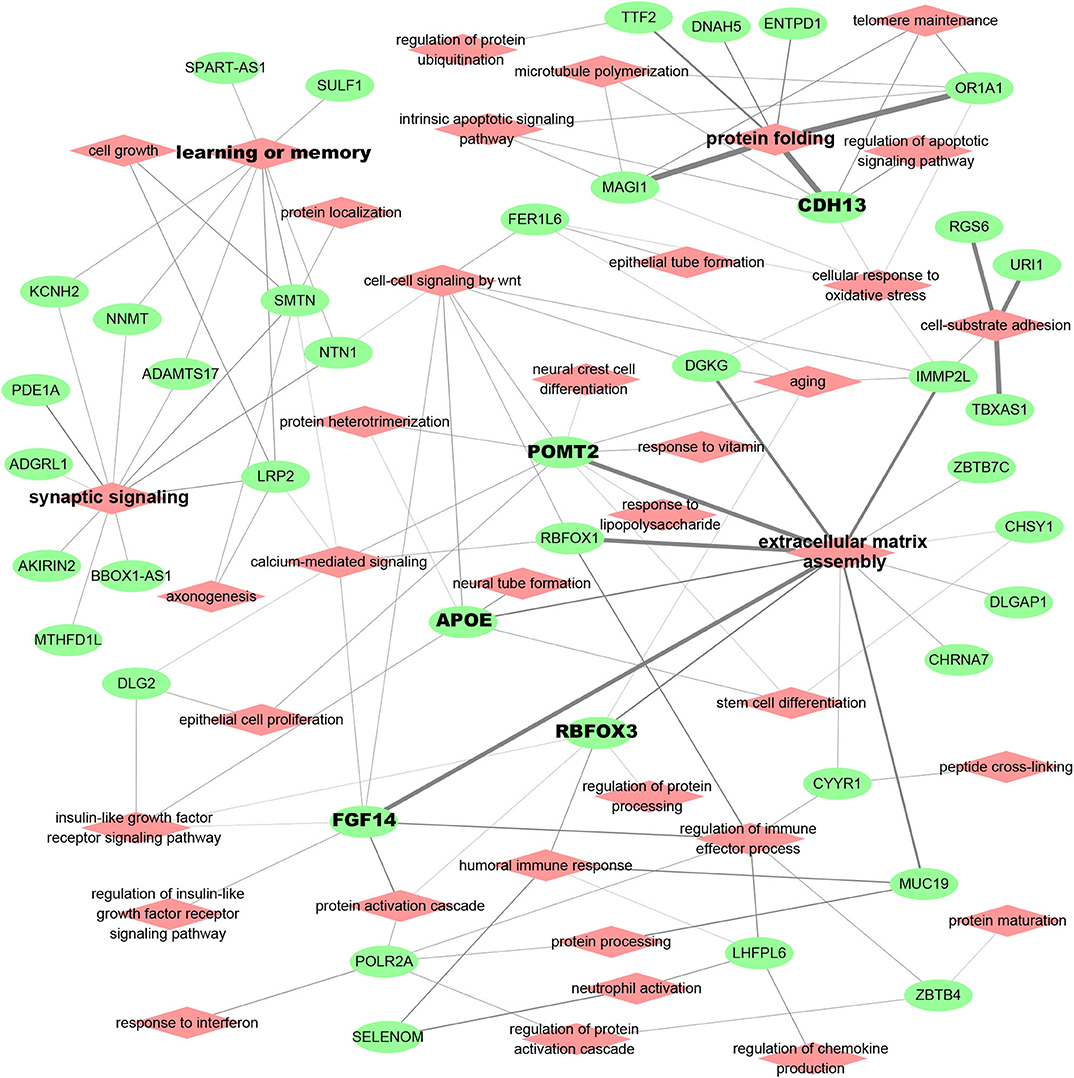
Figure 3. Functional relevance of AD risk genes. Here, the module spDEG signatures were used for Gene Ontology enrichment to indicate the functional involvement of modules.
3.4. Evaluation Using Randomly Modules of AD Patients
In the above analysis, we attempted to cluster AD patients with a common set of spDEGs so that the clustered patients were more affected by common AD variants. As an evaluation, we performed a simulated study by randomly splitting AD patients into simulated modules at corresponding sizes. We then predicted AD risk SNPs using the same setting. In each round of the simulation, we identified about 105 AD risk SNPs on average at a cutoff of empirical p < 0.05. We compared their analysis results to those of true modules and found that about 63% of risked SNPs (out of total 174 loci) could be overlapped with the SNPs predicted using true modules. This evaluation seemed to support the conclusion that subsetting AD patients had benefits to improve the power of association studies, even when the criteria to stratify AD patients was to randomly pick up. Compared to random modules, modules of spDEG signature could recover more AD risk SNPs.
4. Discussion
In this work, we took more consideration to AD patient diversity and attempted to stratify patients into modules affected by different genetic background. We therefore came up with an analysis pipeline to cluster AD patients based on some assumptions. These included that (1) AD patients are very diverse and differential expression patterns differ among AD patients, and that (2) we can use single-patient DEGs as biomarkers to indicate the dysregulation status of AD patients and to cluster the AD patients affected by common mechanisms. In our previous work, we have applied similar strategies to discover enriched transcription factor binding sites (Meng and Vingron, 2014) and cancer driver mutations (Meng, 2018), and we achieved a good performance. Evaluation using real patient data suggested that this method could group AD patients with similar clinical outcomes and common risk variants, validating our assumptions. Compared to existent methods, our pipeline not only can discover patient-specific DEGs but also considers the reliability of spDEGs by evaluating their occurrence in multiple patients.
We applied it to find the differentially expressed genes for each AD patient and module patients based on the spDEG signatures. In this process, we made some assumptions. For example, we defined the reference expression profiles for normal individuals by fitting to a Gaussian or negative binomial distribution. The robustness of this step was dependent on the number and homogeneity of control individuals. To identify the differentially expressed genes, we need to set some thresholds to determine if the gene expression level of one AD patient was beyond the normal ranges. In our work, we tested different cutoffs and selected p = 0.1.
We did an association study in each module of size 40 to 120. Compared to the study using all AD patients, the statistical power decreased with a decreased sample size in each association study. However, more AD risk loci were identified for the increased number of AD patient modules. A total of 174 loci were predicted to be associated with AD at a strict threshold of empirical p < 0.05, while only two loci exceed such a threshold using all AD patients. The genotype frequency was found to be different between module and non-module patients. All these results suggested that AD risk variants might contribute only a limited subset of the AD population.
During simulation analysis, we also predicted many AD risk SNPs. The reason could be that random sampling also enriched AD patients affected by some AD risk SNPs. For example, we found APOE SNPs were not associated with AD patients in nearly half of simulated modules. It suggested that randomly sampling enriched the AD patient less affected by APOE. Similarly, it was possible to enrich the AD patients affected by other AD risk SNPs, especially when the AD sample size was limited.
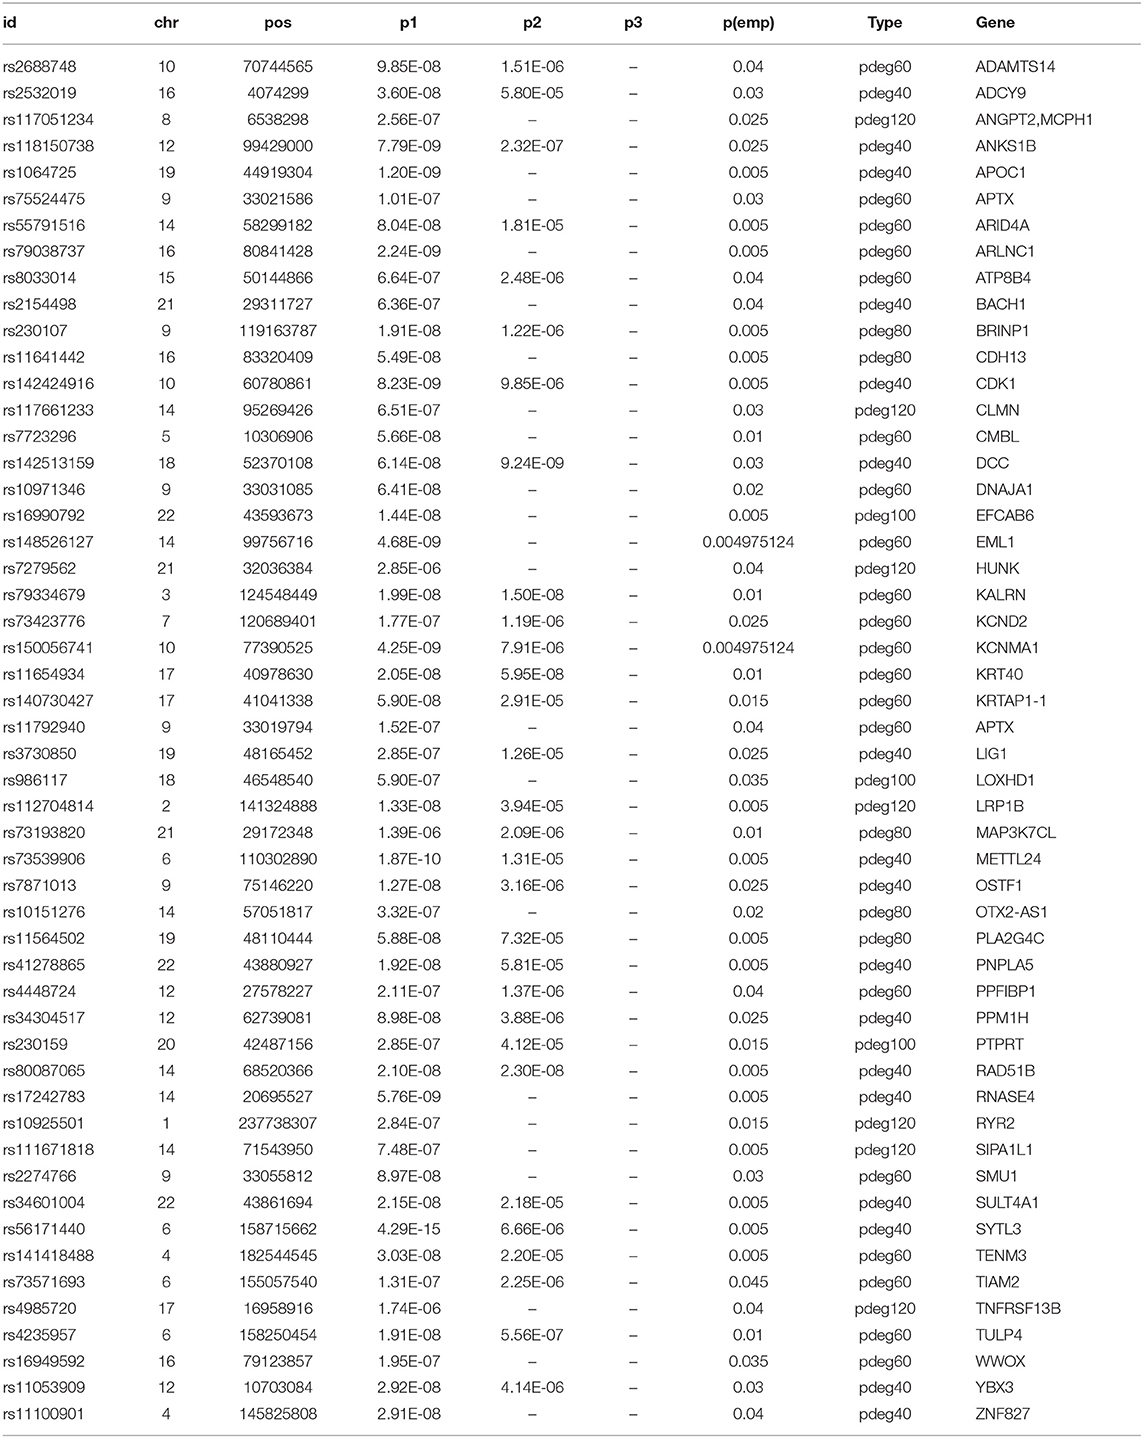
As an evaluation, we also collected ROSMAP data and performed a similar study. We found that our method helped to identify more AD risk genes, validating our conclusion that module analysis improved the power of association study. However, we observed only limited overlaps for identified AD risk SNPs between ROSMAP and HBTRC dataset (see Table 4). The reasons could be that (1) there were only 251 AD patients in ROSMAP data, which were too limited to recover full AD risk SNPs, and (2) the cutoff of the association study was too strict to identify all the AD risk SNPs.
In this work, we proved the benefits of the patient module in association studies to AD. In our application, we reported more AD risk genes even when only 310 AD patients were used. In the large-scale meta-analysis, there were about 20–30 genes identified as AD risk genes (Cuyvers and Sleegers, 2016; Jansen et al., 2019). However, by searching public literature and databases, e.g., the GWAS catalog, we found more than 100 studies and 300 genes that had been reported in associated studies to AD patients. These studies could be treated as a subset of large-scale AD meta-analysis. This result suggested that there might be more AD risk genes, and AD patient subsetting helped to identify them.
Data Availability Statement
Publicly available datasets were analyzed in this study. This data can be found at: https://www.synapse.org/#!Synapse:syn2580853.
Author Contributions
GM designed the project. JH and DL contributed to collected samples and analyzed the data. JH and DL contributed to analyzed results and wrote the manuscript. JH, DL, and GM revised the manuscript. All authors read and approved the final manuscript.
Funding
This work was supported by National Natural Science Foundation of China, NSCF(81973706).
Conflict of Interest
The authors declare that the research was conducted in the absence of any commercial or financial relationships that could be construed as a potential conflict of interest.
Acknowledgments
The results published here are in part based on data obtained from the AMP-AD Knowledge Portal (doi: 10.7303/syn2580853). We appreciate their generous contribution to the studies of Alzhiemer's disease, including this study. We appreciated the valuable comments from Dr. Jijia Sun. This manuscript has been released as a pre-print at bioRxiv (Huang et al., 2020).
Supplementary Material
The Supplementary Material for this article can be found online at: https://www.frontiersin.org/articles/10.3389/fgene.2020.571609/full#supplementary-material
References
Ball, R. D. (2013). Designing a gwas: power, sample size, and data structure. Methods Mol. Biol. 1019, 37–98. doi: 10.1007/978-1-62703-447-0_3
Belloy, M. E., Napolioni, V., and Greicius, M. D. (2019). A quarter century of apoe and Alzheimer's disease: progress to date and the path forward. Neuron 101, 820–838. doi: 10.1016/j.neuron.2019.01.056
Cuyvers, E., and Sleegers, K. (2016). Genetic variations underlying Alzheimer's disease: evidence from genome-wide association studies and beyond. Lancet Neurol. 15, 857–868. doi: 10.1016/S1474-4422(16)00127-7
Dahl, A., Cai, N., Ko, A., Laakso, M., Pajukanta, P., Flint, J., et al. (2019). Reverse gwas: using genetics to identify and model phenotypic subtypes. PLoS Genet. 15:e1008009. doi: 10.1371/journal.pgen.1008009
De Jager, P. L., Shulman, J. M., Chibnik, L. B., Keenan, B. T., Raj, T., Wilson, R. S., et al. (2012). A genome-wide scan for common variants affecting the rate of age-related cognitive decline. Neurobiol. Aging 33, 1017.e1–1017.15. doi: 10.1016/j.neurobiolaging.2011.09.033
Delaneau, O., Marchini, J., and Zagury, J.-F. (2011). A linear complexity phasing method for thousands of genomes. Nat. Methods 9, 179–181. doi: 10.1038/nmeth.1785
Deming, Y., Dumitrescu, L., Barnes, L. L., Thambisetty, M., Kunkle, B., Gifford, K. A., et al. (2018). Sex-specific genetic predictors of Alzheimer's disease biomarkers. Acta Neuropathol. 136, 857–872. doi: 10.1007/s00401-018-1881-4
Gardeux, V., Achour, I., Li, J., Maienschein-Cline, M., Li, H., Pesce, L., et al. (2014). ‘n-of-1-pathways' unveils personal deregulated mechanisms from a single pair of RNA-seq samples: towards precision medicine. J. Am. Med. Inform. Assoc. 21, 1015–1025. doi: 10.1136/amiajnl-2013-002519
Howie, B., Fuchsberger, C., Stephens, M., Marchini, J., and Abecasis, G. R. (2012). Fast and accurate genotype imputation in genome-wide association studies through pre-phasing. Nat. Genet. 44, 955–959. doi: 10.1038/ng.2354
Huang, J., Lu, D., and Meng, G. (2020). Module analysis using single-patient differential expression signatures improve the power of association study for alzheimer's disease. bioRxiv [Preprint]. doi: 10.1101/2020.01.05.894931
Jansen, I. E., Savage, J. E., Watanabe, K., Bryois, J., Williams, D. M., Steinberg, S., et al. (2019). Genome-wide meta-analysis identifies new loci and functional pathways influencing Alzheimer's disease risk. Nat. Genet. 51, 404–413. doi: 10.1038/s41588-018-0311-9
Kunkle, B. W., Grenier-Boley, B., Sims, R., Bis, J. C., Damotte, V., Naj, A. C., et al. (2019). Genetic meta-analysis of diagnosed Alzheimer's disease identifies new risk loci and implicates aβ, tau, immunity and lipid processing. Nat. Genet. 51, 414–430. doi: 10.1038/s41588-019-0358-2
Lanoiselée, H.-M., Nicolas, G., Wallon, D., Rovelet-Lecrux, A., Lacour, M., Rousseau, S., et al. (2017). App, psen1, and psen2 mutations in early-onset Alzheimer disease: a genetic screening study of familial and sporadic cases. PLoS Med. 14:e1002270. doi: 10.1371/journal.pmed.1002270
Lepelletier, F.-X., Mann, D., Robinson, A., Pinteaux, E., and Boutin, H. (2017). Early changes in extracellular matrix in Alzheimer's disease. Neuropathol. Appl. Neurobiol. 43, 167–182. doi: 10.1111/nan.12295
Liu, R., Yu, X., Liu, X., Xu, D., Aihara, K., and Chen, L. (2014). Identifying critical transitions of complex diseases based on a single sample. Bioinformatics 30, 1579–1586. doi: 10.1093/bioinformatics/btu084
Lo, M.-T., Kauppi, K., Fan, C.-C., Sanyal, N., Reas, E. T., Sundar, V. S., et al. (2019). Identification of genetic heterogeneity of Alzheimer's disease across age. Neurobiol. Aging. 84, 243.e1-243.e9. doi: 10.1016/j.neurobiolaging.2019.02.022
Ma, C., Su, J., Sun, Y., Feng, Y., Shen, N., Li, B., et al. (2019). Significant upregulation of Alzheimer's β-amyloid levels in living system induced by extracellular elastin polypeptides. Angew. Chem. Int. Ed. 58, 18703–18709. doi: 10.1002/anie.201912399
Marioni, R. E., Campbell, A., Hagenaars, S. P., Nagy, R., Amador, C., Hayward, C., et al. (2017). Genetic stratification to identify risk groups for Alzheimer's disease. J. Alzheimers Dis. 57, 275–283. doi: 10.3233/JAD-161070
Meng, G. (2018). Applying expression profile similarity for discovery of patient-specific functional mutations. High Throughput 7:6. doi: 10.3390/ht7010006
Meng, G., and Mei, H. (2019). Transcriptional dysregulation study reveals a core network involving the progression of Alzheimer's disease. Front. Aging Neurosci. 11:101. doi: 10.3389/fnagi.2019.00101
Meng, G., and Vingron, M. (2014). Condition-specific target prediction from motifs and expression. Bioinformatics 30, 1643–1650. doi: 10.1093/bioinformatics/btu066
Mostafavi, S., Gaiteri, C., Sullivan, S. E., White, C. C., Tasaki, S., Xu, J., et al. (2018). A molecular network of the aging human brain provides insights into the pathology and cognitive decline of Alzheimer's disease. Nat. Neurosci. 21, 811–819. doi: 10.1038/s41593-018-0154-9
Schissler, A. G., Piegorsch, W. W., and Lussier, Y. A. (2017). Testing for differentially expressed genetic pathways with single-subject n-of-1 data in the presence of inter-gene correlation. Stat. Methods Med. Res. 27, 3797–3813. doi: 10.1177/0962280217712271
Vitali, F., Li, Q., Schissler, A. G., Berghout, J., Kenost, C., and Lussier, Y. A. (2017). Developing a ‘personalome' for precision medicine: emerging methods that compute interpretable effect sizes from single-subject transcriptomes. Brief. Bioinform. 20, 789–805. doi: 10.1093/bib/bbx149
Wang, M., Roussos, P., McKenzie, A., Zhou, X., Kajiwara, Y., Brennand, K. J., et al. (2016). Integrative network analysis of nineteen brain regions identifies molecular signatures and networks underlying selective regional vulnerability to alzheimer's disease. Genome Med. 8:104. doi: 10.1186/s13073-016-0355-3
Keywords: Alzheimer's disease, single-patient differentially expressed genes, module analysis, SNP, WGCNA
Citation: Huang J, Lu D and Meng G (2020) Module Analysis Using Single-Patient Differential Expression Signatures Improves the Power of Association Studies for Alzheimer's Disease. Front. Genet. 11:571609. doi: 10.3389/fgene.2020.571609
Received: 11 June 2020; Accepted: 05 October 2020;
Published: 20 November 2020.
Edited by:
Yunyan Gu, Harbin Medical University, ChinaReviewed by:
Suman Ghosal, National Institutes of Health (NIH), United StatesAlfred Grant Schissler, University of Nevada, Reno, United States
Copyright © 2020 Huang, Lu and Meng. This is an open-access article distributed under the terms of the Creative Commons Attribution License (CC BY). The use, distribution or reproduction in other forums is permitted, provided the original author(s) and the copyright owner(s) are credited and that the original publication in this journal is cited, in accordance with accepted academic practice. No use, distribution or reproduction is permitted which does not comply with these terms.
*Correspondence: Guofeng Meng, bWVuZ2dmQHNodXRjbS5lZHUuY24=
 Jialan Huang
 Dong Lu
 Guofeng Meng