
95% of researchers rate our articles as excellent or good
Learn more about the work of our research integrity team to safeguard the quality of each article we publish.
Find out more
ORIGINAL RESEARCH article
Front. Genet. , 19 November 2020
Sec. Genomics of Plants and the Phytoecosystem
Volume 11 - 2020 | https://doi.org/10.3389/fgene.2020.566469
This article is part of the Research Topic Applied Genetics of Natural Fiber Plants View all 9 articles
A correction has been applied to this article in:
Corrigendum: Genome-Wide Identification and Expression Pattern Analysis of the HAK/KUP/KT Gene Family of Cotton in Fiber Development and Under Stresses
 Xu Yang1,2
 Jingjing Zhang2
 Aimin Wu2
 Hengling Wei2
 Xiaokang Fu2
 Miaomiao Tian2
 Liang Ma2
 Jianhua Lu2
 Hantao Wang2*
 Shuxun Yu2*
The potassium transporter family HAK/KUP/KT is a large group of proteins that are important in plant potassium transport and plays a crucial role in plant growth and development, especially in economic crops. Although HAK/KUP/KT genes have been identified in many species, research on these genes in cotton is still quite rare. In this study, in total, 21, 24, 45, and 44 HAK/KUP/KT genes were identified in Gossypium arboreum, Gossypium raimondii, Gossypium hirsutum, and Gossypium barbadense, respectively. Phylogenetic analysis showed that these genes were divided into four clusters. The G. hirsutum gene promoters contained diverse cis-regulatory elements, such as drought-responsive elements, low temperature-responsive elements, and other elements. The RNA-seq data and qRT-PCR results showed that HAK/KUP/KT genes had different expression patterns in fiber development. The qRT-PCR results of drought and NaCl treatment indicated that HAK/KUP/KT genes might play important roles in abiotic stress responses. These results will provide molecular insights into potassium transporter research in cotton.
Potassium is one of the essential nutrients for plant growth and development, and potassium is widely distributed in various tissues as the second most abundant cation in plants. Potassium plays an important role in maintaining the cytosolic pH, cell turgor, cell elongation, enzyme activation, osmotic adjustment, some physiological processes and radiocesium toxicity reduction in soil (Cherel et al., 2014; Cherel and Gaillard, 2019; Ashraf et al., 2019). Plants have evolved to adjust their K absorption and utilization efficiency through a series of mechanisms to modulate their tolerance to biotic and abiotic stresses (Cherel et al., 2014). For K+ acquisition and distribution, plants have two K+ transport systems: K+ channels and K+ transporters. K+ channels allow plants to absorb K+ via a low-affinity K+ uptake mechanism at high [K+]ext (external K+ concentrations above 0.3 mM), while the K+ transporter is a high-affinity K+ uptake mechanism acting at low [K+]ext (below 0.2 mM) (Wang and Wu, 2013). Therefore, potassium transporters play an important role in K+ transport for plants undergoing K+ deficiency.
Potassium transporters can be divided into four families: the KT (K+ transporter)/HAK (high-affinity K+)/KUP (K+ uptake) family, Trk/Ktr/HKT family, KEA (K+ efflux antiporter) family, and CHX (cation/hydrogen exchanger) family (Gupta et al., 2008). The HAK/KUP/KT family contains high-affinity K+ transport carriers and is mainly responsible for the absorption and transport of K+ by plants. HAK/KUP/KT was first found in bacteria (Epstein and Kim, 1971), while plant HAK/KUP/KT, which is the largest K+ transporter family in plants, was first isolated from barley (HAK1) and Arabidopsis (KUP1/KT1 and KUP2/KT2) based on homology to fungal HAK and bacterial KUP (Santa-María et al., 1997; Rehman et al., 2017). The plant HAK/KUP/KT transporter family has been described as electrochemical potential-driven transporters, and they are likely K+–H+ symporters (Santa-María et al., 1997). The KT/HAK/KUP gene family has been identified in many species. For example, there are 13 members in Arabidopsis, 27 members in rice, 27 members in maize, 16 members in peaches, 19 members in tomatoes, 56 members in wheat, 21 members in cassava, and 29 members in soybeans (Gupta et al., 2008; Zhang et al., 2012; Hyun et al., 2014; Scherzer et al., 2015; Song et al., 2015; Rehman et al., 2017; Cheng et al., 2018; Ou et al., 2018).
HAK/KUP/KT transporters have been found to play important roles in the regulation of plant growth and development, salt tolerance, and osmotic potential regulation (Wang and Wu, 2017; Li et al., 2018b). It has been discovered that AtKUP5 is expressed only in root hairs and functions as a K+ flux sensor (Al-Younis et al., 2018). The mutation of AtKUP7 led to a decrease in the K+ uptake rate and K+ content in xylem sap under low-K+ stress, so the mutant showed leaf chlorosis (Han et al., 2016). OsHAK16 mediates K+ uptake and root-to-shoot transportation at a range of external K+ concentrations, thereby contributing to the maintenance of K homeostasis and salt tolerance in rice shoots (Feng et al., 2019). OsHAK1 plays an essential role in K+-mediated rice growth and salt tolerance over low and high K+ concentration ranges (Chen et al., 2015).
Cotton is a crucial economic crop worldwide, and cotton fiber plays an important role in the textile industry. Potassium affects not only the yield of cotton but also the fiber quality (Hamamoto et al., 2015; Yang et al., 2016b). In developing fibers, the cell turgor is largely influenced by an influx of water driven by primary osmotica, wherein soluble sugars, K+, and malate account for 80% of the total osmotic potential (OP) (Ruan et al., 1997; Smart et al., 1998). K+ could contribute to an increase in cell turgor pressure during fiber elongation, thus participating in fiber development (Yang et al., 2016). GhKT2, which is a potassium transporter gene, has been identified in cotton. Arabidopsis lines overexpressing GhKT2 were larger and showed greater K+ accumulation compared to the wild type (WT), and the net K+ influx rate of GhKT2-transgenic Arabidopsis lines in the root meristem zone was significantly greater than that of the WT (Wang et al., 2018). These findings showed that HAK/KUP/KT members might play an important role in cotton fiber development and responses to various stresses.
Here, we identified 134 HAK/KUP/KT family genes from the genomes of G. arboreum, G. raimondii, G. hirsutum, and G. barbadense. We examined their distributions in the genome, the characteristics of the motif distributions and gene structures, and the cis-elements in promoter regions and expression profiles. These results provide a foundation for the further functional characterization of potassium transporters in cotton.
Upland cotton TM-1 was used for tissue quantitative real-time RT-PCR analysis, and the plants were grown at Anyang (AY), Henan, China. The fiber samples were separated from the ovules 5, 10, 15, 20, and 25 days postanthesis (DPA) for RNA extraction. For RNA extraction, 0 and 3 DPA ovules were used directly.
TM-1 seeds were grown in hydroponic boxes containing Hoagland’s solution for stress treatments in a greenhouse with a photoperiod of 16 h light at 28°C/8 h at 22°C dark until the seedlings reached the three-leaf stage. Roots at the three-leaf stage of seedling development were then subjected to K+ deficiency (0.03 mM K+) treatment, salt stress (300 mM NaCl), and dehydration (18% PEG6000). Leaves were collected at 0 h, 3 h, 6 h, 9 h, 12 h, 24 h, and 48 h after the stress treatments began. All plant samples were collected with three biological replicates and immediately frozen in liquid nitrogen. All samples were then stored at -80°C until RNA isolation.
Genome and protein sequence data for four cotton species (G. arboreum, G. raimondii, G. hirsutum and G. barbadense) were downloaded from CottonFGD1, and Arabidopsis thaliana data were downloaded from NCBI2. Potassium transporter proteins in G. hirsutum were predicted using the hidden Markov model (HMM) profile obtained from Pfam3 with e < 1e-100 and score > 300. To obtain all the potassium transporters in G. hirsutum, Arabidopsis thaliana potassium transporters were used as query sequences to search using Blastp, with an evaluation cutoff of 1e-10. Then, the results of HMM and Blastp were merged to select the common genes as potassium transporter candidate genes in G. arboreum, G. raimondii, G. hirsutum and G. barbadense. Furthermore, the online Simple Modular Architecture Research Tool (SMART) was used to confirm the conserved domain for all the candidate POT protein sequences (Letunic et al., 2015).
The amino acid sequences of the HAK/KUP/KT genes of A. thaliana, O. sativa, G. arboreum, G. raimondii, G. hirsutum, and G. barbadense were saved as FASTA format files, and multiple sequence alignments of HAK/KUP/KT genes were performed by Clustal X 2.0 (Thompson et al., 2003) using the Molecular Evolutionary Genetics Analysis (MEGA) version 6.0 program (Tamura et al., 2013). A phylogenetic tree was constructed using MEGA 6.0 by the neighbor-joining method. Support for the tree topology was evaluated by using a bootstrap analysis with 1000 replicates. The online tool iTOL4 was used to modify the phylogenetic tree (Letunic and Bork, 2016).
The gene structure data of HAK/KUP/KTs were extracted from the genome annotation files. The Multiple Expectation Maximization for Motif Elicitation (MEME v4.9.1) utility program was used to analyze the conserved motifs among GhPOT proteins. Gene Structure Display Server (GSDS) 2.05 was used to represent the gene structures on the basis of the coding sequences, untranslated regions, and intron and exon data from the gene annotation file.
The locations of HAK/KUP/KTs on the chromosomes were obtained from the gene annotation (GFF) files and displayed by Mapchart (Voorrips, 2002).
For the identification of cis-regulatory elements in HAK/KUP/KT genes, a 2000-bp region upstream of each translation start site was acquired by aligning the coding sequences with the genomic sequences. Regulatory elements were then predicted using the PlantCARE database6.
Raw RNA-seq data were downloaded from the NCBI Sequence Read Archive (SRA: PRJNA248163). TopHat2 (Kim et al., 2013) and cufflinks (Trapnell et al., 2010) were used to analyze the RNA-seq expression, and the gene expression was measured in fragments per kilobase million (FPKM). The TBtools program (Chen et al., 2018) was used to display the heatmap of gene expressions. The 2–ΔΔCT method was used to calculate the relative expression levels of the GhPOTs (Livak and Schmittgen, 2001).
The total RNA was extracted using TIANGEN (TransGen Biotech, Beijing, China) according to the manufacturer’s instructions. cDNA was synthesized using the PrimeScriptTM RT Reagent Kit with gDNA Eraser (Takara, Dalian, China). GoTaq® qPCR Master Mix (Promega, Beijing, China) was used for qPCR amplification in QuantStudioTM 5 (Thermo Fisher Scientific, Shanghai, China). The qRT-PCR conditions were as follows: 95°C for 5 min, followed by 40 cycles of 95°C for 15 s and 61°C for 1 min, with a final extension at 72°C for 5 min. qRT-PCR (Promega, Madison, WI, United States) was performed on an ABI 7500 Real-Time PCR system (Applied Biosystems, United States) with three technical and biological replicates. The standard deviation was used to calculate the qRT-PCR results error. All qRT-PCR primers are listed in Supplementary Table S1.
Combining the results of HMM and Blastp, a total of 21, 24, 45, and 44 HAK/KUP/KT genes were identified in G. arboreum, G. raimondii, G. hirsutum, and G. barbadense, respectively. All the predicted HAK/KUP/KT proteins have a typical “k_trans” domain, which is a symbol of HAK/KUP/KT potassium transporter family members. The names of all the HAK/KUP/KTs were determined by their protein name annotations in CottonFGD7 and their location order on the chromosomes. The lengths of the HAK/KUP/KT protein sequences ranged from 719 aa (GaPOT5-2) to 939 aa (GaPOT4-2); 619 aa (GrPOT4-1) to 858 aa (GrPOT7-1); 494 aa (GhHAK13-1) to 858 aa (GhPOT7-1, GhPOT7-3); and 584 aa (GbPOT6-4) to 858 aa (GbPOT7-1). The molecular weights, pI values, GRAVY scores and subcellular localizations of the HAK/KUP/KT genes are shown in Supplementary Table S2.
A phylogenetic tree was constructed to examine the phylogenetic relationships between the HAK/KUP/KT protein sequences of cotton and other species. One hundred and seventy-four protein sequences were used to estimate the phylogenetic tree, including 45 from G. hirsutum, 21 from G. arboreum, 44 from G. barbadense, 24 from G. raimondii, 13 from Arabidopsis, and 27 from O. sativa. All the family members were divided into four clusters (clusters I, II, III, and IV) according to the classification criteria used for Arabidopsis and O. sativa. As shown in Figure 1, cluster II was the most abundant, including 23 GhPOTs, 11 GaPOTs, 24 GbPOTs and 13 GrPOTs and accounting for nearly 40.8% of all the HAK/KUP/KT genes. Cluster I accounted for 25.9%, including 16 GhPOTs, 7 GaPOTs, 14 GbPOTs and 8 GrPOTs. Cluster I accounted for 21.3%, with 10 GhPOTs, 4 GaPOTs, 9 GbPOTs and 5 GrPOTs. Cluster III had the smallest number, with only 6 cotton HAK/KUP/KTs.
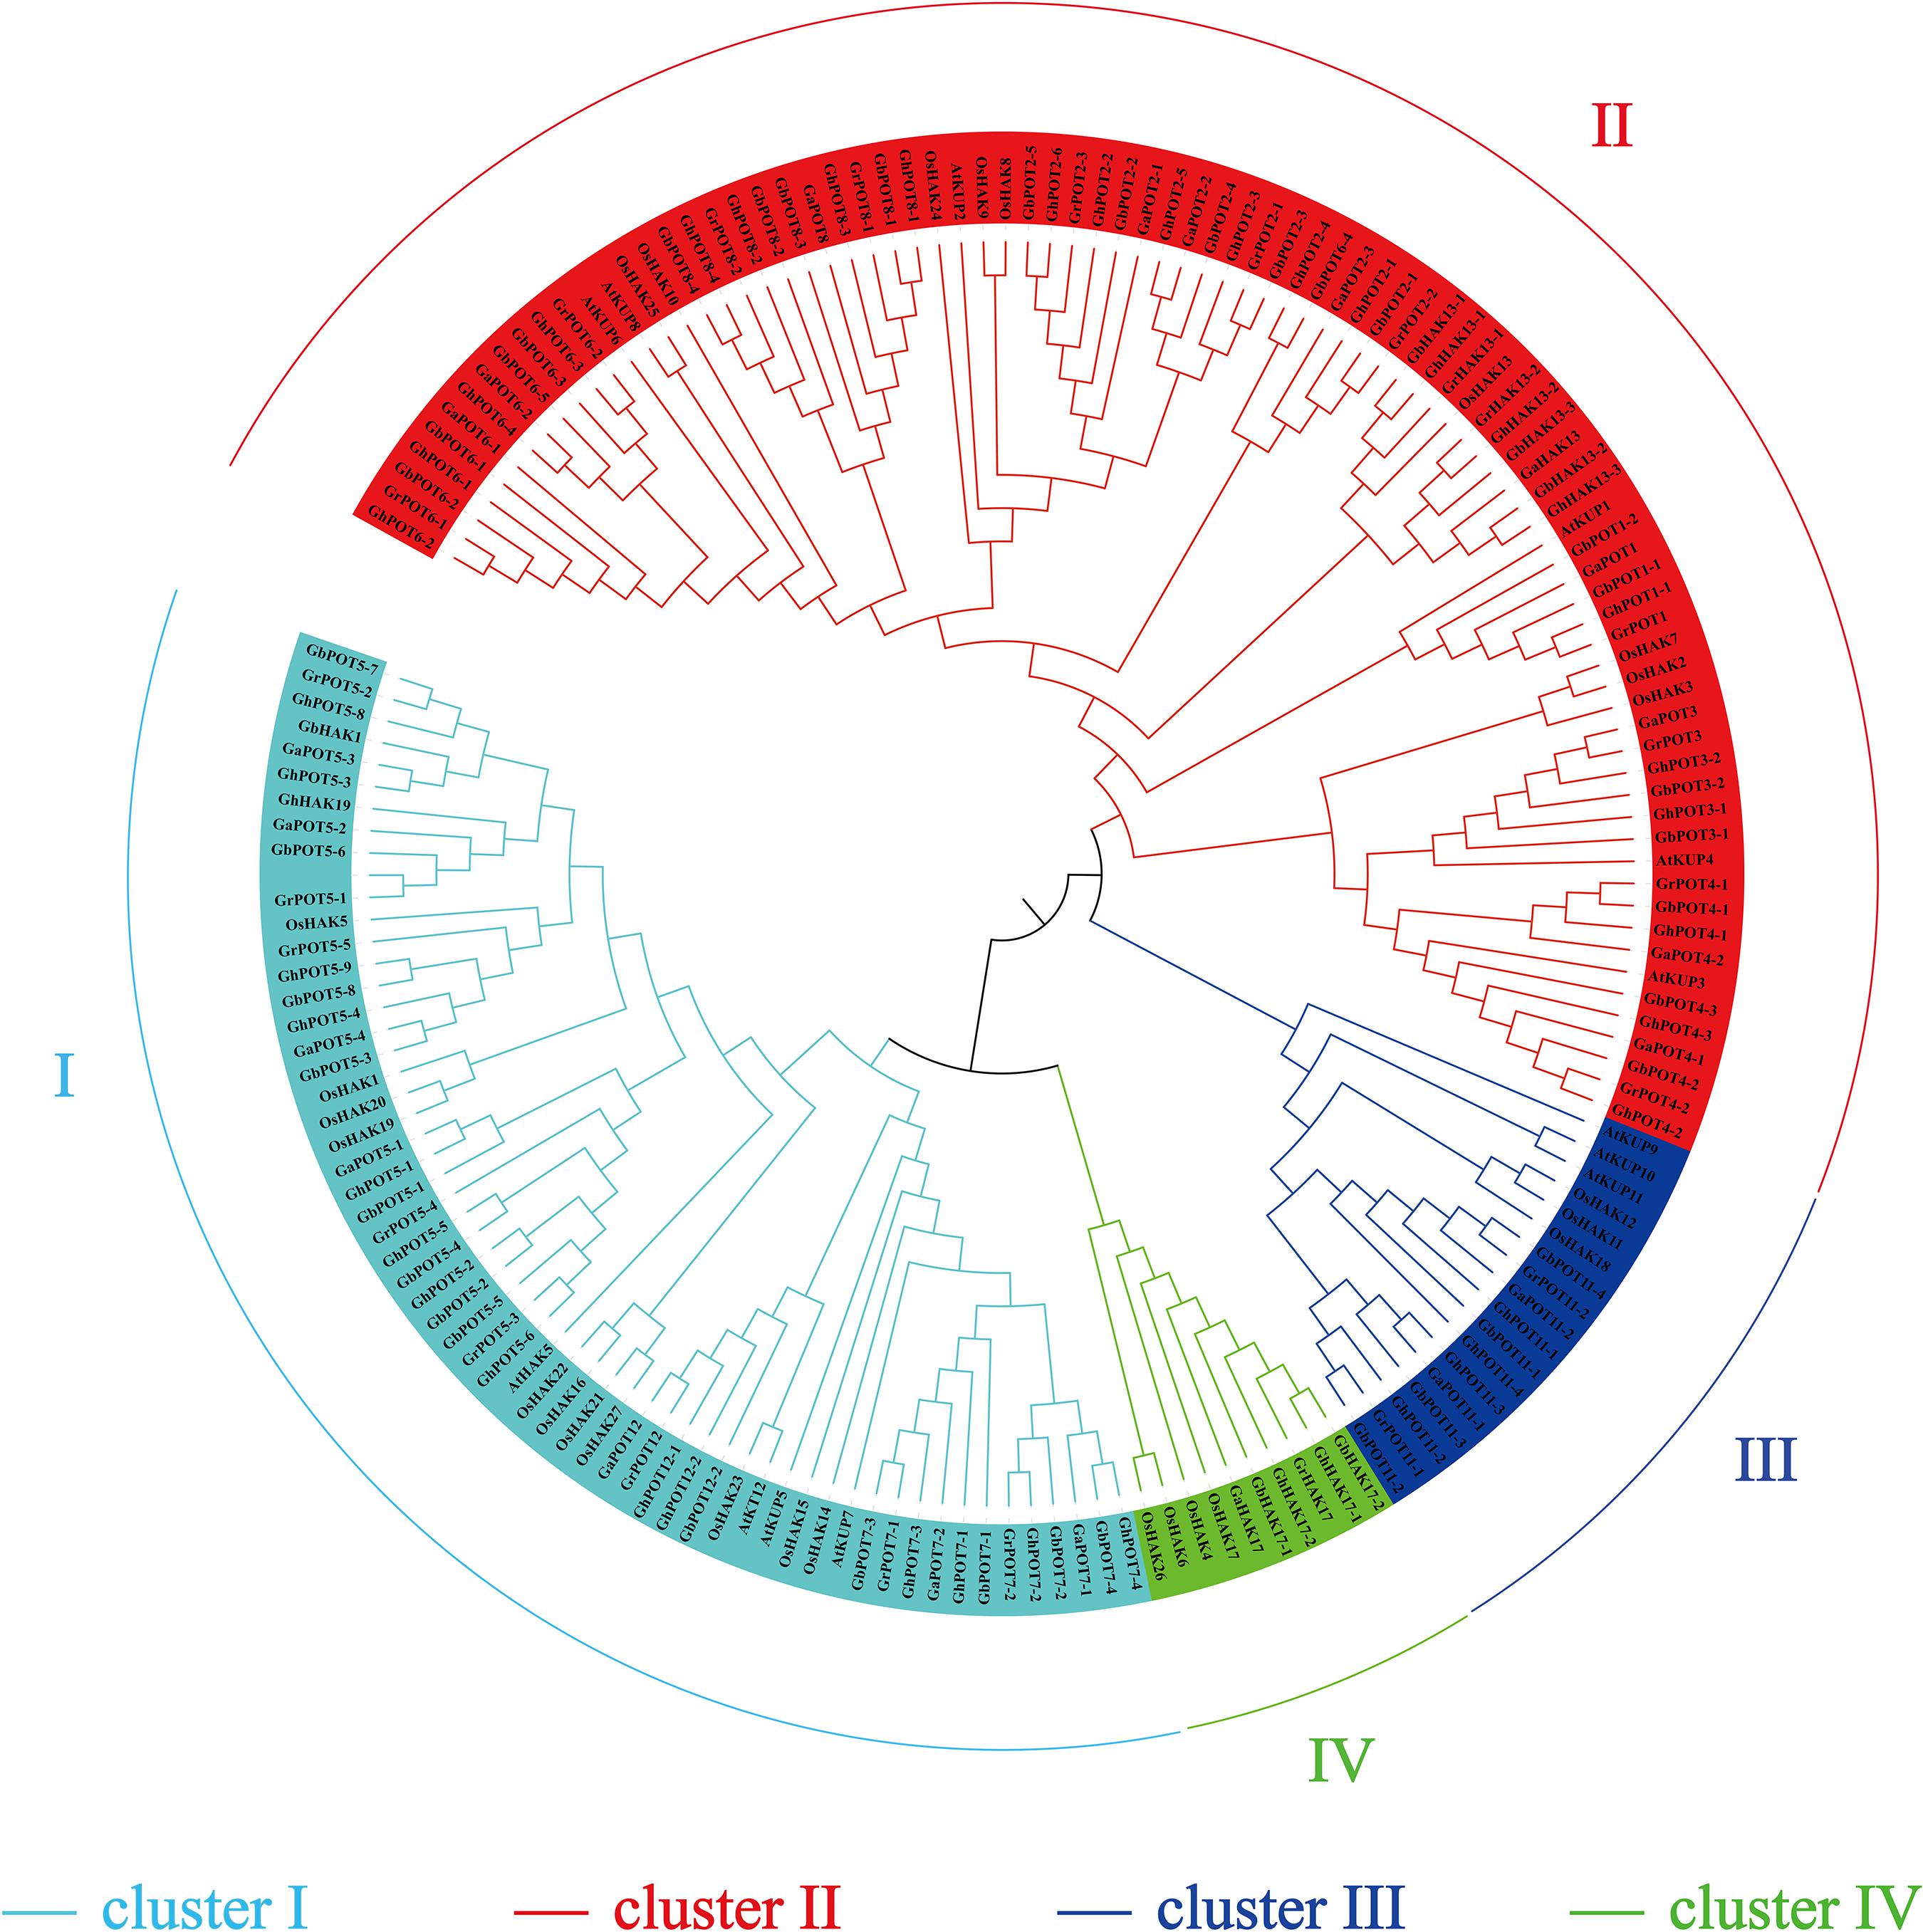
Figure 1. Phylogenetic tree of HAK/KUP/KT proteins. The predicted sequences from O. sativa (27), A. thaliana (13), G. raimondii (24), G. arboretum (21), G. hirsutum (45), and G. barbadense (44) were aligned with ClustalX 2.0, and MEGA 6.0 was used to construct the phylogenetic tree by the neighbor-joining (NJ) method.
A total of 10 motifs was identified by the online program MEME and named motifs 1-10. As shown in Figure 2, almost all the HAK/KUP/KTs contained all the motifs. Only 8 genes (GhPOT6-1, GbPOT8-1, GhPOT2-2, GhPOT1-1, GhHK13-3, GrPOT4-1, GhPOT11-4 and GhPOT7-2) did not contain motif 2, which was found at the beginning of every other sequence. Most genes had two copies of motif 3, except POT3, POT1, POT17, some POT2s, and most POT5s. Five POT7s contained two copies of motif 4 (GbPOT7-4, GhPOT7-4, GaPOT7-1, GbPOT7-2, and GrPOT7-2). Motif 9 was repeated twice in GbPOT11-2, GhPOT11-2, and GrPOT11-1 and three times in GrPOT12, GaPOT12, GhPOT12-1, and GhPOT12-2.
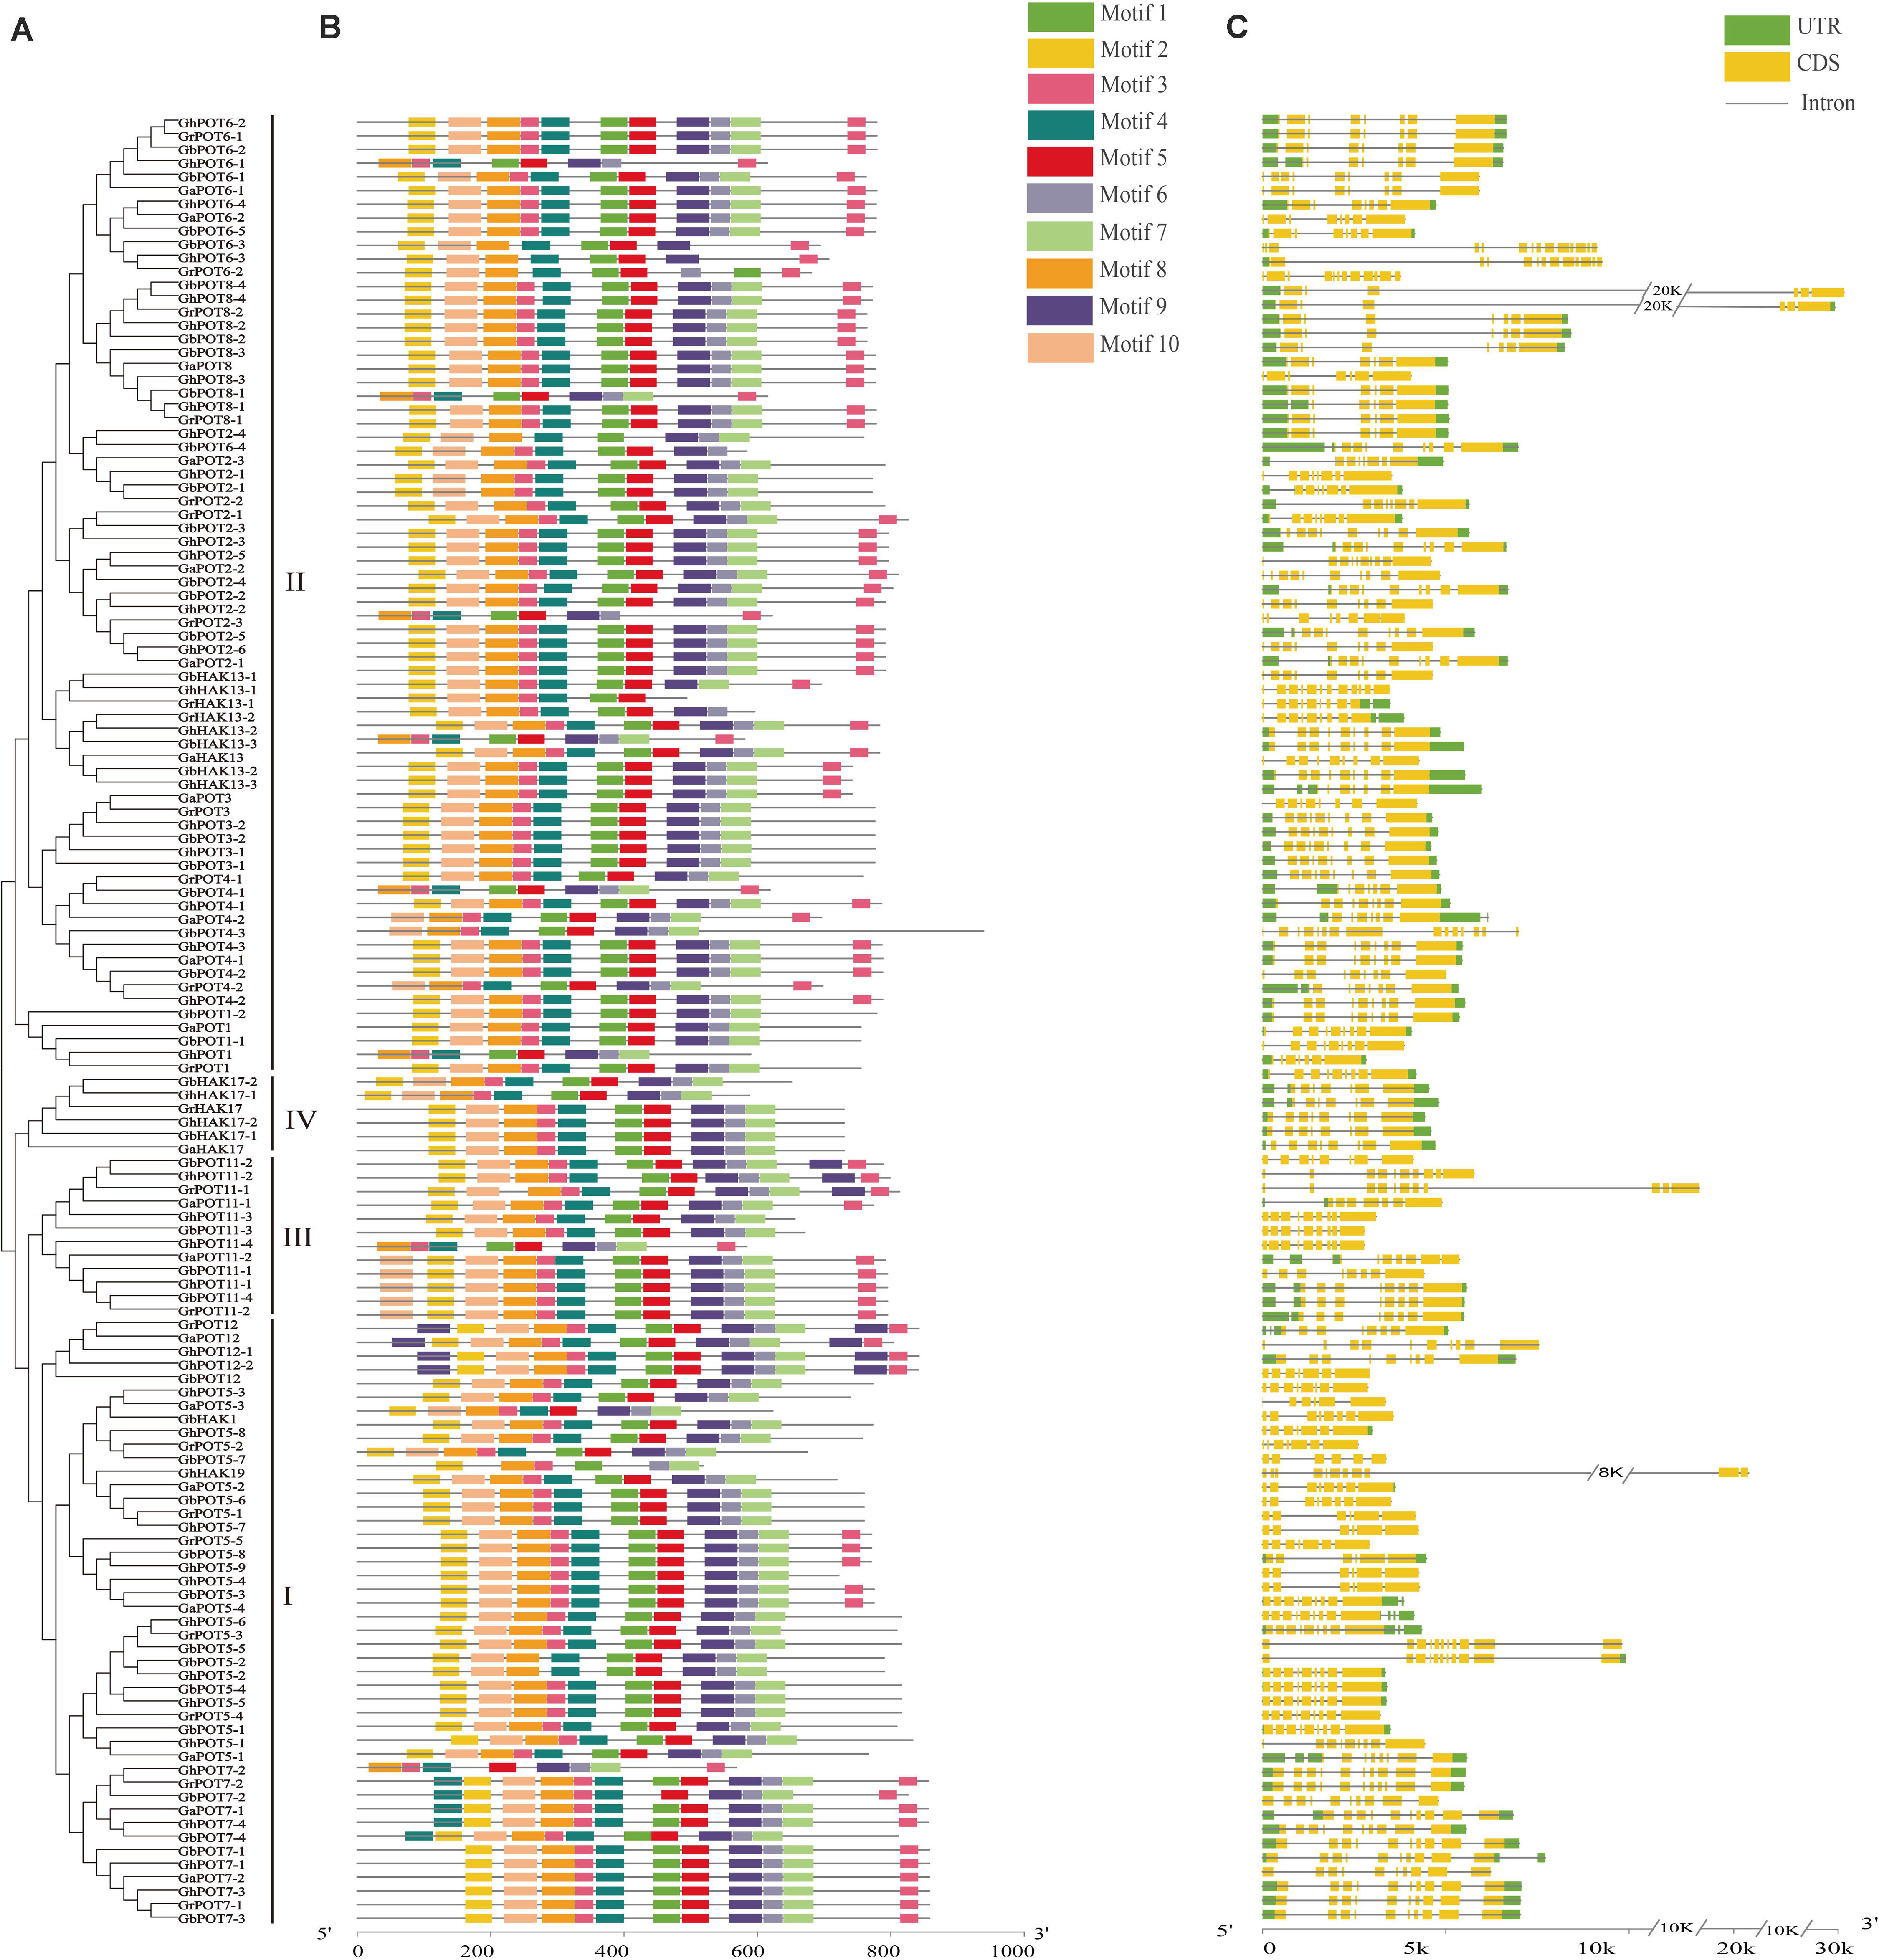
Figure 2. Phylogenetic relationships, motif analysis and exon-intron structures of GrPOTs, GaPOTs, GhPOTs, and GbPOTs. (A) Phylogenetic analysis of 134 HAK/KUP/KT proteins using MEGA 6.0 by the neighbor-joining (NJ) method. I, II, III, and IV were the clusters determined by the phylogenetic analysis. (B) The 10 motifs of 134 HAK/KUP/KT proteins were determined by MEME. Differently colored boxes represent different motifs. (C) Exon–intron structures of 134 HAK/KUP/KT genes. UTRs (untranslated regions), exons, and introns are indicated by green boxes, yellow boxes, and black lines, respectively.
The gene structure was analyzed by GSDS. The results showed that the number of exons per gene ranged from 6 to 15 (Figure 2), but only GrPOT6-2, GhPOT6-3, GbHAK13-1, GbPOT2-1, and GaPOT4-2 contained more than 11 exons. The structures of the genes in different clusters demonstrated different functions, but genes in the same cluster also showed different structures. Almost all the POT6 and POT8 genes in cluster II had 7 or 8 exons, and most other genes in cluster II contained 9 exons. All of the POT7 genes in cluster I had 10 exons, but the other genes in cluster I had 8 or 9 exons.
The HAK/KUP/KT genes were mapped to the chromosomes of the four cotton reference genomes (Figure 3). All the genes were unevenly distributed on the chromosomes, except GbHAK13-3, which was located on Scaffold3708. The results indicated that 23 GhPOTs and GbPOTs were located on At subgenome chromosomes, while 22 GhPOTs and 20 GbPOTs were located on Dt subgenome chromosomes. However, no GhPOTs were located on A06, A07, A08, D06, or D07. G. arboreum had three chromosomes with no HAK/KUP/KT genes (Chr06, Chr07, and Chr09), and G. raimondii had two chromosomes with no HAK/KUP/KT genes (Chr01 and Chr10). Comparing the gene distributions and gene numbers among the four cotton species showed that the chromosome distributions and gene numbers were conserved in the evolution of cotton from diploid to allotetraploid.
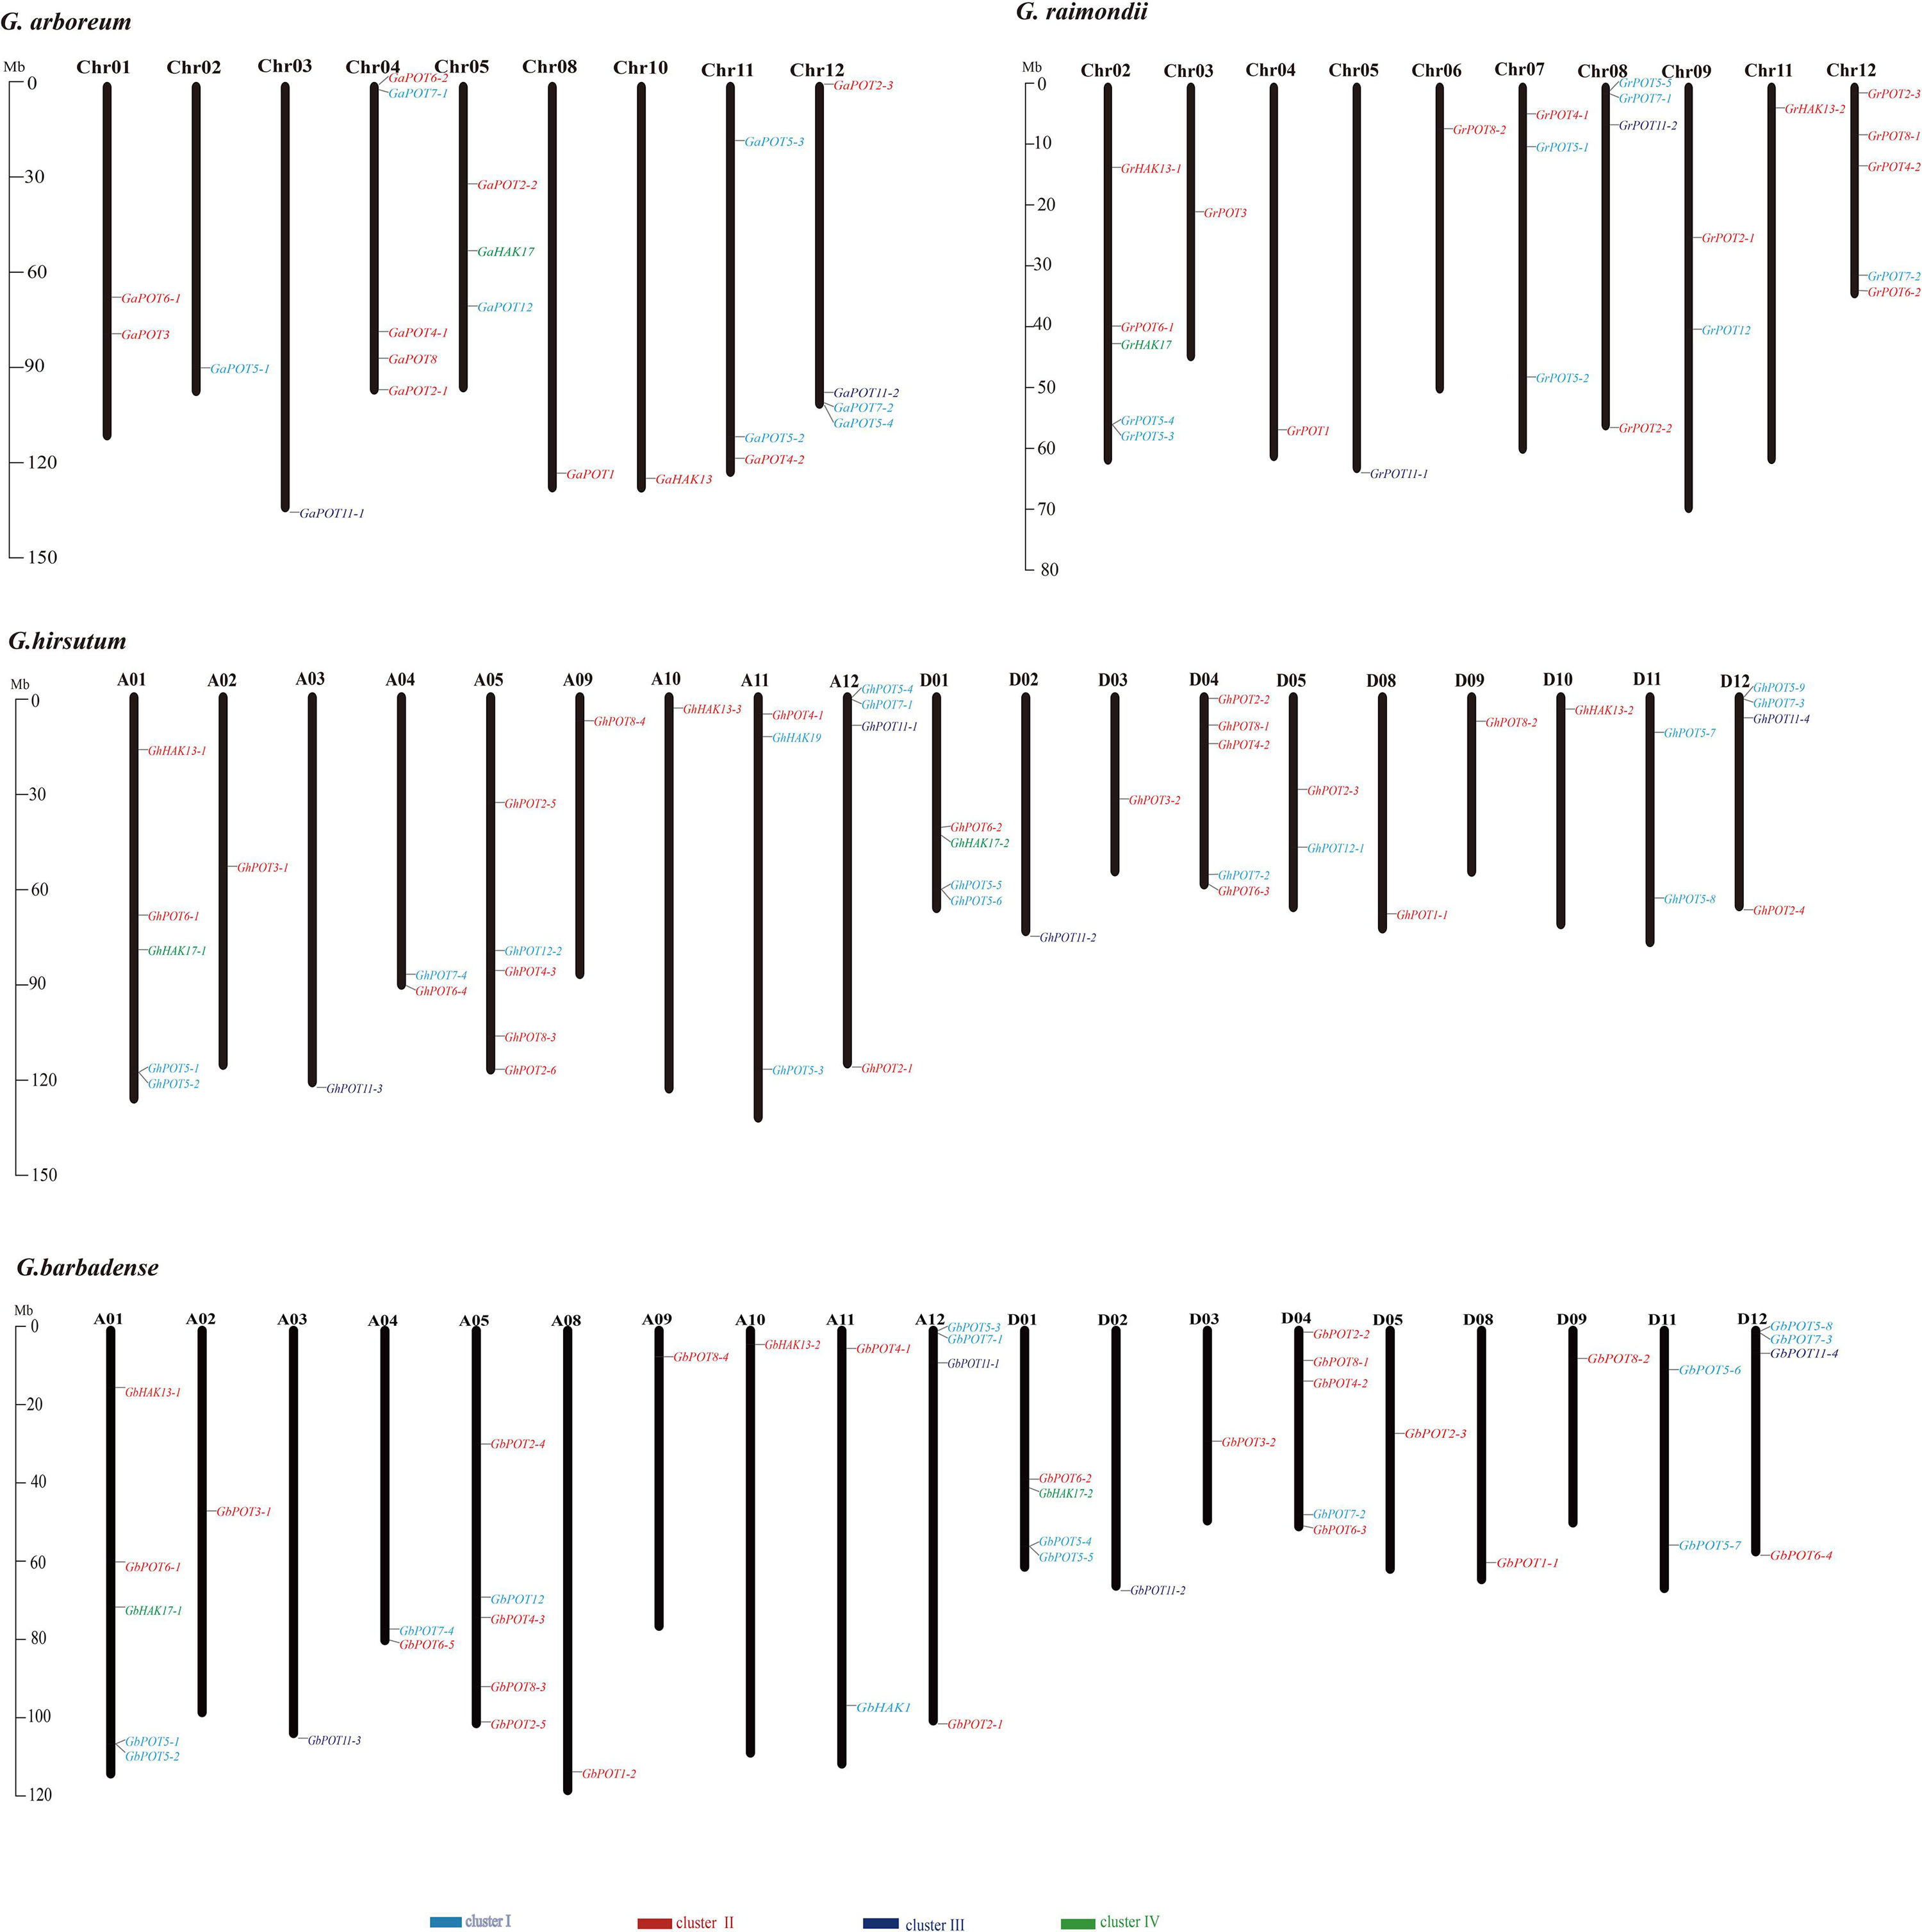
Figure 3. Chromosomal distributions of HAK/KUP/KT genes in G. arboreum, G. raimondii, G. hirsutum, and G. barbadense. The chromosome number is indicated above each vertical bar representing one chromosome. The gene names are indicated on the right side. The HAK/KUP/KTs in each cluster are shown in the same color. The lengths of the chromosomes are shown in Mb (millions of bases).
To analyze the possible factors influencing the expression patterns of GhPOT gene family members, the 2000-bp sequences upstream of the transcription initiation sites of cotton HAK/KUP/KT genes were used for the prediction of cis-regulatory elements (Figure 4). The main stress elements were STRE, ABRE (ABA), MYB, TC-rich repeats (defense and stress response), MBS (drought), LTR (low-temperature response), and DRE. Notably, ABRE, MYB and DRE are all drought-relative responsive elements. The promoters of some GhPOTs, such as GhPOT5-2 (2 ABRE, 1 MBS, and 8 MYB), GhPOT5-6 (1 MBS and 11 MYB), and GhPOT2-2 (2 ABRE, 1 DRE, 2 MBS, and 7 MYB), contained many drought-responsive elements. In addition, the GhPOTs contained other specific cis-regulatory elements (Supplementary Table S3), for example, cell cycle regulation (GhPOT4-1), seed-specific regulation (GhPOT11-3, GhPOT5-3, GhPOT1-1 and GhPOT5-9), meristem expression (GhPOT11-3, GhPOT2-5, GhPOT2-6, GhPOT11-1, GhPOT2-1, GhPOT6-2, GhPOT5-6, GhPOT2-2, GhPOT2-3 and GhPOT2-4) and circadian control (GhPOT2-6, GhPOT8-4, GhPOT5-4, GhPOT11-1, GhPOT5-6, GhPOT2-2, GhPOT4-2, GhPOT6-3, GhPOT12-1, GhPOT8-2 and GhPOT5-9). Figure 4 and Supplementary Table S4 show that the ABRE and MBS elements were enriched in the proximal region of the promoter from TSS, and DRE and TC-rich were enriched in the distal region of the promoter from TSS.
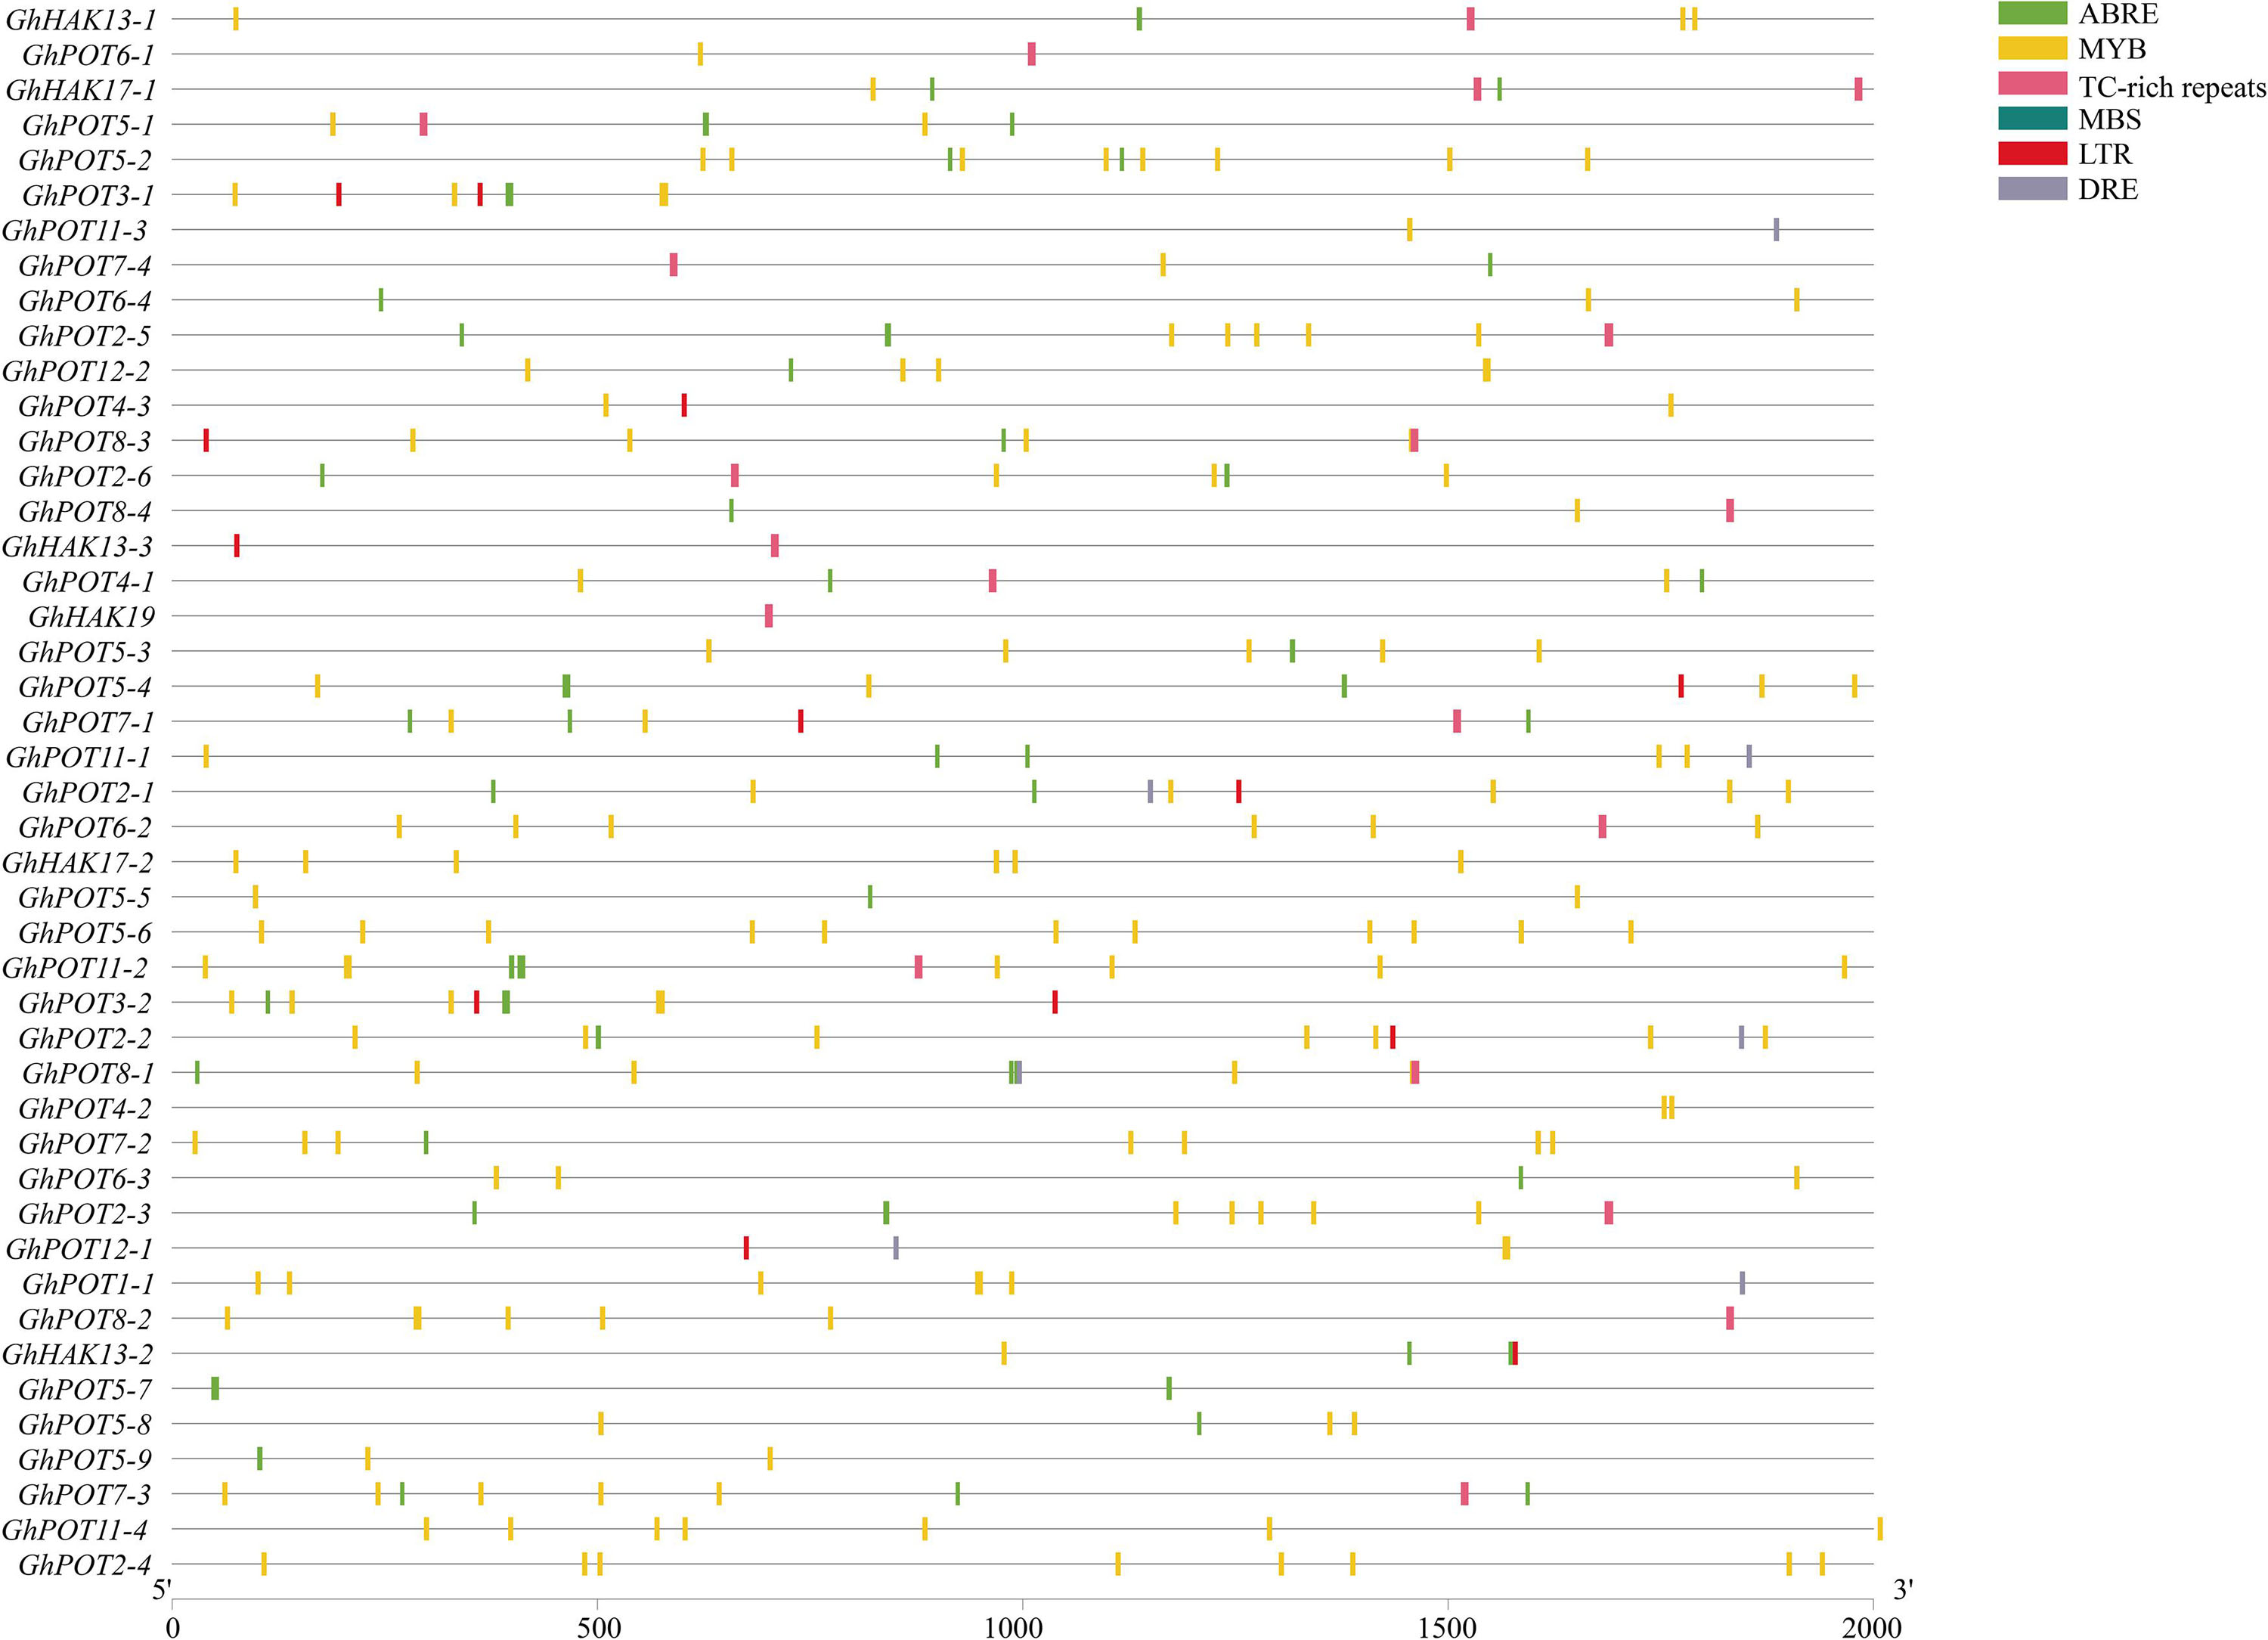
Figure 4. Distribution of major stress-related cis-elements in the promoter regions of GhPOTs. The locations of these cis-elements were confirmed using the PlantCARE database. Different cis-elements are represented by boxes of different colors.
Publicly available RNA-seq databases were used to analyze the expression patterns of GhPOT genes in cotton roots, leaves, stems, ovules from -3 DPA (days postanthesis) to 5 DPA and fibers from 10 DPA to 25 DPA. The genes in cluster I showed significantly specific expression in different tissues. GhPOT5-1, GhPOT5-5, GhPOT5-4, and GhPOT5-9 were highly expressed in roots, while almost no expression was observed in other tissues. GhPOT5-2 and GhPOT5-8 were highly expressed in 25 DPA fibers and had no expression in other fiber development stages and tissues. Most GhPOTs in clusters II, III and IV had different expression levels in different tissues. Figure 5 shows that most of the genes in clusters II and III were highly expressed in different fiber development stages. The 6 GhPOT2 genes and 4 GhPOT8 genes in cluster II were highly expressed in 20∼25 DPA fibers, which correspond to secondary cell wall biosynthesis. Two GhPOT7 genes in cluster I (GhPOT7-2 and GhPOT7-4) and 2 GhPOT12 genes in cluster III were highly expressed in the -3∼1 DPA samples. GhPOT7-1 and GhPOT7-3 were highly expressed in fibers from 5 to 20 DPA, and GhPOT11-2 and GhPOT11-3 were specifically expressed in fibers from 10 to 20 DPA.
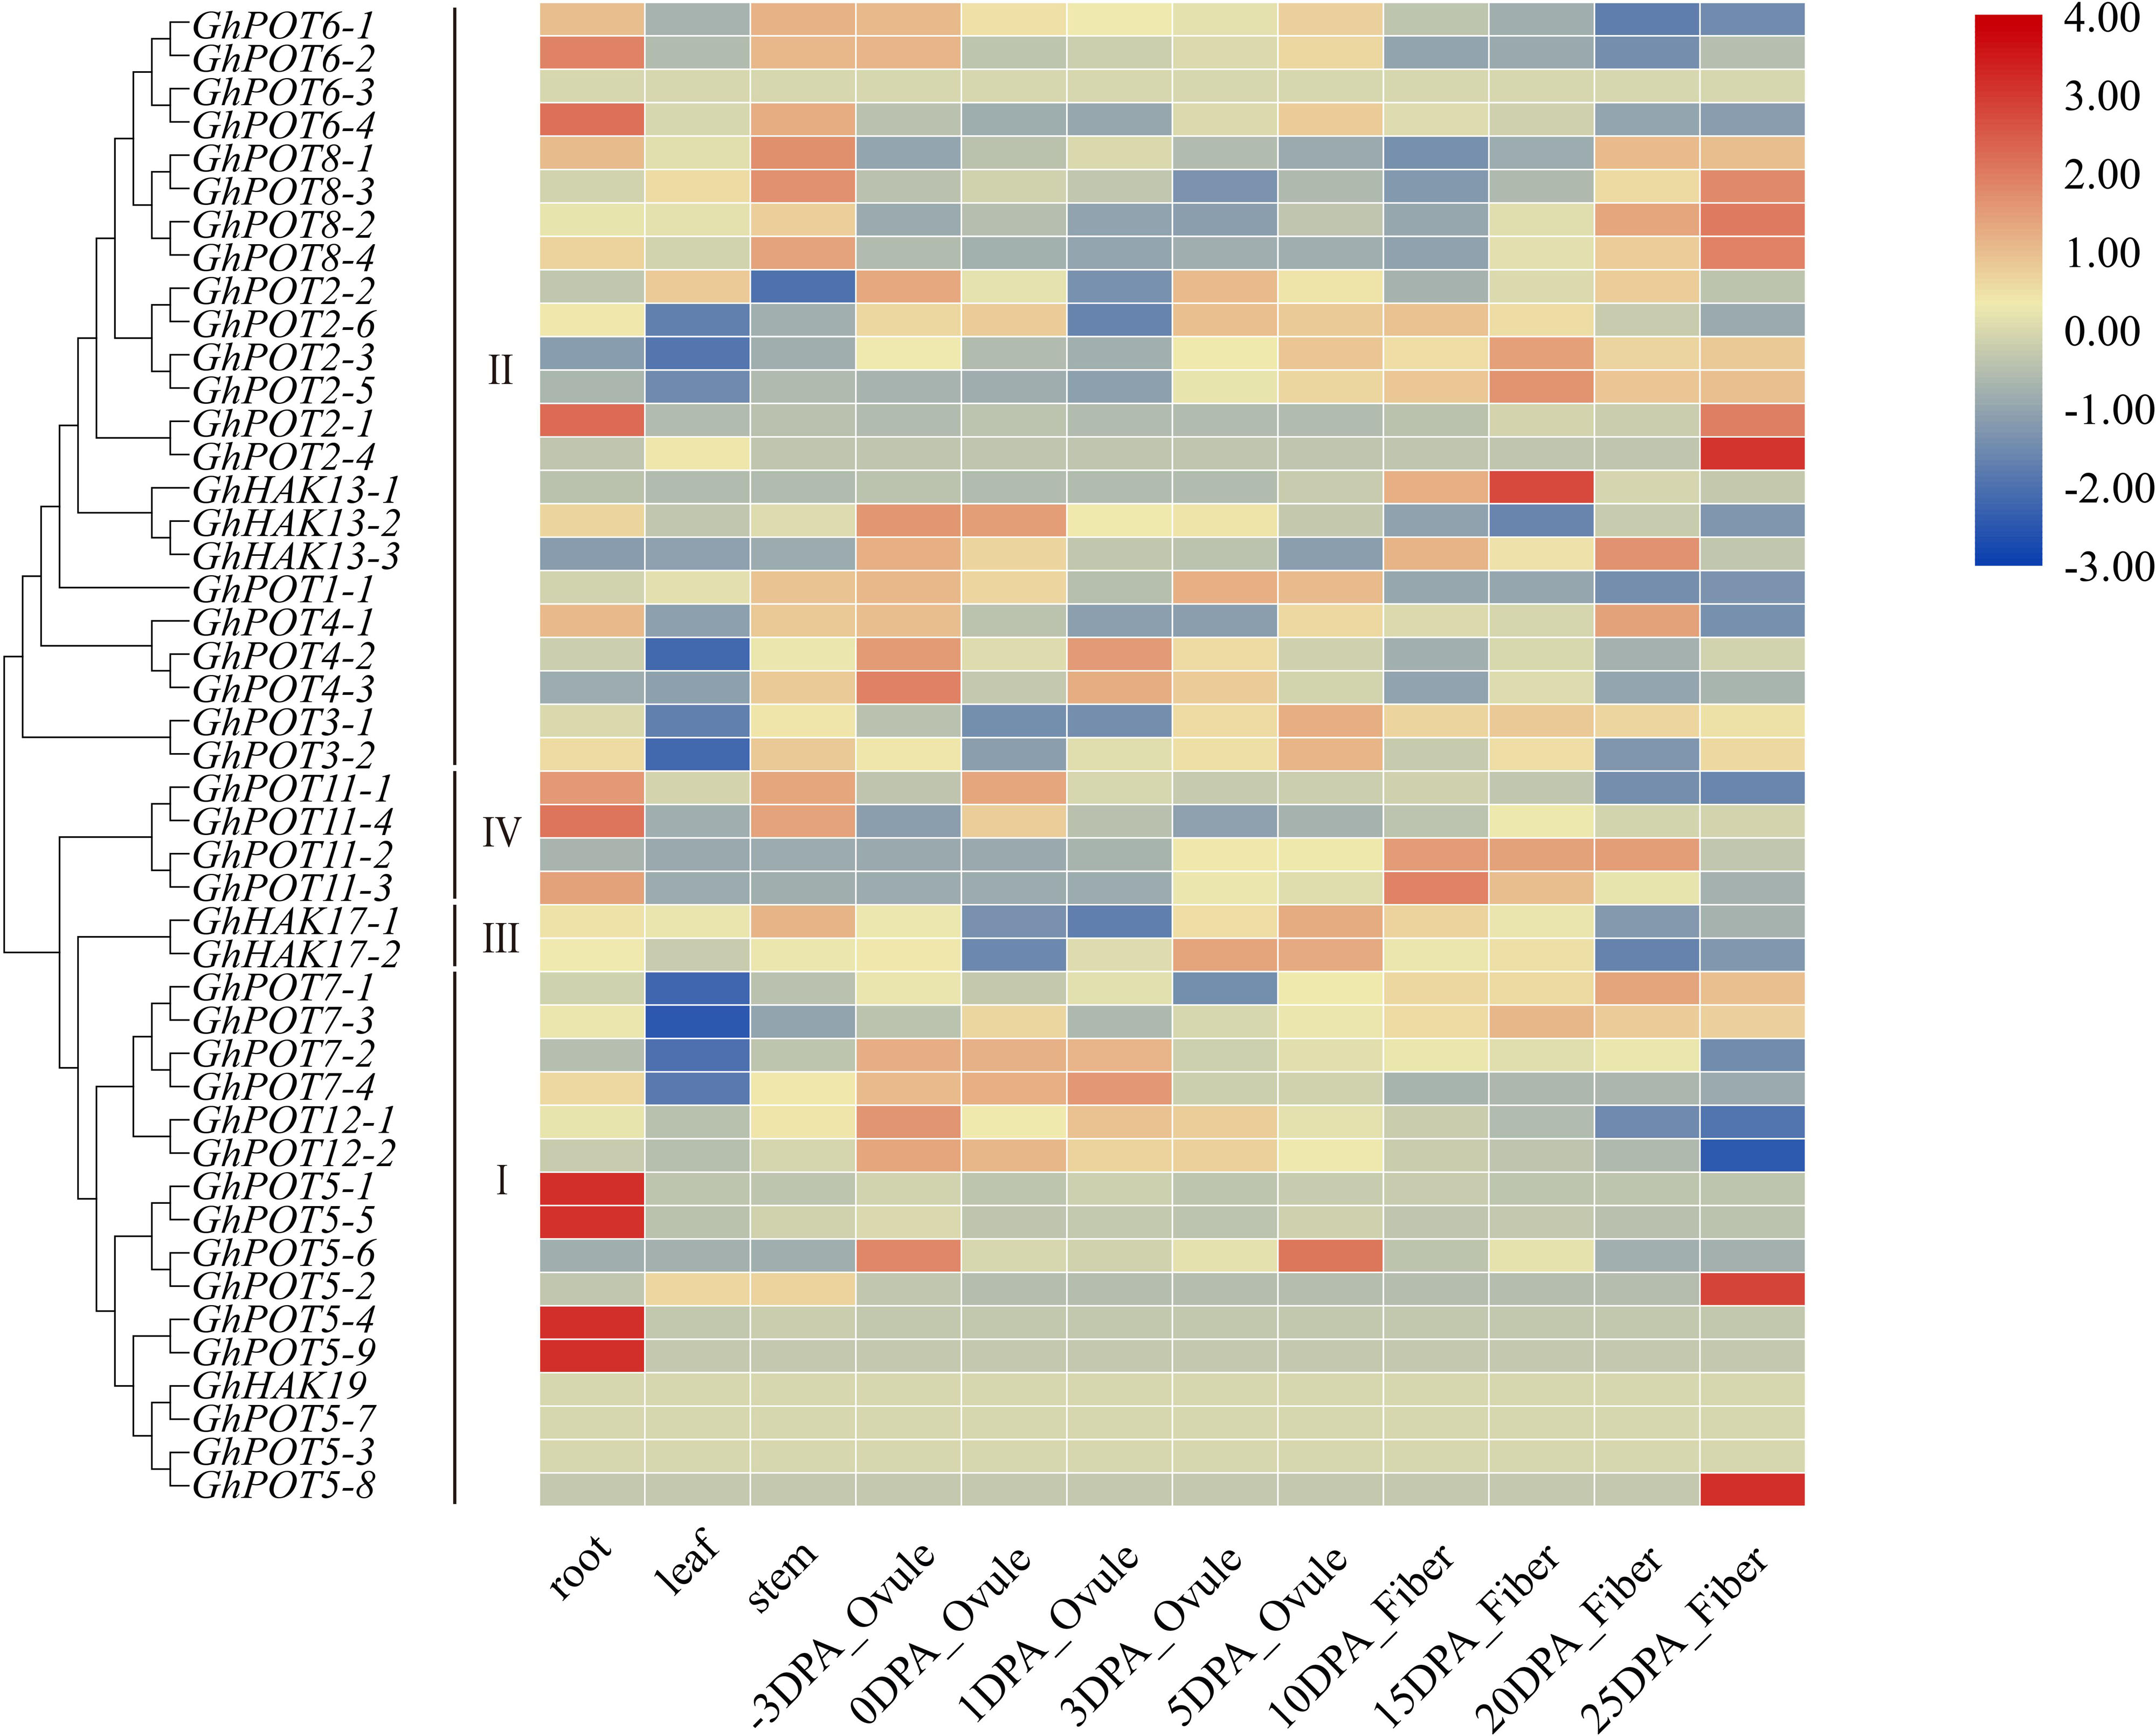
Figure 5. Transcriptome data of GhPOTs in different tissues. DPA indicates days postanthesis. Gene names are shown on the left. The scale bar on the right shows the colors used to represent the log2-transformed FPKM values for each gene.
During 24 h of drought and salt stress, most genes showed different expression levels and expression patterns (Figure 6), but some genes in the same subfamilies showed the same expression patterns. GhPOT6 and GhPOT4 were highly expressed after 6 h PEG treatment. GhPOT3, GhPOT11, and GhPOT7 were highly expressed after 12 h PEG treatment. After 12 h NaCl treatment, the expressions of 7 genes increased to a maximum, and the expressions of 6 genes decreased to a minimum. From the transcriptome analysis, almost all the HAK/KUP/KT genes were upregulated, while GhHAK17-2 was downregulated after salt stress.
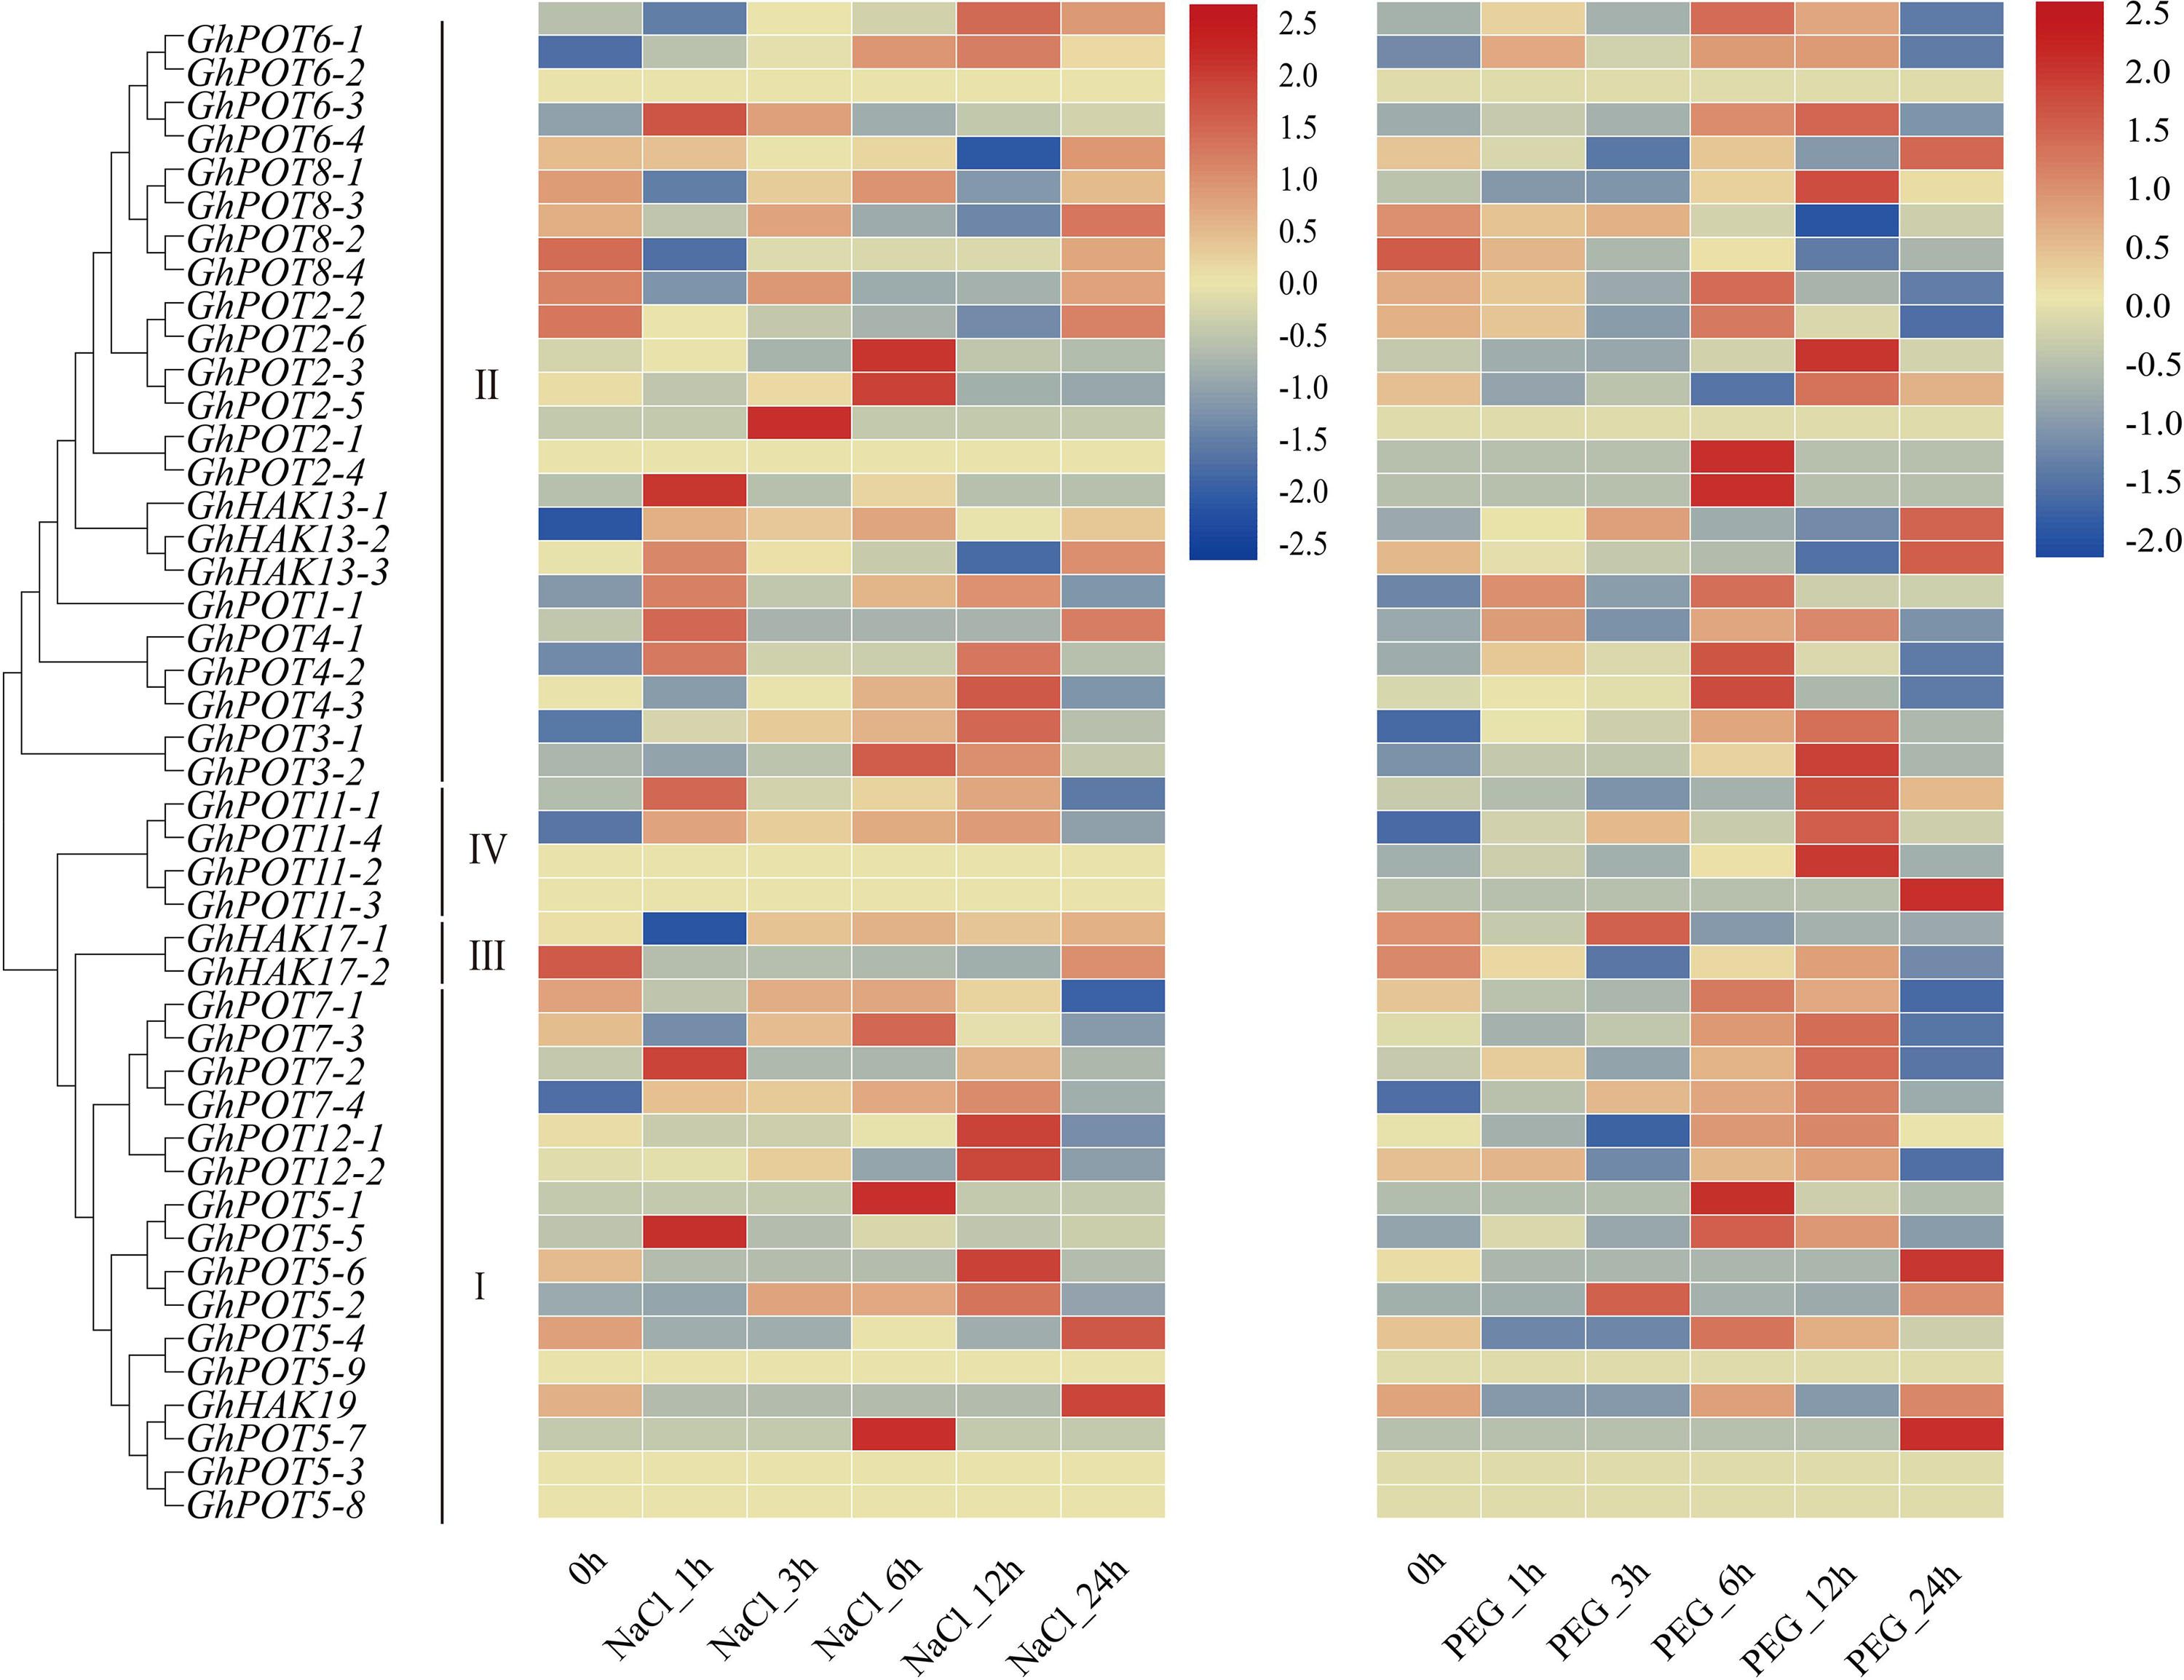
Figure 6. Transcriptome data of GhPOTs in response to NaCl and PEG stresses. The treatments are shown at the bottom, and the genes and phylogenetic relationships are shown on the left. The scale bar on the right shows the colors used to represent the log2-transformed FPKM values for each gene.
To investigate the possible functions of HAK/KUP/KT in fiber development, we selected 6 genes, which showed high expression levels in different fiber development stages in the transcriptome data (Figure 5) to examine their expression patterns. The results (Figure 7) showed that different genes had different expression patterns. The expression level of GhHAK4-3 was high in each period of fiber synthesis (especially 0 DPA ovule), except in 10 DPA fiber. GhPOT12-2 was significantly expressed in 0 DPA ovules, which is the initiation stage in fiber development. GhPOT11-3 and GhHAK13-1 were highly expressed in 5 and 10 DPA fibers, which are the expansion stages in fiber development. GhPOT2-4 and GhPOT8-2 were highly expressed in 20 and 25 DPA fibers, which are the secondary wall synthesis stages in fiber development.
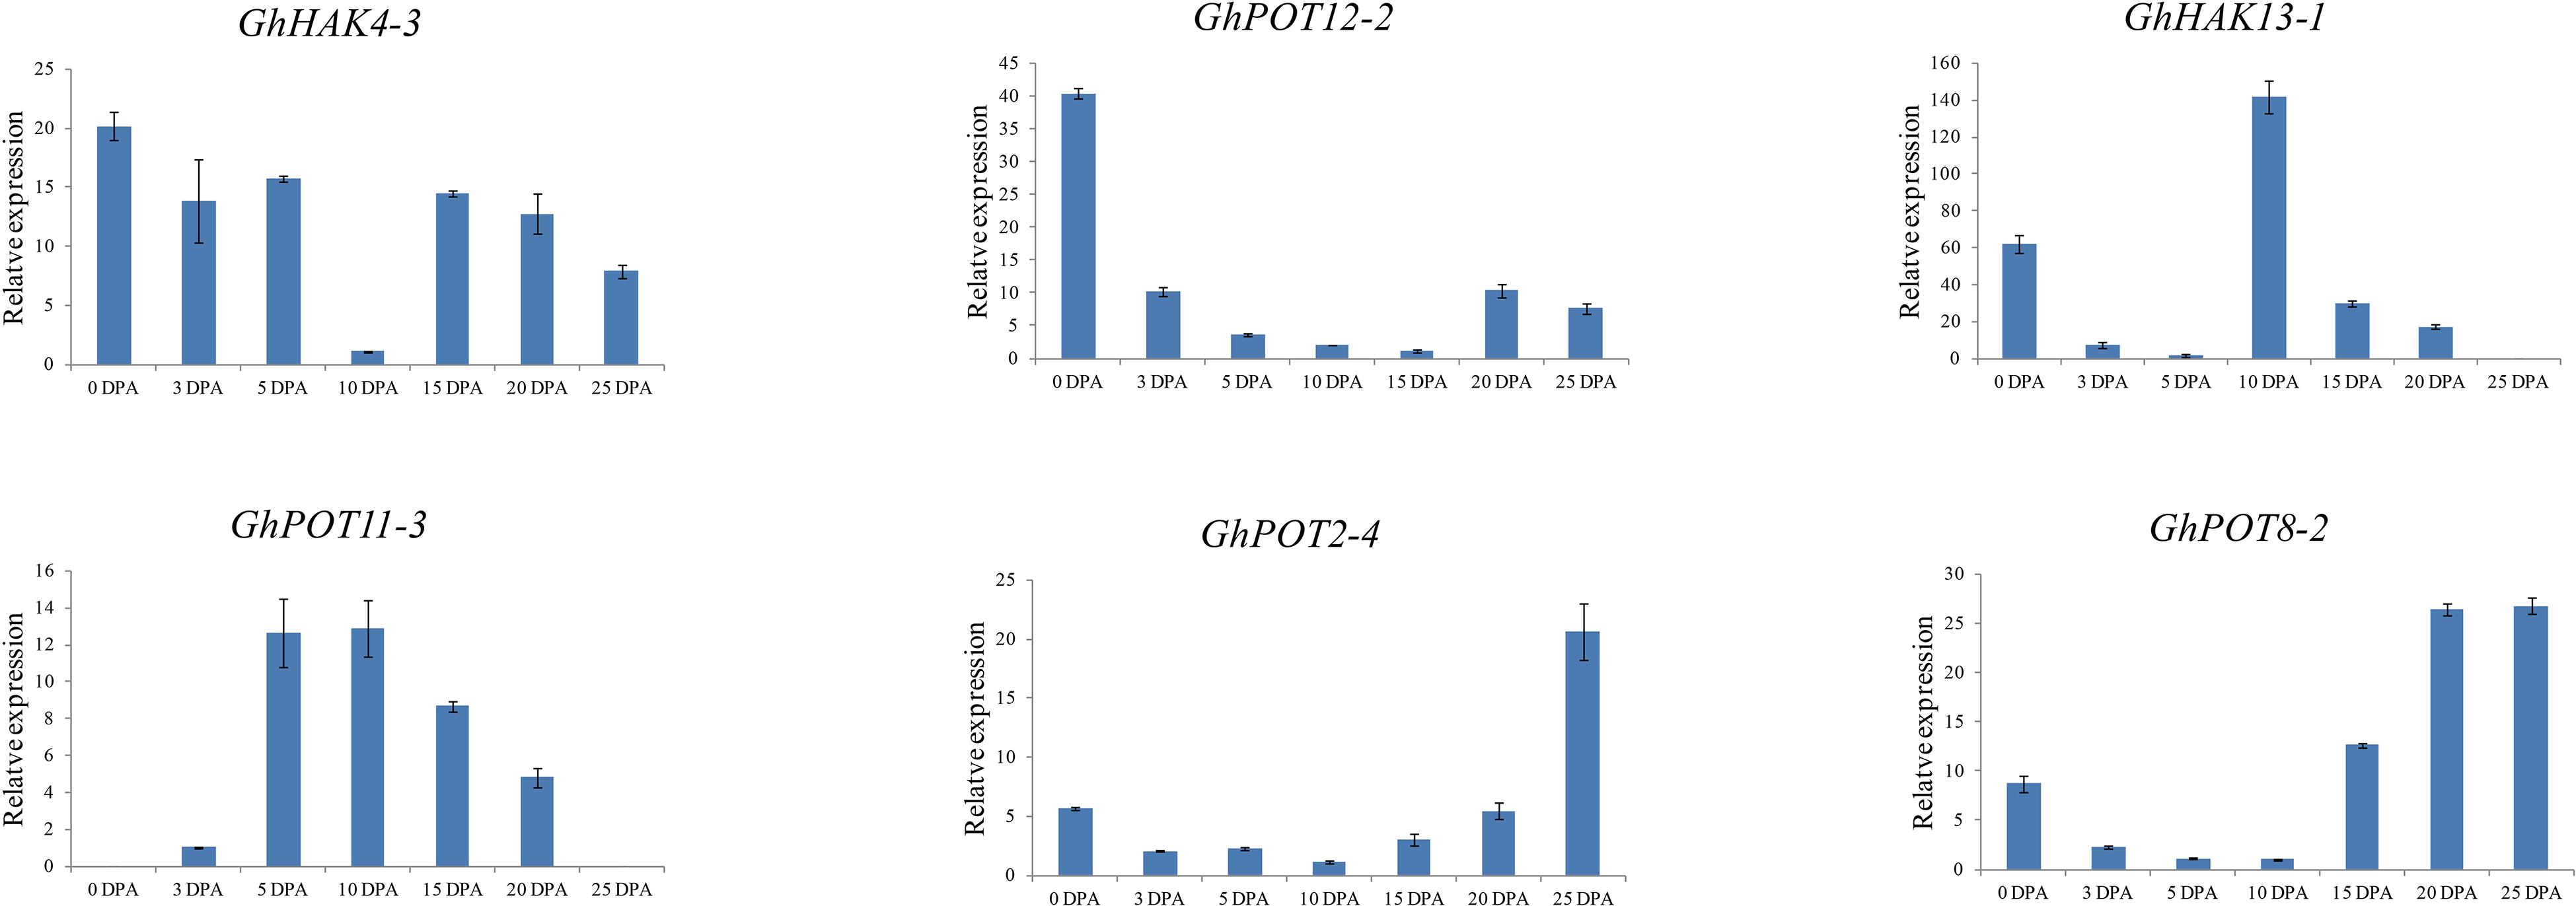
Figure 7. Expressions of GhPOT genes in different fiber development stages. The expressions of the GhPOT genes were determined by qRT-PCR using the total RNA isolated from TM-1 fiber. The error bars indicate the standard error (SE) of three biological replicates. DPA (days post anthesis) is the sampling period.
According to the analysis of cis-elements in promoter regions and previous studies of HAK/KUP/KTs in other plants, GhPOTs might be involved in stress responses. To verify this hypothesis, 12 GhPOTs were selected for qRT-PCR under K+ defiency, salt and drought treatments. The results revealed that all 12 GhPOTs could be induced by all three stresses to different degrees.
As shown in Figures 8, 6, random selected genes were examined under potassium deficiency stress, and all showed basically the same expression pattern—after potassium deficiency treatment, the expression was upregulated for a few hours and then downregulated. GhPOT1-1 and GhPOT3-2 precisely followed this pattern, arriving at their peaks at 9 h and 12 h, respectively. GhHAK13-3 and GhPOT2-5, showed upregulated expressions after the basic pattern and reached their maximum expression levels at 48 h. Although GhPOT8-2 was downregulated after treatment, the maximum value was reached at 24 h after treatment, and its change trend followed the pattern.
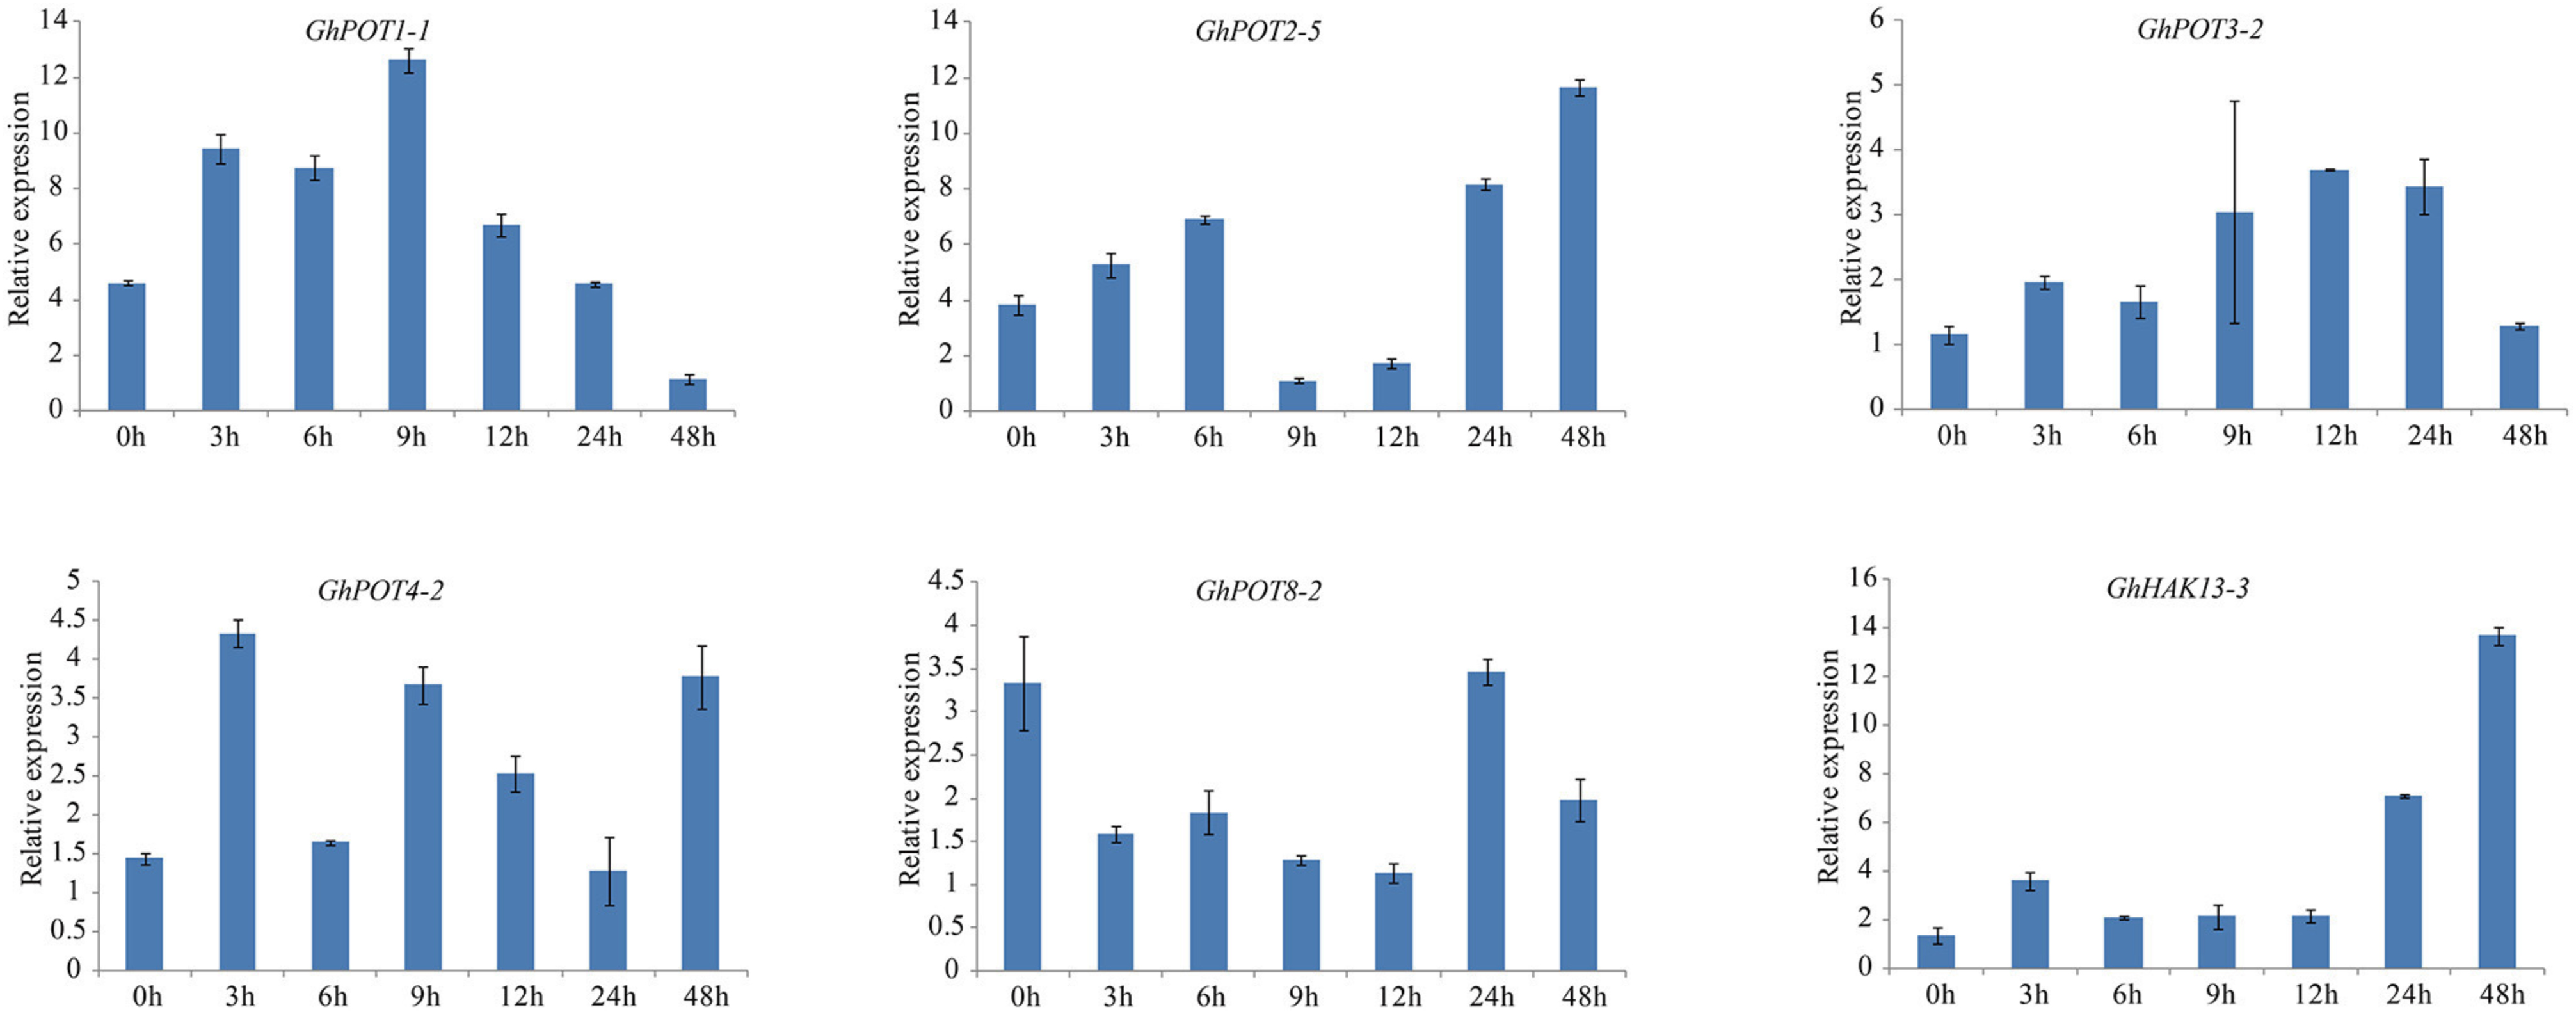
Figure 8. Expressions of GhPOT genes in response to potassium deficiency stress (0.03 mM KCl). The expressions of the GhPOT genes were determined by qRT-PCR using the total RNA isolated from TM-1 leaves at different time points (0, 3, 6, 9, 12, 24 and 48 h) of dehydration stress. The error bars indicate the standard error (SE) of three biological replicates.
Additionally, 6 genes that showed high expressions after PEG treatment according to transcriptome data were selected for the drought treatment. Under dehydration stress simulated by 18% PEG6000, all GhPOT genes were upregulated, albeit to different levels at different times (Figure 9). GhPOT1-1, GhPOT4-2 and GhPOT5-2 were all significantly upregulated. In particular, GhPOT1-1 and GhPOT5-2 responded rapidly to dehydration, and their expressions reached a maximum after 3 h of stress. Comparatively, GhPOT2-5, GhPOT8-3, and GhPOT12-1 were moderately upregulated. GhPOT4-2, GhPOT8-3 and GhPOT12-1 showed the same change trend—their expression levels were immediately downregulated at 3 h after treatment and then oscillated.
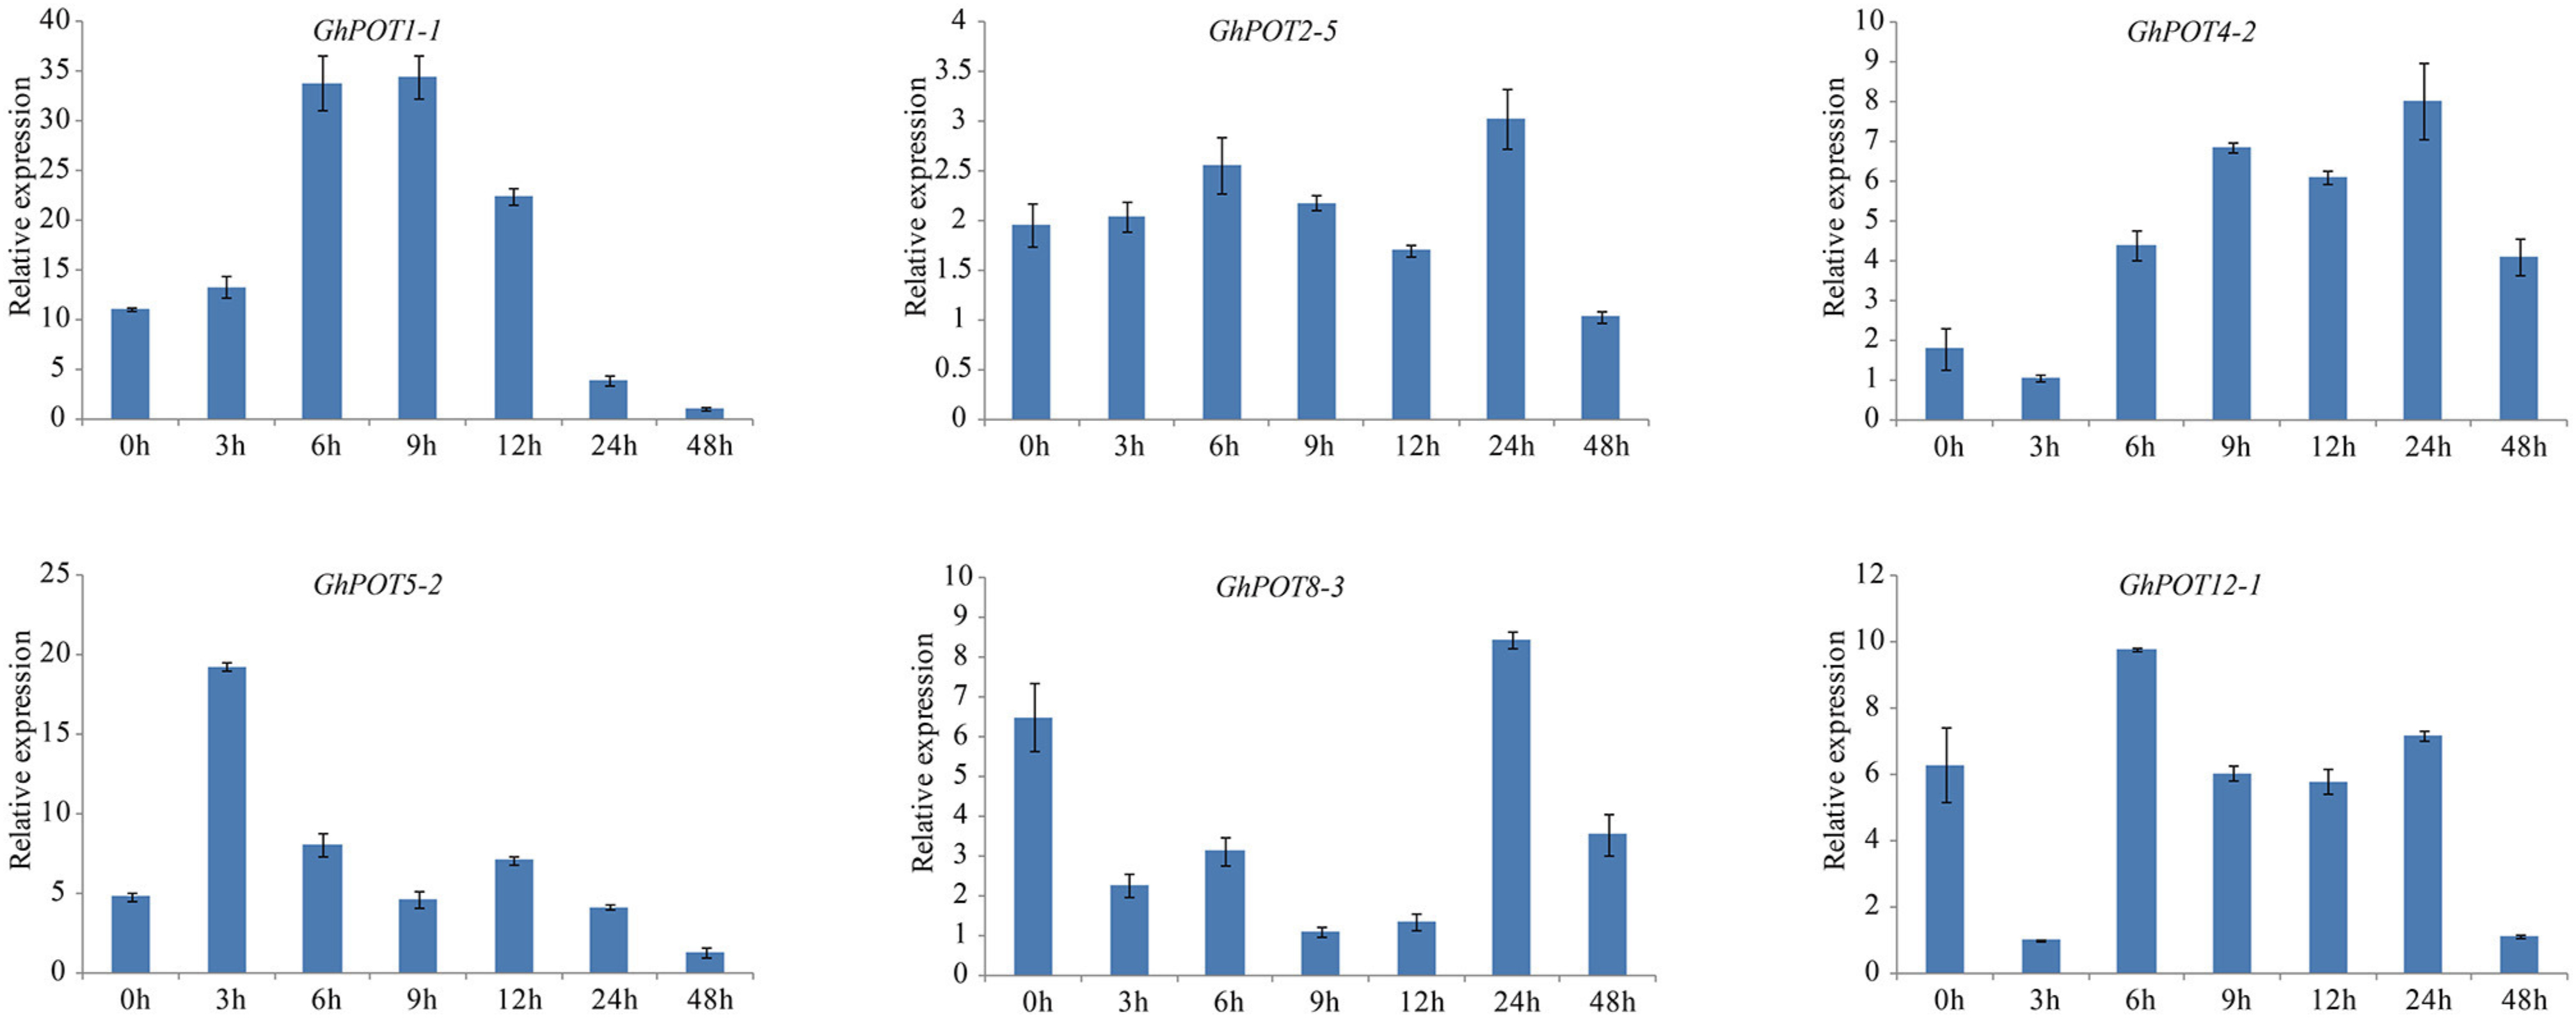
Figure 9. Expressions of GhPOT genes in response to dehydration stress (18% PEG6000). The expressions of GhPOT genes were determined by qRT-PCR using the total RNA isolated from TM-1 leaves at different time points (0, 3, 6, 9, 12, 24 and 48 h) of salt stress. The error bars indicate the standard error (SE) of three biological replicates.
For the salt treatment, 6 genes that were highly expressed after NaCl treatment according to NaCl transcriptome data were used. After treatment with 300 mM NaCl, the expression levels of the 6 selected genes were all upregulated (Figure 10). However, GhHAK13-3 was not upregulated initially. Instead, it was continuously downregulated until 12 h of treatment. The response of GhHAK13-3 to stress was slower, and its upregulation became obvious after 24 h of stress. GhPOT3-2, GhPOT6-4, GhPOT7-4, and GhPOT1-1 showed significantly reduced expression levels after 48 h of exposure to salt stress.
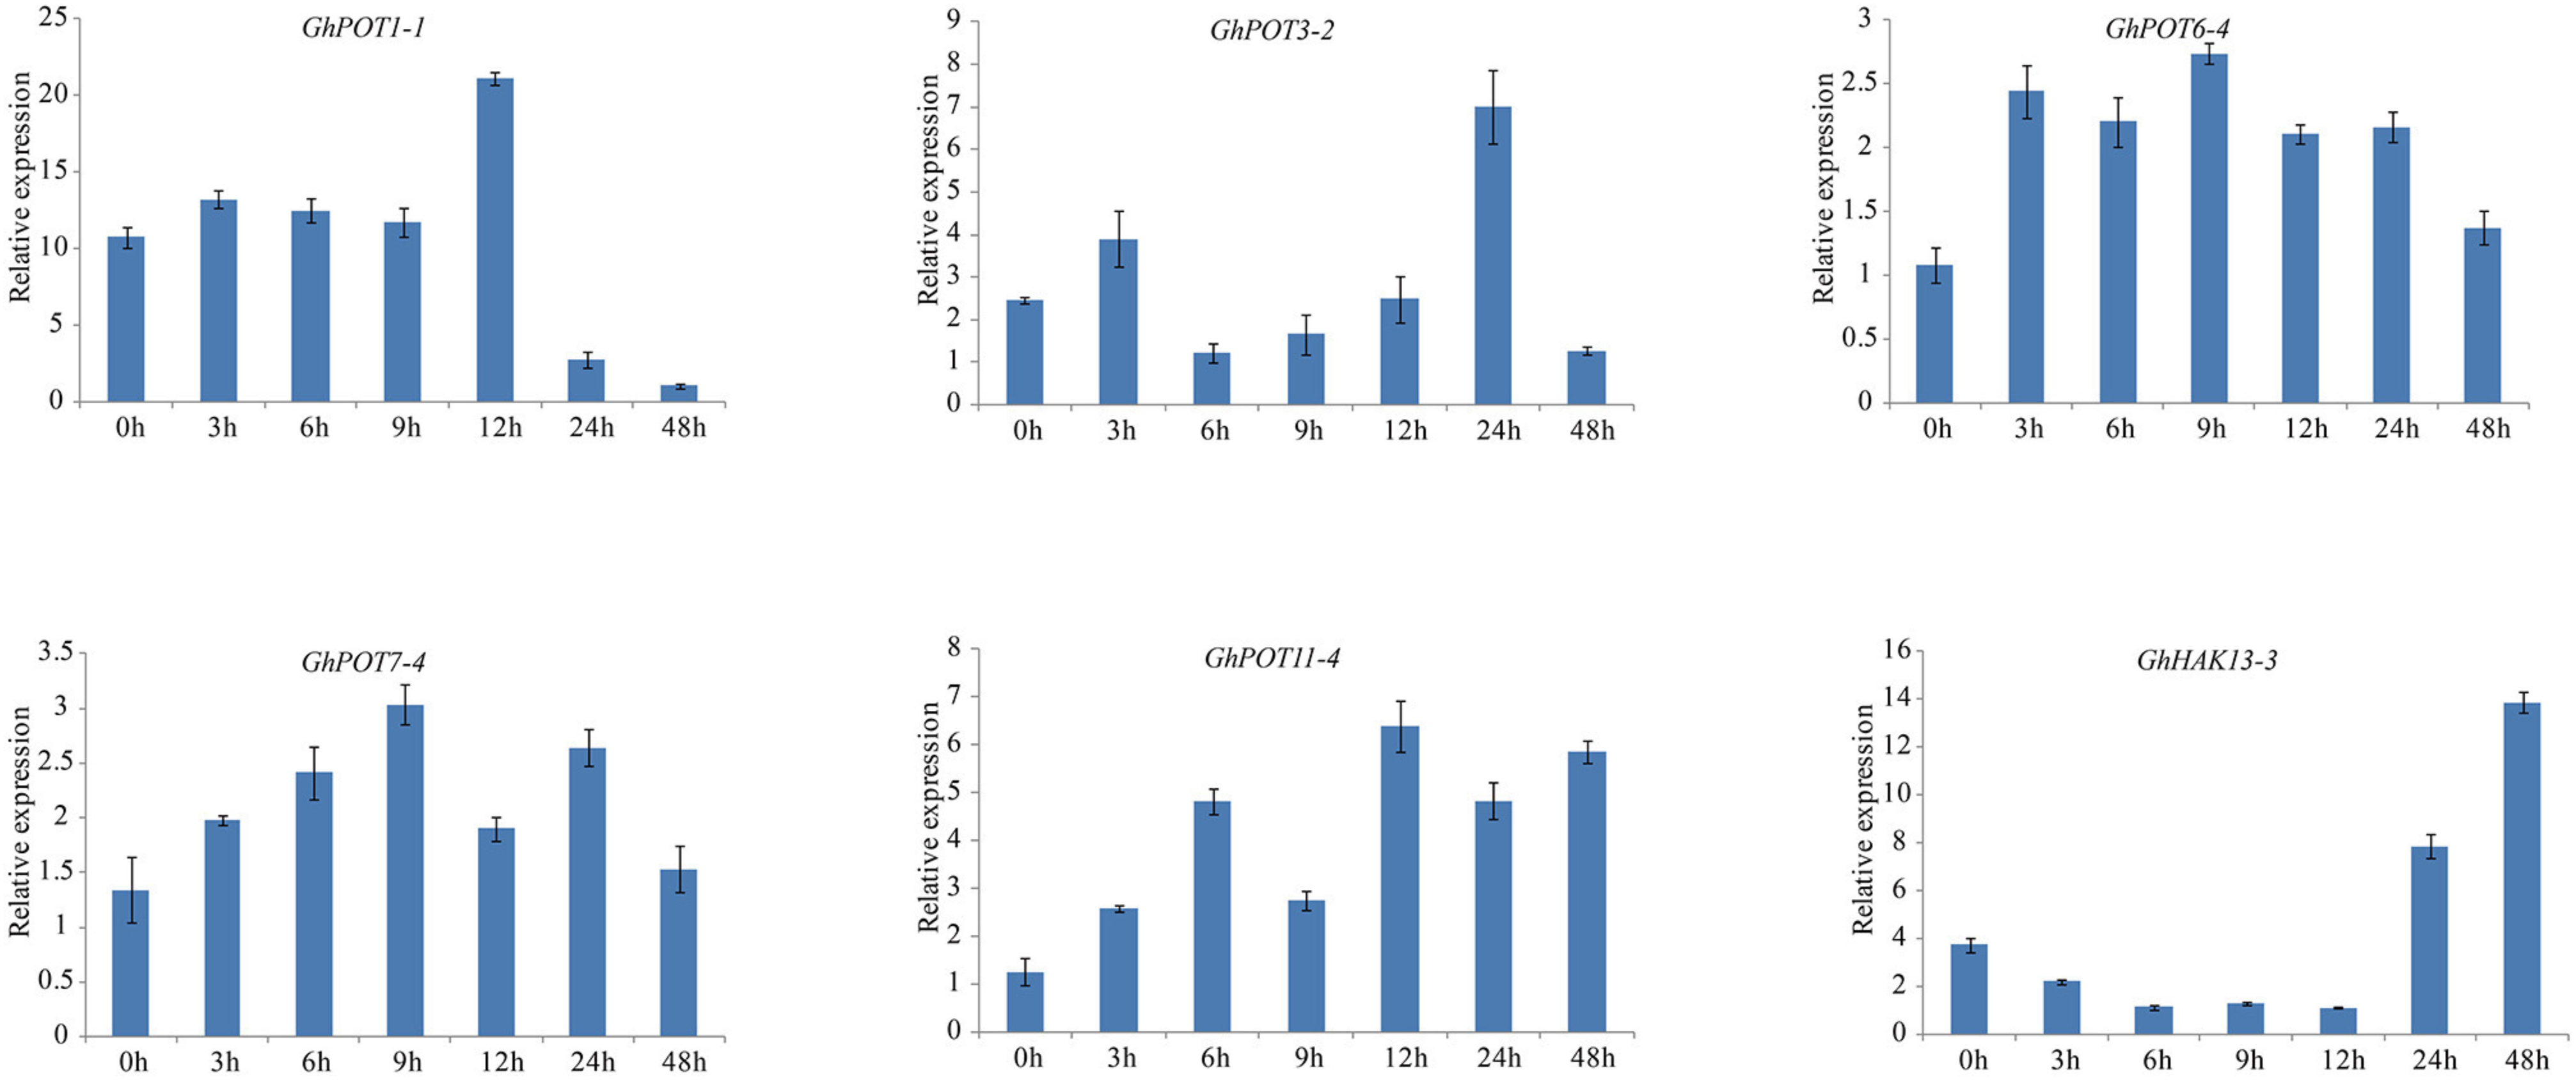
Figure 10. Expressions of GhPOT genes in response to salt stress (300 mM NaCl). The expressions of the GhPOT genes were determined by qRT-PCR using the total RNA isolated from TM-1 leaves at different time points (0, 3, 6, 9, 12, 24 and 48 h) of potassium deficiency stress. The error bars indicate the standard error (SE) of three biological replicates.
Potassium is one of the essential nutrients for plant growth and development, and potassium is widely distributed in various plant tissues as the second most abundant cation in plants. HAK/KUP/KT, as a potassium transporter family member, plays an important role in maintaining K + concentrations to affect the cytosolic pH, cell turgor, cell elongation, enzyme activation, and osmotic adjustment, as well as some physiological processes.
In this study, 45, 44, 21, and 24 potassium transporters were identified from the G. hirsutum, G. barbadense, G. arboreum, and G. raimondii genomes, respectively. The number of POT genes in G. hirsutum and G. barbadense was the sum of the numbers of POT genes in G. arboreum and G. raimondii. This is probably because G. hirsutum and G. barbadense are tetraploid plants that contain two genomes from their ancestors, G. arboreum and G. raimondii, and chromosome reduplication occurred. The G. barbadense and G. hirsutum chromosome locations were fundamentally consistent. The G. hirsutum At subgenome locations were similar to those of G. raimondii, and the Dt subgenome locations were similar to those of G. arboreum. The structures and locations of the genes showed evolutionary conservation. All the genes were classified into four clusters (I, II, III, and IV) based on their phylogenetic relationships. Cluster II was the largest cluster, not only in cotton but also in other species, representing 8 of 19 family members in tomatoes (Hyun et al., 2014), 9 of 27 in maize (Zhang et al., 2012), 12 of 21 in pears (Li et al., 2018), 11 of 21 in cassava (Ou et al., 2018) and 15 of 27 in rice (Gupta et al., 2008). Although HAK/KUP/KT transporters were reported to function in high-affinity K+ uptake in low-K+ environments (Ahn et al., 2004; Gierth et al., 2005), most cluster II transporters might instead play roles in low-affinity K+ transport (Gupta et al., 2008). OsHAK7 and OsHAK10, belonging to cluster II, have been reported to mediate low-affinity K+ uptake in heterologous systems (Banuelos et al., 2002). It is possible that the cotton genes in Cluster II also participate in low-affinity K+ transport. Figure 2 shows that proteins in a group that share the same motifs are likely to share similar functions or have recent common evolutionary origins.
Publicly available RNA-seq databases were used to analyze gene expressions. There is no doubt that potassium transporter genes are highly expressed in roots or stems because plants need roots and stems to transport or store K+ to complete biochemical reactions and maintain cell turgor. Figure 5 shows that the expression levels of HAK/KUP/KTs were completely different in different fiber development stages. GhPOT4, GhPOT12 and GhPOT7 were highly expressed in the initiation stage. GhPOT2, GhPOT1, GhHAK17 and GhPOT3 were highly expressed in the expansion stage, and GhPOT8 and GhPOT2 genes had high expressions in the secondary wall synthesis stage. Some genes even covered two or three stages. It has been reported that K+ could indirectly increase the maximal fiber elongation rate and final fiber length (Zhao et al., 2019). Two cotton varieties (Siza3 and Simian3) were treated with different K+ concentrations (K0, K1, and K2) in 2015 and 2016. The results showed that under K1 and K2 treatment, the fiber length of Siza3 increased by 3.9% and 8.24%, respectively, and the fiber length of Simian3 increased by 3.54% and 8.08%, respectively, compared with those at K0 (Zhao et al., 2019). In-depth studies have found that potassium deficiency can accelerate the synthesis of secondary wall cellulose and inhibit the fibers from obtaining carbohydrates from nearby leaves, thus disrupting the fiber development process and significantly reducing the fiber quality (Yang et al., 2016). The qRT-PCR (Figure 7) showed the same results as did the RNA-seq databases. GhPOT12-1 was expressed in the initation stage. GhPOT11-3 and GhHAK13-1 were highly expressed in the expansion stage. GhPOT11-3 and GhHAK13-1 could possibly increase the K+ concentration to improve the fiber elongation rate. GhPOT2-4 and GhPOT8-2 were highly expressed in the secondary wall synthesis stage. Thus, we can infer that GhPOT2-4 and GhPOT8-2 reduce the K+ concentration to promote secondary wall cellulose synthesis and obtain carbohydrates from leaves.
It has been reported that the knockout of some HAK/KUP/KT genes in plants affects not only K+ acquisition and transportation but also the root and shoot morphology. The root hairs of AtHAK5-overexpressing plants were more developed, even under low-potassium conditions (Zhao et al., 2016). A triple mutation (AtKUP2 and its homologs, AtKUP6 and AtKUP8) causes an increase in the root cell size, suggesting that these transporters negatively regulate turgor-dependent shoot growth (Osakabe et al., 2013). The fiber cell, as a model single cell, may be induced by HAK/KUP/KT to develop its form and length. These results suggested that HAK/KUP/KT genes that are highly expressed in different fiber stages could influence fiber development by regulating the K+ concentration.
Gene promoters specifically regulate transcription initiation and can control the expression levels of specific genes in cells. The level of gene expression is directly related to the gene function. Thus, promoter expression activity can effectively predict the functions of specific genes. A previous study demonstrated that many HAK/KUP/KT genes are involved in drought, salt, and osmotic stress responses and ionic homeostasis (Grabov, 2007; Wang and Wu, 2017; Li et al., 2018). In general, most GhPOTs (except genes with very low or no expression in the investigated tissues) were induced by salt and drought, even though the induction of some GhPOTs was slight.
Potassium is an important element for plant growth. Under low-K+ stress, plants can absorb K+ through HAK/KUP/KT to maintain a steady state in the cytoplasm, which represents a major mechanism of plant response to low-K+ stress (Li et al., 2018). AtHAK5 and AtKT1 are the two essential transporters mediating high-affinity Rb+ (K+) uptake in the roots of Arabidopsis, and the residual Rb+ (K+) concentration detected in double-mutant roots was insufficient to sustain plant growth (Pyo et al., 2010). ZmHAK5 was characterized as a high-affinity K+ transporter in maize. It was found by experimental comparison that plants with a loss of ZmHAK5 function exhibited defective K+ uptake under low-K+ conditions, whereas ZmHAK5-overexpressing plants showed increased K+ uptake activity and improved growth (Qin et al., 2019). As shown in Figure 8, almost all the tested genes were upregulated after K+ deficiency, especially GhHAK13-3 and GhPOT1-1. Therefore, we may expect that HAK/KUP/KT genes could increase the potassium ion absorption capacity under K+-deficiency. Overall, HAK/KUP/KT genes enhance the K+ deficiency tolerance, which is important for current agricultural production.
Salt stress is an abiotic stress relevant to modern agricultural production. In this study, transcriptome analysis indicated that most GhPOT genes were responsive to salt stress, and the qRT-PCR results showed that all the selected genes were upregulated after treatment with high concentrations of NaCl. There have been some reports of HAK/KUP/KT genes in other species that could relieve salt stress in plants. Salt stress significantly decreased the root net K+ uptake rate in WT rice and almost completely blocked net K+ uptake in Oshak1 mutants when the K+ concentration was below 0.05 mm. However, plants overexpressing OsHAK1 were more tolerant of salt stress compared to the wild type. The same results were shown in HvHAK1, LeHAK5, and CaHAK1 (Martínez-Cordero et al., 2004; Nieves-Cordones et al., 2007; Fulgenzi et al., 2008). GhPOT5, which is a homolog of OsHAK1, showed higher expression after treatment than did other genes (Figure 6). AtHKT1 provides a key mechanism for protecting leaves from salt stress (Hamamoto et al., 2015), and GhPOT1, which is homologous to AtHKT1, showed significantly increased expression after salt treatment (Figures 6, 10).
In the present study, the results of a cis-acting element analysis of the GhPOT promoter regions revealed many cis-acting elements that significantly responded to drought stress, such as ABRE, MYB, and MBS, and they were distributed in both proximal and distal regions of the promoter from TSS. ABREs are ABA-responsive elements that have been reported to play an important role in the drought stress response (Sah et al., 2016), and most GhPOT promoters possess ABA-responsive elements. Moreover, transcriptome analysis showed that most GhPOT genes were clearly upregulated after drought stress (Figure 6). During drought stress, root growth and the rate of K+ diffusion toward the roots in the soil are both restricted, thus limiting K+ acquisition (Wang et al., 2013). Plants that are exposed to drought stress over a long time can form reactive oxygen species (ROS), which enables the activation of high-affinity K+ uptake (Ashley et al., 2006). As shown in Figure 11, the plants showed significant wilt after the treatment 3h compared with other treatments. Here, most of the examined genes increased their expression after drought treatment (Figures 6, 9), especially GhPOT5-2 immediately improve its expression after treatment 3h. The other five genes enhanced their expression level at 6h, especially GhPOT1 (Figure 9). However, under continuous exposure to drought stress, high levels of ROS lead to leaf damage (Wang et al., 2013). All the selected genes reached their maximum expressions after 24 h of drought treatment, then began to decline (Figure 9). On the basis of this evidence and previous studies (Grabov, 2007; Wang et al., 2013; Li et al., 2018), the HAK/KUP/KT genes might improve drought tolerance.

Figure 11. TM-1 phenotypic pictures at different time points (0, 3, 6, 9, 12, 24 and 48 h)after 0.03 mM KCl, 18%PEG and 300 mM NaCl treatments.
Generally, GhPOT genes were extensively induced by multiple abiotic stresses, revealing that these genes perform important functions in response to drought, salt and K+ deficiency stresses in cotton. These results implied that the GhPOT gene family plays an important role in improving the cotton stress tolerance. Because potassium has similar chemical properties to those of cesium, three K+ transport genes were found in rice by yeast library screening, and it was found that the three genes had sensitive responses to Cs+-induced root growth inhibition, expecially OsHAK5 (Yamaki et al., 2017). As expected, GhPOT5 and GhPOT1 could have significant responses to drought, salt and K+ deficiency stresses. Thus, GhPOT5 and GhPOT1 may have crucial effects on stress responses.
In this study, we identified 45, 21, 44, and 24 HAK/KUP/KT genes in G. hirsutum, G. arboreum, G. barbadense, and G. raimondii, respectively. Phylogenetic analysis grouped these genes into four clusters. Chromosome location, conserved motif, conserved domain and gene structure analyses of all the cotton HAK/KUP/KT genes were subsequently performed. The G. hirsutum gene promoters contain diverse cis-regulatory elements. The RNA-seq data showed that HAK/KUP/KT genes are specifically expressed in different stages of fiber development. PEG and NaCl treatment transcriptomes indicated that HAK/KUP/KT genes may have disparate functions when facing drought and salt stress. Upon combining the qRT-PCR results, all the results indicate that HAK/KUP/KT genes might participate in stress responses and improve the stress resistance. In conclusion, these results will provide molecular insights into potassium transporter research in cotton. Meanwhile, some genes can be studied further to explore their functions, like GhPOT2-4, GhPOT8-2, GhPOT1, and GhPOT5,
All datasets generated for this study are included in the article/Supplementary Material.
HTW and XY conceived and designed the study and prepared the manuscript. JZ, MT, AW, and HLW assisted with the analysis and interpretation of the data. XF, LM, and JL cultivated and obtained leaf samples with different treatments. SY participated in the design of the experiments and provided a critical review. All authors have read, edited, and approved the current version of the manuscript.
This work was supported by the National Natural Science Foundation of China (Grant No. 31621005) and the China Agriculture Research System (CARS-15-06).
The authors declare that the research was conducted in the absence of any commercial or financial relationships that could be construed as a potential conflict of interest.
The Supplementary Material for this article can be found online at: https://www.frontiersin.org/articles/10.3389/fgene.2020.566469/full#supplementary-material
Supplementary Table 1 | Primers for qPCR.
Supplementary Table 2 | Detailed physicochemical characteristics of HAK/KUP/KT proteins of G. arboreum, G. raimondii, G. hirsutum, and G. barbadense.
Supplementary Table 3 | Characterization of specific cis-elements in the promoters of GhHAK genes.
Supplementary Table 4 | The distribution of cis-elements in proximal and distal region of promoter from TSS.
Ahn, S. J., Shin, R., and Schachtman, D. P. (2004). Expression of KT/KUP genes in Arabidopsis and the role of root hairs in K+ uptake. Plant Physiol. 134, 1135–1145. doi: 10.1104/pp.103.034660
Al-Younis, I., Wong, A., Lemtiri-Chlieh, F., Schmockel, S., Tester, M., Gehring, C., et al. (2018). The Arabidopsis thaliana K(+)-uptake permease 5 (AtKUP5) contains a functional cytosolic adenylate cyclase essential for K(+) transport. Front. Plant Sci. 9:1645. doi: 10.3389/fpls.2018.01645
Ashley, M. K., Grant, M., and Grabov, A. (2006). Plant responses to potassium deficiencies: a role for potassium transport proteins. J. Exp. Bot. 57, 425–436. doi: 10.1093/jxb/erj034
Ashraf, M. A., Kumagai, S., Ito, K., Sugita, R., Tanoi, K., and Rahman, A. (2019). ATP Binding Cassette Proteins ABCG37 and ABCG33 are required for potassium-independent cesium uptake in Arabidopsis roots. BioRxiv [Preprint]. doi: 10.1101/823815
Banuelos, M. A., Garciadeblas, B., Cubero, B., and Rodriguez-Navarro, A. (2002). Inventory and functional characterization of the HAK potassium transporters of rice. Plant Physiol. 130, 784–795. doi: 10.1104/pp.007781
Chen, C., Xia, R., Chen, H., and He, Y. (2018). TBtools, a Toolkit for Biologists integrating various HTS-data handling tools with a user-friendly interface. BioRxiv [Preprint]. doi: 10.1101/289660
Chen, G., Hu, Q., Luo, L., Yang, T., Zhang, S., Hu, Y., et al. (2015). Rice potassium transporter OsHAK1 is essential for maintaining potassium-mediated growth and functions in salt tolerance over low and high potassium concentration ranges. Plant Cell Environ. 38, 2747–2765. doi: 10.1111/pce.12585
Cheng, X., Liu, X., Mao, W., Zhang, X., Chen, S., Zhan, K., et al. (2018). Genome-wide identification and analysis of HAK/KUP/KT potassium transporters gene family in wheat (Triticum aestivum L.). Int. J. Mol. Sci. 19:3969. doi: 10.3390/ijms19123969
Cherel, I., and Gaillard, I. (2019). The complex fine-tuning of K(+) fluxes in plants in relation to osmotic and ionic abiotic stresses. Int. J. Mol. Sci. 20:715. doi: 10.3390/ijms20030715
Cherel, I., Lefoulon, C., Boeglin, M., and Sentenac, H. (2014). Molecular mechanisms involved in plant adaptation to low K(+) availability. J. Exp. Bot. 65, 833–848. doi: 10.1093/jxb/ert402
Epstein, W., and Kim, B. S. (1971). Potassium transport loci in Escherichia coli K-12. J. Bacteriol. 108, 639–644. doi: 10.1128/jb.108.2.639-644.1971
Feng, H., Tang, Q., Cai, J., Xu, B., Xu, G., and Yu, L. (2019). Rice OsHAK16 functions in potassium uptake and translocation in shoot, maintaining potassium homeostasis and salt tolerance. Planta 250, 549–561. doi: 10.1007/s00425-019-03194-3193
Fulgenzi, F. R., Peralta, M. L., Mangano, S., Dann, C. H., Vallejo, A. J., Puigdomenech, P., et al. (2008). The ionic environment controls the contribution of the barley HvHAK1 transporter to potassium acquisition. Plant Physiol. 147, 252–262. doi: 10.1104/pp.107.114546
Gierth, M., Maser, P., and Schroeder, J. I. (2005). The potassium transporter AtHAK5 functions in K(+) deprivation-induced high-affinity K(+) uptake and AKT1 K(+) channel contribution to K(+) uptake kinetics in Arabidopsis roots. Plant Physiol. 137, 1105–1114. doi: 10.1104/pp.104.057216
Grabov, A. (2007). Plant KT/KUP/HAK potassium transporters: single family - multiple functions. Ann. Bot. 99, 1035–1041. doi: 10.1093/aob/mcm066
Gupta, M., Qiu, X., Wang, L., Xie, W., Zhang, C., Xiong, L., et al. (2008). KT/HAK/KUP potassium transporters gene family and their whole-life cycle expression profile in rice (Oryza sativa). Mol. Genet. Genom. 280, 437–452. doi: 10.1007/s00438-008-0377-7
Hamamoto, S., Horie, T., Hauser, F., Deinlein, U., Schroeder, J. I., and Uozumi, N. (2015). HKT transporters mediate salt stress resistance in plants: from structure and function to the field. Curr. Opin. Biotechnol. 32, 113–120. doi: 10.1016/j.copbio.2014.11.025
Han, M., Wu, W., Wu, W. H., and Wang, Y. (2016). Potassium transporter KUP7 is involved in K(+) acquisition and translocation in arabidopsis root under K(+)-limited conditions. Mol. Plant 9, 437–446. doi: 10.1016/j.molp.2016.01.012
Hyun, T. K., Rim, Y., Kim, E., and Kim, J. (2014). Genome-wide and molecular evolution analyses of the KT/HAK/KUP family in tomato (Solanum lycopersicum L.). Genes Genomics 36, 365–374. doi: 10.1007/s13258-014-0174-0
Kim, D., Pertea, G., Trapnell, C., Pimentel, H., Kelley, R., and Salzberg, S. L. (2013). TopHat2: accurate alignment of transcriptomes in the presence of insertions, deletions and gene fusions. Genome Biol. 14:R36. doi: 10.1186/gb-2013-14-4-r36
Letunic, I., and Bork, P. (2016). Interactive tree of life (iTOL) v3: an online tool for the display and annotation of phylogenetic and other trees. Nucleic Acids Res. 44, W242–W245. doi: 10.1093/nar/gkw290
Letunic, I., Doerks, T., and Bork, P. (2015). SMART: recent updates, new developments and status in 2015. Nucleic Acids Res. 43, D257–D260. doi: 10.1093/nar/gku949
Li, W., Xu, G., Alli, A., and Yu, L. (2018). Plant HAK/KUP/KT K+ transporters: function and regulation. Semin. Cell Dev. Biol. 74, 133–141. doi: 10.1016/j.semcdb.2017.07.009
Li, Y., Peng, L., Xie, C., Shi, X., Dong, C., Shen, Q., et al. (2018b). Genome-wide identification, characterization, and expression analyses of the HAK/KUP/KT potassium transporter gene family reveals their involvement in K+ deficient and abiotic stress responses in pear rootstock seedlings. Plant Growth Regul. 85, 187–198. doi: 10.1007/s10725-018-0382-8
Livak, K. J., and Schmittgen, T. D. (2001). Analysis of relative gene expression data using real-time quantitative PCR and the 2(-Delta Delta C(T)) method. Methods 25, 402–408. doi: 10.1006/meth.2001.1262
Martínez-Cordero, M. A., Martínez, V., and Rubio, F. (2004). Cloning and functional characterization of the high-affinity K+ transporter HAK1 of pepper. Plant Mol. Biol. 56, 413–421. doi: 10.1007/s11103-004-3845-4
Nieves-Cordones, M., Martínez-Cordero, M. A., Martínez, V., and Rubio, F. (2007). An NH4+-sensitive component dominates high-affinity K+ uptake in tomato plants. Plant Sci. 172, 273–280. doi: 10.1016/j.plantsci.2006.09.003
Osakabe, Y., Arinaga, N., Umezawa, T., Katsura, S., Nagamachi, K., Tanaka, H., et al. (2013). Osmotic stress responses and plant growth controlled by potassium transporters in Arabidopsis. Plant Cell 25, 609–624. doi: 10.1105/tpc.112.105700
Ou, W., Mao, X., Huang, C., Tie, W., Yan, Y., Ding, Z., et al. (2018). Genome-wide identification and expression analysis of the KUP family under abiotic stress in cassava (Manihot esculenta Crantz). Front. Physiol. 9:17. doi: 10.3389/fphys.2018.00017
Pyo, Y. J., Gierth, M., Schroeder, J. I., and Cho, M. H. (2010). High-affinity K(+) transport in Arabidopsis: AtHAK5 and AKT1 are vital for seedling establishment and postgermination growth under low-potassium conditions. Plant Physiol. 153, 863–875. doi: 10.1104/pp.110.154369
Qin, Y. J., Wu, H., and Wang, Y. (2019). ZmHAK5 and ZmHAK1 function in K(+) uptake and distribution in maize under low K(+) conditions. J. Integr. Plant Biol. 61, 691–705. doi: 10.1111/jipb.12756
Rehman, H. M., Nawaz, M. A., Shah, Z. H., Daur, I., Khatoon, S., Yang, S. H., et al. (2017). In-depth genomic and transcriptomic analysis of five K(+) transporter gene families in soybean confirm their differential expression for nodulation. Front. Plant Sci. 8:804. doi: 10.3389/fpls.2017.00804
Ruan, Y. L., Chourey, P. S., Delmer, D. P., and Perez-Grau, L. (1997). The differential expression of sucrose synthase in relation to diverse patterns of carbon partitioning in developing cotton seed. Plant Physiol. 115, 375–385. doi: 10.1104/pp.115.2.375
Sah, S. K., Reddy, K. R., and Li, J. (2016). Abscisic acid and abiotic stress tolerance in crop plants. Front. Plant Sci. 7:571. doi: 10.3389/fpls.2016.00571
Santa-María, G. E., Rubio, F., Dubcovsky, J., and Rodríguez-Navarro, A. (1997). The HAK1 gene of barley is a member of a large gene family and encodes a high-affinity potassium transporter. Plant Cell 9, 2281–2289. doi: 10.1105/tpc.9.12.2281
Scherzer, S., Bohm, J., Krol, E., Shabala, L., Kreuzer, I., Larisch, C., et al. (2015). Calcium sensor kinase activates potassium uptake systems in gland cells of Venus flytraps. Proc. Natl. Acad. Sci. U.S.A. 112, 7309–7314. doi: 10.1073/pnas.1507810112
Smart, L. B., Vojdani, F., Maeshima, M., and Wilkins, T. A. (1998). Genes involved in osmoregulation during turgor-driven cell expansion of developing cotton fibers are differentially regulated. Plant Physiol. 116, 1539–1549. doi: 10.1104/pp.116.4.1539
Song, Z. Z., Ma, R. J., and Yu, M. L. (2015). Genome-wide analysis and identification of KT/HAK/KUP potassium transporter gene family in peach (Prunus persica). Genet. Mol. Res. 14, 774–787. doi: 10.4238/2015.January.30.21
Tamura, K., Stecher, G., Peterson, D., Filipski, A., and Kumar, S. (2013). MEGA6: molecular evolutionary genetics analysis version 6.0. Mol. Biol. Evol. 30, 2725–2729. doi: 10.1093/molbev/mst197
Thompson, J. D., Gibson, T. J., and Higgins, D. G. (2003). Multiple sequence alignment using ClustalW and ClustalX. Curr. Protoc. Bioinform. 1, 2.3.1–2.3.22. doi: 10.1002/0471250953.bi0203s00
Trapnell, C., Williams, B. A., Pertea, G., Mortazavi, A., Kwan, G., Baren, M. J., et al. (2010). Transcript assembly and quantification by RNA-Seq reveals unannotated transcripts and isoform switching during cell differentiation. Nat. Biotechnol. 28, 511–515. doi: 10.1038/nbt.1621
Voorrips, R. E. (2002). MapChart: software for the graphical presentation of linkage maps and QTLs. J. Heredity 93, 77–78. doi: 10.1093/jhered/93.1.77
Wang, M., Zheng, Q., Shen, Q., and Guo, S. (2013). The critical role of potassium in plant stress response. Int. J. Mol. Sci. 14, 7370–7390. doi: 10.3390/ijms14047370
Wang, Y., Juan, X., Zhang, M., Tian, X., and Zhao, L. (2018). GhKT2: a novel K+ transporter gene in cotton (Gossypium hirsutum). Front. Agric. Sci. 5, 226–235. doi: 10.15302/J-FASE-2017170
Wang, Y., and Wu, W. (2013). Potassium transport and signaling in higher plants. Annu. Rev. Plant Biol. 64, 451–476. doi: 10.1146/annurev-arplant-050312-120153
Wang, Y., and Wu, W. (2017). Regulation of potassium transport and signaling in plants. Curr. Opin. Plant Biol. 39, 123–128. doi: 10.1016/j.pbi.2017.06.006
Yamaki, T., Otani, M., Ono, K., Mimura, T., Oda, K., Minamii, T., et al. (2017). Isolation and characterization of rice cesium transporter genes from a rice-transporter-enriched yeast expression library. Physiol. Plant. 160, 425–436. doi: 10.1111/ppl.12569
Yang, J., Hu, W., Zhao, W., Chen, B., Wang, Y., Zhou, Z., et al. (2016). Fruiting branch K+ level affects cotton fiber elongation through osmoregulation. Front. Plant Sci. 7:13. doi: 10.3389/fpls.2016.00013
Yang, J. S., Hu, W., Zhao, W., Meng, Y., Chen, B., Wang, Y., et al. (2016b). Soil potassium deficiency reduces cotton fiber strength by accelerating and shortening fiber development. Sci. Rep. 6:28856. doi: 10.1038/srep28856
Zhang, Z., Zhang, J., Chen, Y., Li, R., Wang, H., and Wei, J. (2012). Genome-wide analysis and identification of HAK potassium transporter gene family in maize (Zea mays L.). Mol. Biol. Rep. 39, 8465–8473. doi: 10.1007/s11033-012-1700-2
Zhao, S., Zhang, M. L., Ma, T. L., and Wang, Y. (2016). Phosphorylation of ARF2 relieves its repression of transcription of the K+ transporter gene HAK5 in response to low potassium stress. Plant Cell 28, 3005–3019. doi: 10.1105/tpc.16.00684
Zhao, W., Dong, H., Zahoor, R., Zhou, Z., Snider, J. L., Chen, Y., et al. (2019). Ameliorative effects of potassium on drought-induced decreases in fiber length of cotton (Gossypium hirsutum L.) are associated with osmolyte dynamics during fiber development. Crop J. 7, 619–634. doi: 10.1016/j.cj.2019.03.008
Keywords: HAK/KUP/KT, cotton, expression patterns, fiber development, stress
Citation: Yang X, Zhang J, Wu A, Wei H, Fu X, Tian M, Ma L, Lu J, Wang H and Yu S (2020) Genome-Wide Identification and Expression Pattern Analysis of the HAK/KUP/KT Gene Family of Cotton in Fiber Development and Under Stresses. Front. Genet. 11:566469. doi: 10.3389/fgene.2020.566469
Received: 28 May 2020; Accepted: 27 October 2020;
Published: 19 November 2020.
Edited by:
Shuangxia Jin, Huazhong Agricultural University, ChinaReviewed by:
Ashish Kumar Srivastava, Bhabha Atomic Research Centre (BARC), IndiaCopyright © 2020 Yang, Zhang, Wu, Wei, Fu, Tian, Ma, Lu, Wang and Yu. This is an open-access article distributed under the terms of the Creative Commons Attribution License (CC BY). The use, distribution or reproduction in other forums is permitted, provided the original author(s) and the copyright owner(s) are credited and that the original publication in this journal is cited, in accordance with accepted academic practice. No use, distribution or reproduction is permitted which does not comply with these terms.
*Correspondence: Hantao Wang, dy53YW5naGFudGFvQDE2My5jb20=; Shuxun Yu, eXN4MTk1MzExQDE2My5jb20=
Disclaimer: All claims expressed in this article are solely those of the authors and do not necessarily represent those of their affiliated organizations, or those of the publisher, the editors and the reviewers. Any product that may be evaluated in this article or claim that may be made by its manufacturer is not guaranteed or endorsed by the publisher.
Research integrity at Frontiers

Learn more about the work of our research integrity team to safeguard the quality of each article we publish.