
94% of researchers rate our articles as excellent or good
Learn more about the work of our research integrity team to safeguard the quality of each article we publish.
Find out more
ORIGINAL RESEARCH article
Front. Genet. , 05 November 2020
Sec. Genetics of Aging
Volume 11 - 2020 | https://doi.org/10.3389/fgene.2020.565479
 Zhiqi SongYanfeng XuLing Zhang
 Li ZhouYu ZhangYunlin HanXianglei LiPin YuYajin QuWenjie Zhao
 Chuan Qin*
Background: Alzheimer’s disease (AD) is an incurable neurodegenerative disease characterized by irreversible progressive cognitive deficits. Identification of candidate biomarkers, before amyloid-β-plaque deposition occurs, is therefore of great importance for early intervention of AD.
Objective: To investigate the potential non-invasive early biomarkers of AD in 5XFAD mouse model, we investigate the proteome of urinary exosomes present in 1-month-old (before amyloid-β accumulation) 5XFAD mouse models and their littermate controls. Another two groups of 2 and 6 months-old urinary samples were collected for monitoring the dynamic change of target proteins during AD progression.
Methods: Proteomic, bioinformatics analysis, multiple reaction monitoring (MRM), western blotting (WB) or ELISA were performed for analyzing these urinary exosomes.
Results: A total of 316 proteins including 44 brain cell markers were identified using liquid chromatography tandem mass spectrometry. Importantly, 18 proteins were unique to the 5XFAD group. Eighty-eight proteins including 11 brain cell markers were differentially expressed. Twenty-two proteins were selected to be verified by WB. Furthermore, based on an independent set of 12 urinary exosomes samples, five in these proteins were further confirmed significant difference. Notably, Annexin 2 and Clusterin displayed significant decreased in AD model during the course detected by ELISA. AOAH, Clusterin, and Ly86 are also brain cell markers that were first reported differential expression in urinary exosomes of AD model.
Conclusion: Our data demonstrated that some urinary exosome proteins, especially Annexin 2 and Clusterin, as nanometer-sized particles, enable detection of differences before amyloid-β-plaque deposition in 5XFAD mouse model, which may present an ideal non-invasive source of biomarkers for prevention of AD.
Alzheimer’s disease is a chronic age-associated neurodegenerative disease related to irreversible cognitive impairment and progressive dementia (Dos et al., 2018). As the pathological course causing AD starts decades before clinical symptoms appear, identifying clues in the early stages of AD, especially before amyloid-β (Aβ) plaque deposition, is urgent for AD research (Dubois et al., 2015). Urine is an ideal resource to discover new biomarkers not only for kidney-related disease, but also for non-kidney-related diseases (Dubois et al., 2015), including AD diagnosis (Zhang et al., 2018). Additionally, urine can be collected non-invasively in large amounts. However, the protein concentration in normal urine is very low compared with other body fluids, and normal protein excretion is < 150 mg/day or 100 mg/L (Adachi et al., 2006). The presence of highly abundant proteins (e.g., albumin) may mask the identification of under-represented proteins that have potential pathophysiological significance (Adachi et al., 2006). Exosomes are small extracellular nano-sized vesicles between 40 and 160 nm in diameter (Kalluri and LeBleu, 2020) that were first described in the 1980s (Johnstone et al., 1987). They can be isolated from a variety of body fluids, making them amenable to proteomic and transcriptomic analyses; this supports the hypothesis that their analysis may provide valuable information for disease diagnosis and monitoring (Mitchell et al., 2009). Urinary exosomes contain approximately 3% of total urine protein based on a previous report (Zhou et al., 2006b) and thus provide a promising source for biomarker discovery because of the ability to detect proteins with relatively low abundance and the reduced complexity of the urinary proteome (Pisitkun et al., 2004; Wang et al., 2012). Several urine exosome-associated proteins with potential diagnostic value have been identified for other diseases, such as exosomal Fetuin-A protein in kidney injury (Zhou et al., 2006a), resistin, GTPase NRas, or galectin-3-binding protein in bladder cancer (Smalley et al., 2008), and PSA and PAMA in prostate cancer (Mitchell et al., 2009). However, the value and abundance of biological information of proteins contained in urinary exosomes deserve further investigation.
Exosomal proteomics has emerged as a powerful technique to understand the molecular constituent of exosomes and has the potential to accelerate biomarker discovery (Li et al., 2011). Animal models provide the necessary tools to overcome typical confounding variables, such as genetic heterogeneity, gender differences, and environmental factors, including diet and lifestyle, in clinical cases. 5XFAD mice rapidly recapitulate major features of AD amyloid pathology and exhibit intraneuronal Aβ42 accumulation in the brain at 1.5 months of age (before plaques form) (Oakley et al., 2006; Dinkins et al., 2014). Herein, we selected 5XFAD mice as an AD model to examine possible differentially expressed proteins in urinary exosomes. Specifically, urinary exosomes were collected and isolated from specific pathogen-free, 4-week-old, female 5XFAD mice and littermate controls to explore potentially significant information before the development of intraneuronal Aβ42 accumulation in the brain of 5XFAD mice (Figure 1). We performed, for the first time, urinary exosomal proteomic analysis combined with MRM, WB, and ELISA to explore early biomarkers of AD and provide an opportunity for prevention.
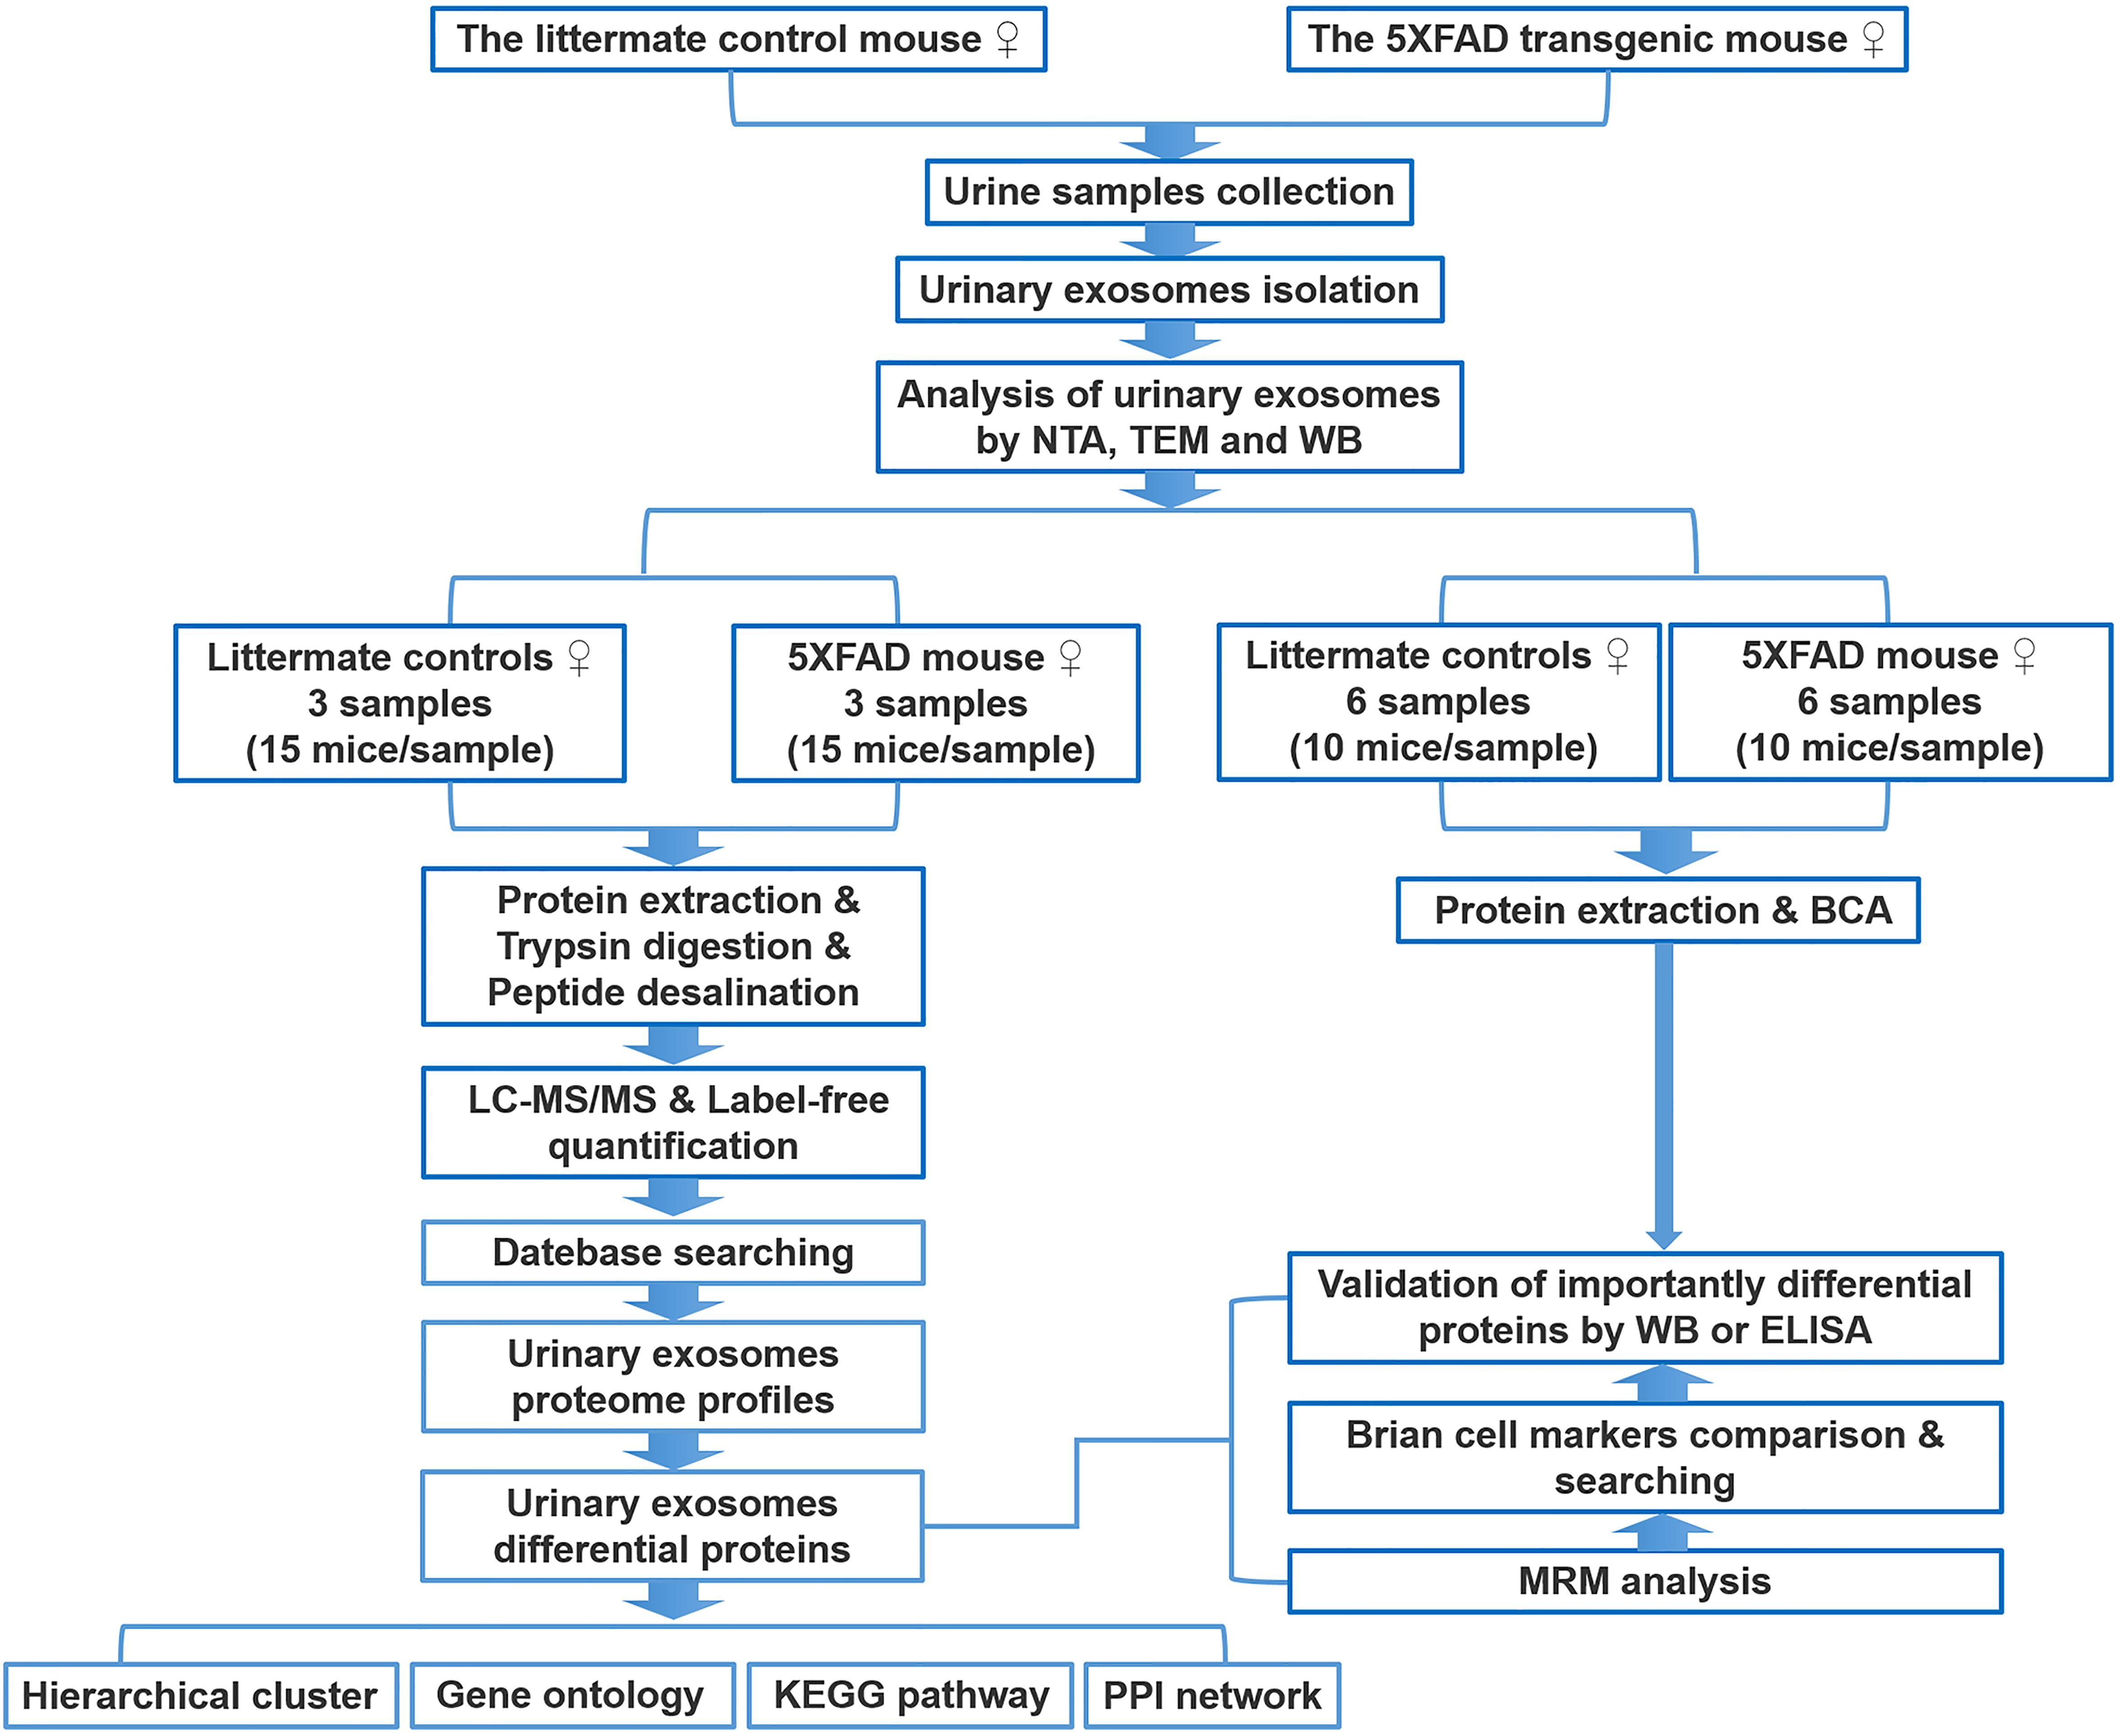
Figure 1. Workflow of isolation, characterization, and proteomics of urinary exosomes in 5XFAD transgenic mouse model of AD and littermate control. The proteins were analyzed using liquid chromatography coupled with tandem mass spectrometry (LC-MS/MS), MRM, WB, and ELISA. Differential proteins were analyzed by bioinformatics analysis. See text for details.
All experimental procedures for the laboratory animals in this study were performed and approved according to the strict guidelines of Chinese Regulations of Laboratory Animals. All procedures in this study involving animals were reviewed and approved by the Institutional Animal Care and Use Committee of the Institute of Laboratory Animal Science, Peking Union Medical College (Approved ID:QC19005).
Mice expressing 5 human mutations (5XFAD mouse model of AD) in APP and PS1(B6SJL-Tg[APP∗K670N∗M671L∗I716V∗V717I, PSEN1∗M146∗L286V] 6799Vas/J) under neuron-specific elements of the Thy1 promoter were purchased from The Jackson Laboratory and crossed to wild type SJL mice to generate offspring hemizygous for the APP and PS1 transgenes (Oakley et al., 2006). The positive mice tested by Polymerase Chain Reaction (PCR) (Transgene forward: AGG ACT GAC CAC TCG ACC AG; transgene reverse: CGG GGG TCT AGT TCT GCA T) were named as 5XFAD mice, littermate mice tested by PCR as negative are named as control group. All mice were maintained in an environmentally controlled room at 22°C on 12-h light/dark cycle and provided with standard diet and water ad libitum. These mice predominately generate Aβ42 that accumulates in plaques beginning at the age of 2 months. Urine samples from 4-week-old 5XFAD mice and littermate mice were collected in metabolic cages. During urine collection, all mice were given free access to water without food to avoid contamination.
Each urinary exosomes sample were isolated from 30 mL urine by Exosome Isolation Q3 kit (EIQ3-03001, Wayen Biotechnologies, Shanghai). The urine samples were taken from storage and kept it on ice. If starting with frozen sample, the samples were thawed completely in a 37°C water bath and then placed on ice. The urine samples were centrifuged at 3,000 × g for 15 min at 4°C. The supernatant was transferred to a new tube and placed on ice until ready to be performed for the isolation.
The Reagent A was balanced to room temperature before being used and the starting volume of urine was recommended to be 20 mL. The protocol below was shown with 20 mL urine. Twenty mL pre-treated urine was taken out, and added 7.5 mL Reagent A, the mixture was mixed well by inverting up and down untila homogenous mixture was obtained. Then 670 μL Reagent B was added to the mixture above and the tube was inverted up and down to obtain a homogenous mixture. The mixture was incubated at 4°C overnight (12–16 h). After incubation, it was centrifuged at 3,000 × g for 60 min at 4°C. One mL supernatant was taken out into a 1.5 mL tube firstly and thenthe residual supernatant was removed. The pellet was resuspended completely with the 1 mL supernatant above. The mixture was transferred to a new 1.5 mL tube. The re-suspension was centrifuged at 10,000 × g for 10 min at 4°C. The supernatant was removed without disturbing the precipitated pellet. The pellet with 50–200 μL 1 × PBS was resuspended, and it was mixed well by vortexing or pipetting up and down until a homogenous mixture was obtained. The sample was centrifuged at 10,000 × g again for 5 min at 4°C. The supernatant was transferred to a new tube. The supernatant contained exosomes. The exosomes can be used for downstream analysis immediately or aliquoted and stored at −80°C till next experiment.
Samples were lysed in moderate lysis buffer (2% SDS, 7M Urea) containing protease inhibitors (Thermo Fisher), followed by 1 min of sonication on ice using a ultrasonic processor (ultrasound on ice for 2 s, stop for 5 s), and rested on ice for 30 min. The lysate was centrifuged at 13,000 rpm and 4°C for 20 min, and the supernatants were collected. The protein concentration was determined using the BCA assay. Six times volume of 100% acetone was added and precipitated overnight at −20°C. The sample solutions were centrifuged at the next day. The precipitates were collected and washed twice by 500 μL washing buffer (ethanol: acetone: acetic acid = 50: 50: 0.1). Finally, after centrifugation at 13,000 rpm and 4°C for 15 min, the precipitates were dissolved and the protein concentration was quantified with BCA assay for the second time.
First, 100 μg protein solution samples were taken from each sample, and the volume was determined to 100 μL with 25 mM ammonium bicarbonate. Then, 1 M DTT was added (terminal concentration 20 mM), and the reduction reaction was kept for 1 h at 57°C. Subsequently iodoacetamide was added (terminal concentration 90 mM) and incubated for 40 min at room temperature under dark conditions. The sample solution was centrifuged on a 10 kDa ultrafiltration tube at 12,000 rpm, and ammonium bicarbonat was added into the ultrafiltration tube to wash four times. The sample was digested with trypsin which was diluted with ammonium bicarbonat at 37°C overnight. Next day the peptides were collected after centrifugation, and dried by centrifugal concentration.
The dried peptides were desalted by Ziptip C18 column and analyzed by mass spectrometry. Desalination method are as follows: the dried mixed peptides were dissolved in 0.1% formic acid (FA) solution, and 100% acetonitrile was used to activate the desalting column, then 0.1% FA solution was used to balance the desalting column. The redissolved sample was added into the desalting column so that the sample flowed slowly through the desalting column, the peptide was captured by the desalting column, and other non-hydrophobic small molecules such as salt flowed out and abandoned. Then 0.1% FA solution was added to clean the desalting column and remove the residual salts. After 0.1% FA, 80% acetonitrile solution was added and slowly flow through the desalting column, the peptide was eluted and the elution solution was transferred to a new tube. The elution solution was concentrated and dried by centrifugation to remove acetonitrile.
The dried sample was dissolved in buffer (acetonitrile: water: formic acid = 2: 98: 0.1), and analyzed by mass spectrometry. The on-line Nano-RPLC liquid chromatography was performed by Easy-nLC 1200 system (Thermo Scientific). The trap column was home-made C18 (C18, 5 um, 100 um∗2 cm) and the analytical column was C18 reversed-phase column (C18, 1.9 μm, 75 μm × 200 mm). The peptides results were subjected to nano electrospray ionization source followed by tandem mass spectrometry in Orbitrap Fusion Lumos (Thermo Fisher Scientific). The mass spectrometer was operated in the data-dependent mode. For MS scans, the scan ranged from 350 to 1,600 m/z. Intact peptides were detected at a resolution of 60,000 and peptides were then selected for MS/MS at a resolution of 15,000. Collision energy:30% HCD.
Nanoparticle tracking analysis was performed using a NanoSight instrument (PARTICLE METRIX Malvern Panalytical, Ltd., Malvern, United Kingdom) with a 488 nm laser and automated syringe pump. The ZetaView 8.04.02 software was used to process the recorded movies. The script was adapted as follow: samples diluted 1:100 in PBS were loaded using an automated syringe pump. Speed setting was initially fixed to 1000 for sample loading and chamber filling and then decreased to 25 for videos recording. A delay of 15 s was set to stabilize the flow before acquisition. Video captions of 60 s were done in triplicate for each sample with a camera level setting at 14 and a detection threshold at 3. PBS used for EVs recovery was used for negative controls (UC experiments). As a control for ODG experiments, 200 μL of PBS were loaded at the bottom of the tube that was then processed exactly in the same conditions as the urinary exosmes-containing samples.
The observation of EVs by TEM was performed as previously described (Conde Vancells et al., 2010). Briefly, the isolated EVs were resuspended in 30 μL of 2% paraformaldehyde (PFA) in PBS. 3 × 10 μL of sample were deposited on Formvar-carbon-coated copper grids. The adsorption was performed for 3 × 20 min in a wet environment and then the grids were transferred into a drop of 1% glutaraldehyde in PBS for 5 min at room. After several rinsing steps with ultrapure water, samples were contrasted for 10 or 15 min on ice with a mixture of 4% uranyl acetate and 2% methylcellulose (1:9, v/v). The excess of mixture was removed using Whatman filter paper. After drying, samples were observed under a JEOL JEM-2100 TEM at 200 kV. The acquisitions were made with Gatan Orius SC200D camera.
The MS/MS data were analyzed with MaxQuant software (version 1.5.8.3, Max-Planck Institute for Biochemistry, Germany) (Tyanova et al., 2016), and proteins were identified by comparing the peptide spectra against the Swissprot databases (taxonomy: Mus musculus) (Table 3). Trypsin was selected as the digestion enzyme, up to two missed cleavage sites were allowed, and carbamidomethylation of a cysteine was defined as a fixed modification. The precursor ion mass tolerance and the fragment ion mass tolerance were 0.05 Da. Peptide identification was accepted at a false discovery rate (FDR) of less than 1.0% at the protein level and if the sample produced at least 2 unique peptides. The spectra counts of each protein were normalized by the total spectra counts of identified proteins. Data analysis was contract service offered by Wayen Biotechnologies (Shanghai), Inc. (Shanghai, China).
Data derived from a spectral library of the normal urine exosome proteome generated by Label free LC-MS/MS using HCD collision were imported into Skyline version 19.1 (Vidova and Spacil, 2017). Skyline was employed to manually select the most intense peptide transitions. Up to five transitions per peptide were traced on a QTRAP 6500 mass spectrometer (AB Sciex). Peptides with potential modification sites (cysteine and methionine) and those with missed cleavage sites were excluded. A total of 2–5 peptides from one protein were selected for quantification. Using pooling sample to get the best chromotophy and mass parameter. Then we used MRM model to detect the samples. All the MRM data were imported into Skyline, which was used for further visualization, transition detection, and abundance calculation. The peptide abundance in a sample was calculated as the mean summed peak area of all selected transitions.
Extracted proteins were separated by SDS-PAGE on 10–15% gels, and then transferred onto a nitrocellulose membrane. Non-specific binding sites were blocked by 5% dried fat-free milk in Tris-buffered saline (TBS-T: 10 mmol/L Tris, 0.15 mol/L NaCl, 0.05% Tween-20, pH of the solution adjusted to 7.5). Primary antibodies (the antibodies used in this research were listed in Table 1 for exosome biomarkers and for targets proteins) were added and incubated at 4°C overnight as described previously (Song et al., 2017, 2018). Membranes were washed with TBST, and then incubated with the secondary antibody, either goat anti-mouse IgG or anti-rabbit IgG horseradish peroxidaseconjugated antibody (1:5000). Bands of immunoreactive proteins were visualized on an image system (Versadoc; Bio-Rad) after membrane incubation with enhanced chemifluorescence (ECF) reagent for 5 min as described previously (Vidova and Spacil, 2017).
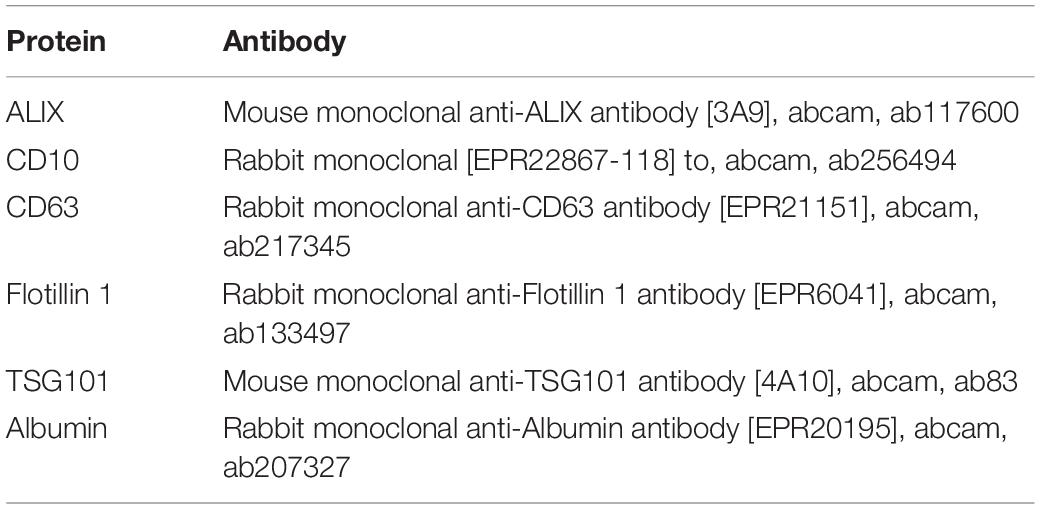
Table 1. Antibodies used for testing the urinary exosome biomarker proteins.
The amount of protein in exosomes resuspended in PBS was measured using a BCA assay kit according to the manufacturer’s instructions using bovine serum albumin as standard protein. Similar protein amounts of urinary exosomes dissolved in a lysis buffer containing 300 mM NaCl, 50 mM Tris-Cl pH 7.4, 1 mM EDTA, and 0.5% Triton X-100 were analyzed following the manufacturer’s protocol. Exosome cargo proteins were quantified by ELISA kits for mouse Annexin 2 (NOVUS, NBP2-68223) and mouse Clusterin (R&D Systems® -DuoSet ELISA, DY2747, 15 plates) according to the manufacturer’s instructions.
All assays were performed on three separate occasions. Data were expressed as means ± SD. We have checked the distribution of all datasets and all were parametric. All comparisons for parametric data were made using Student’s t-test or one-way ANOVA followed by post hoc Turkey’s test using the SPSS software (version 13.0: SPSS, Inc., Chicago, IL, United States), GraphPad Prism 5 software (La Jolla, CA, United States) and Image J software (National Institutes of Health, United States). P < 0.05 was considered statistically significant.
Urinary exosomes were isolated from 30 ml of urine in each sample (six samples, n = 15 mice per sample). Membrane vesicles less than 220 nm were purified from pooled urine samples by filtration and differential centrifugation. Quantitative analysis of urinary exosomes from the control and 5XFAD groups were tested by NTA (Table 2), which illustrated that the mean diameters of exosomes were 120.8 ± 43.0 nm (n = 642) and 103.2 ± 34.1 (n = 882), respectively (Figure 2A). The mean diameter of urinary exosomes in the 5XFAD group was smaller than that in the control group, but the concentration in the 5XFAD group was higher than that in the control group.
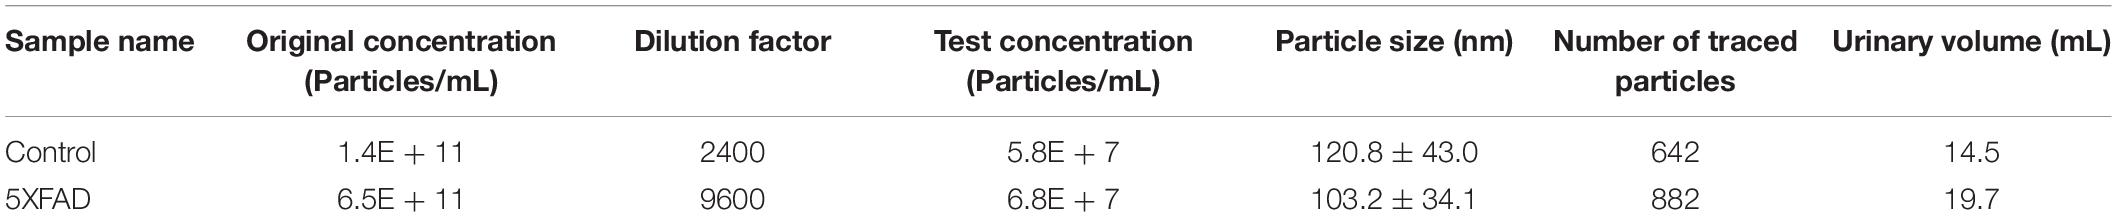
Table 2. The nanoparticle tracking analysis (NTA) of urinary exosomes.
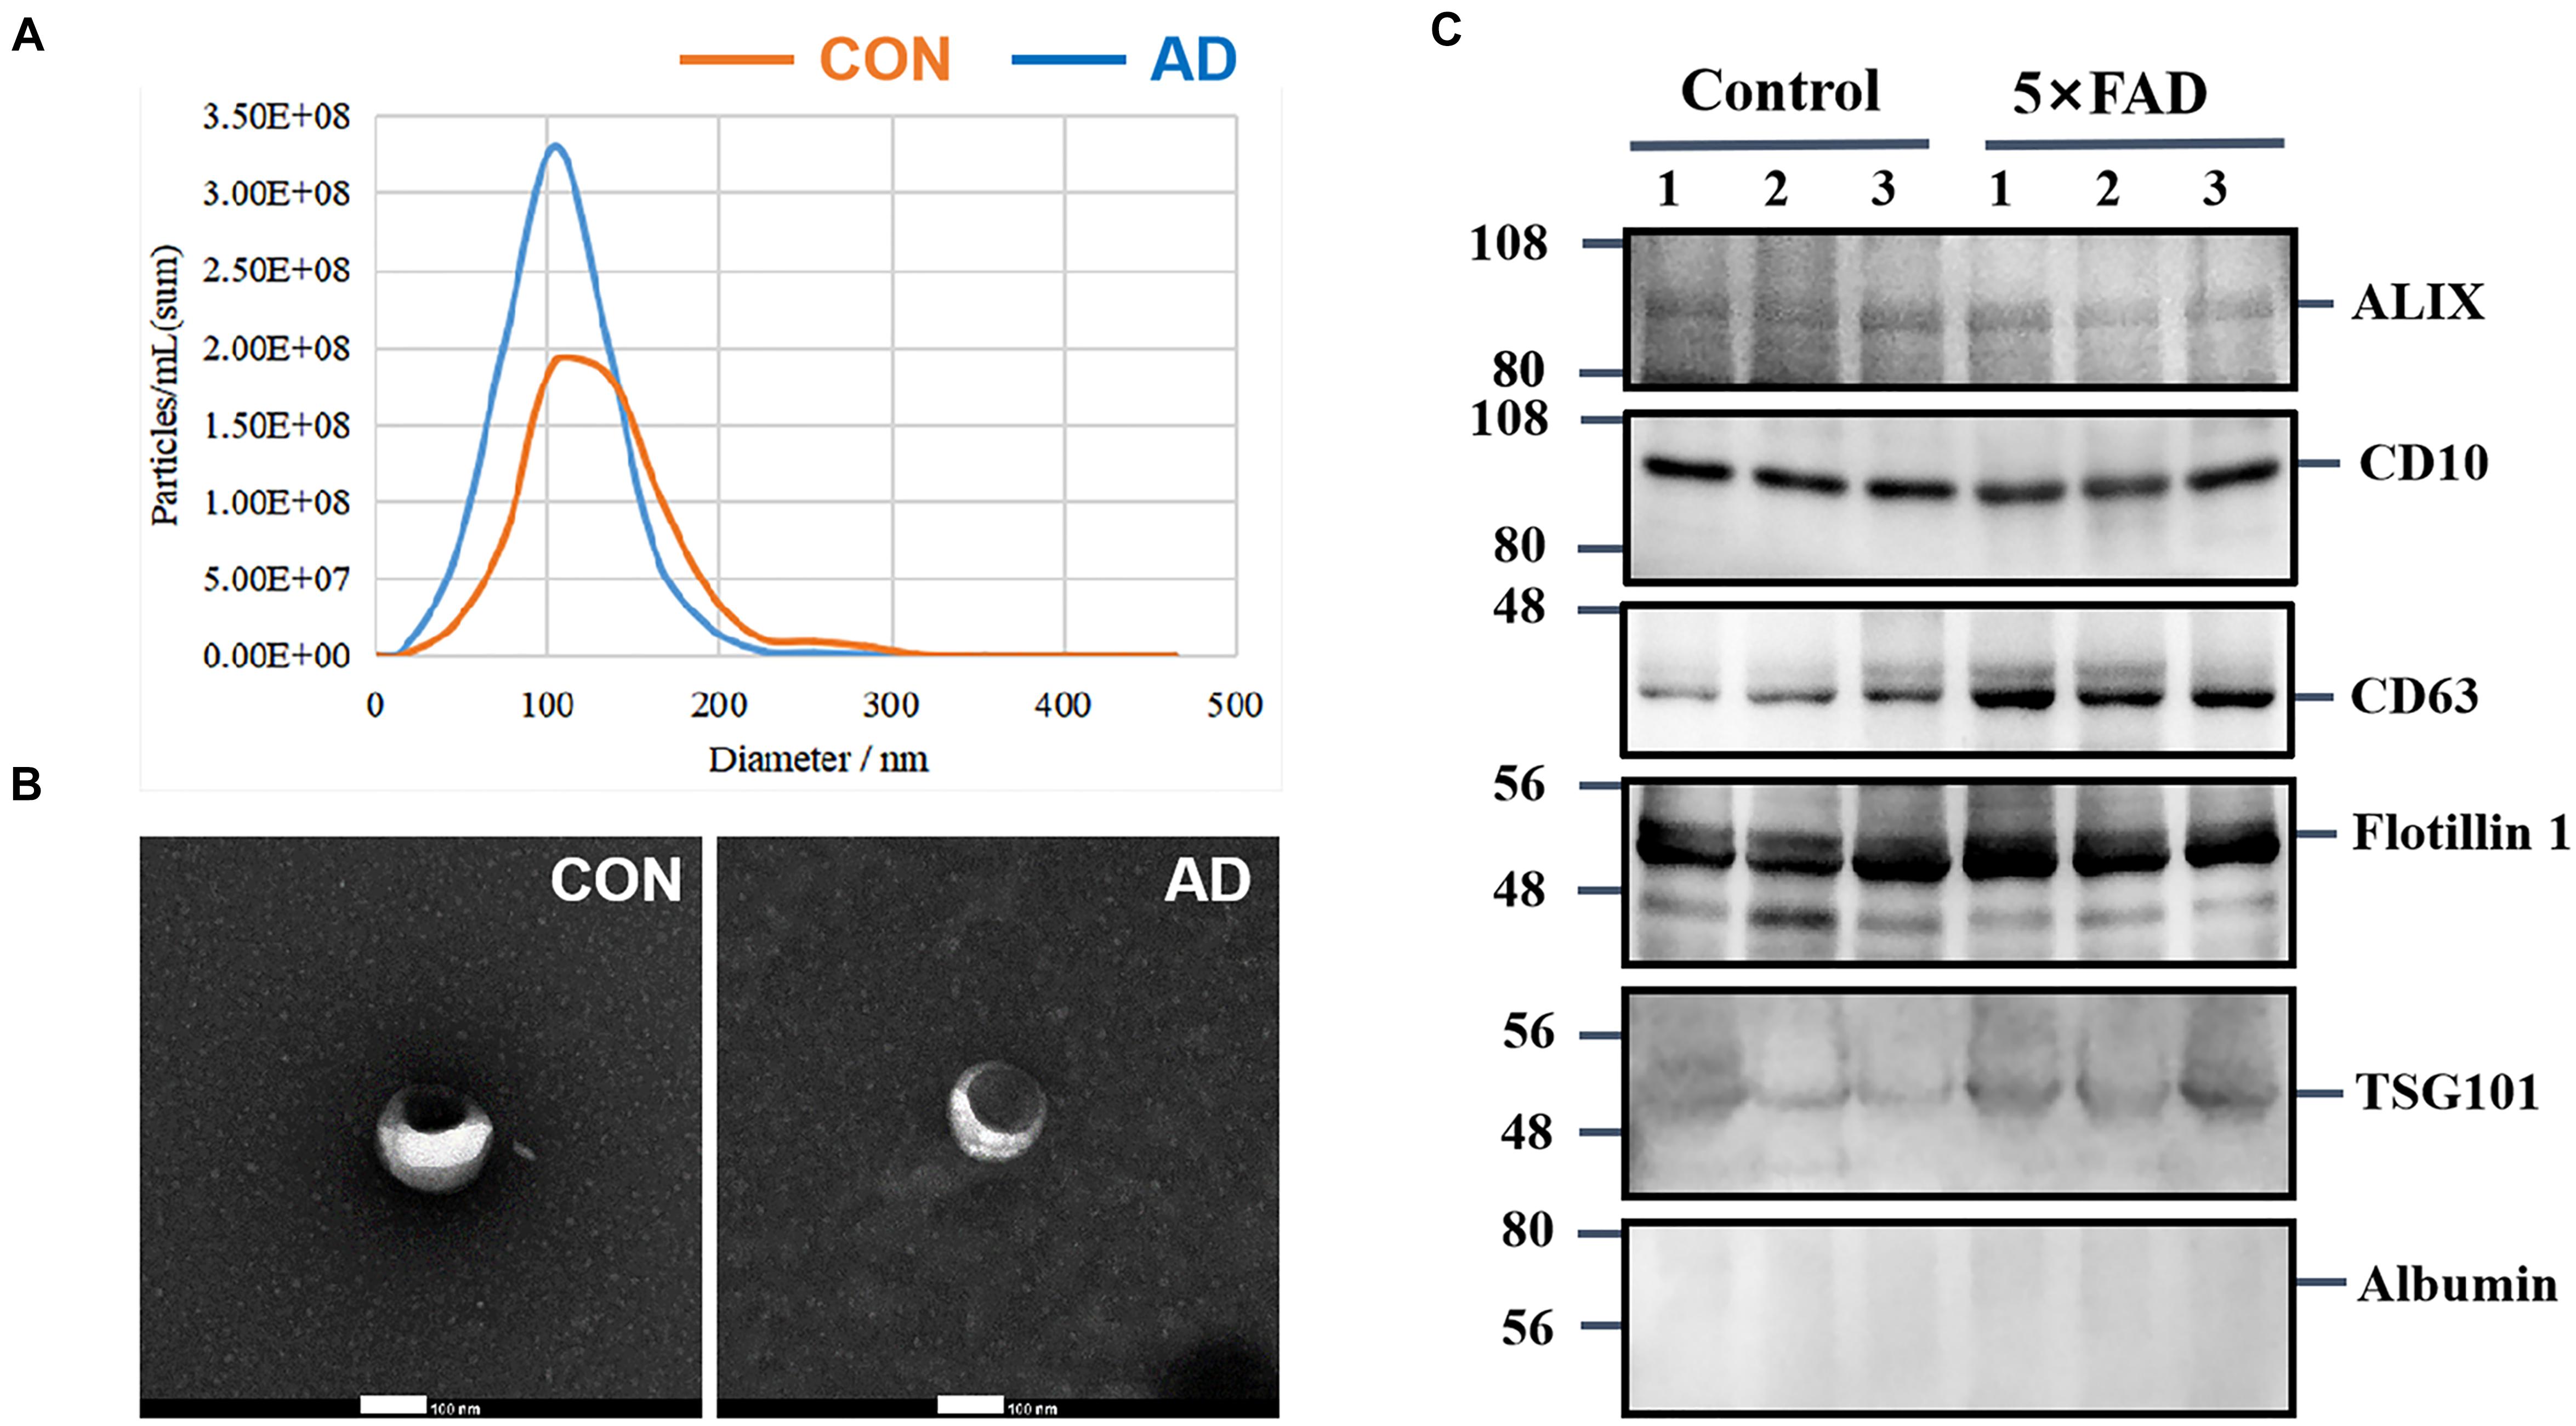
Figure 2. Characterization of urinary exosomes. (A) NTA of exosomes purified urinary exosomes. (B) The observation of exosomes by transmission electron microscopy (TEM). Bar = 100 nm. (C) After protein quantification, exosomes were lysed to perform immunoblot with specific monoclonal antibodies against typical exosome proteins were used to validate the quality of exosmes. Identification of Alix, CD10, CD63, Flotillin 1, and TSG101 in urinary exosomes (20 ug total protein per load) by Western blot, Albumin is a negative control protein were used to validate the quality of our isolation technique.
Morphologically, exosomes appear as flattened spheres or have a rounded erythrocyte-like shape as observed by a transmission electron microscope (Figure 2B). Equal amounts of protein derived from the urinary exosomes of each sample were subjected to WB analysis using antibodies that have been reported to show typical enrichment in urinary exosomal markers (Conde Vancells et al., 2010), such as the transmembrane proteins, CD10, CD63 and Flotillin 1, as well as antibodies to cytoplasmic proteins, such as Alix and TSG101. Consistent with previous research, WB analysis of the samples showed enriched content of Flotillin 1 protein compared with other proteins (Table 1); therefore, this protein could be a potentially stable biomarker for urinary exosomes. Albumin, a protein that has been previously reported in urine samples, was used to assess the influence of urine on exosomes (Figure 2C). These experiments indicate that the exosomes isolated from urine are relatively homogeneous, are not contaminated with urine, and contain exosomal markers.
The proteins in urinary exosomes were measured by a BCA assay, and then samples containing 100 μg of exosomal protein were resolved by SDS-PAGE. The gel lanes were sliced, subjected to in-gel trypsinization and analyzed by LC-MS/MS. Raw data analysis by MaxQuant software (Table 3) permitted the identification of 316 proteins (Table 4) from six groups of samples contained in the Swissprot database at a false discovery rate < 1%. In total, 88 urinary exosomal proteins were significantly different between the 5XFAD and control groups based on the qualitative and quantitative analyses (Table 5 and Figure 3A). Compared with the control group, 53 proteins were up-regulated (ratio ≥ 1.2, P-value < 0.05) and 27 proteins were down-regulated (Ratio ≤ 0.83, P-value < 0.05) in the 5XFAD group according to precursor intensity quantitative analysis. The results were plotted and characterized as a heatmap showing differential hierarchical protein clusters with similar expression profiles (Figure 3A). Eighteen proteins were unique to the 5XFAD groups. In contrast, only one unique protein was found in the control group (Table 5). Among these differentially expressed proteins, 11 proteins were also cell markers in the brain and were selected for further study (Table 6). Specifically, at least 30 proteins had been reported to be associated with the pathological mechanisms or development of AD, while six were identified as direct AD biomarkers (Table 7) and had great potential to be considered as candidate urinary exosomal biomarkers of AD.
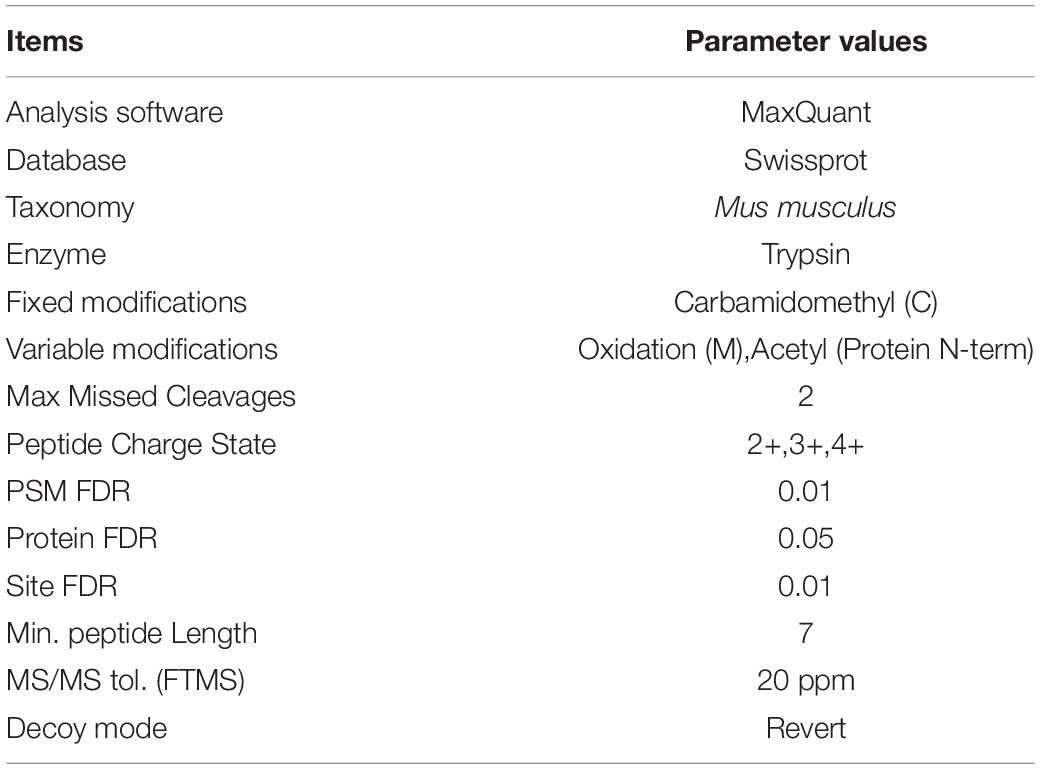
Table 3. The parameter values of the screening analysis of MS.
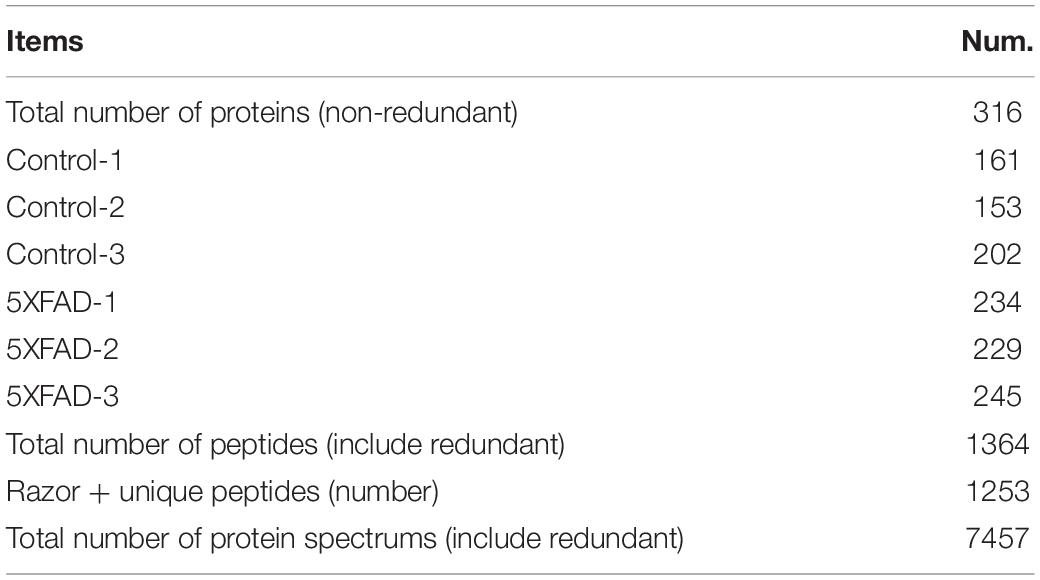
Table 4. The screened number of urinary proteins in each samples.
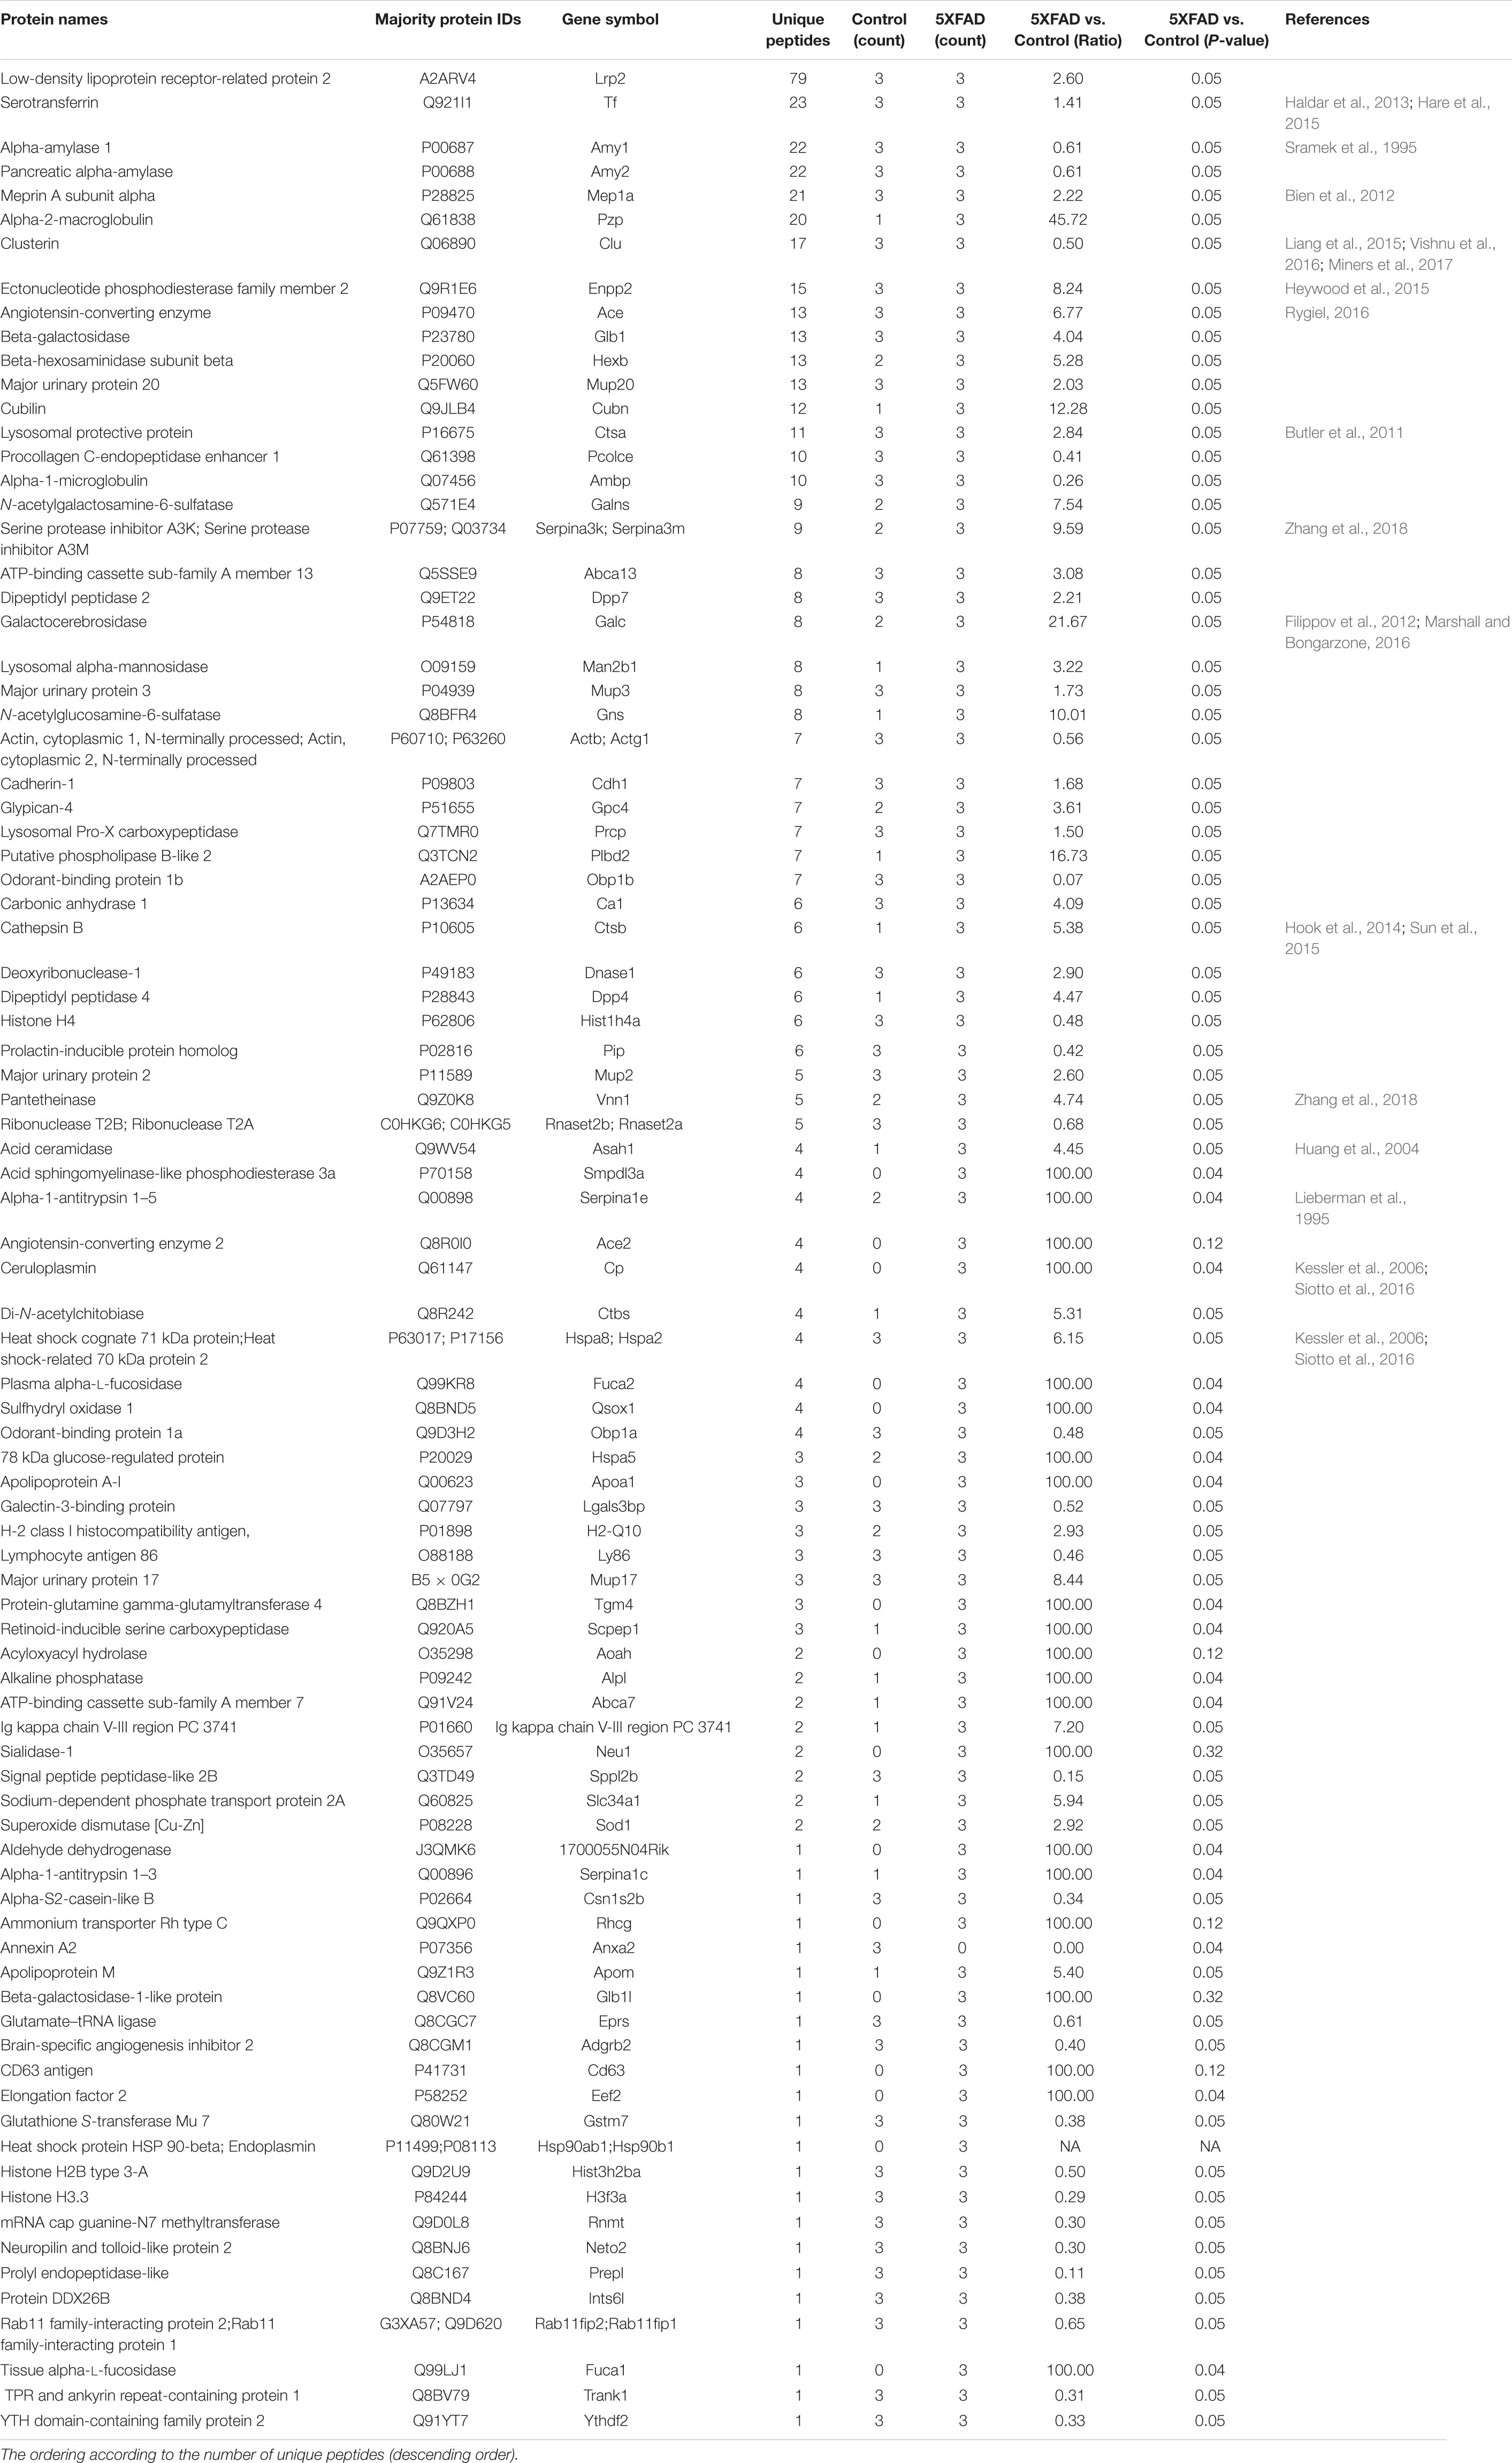
Table 5. Details of differential urinary exosomal proteins between control and 5XFAD groups.
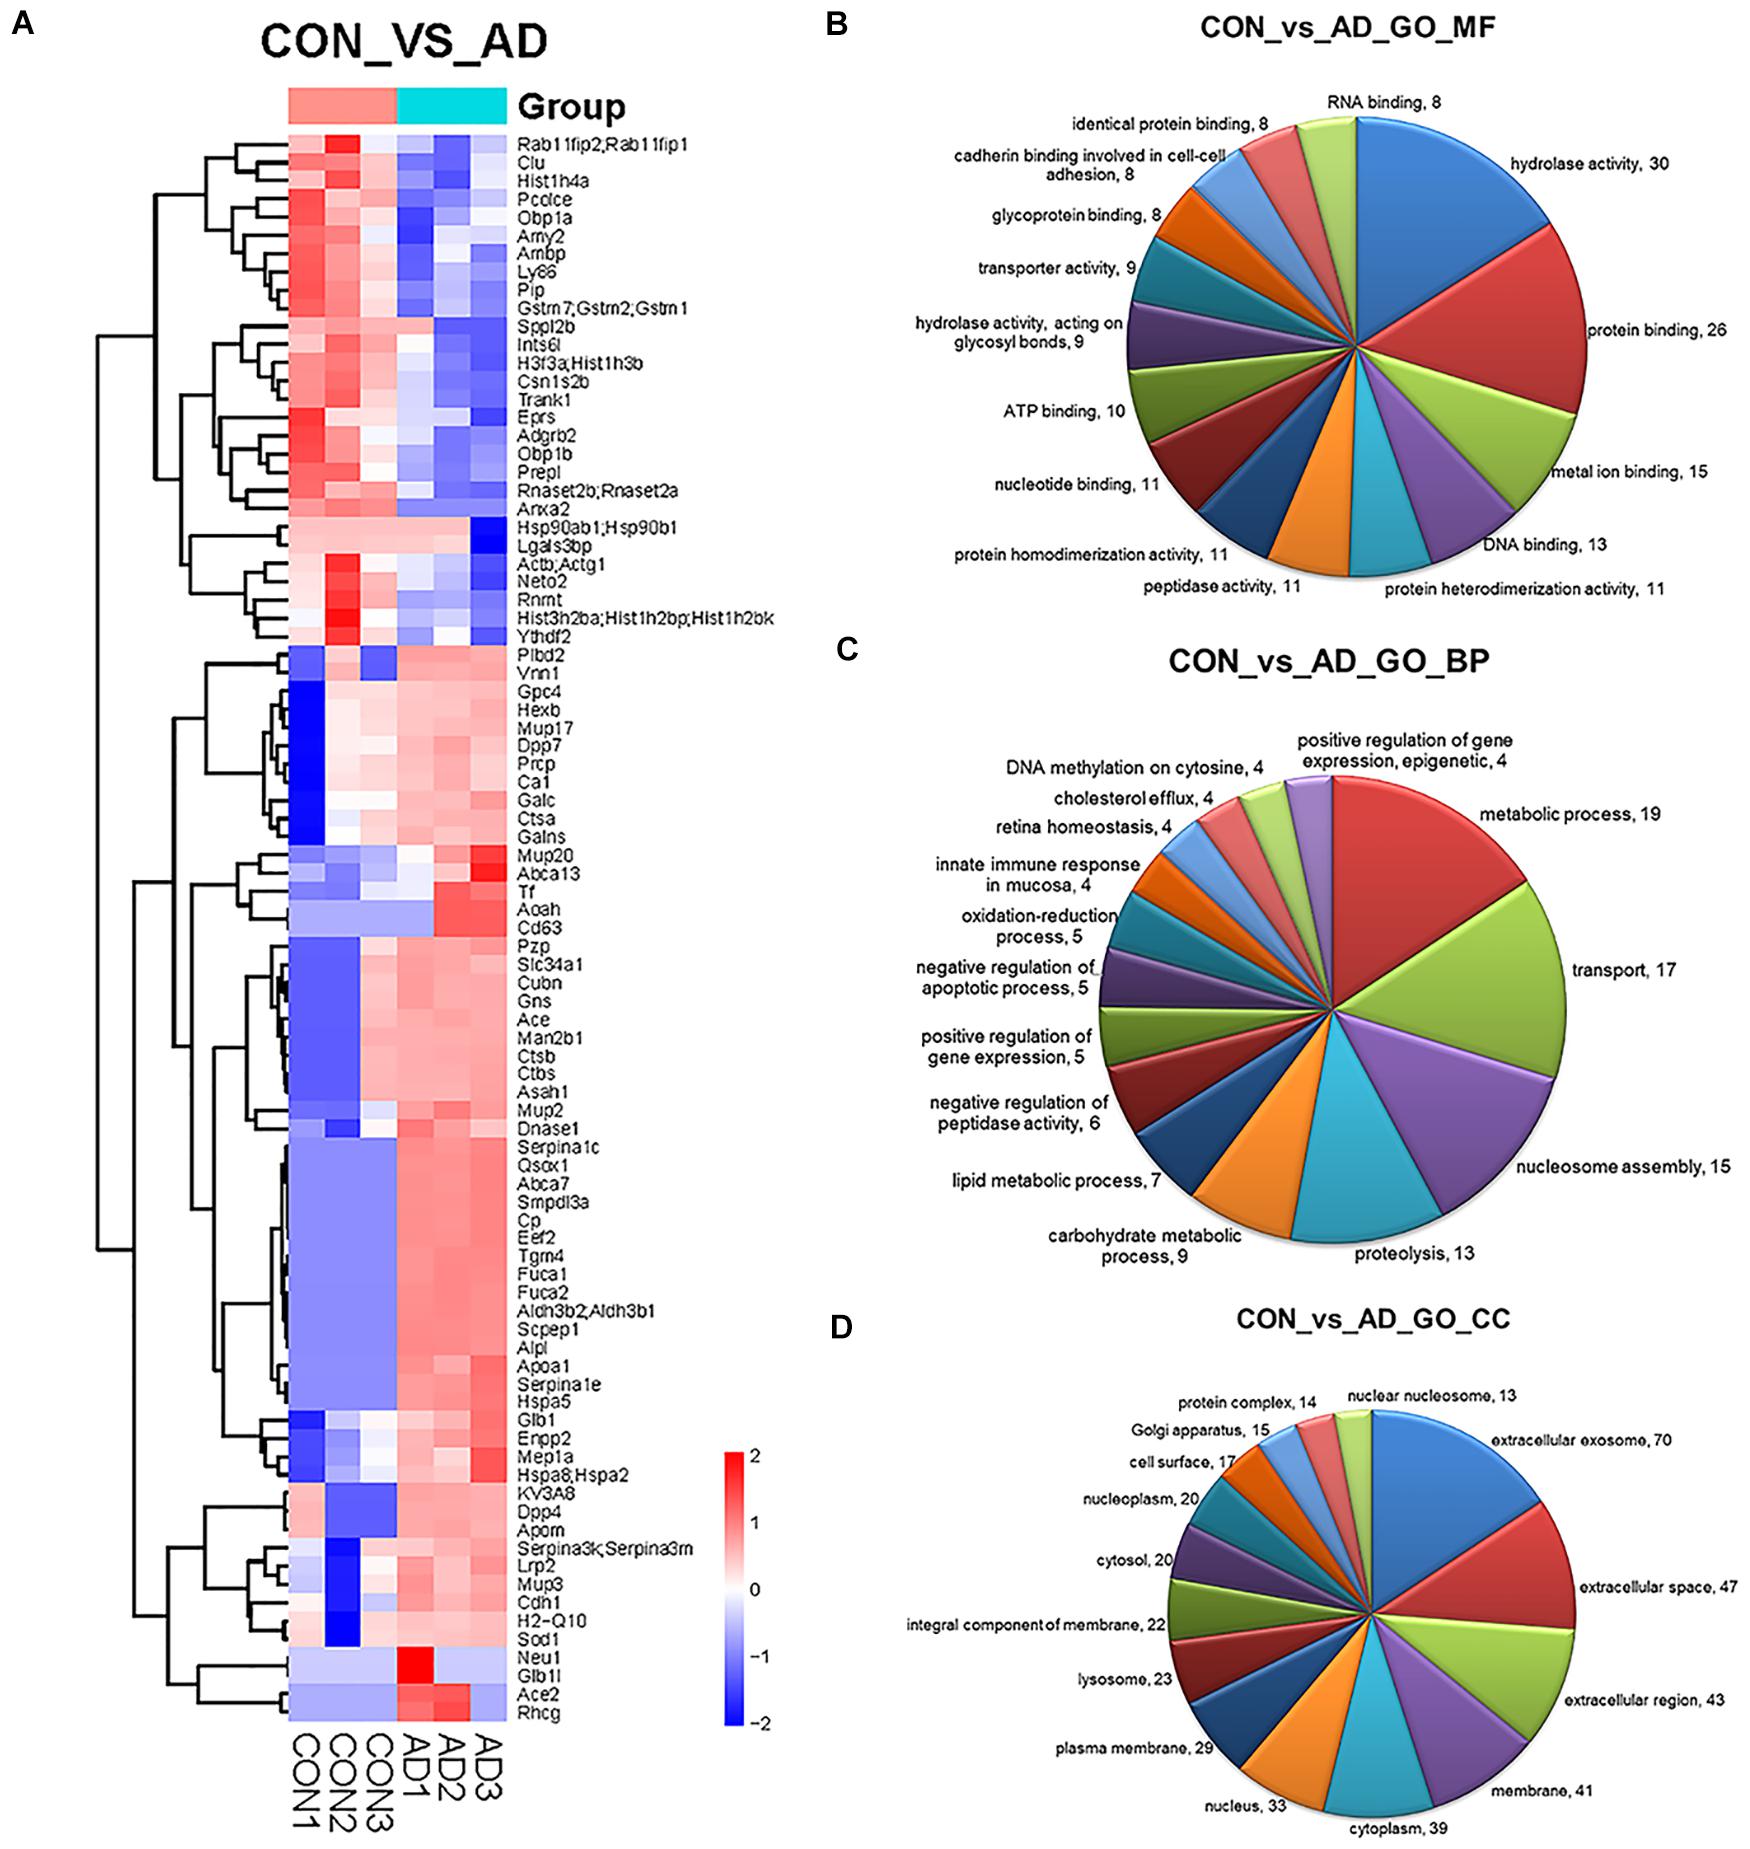
Figure 3. Comparison of the proteomics analysis by hierarchical cluster and gene ontology. (A) Heatmap illustrating the classification of control and 5XFAD mice (x axis) based on the deferentially expressed proteins (y axis) and unbiased clustering analysis in urinary exosomes. (B–D) Pie diagrams of Gene ontology (GO) analysis of the differentially expressed proteins was performed to study the specific MFs, BP, and CCs (the top 15 counts are shown) Comparison between control and 5XFAD mice samples in term of number of genes identified for different GO terms. Amounts of the top 15 terms with P-value < 0.05.
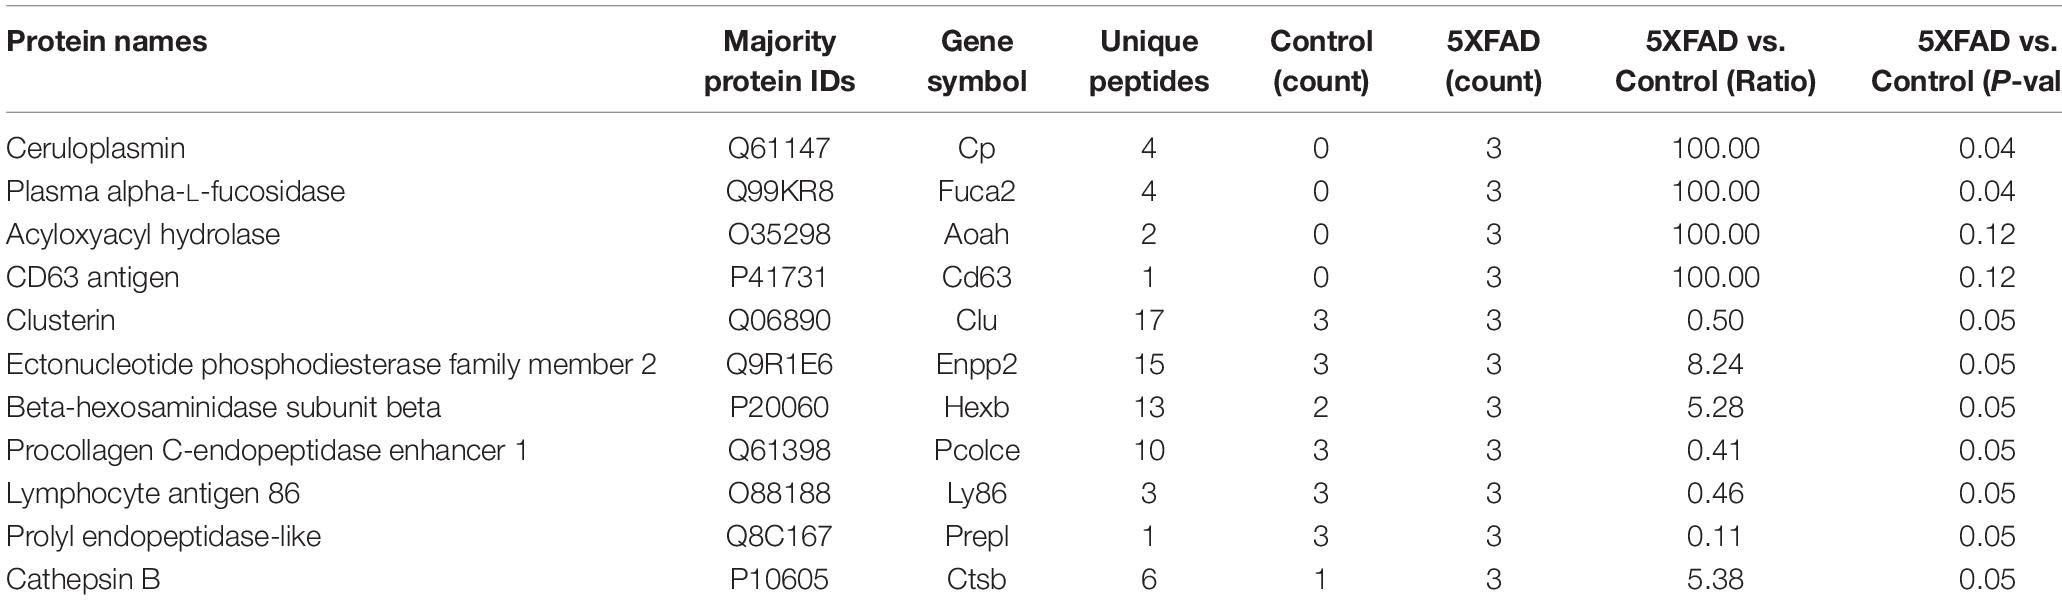
Table 6. Differential proteins identified in urinary exosomes that are associated with cell makers of brain.
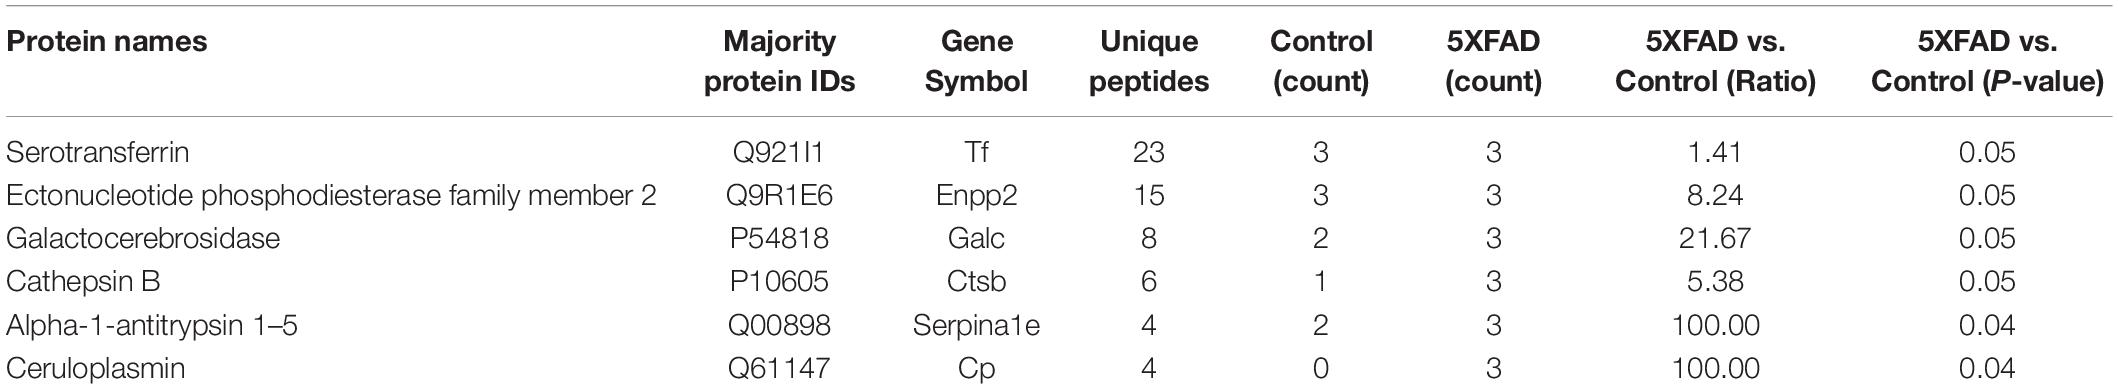
Table 7. Differential proteins identified in urinary exosomes have been reported as direct AD biomarkers.
Gene ontology (GO) analysis of the differentially expressed proteins was performed to study the specific molecular functions (MF), BP, and CCs (the top 15 counts are shown) (Figures 3B–D). Functional enrichment analyses based on GO terms revealed that differentially expressed urinary proteins mainly included extracellular exosomes or proteins associated with secretion of exosomes that participate in metabolic processes, transport, and gene expression. Kyoto Encyclopedia of Genes and Genomes (KEGG) pathway analysis (the top 15 proteins with the greatest fold enrichment are shown) (Figure 4A) (Table 8) showed that the enriched pathways within the cluster revealed that the differentially expressed proteins were mainly involved in (1) catabolic pathways, such as glycan degradation, protein digestion and absorption, and sphingolipid metabolism; (2) the immune system, such as antigen processing and presentation; and (3) cellular metabolism, such as lysosomes, endocytosis, and phagosomes. Interestingly, two genes, HSPA5 and SOD1, involved in prion disease, which is also a neurodegenerative disease with pathogenesis similar to AD, were also enriched (Silva et al., 2014). Additionally, endoplasmic reticulum (ER) chaperone immunoglobulin binding protein (BiP/GRP78) which is encoded by HSPA5 binds to and facilitates correct folding of the nascent cellular amyloid precursor protein (APP) (Yang et al., 1998). BiP/GRP78 also plays an essential role in protection from neuronal apoptosis (Wang et al., 2010). In contrast to the KEGG pathway analysis, GO term enrichment analyses revealed that GO terms associated with “metabolic process” and “immune response” were enriched. The above data demonstrated that significant changes involved in metabolic dysfunction and immune system disorders occurred even in the very early stage in 5XFAD mice. Determination of the PPI network offered a conceptual framework to better understand the functional organization of the differentially expressed urinary exosomal proteins with potential interactions (Figure 4B). Red indicated upregulated genes, and green indicated downregulated genes in the present study.
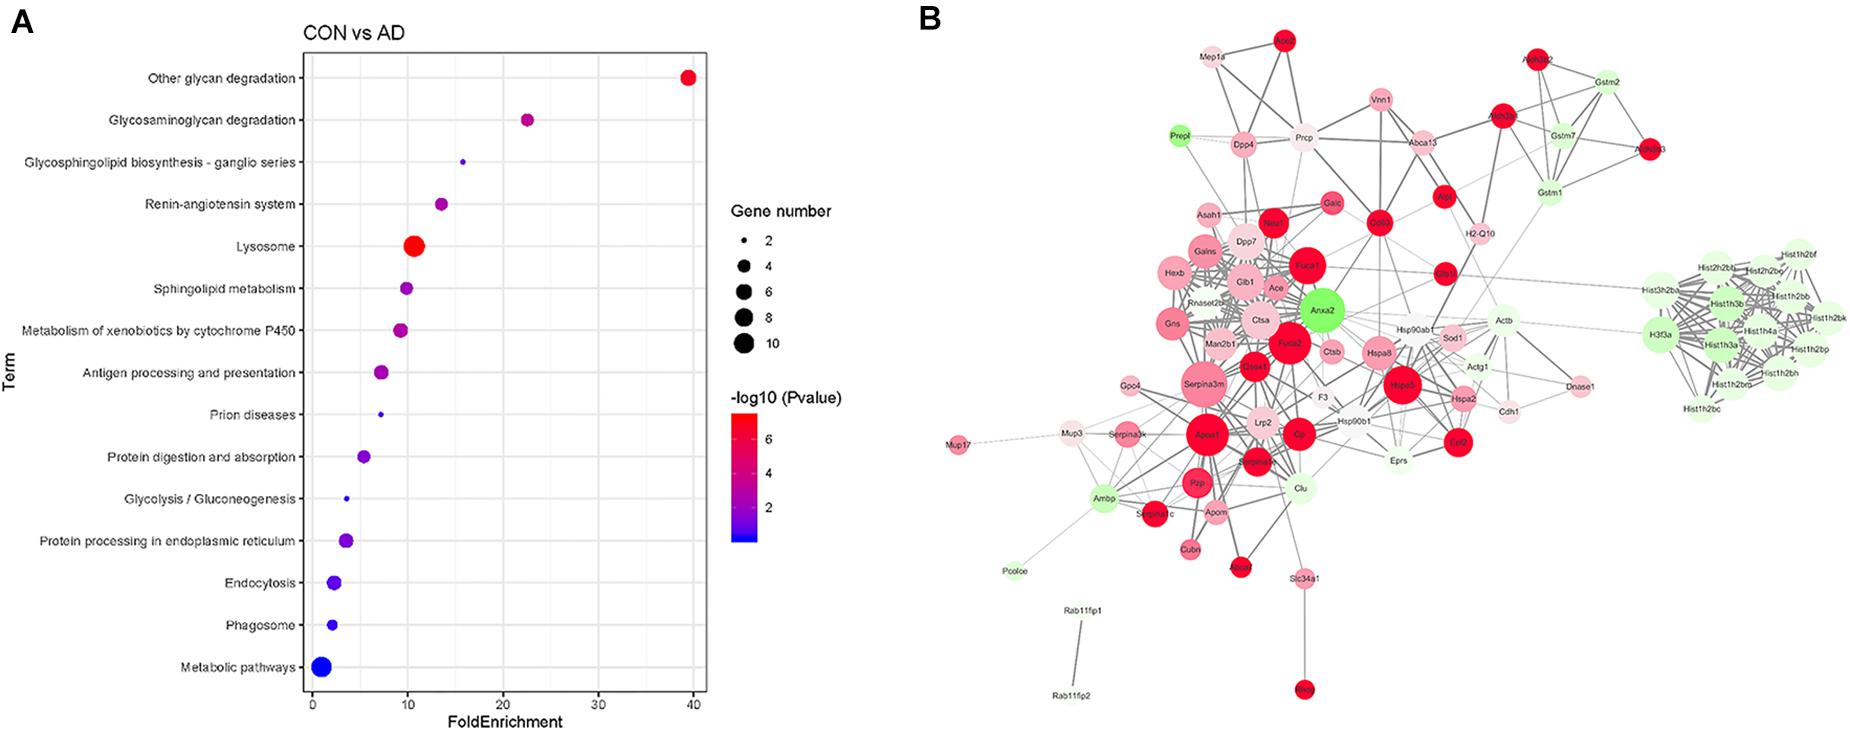
Figure 4. Comparison of the proteomics analysis by KEGG pathway and PPI network analysis. (A) Kyoto Encyclopedia of Genes and Genomes (KEGG) pathway analysis (the top 15 proteins with the greatest fold enrichment are shown). Dot plots of enriched KEGG pathways in differential proteins. The x axis shows the fold enrichment of each KEGG pathway, whereas the color denotes the P-value and the area of the dots represents the number of genes assigned to each KEGG pathway. The y axis displays KEGG pathway term. (B) PPI analysis showed the differential proteins are involved in different network. Red indicated upregulated genes, and green indicated downregulated genes in the present study.
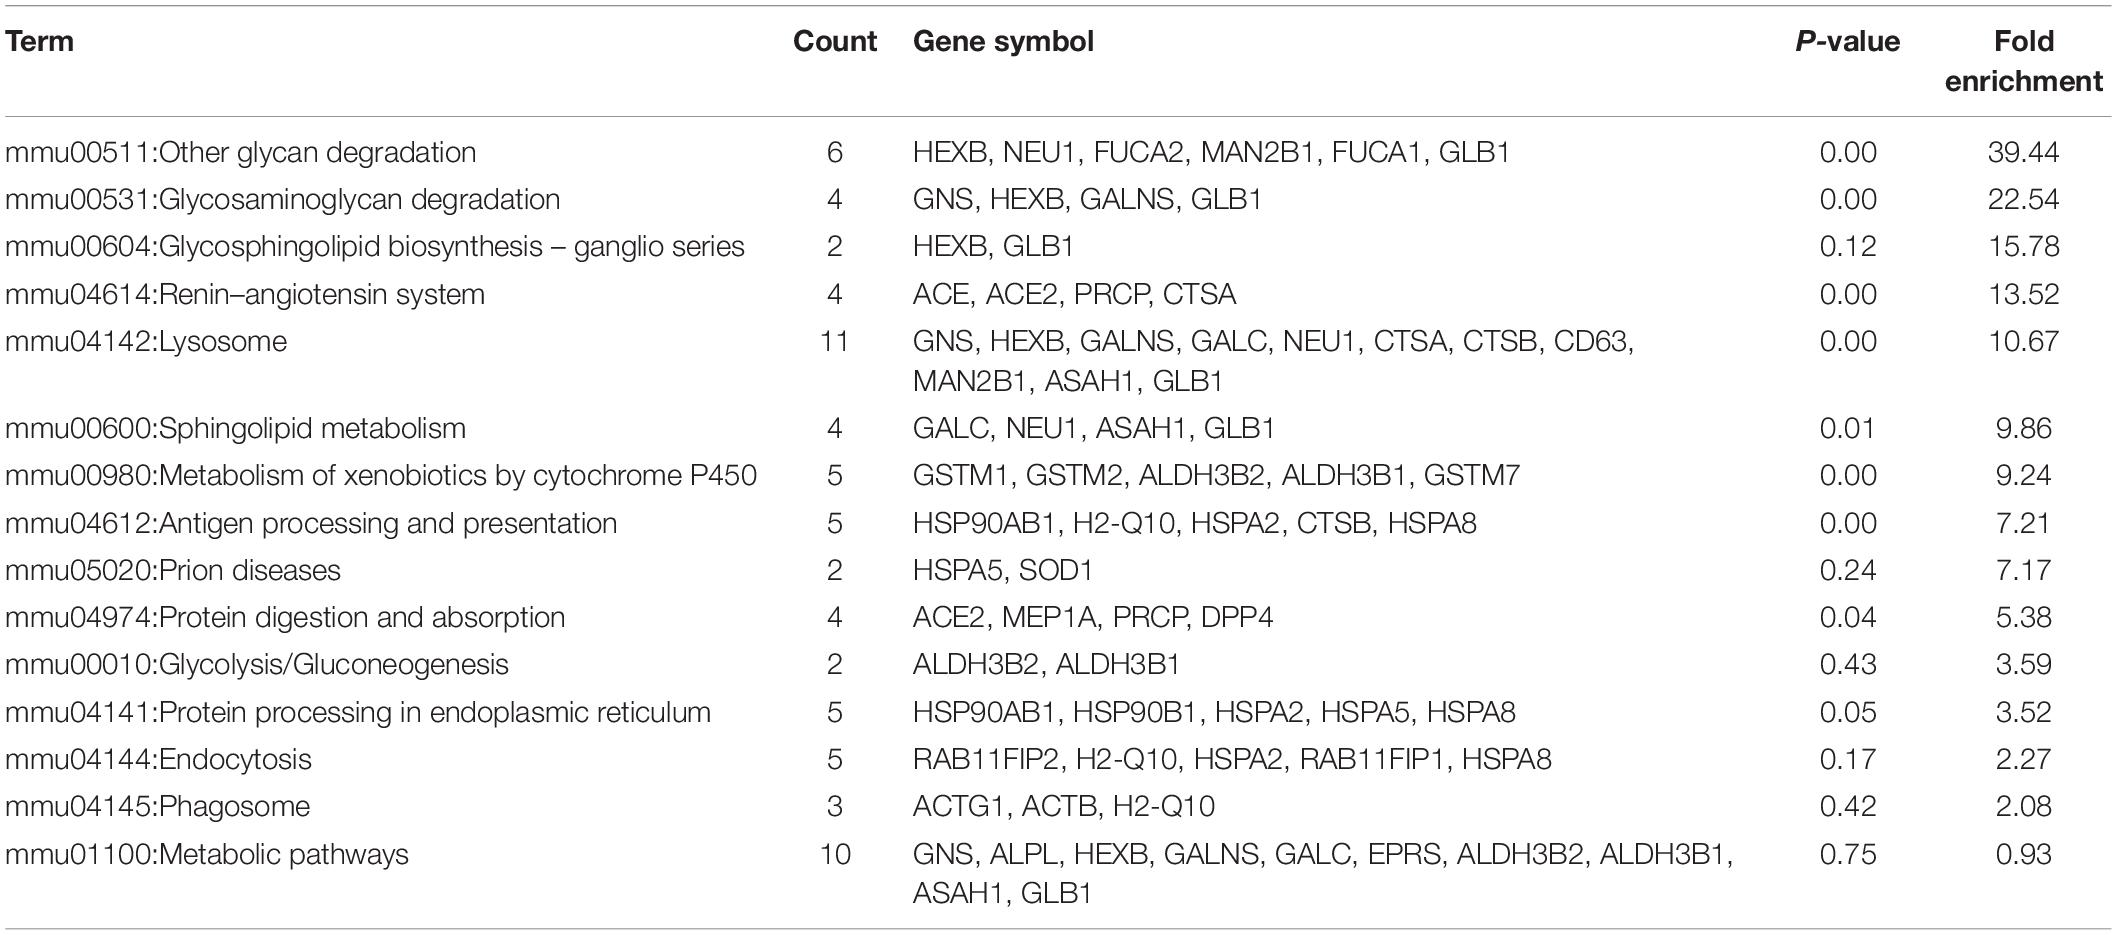
Table 8. Detail information of Kyoto Encyclopedia of Genes and Genomes (KEGG).
In the total identified proteins, 44 proteins are cell markers associated with the brain. Eighty-eight urinary exosomal proteins were significantly different between the 5XFAD and control groups based on the qualitative and quantitative analyses. Among them, 11 proteins are cell markers associated with the brain (Table 6). Fifth proteins that unique expression in different groups were selected. According to the results of the proteomic analysis, a total of 22 proteins were selected to do the next verification (Supplementary Figure 1). To make the relationship of targeted proteins more clear and intuitive, we further added the protein–protein interaction (PPI) network analysis of the 22 targeted proteins (Figure 5A). Next, MRM assays were showed in Figure 5B. The sequence and mass values of the surrogate peptides and their heavy version are summarized in Table 9. The peak area of surrogate peptides from each protein was calculated and the relative quantity was compared between control and 5XFAD mice groups. FUCA2 (P = 0.00075), Ly86 (P = 0.021), PrP (P = 0.0045), Annexin 2 (P = 0.0063), and Fuca1 (P = 0.038) showed significant different between two groups.
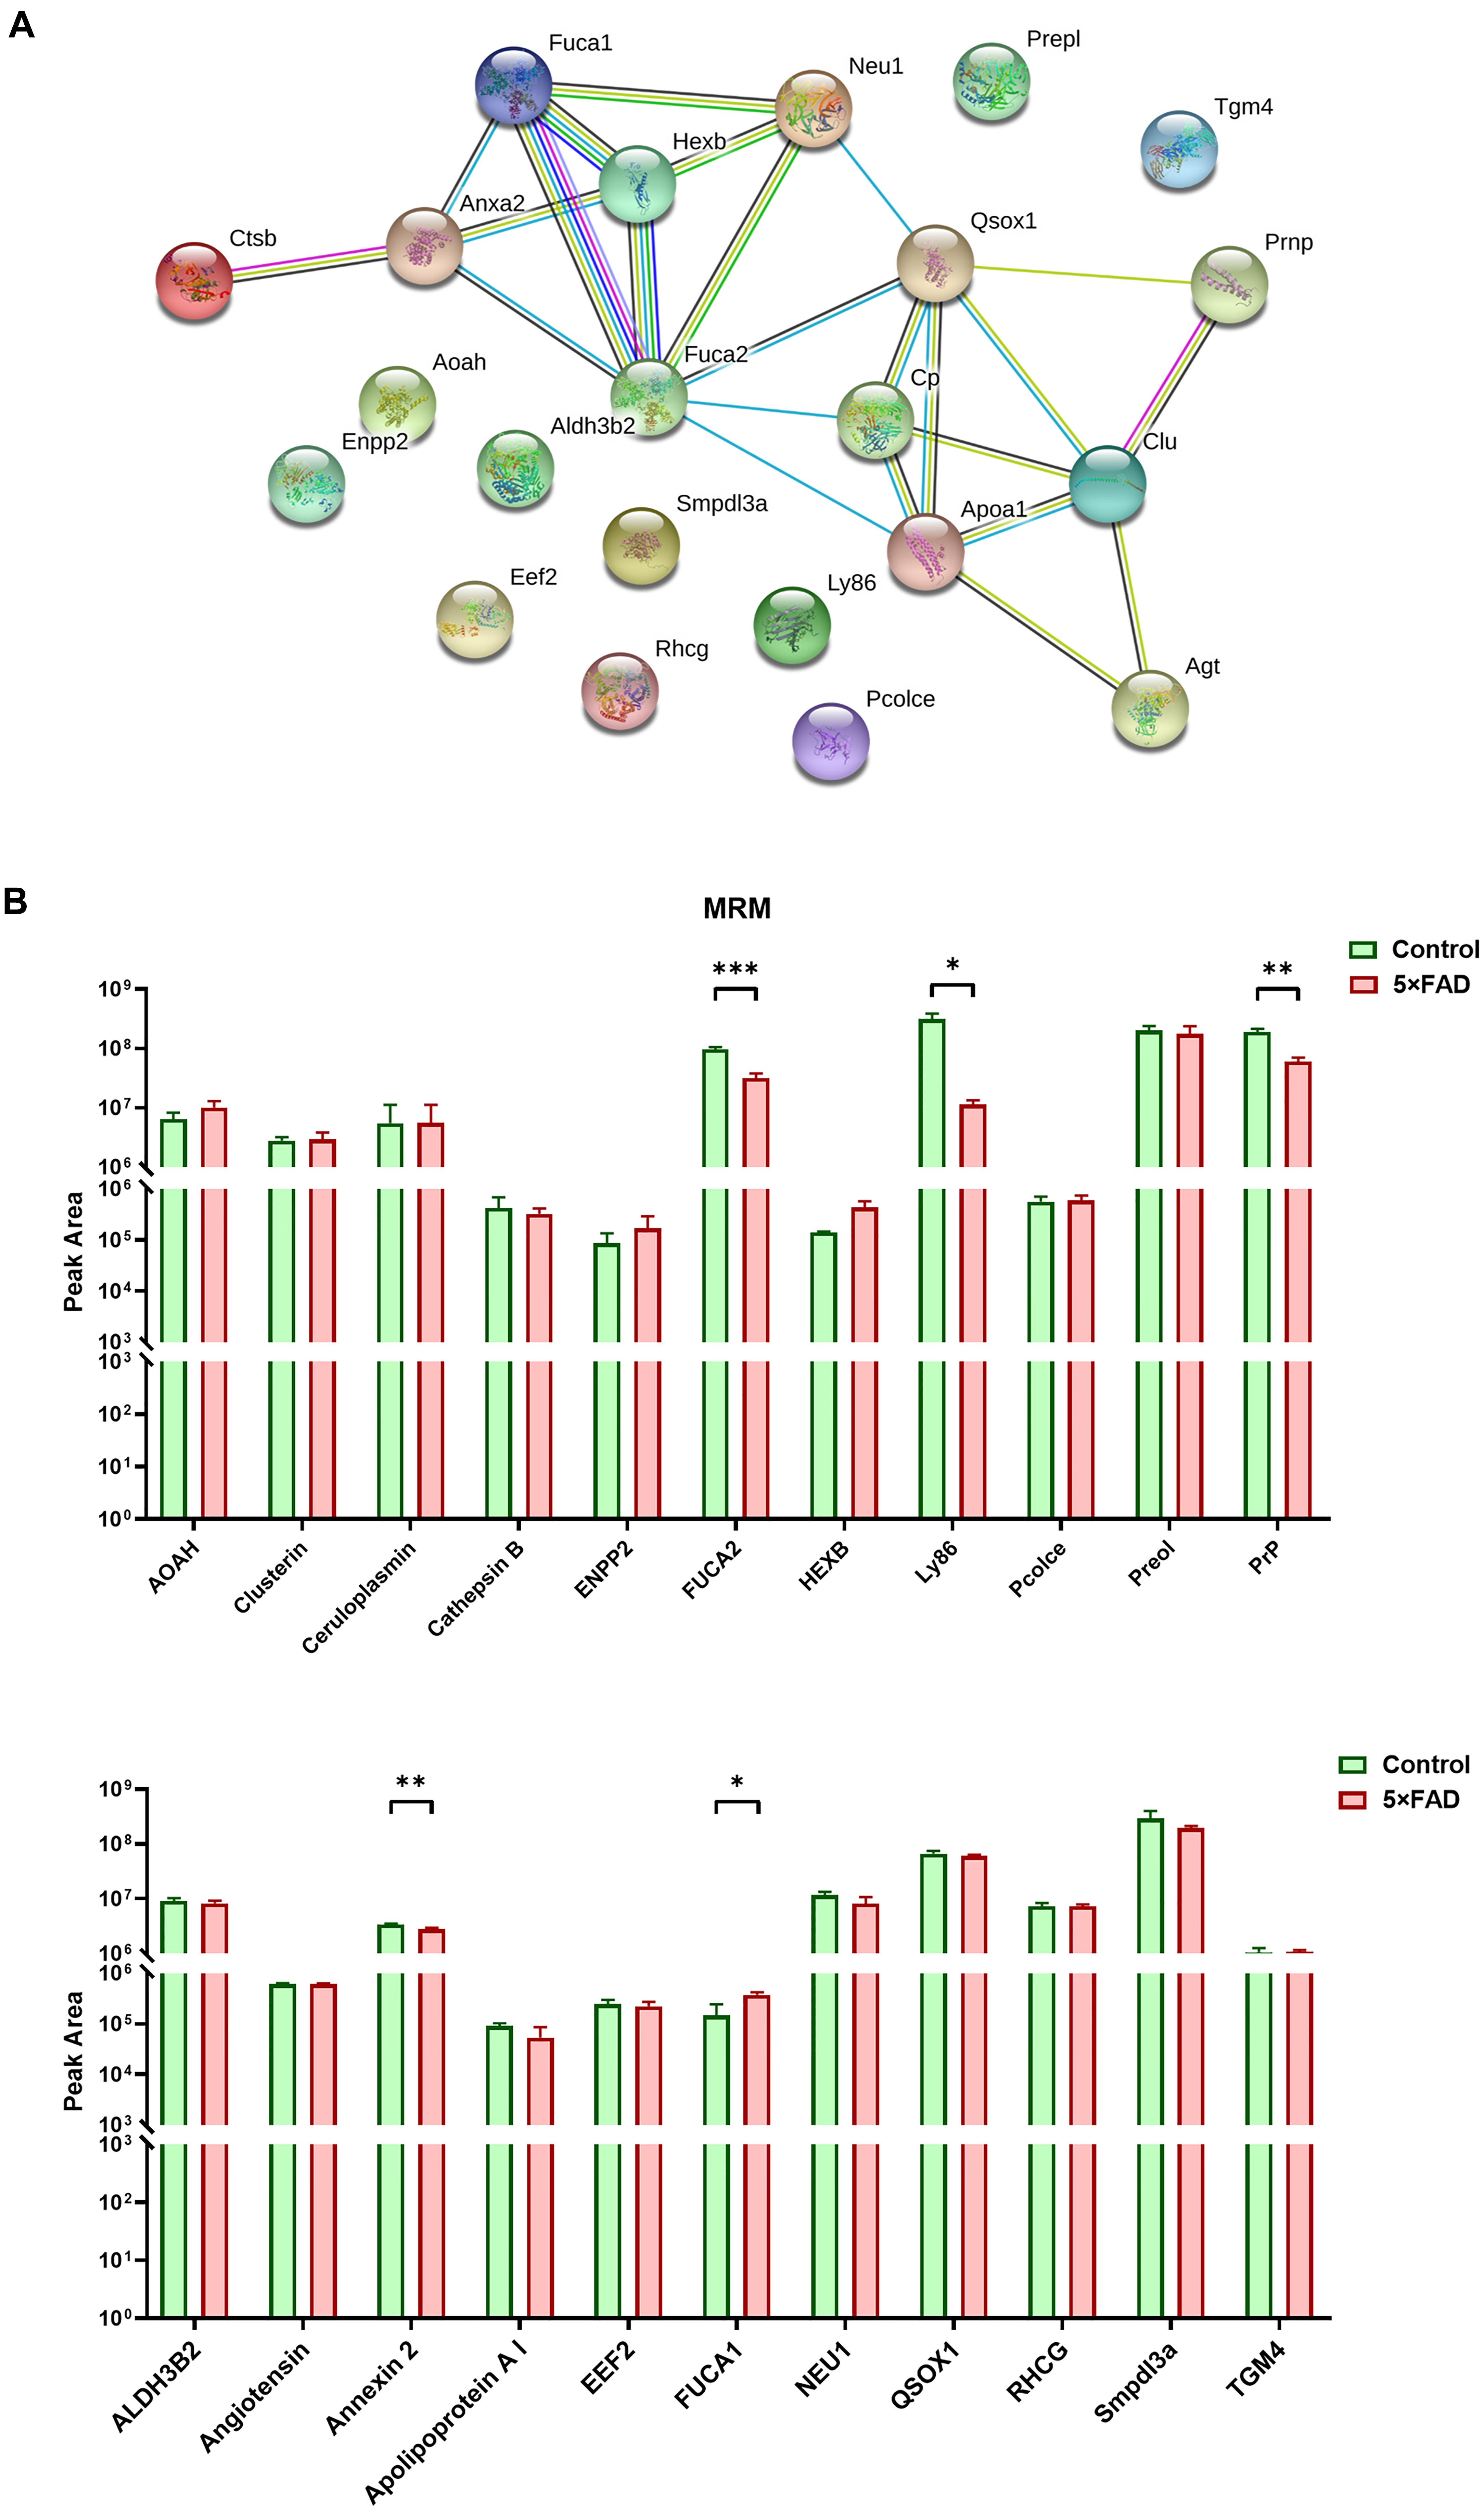
Figure 5. PPI analysis and multiple reaction monitoring (MRM) assays for the target proteins from control and 5XFAD mice. (A) PPI analysis showed the relationship of the target differential proteins. More lines between two proteins represented more possible interaction. (B) The relative peak area of 22 target proteins were measured by MRM between control and 5XFAD mice. All data are presented as mean ± SD in triplicate experiments; Student’s t-test; *P < 0.05; **P < 0.01; ***P < 0.001.
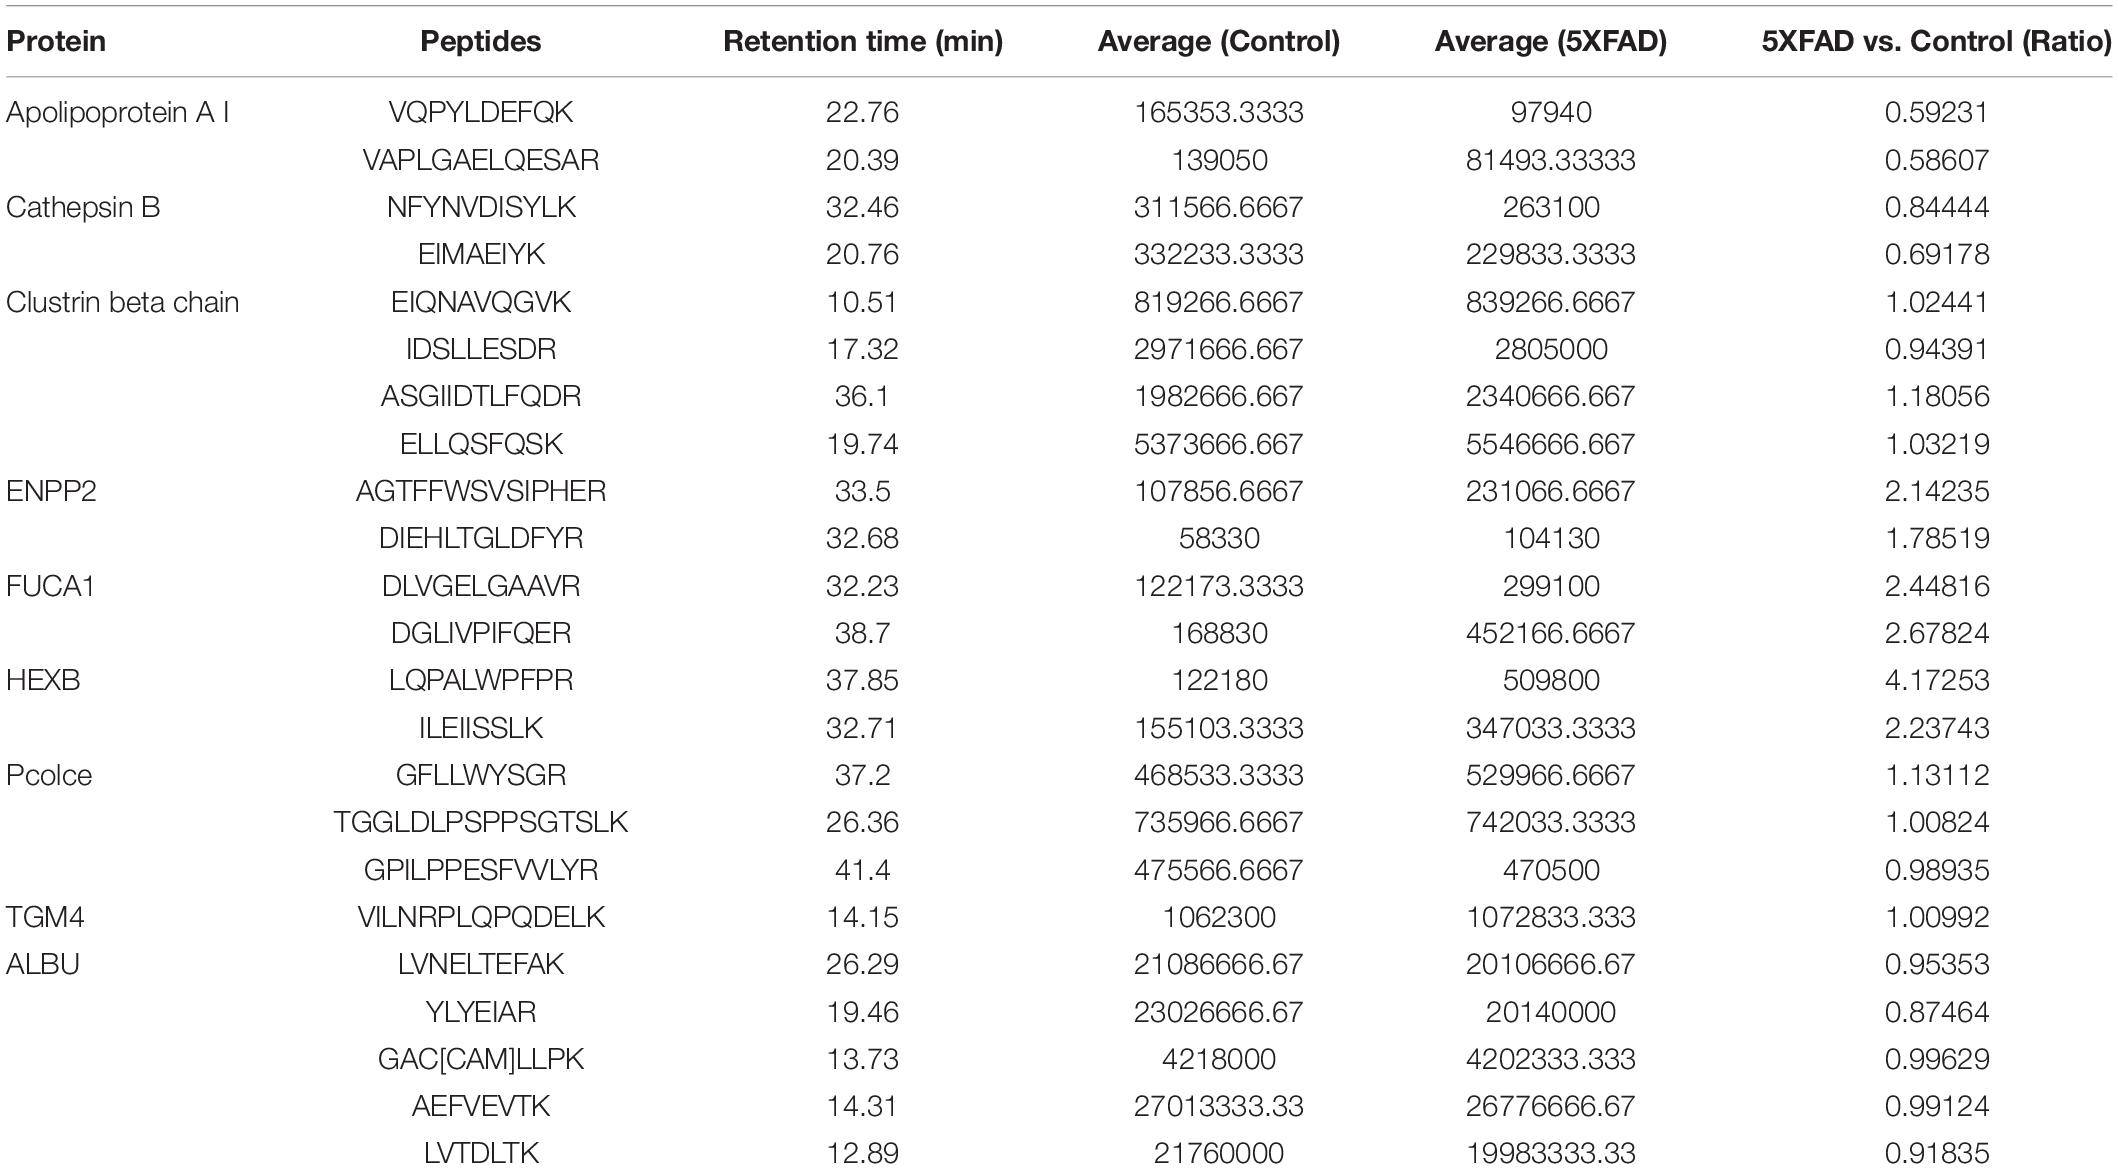
Table 9. Peptides used for MRM.
All the 22 target proteins were analyzed by both MRM and WB (Figures 6A, 7A). The samples were displayed in the same loading order to confirm the above results by WB. The corresponding immunoblotting density of these proteins is shown in Figures 6B–L, 7B–L. Remarkably, according to the above three methods, HEXB, a lysosome and/or autophagy pathway protein, was significantly increased in the urinary exosomal proteins compared with the control group, consistent with the differential expression of HEXB in the brain of 5XFAD mice (Bai et al., 2020). Additionally, four proteins, AOAH, Clustrin, Ly86, and Preol, showed the same trend, with significant differences in the proteome and WB analyses. Compared with the control group, the AOAH level was significantly increased in the 5XFAD group; in contrast, the levels of Clustrin, Ly86, and Preol were obviously decreased. Based on the MRM and WB results, Apolipoprotein A1 and Cathepsin B were significantly reduced in 5XFAD mice compared with the control group, but these results are inconsistent with the proteomic analysis. However, although the quantitative WB analysis indicated no significant changes, proteome and MRM analyses demonstrated that the ENPP2 and Fuca1 levels in 5XFAD mice are higher than those in the control group. Although just five proteins were significant detected by MRM analyses, most of the other results showed the same trend to the results of WB. Independent of the other analysis, WB showed that in addition to the above mentioned proteins, seven proteins (ALDH3B2, Annexin-2, Ceruloplasmin, EEF2, FUCA2, PrP, and NEU1) were significantly decreased and one protein (Pcolce) was significantly increased in 5XFAD mice compared with the control group (Table 10). The sensitivity and accuracy vary in different methods, and these differentially expressed proteins need to be further explored based on their biological function.
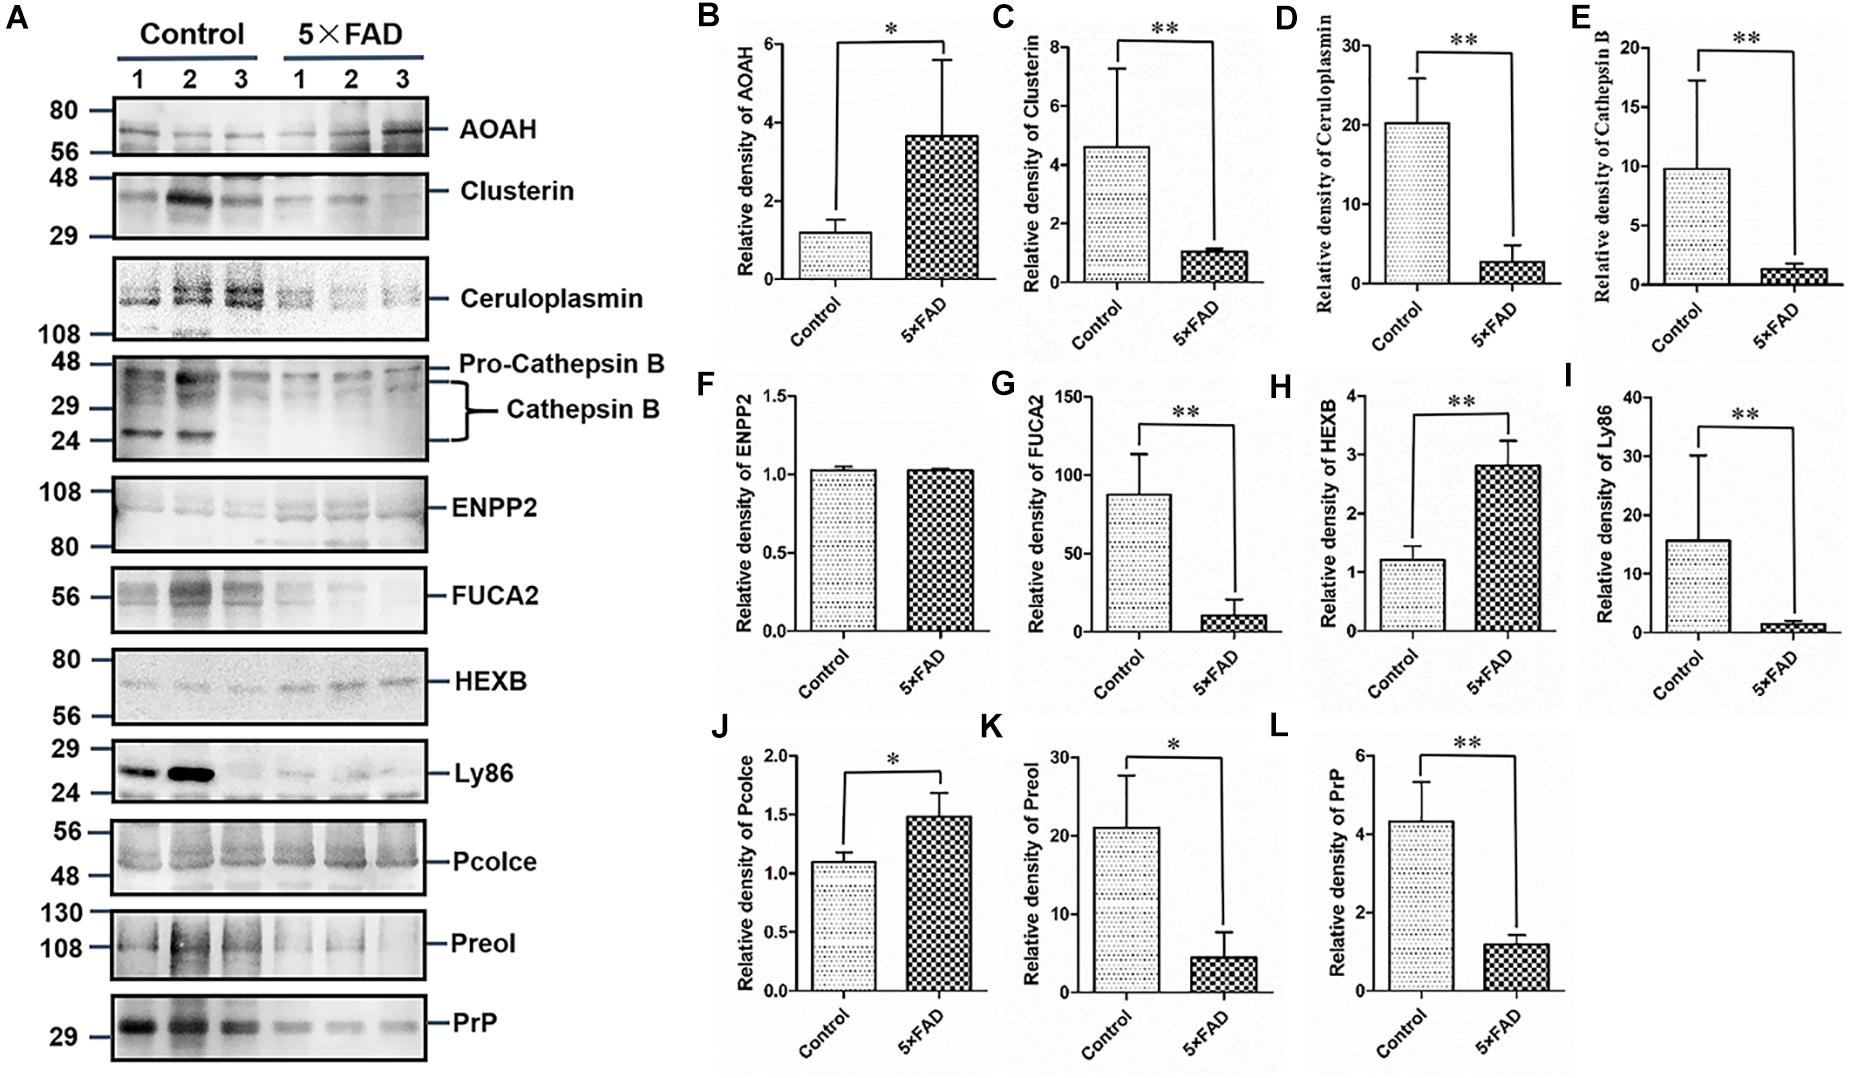
Figure 6. Western blots (WB) and quantitative analysis of 11 differential proteins in the urinary exosomes isolated from control and 5XFAD mice. (A) Same aliquot of urinary exosomes isolated from three control samples and three 5XFAD mice samples. AOAH, Clusterin, Ceruloplasmin, Cathepsin B, ENPP2, FUCA2, HEXB, Ly86, Pcolce, Preol, and PrP proteins were detected by WB in sequence. Representative blots of the tested proteins and the molecular weight of standard proteins were presented. (B–L) Quantitative analysis of each of the tested protein’s relative fold change, respectively. All data are presented as mean ± SD in triplicate experiments; Student’s t-test; *P < 0.05; **P < 0.01.
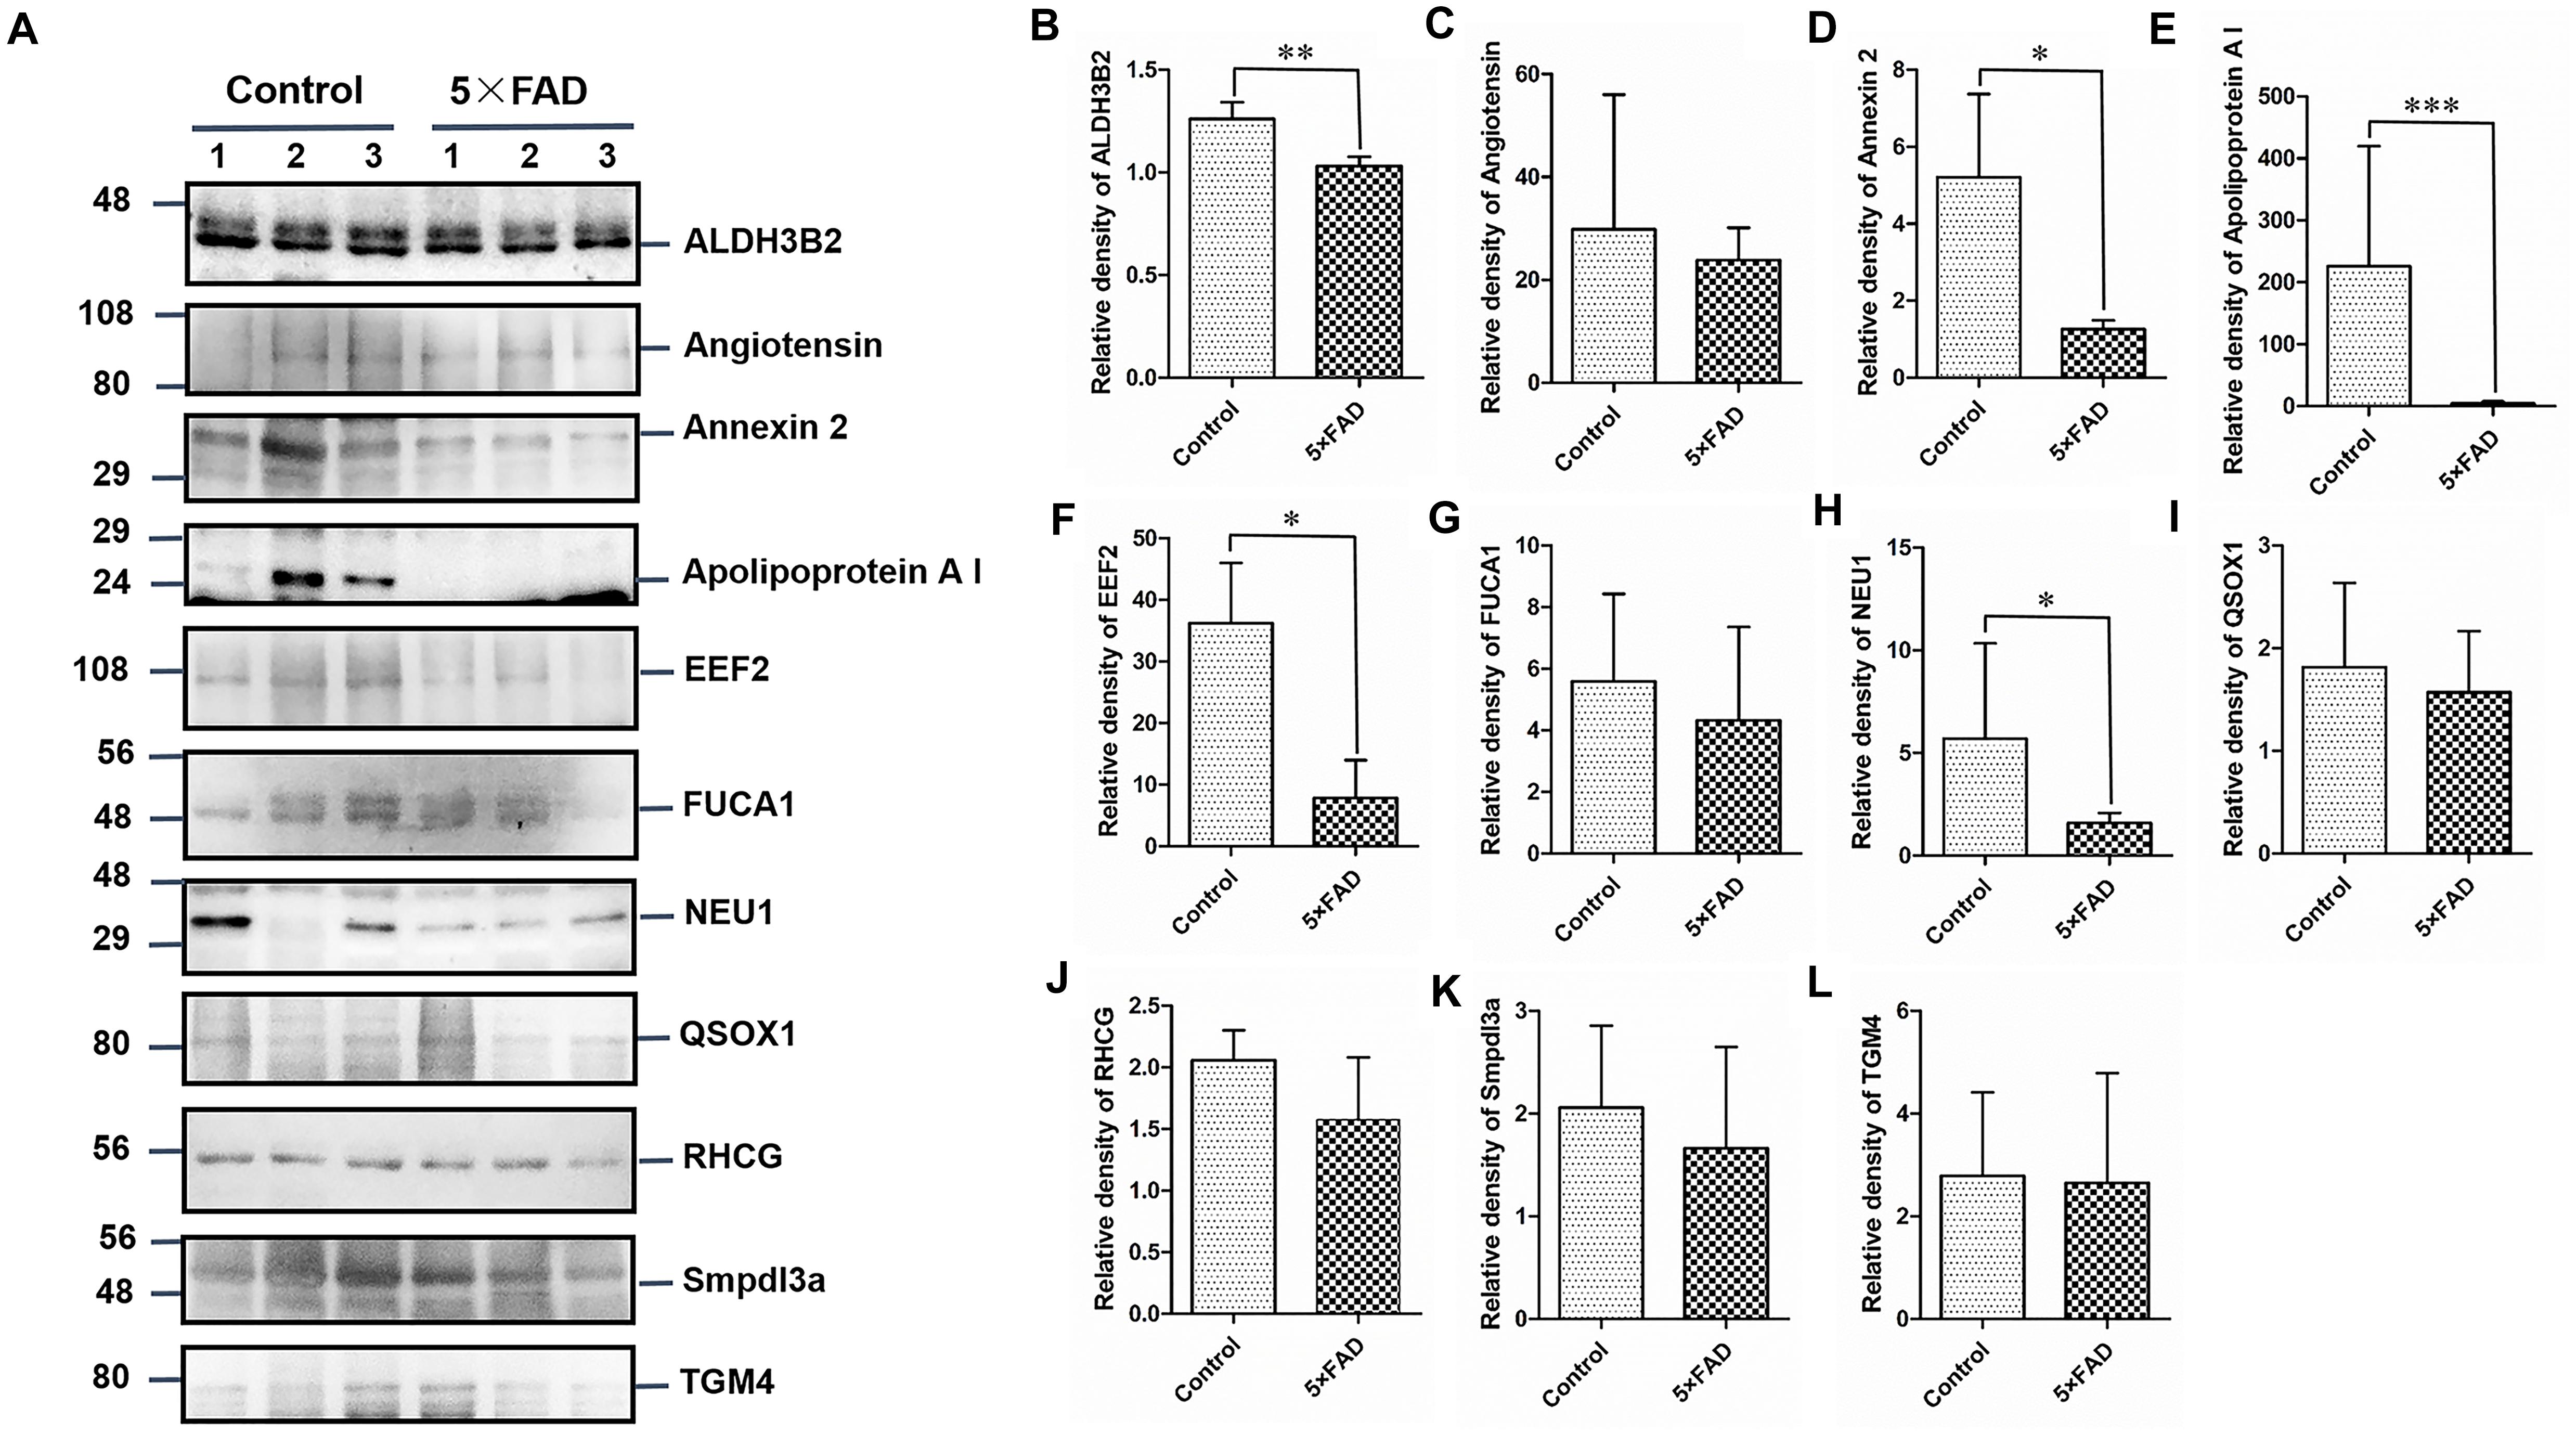
Figure 7. Western blots (WB) and quantitative analysis of the other 11 differential proteins in the urinary exosomes isolated from control and 5XFAD mice. (A) Same aliquot of urinary exosomes isolated from three control samples and three 5XFAD mice samples. ALDH3B2, Angiotensin, Annexin 2, Apolipoprotein A I, EEF2, FUCA1, NEU1, QSOX1, RHCG, Smpdl3a, and TGM4 proteins were detected by WB in sequence. Representative blots of the tested proteins and the molecular weight of standard proteins were presented. (B–L) Quantitative analysis of each of the tested protein’s relative fold change, respectively. All data are presented as mean ± SD in triplicate experiments; Student’s t-test; *P < 0.05; **P < 0.01.
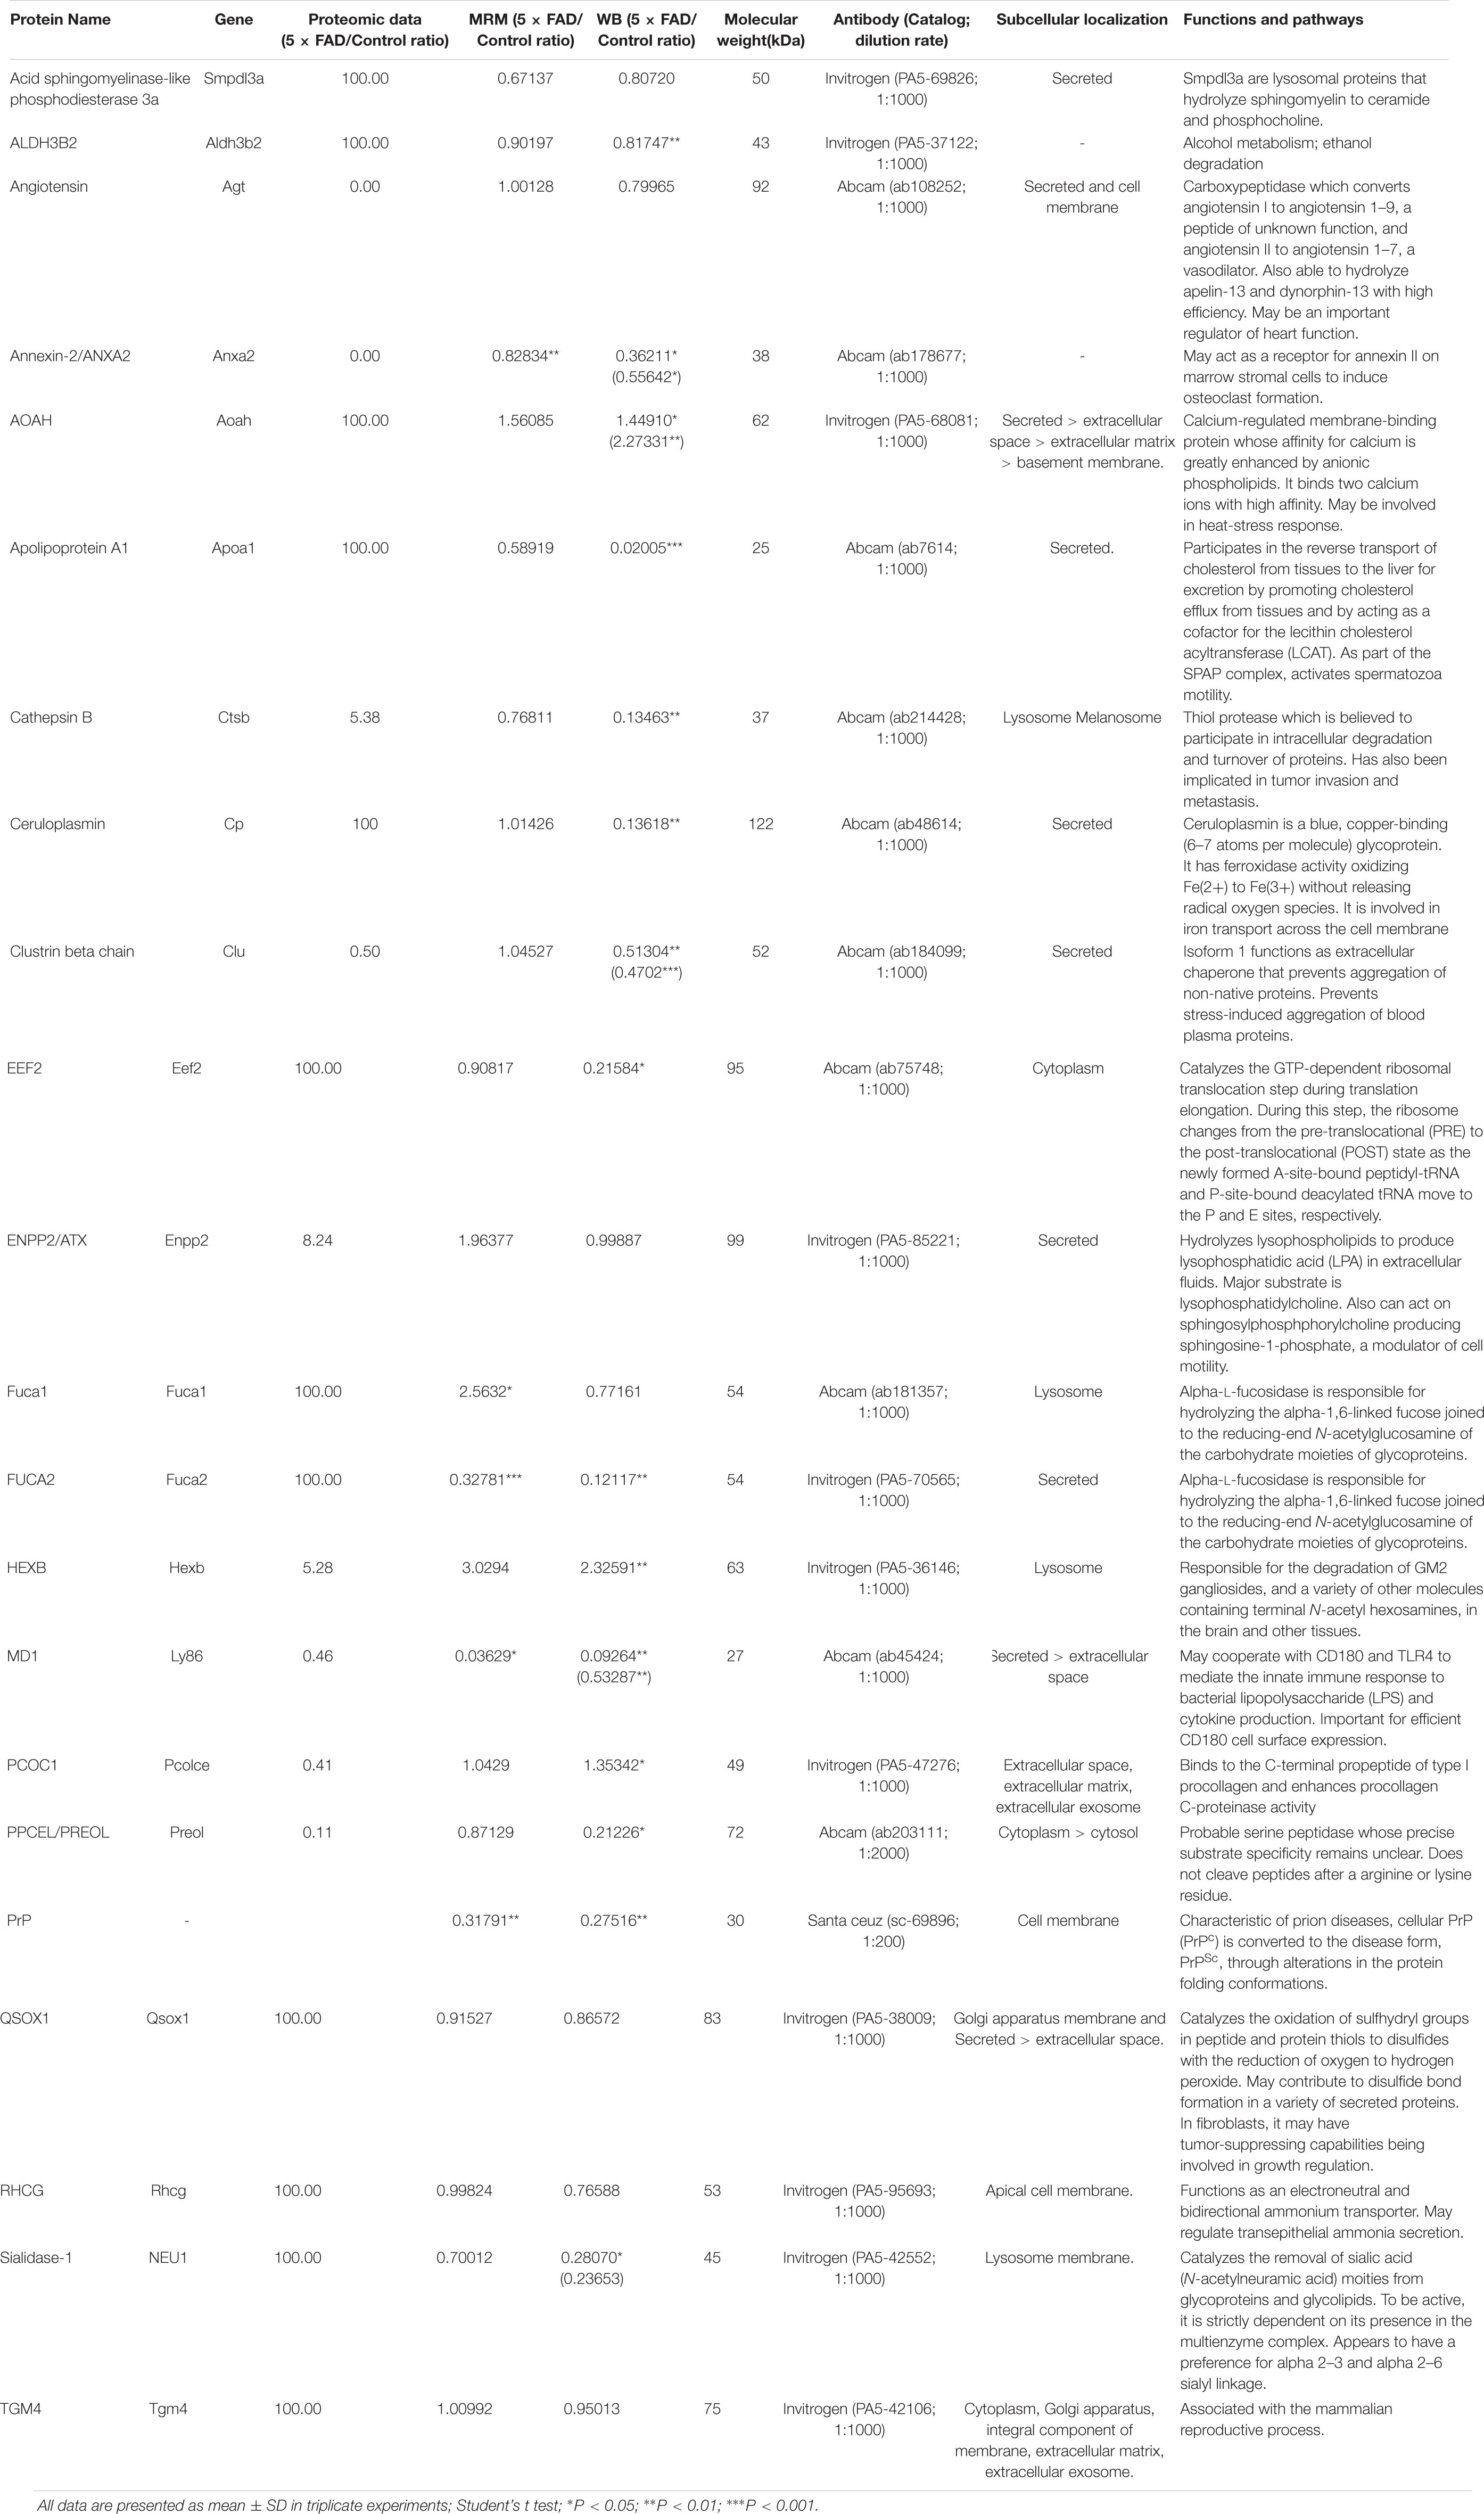
Table 10. Detail information of the proteins that were validated by WB approach for primary screening.
After comprehensive evaluation of the proteome data, bioinformatics analysis, MRM, and WB, an independent set of 12 samples (n = 10 mice per sample) from the two groups was collected for further validation of the proteins as potential biomarkers in urinary exosomes.
Again, based on the WB analysis with the same loading amount, AOAH, NEU1, Annexin 2, Clusterin, and Ly86 levels were further confirmed to be significantly different and consistent with the initial WB results. Alix and Flotillin1 were detected as urinary exosomal markers (Figure 8A). The AOAH level was 2.27-fold higher in 5XFAD mice than in control mice. In contrast, the NEU1, Annexin 2, Clusterin, and Ly86 levels, exhibited 77, 45, 50, and 90% reductions, respectively, compared with the control group (Figures 8B–F). The pathological features of 5XFAD mouse showed in Figure 9A, at 2 months, the brain from 5XFAD mouse develops amyloid deposition and reaches a very large burden, and after 4–5 months, the 5XFAD mouse develops spatial memory deficits. Herein, 1, 2, and 6 month-old mouse were selected to collect their urinary for monitoring the dynamic change of target proteins during AD progression compared with their littermate controls. Two commercially available ELISA kits were used to detect the concentration of mouse Annexin 2 and Clusterin.
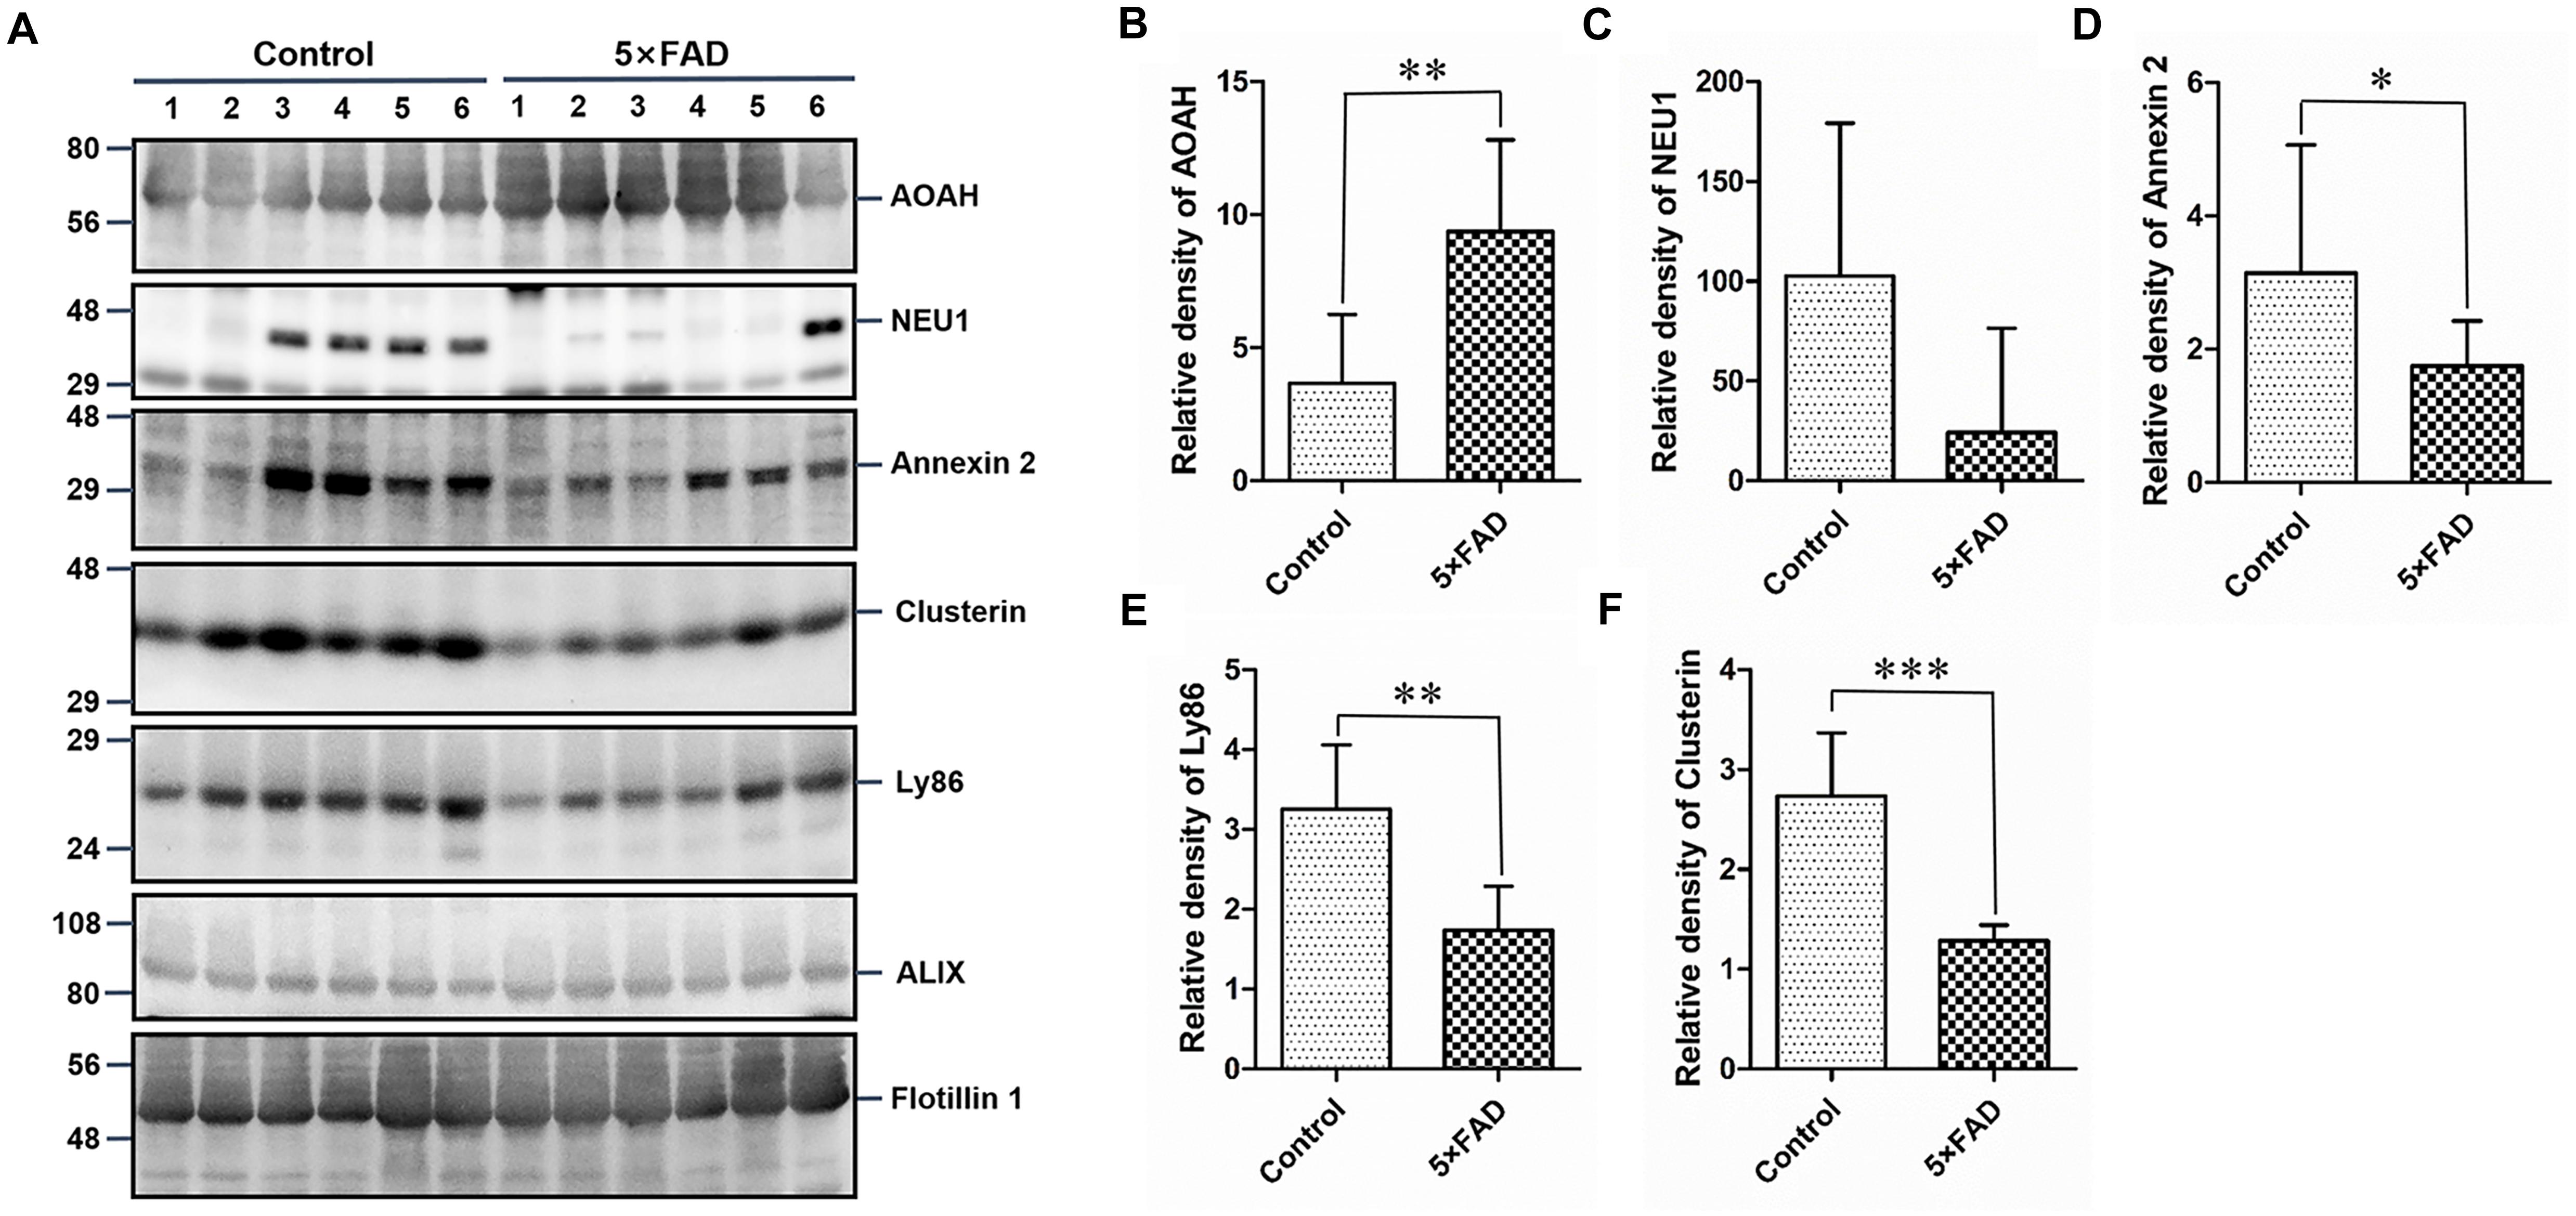
Figure 8. Western blots (WB) and quantitative analysis of an independent set of the urinary exosomes isolated from control and 5XFAD mice. (A) Same aliquot of urinary exosomes isolated from six control samples and six 5XFAD mice samples. AOAH, NEU1, Annexin 2, Clusterin, and Ly86 proteins were further detected by WB in sequence. Alix and Flotillin 1 were tested as urinary exosomes biomarkers. Representative blots of the tested proteins and the molecular weight of standard proteins were presented. (B–F) Quantitative analysis of each of the tested protein’s relative fold change, respectively. All data are presented as mean ± SD in triplicate experiments; Student’s t-test; *P < 0.05; **P < 0.01; ***P < 0.001.
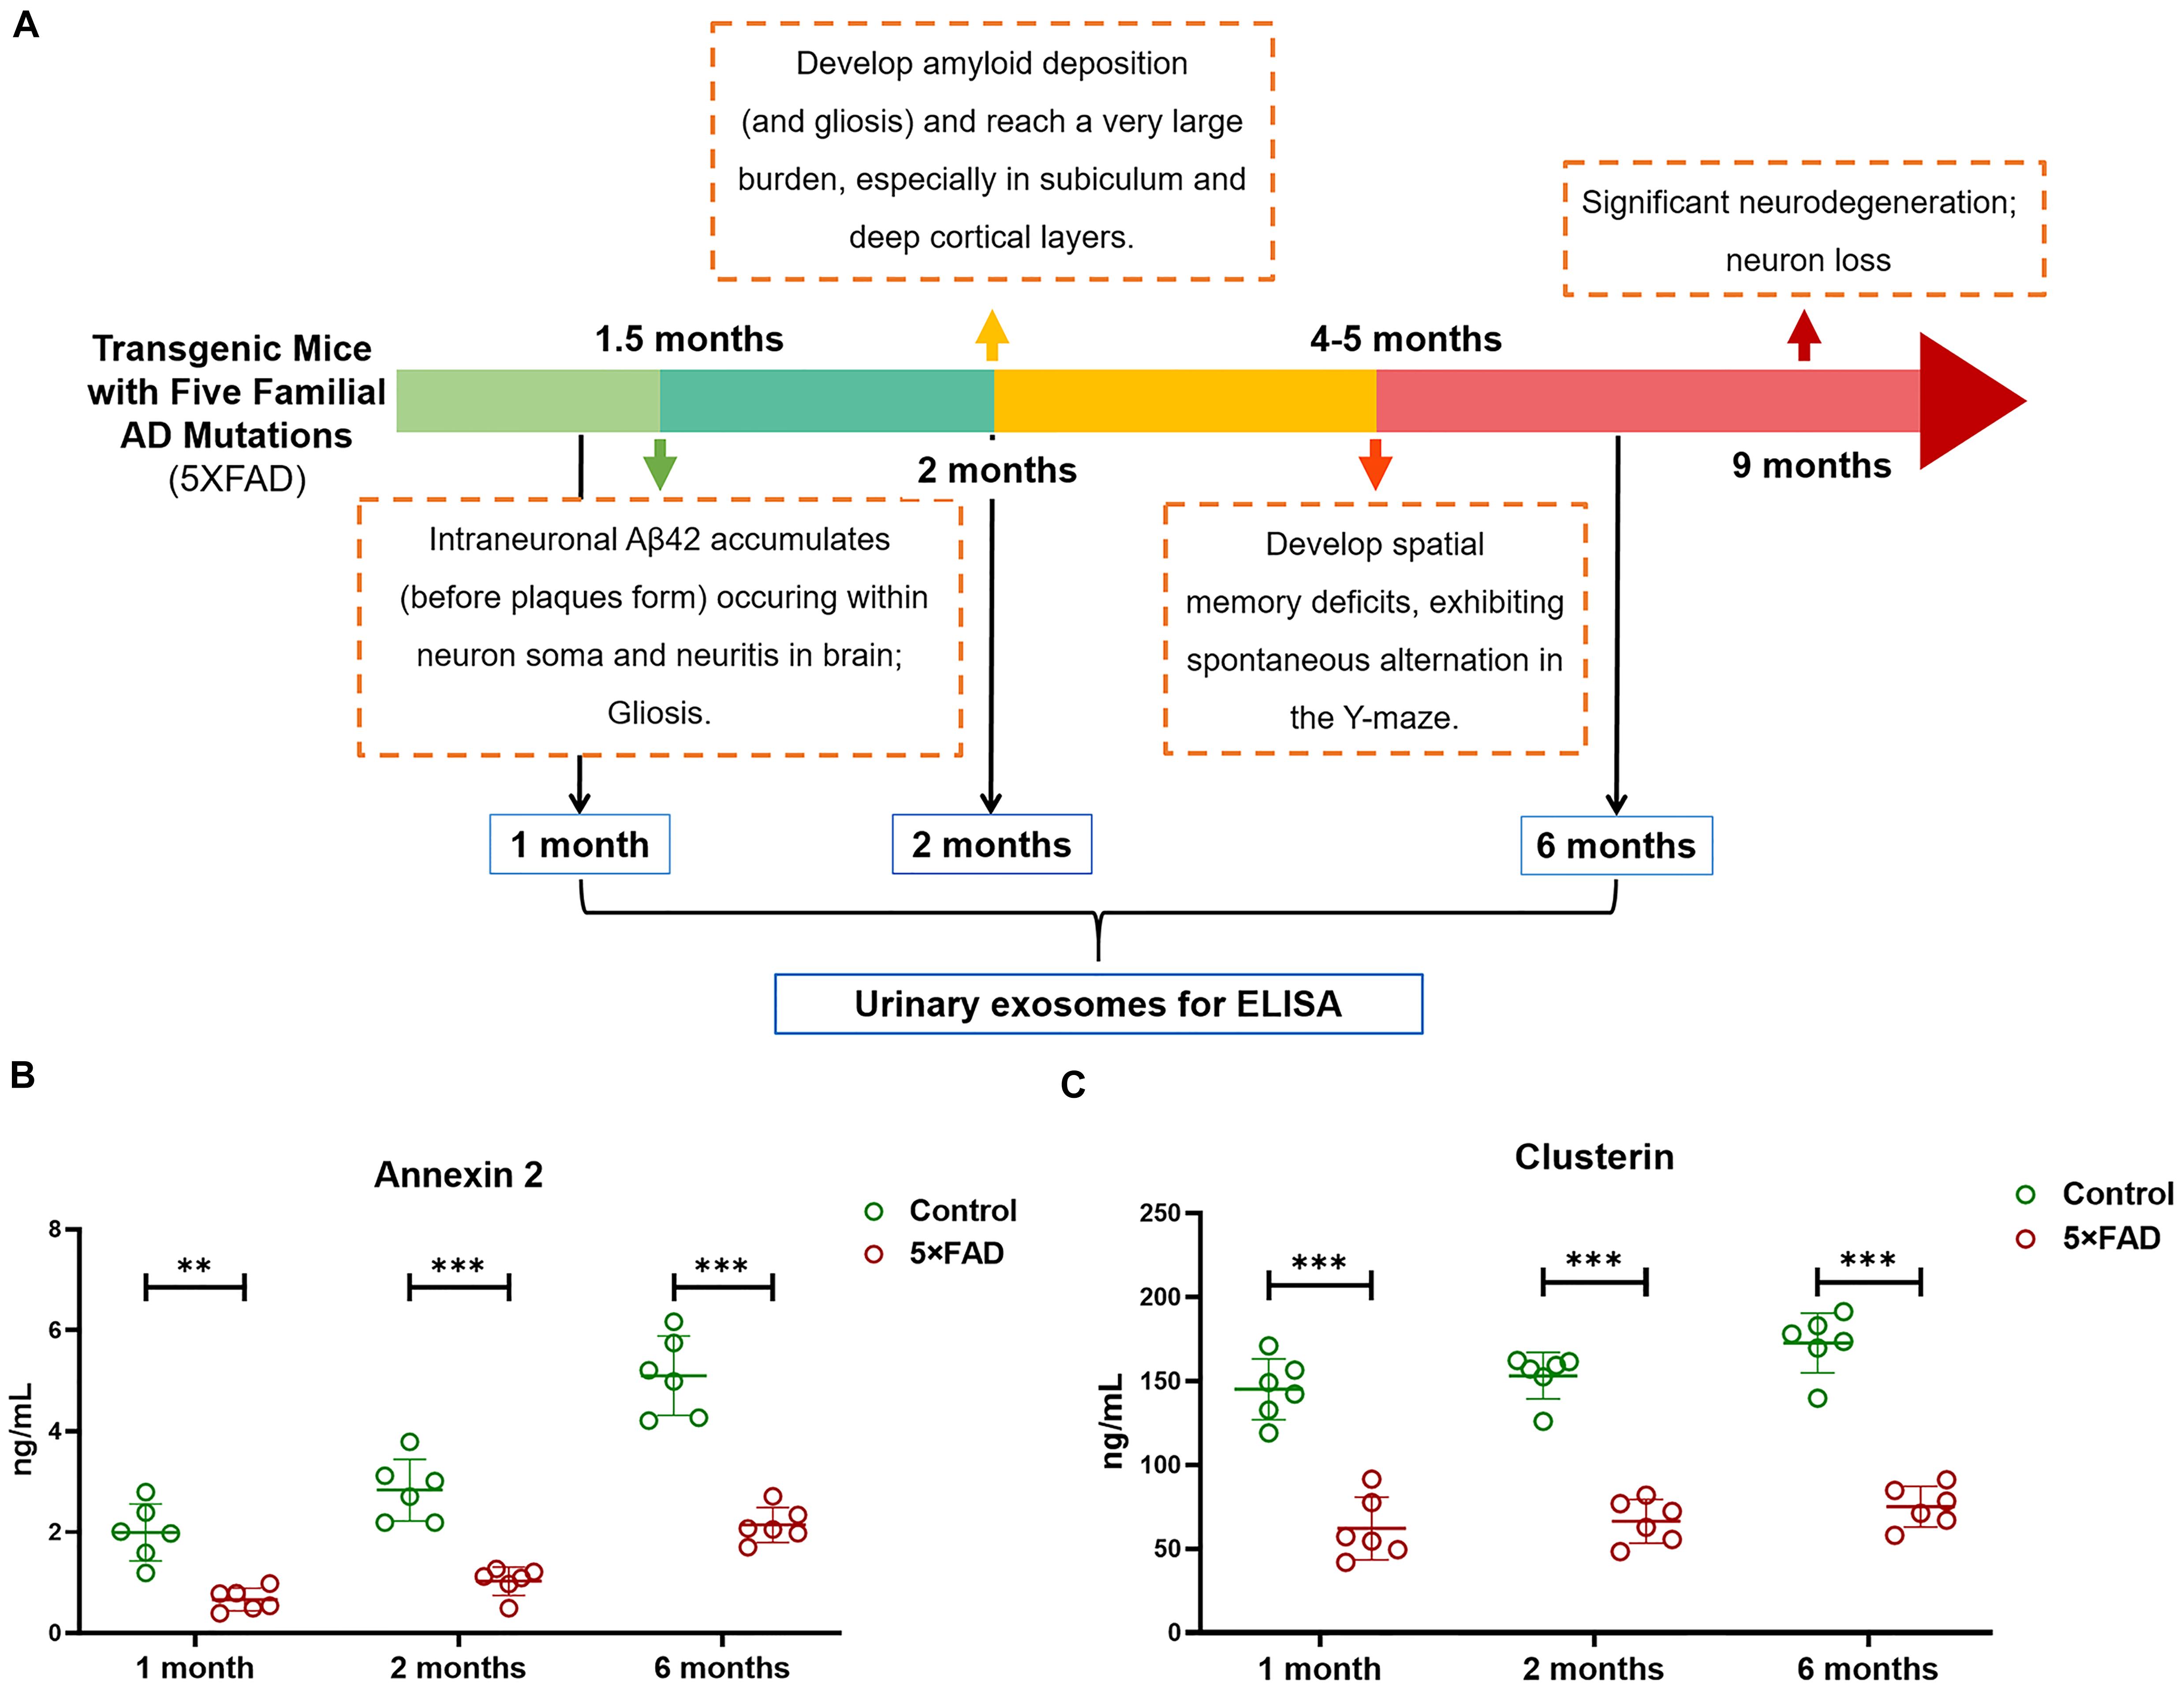
Figure 9. (A) The schematic diagram of the pathological feature of 5XFAD mice model during the AD progression. (B,C) Quantification of Annexin 2 and Clusterin in urinary exosome samples using ELISA from 1, 2, and 6-month-old 5XFAD mice and their littermate control. Each point represents value for one sample, and horizontal line in point clusters depicts mean level for that group. All data are presented as mean ± SD in triplicate experiments; Student’s t-test; **P < 0.01; ***P < 0.001.
Firstly, urinary exosomes were isolated from 30 ml of urine in each urinary sample. For 1, 2, and 6-month-old time points, the urinary exosomes proteins were compared between 5XFAD mice (N = 6 samples per time point) and control mice (N = 6 samples per time point), respectively. Consist with the analysis of WB, the result of ELISA from the urinary exosomes of 1-month-old mice demonstrated that the concentrations of Annexin 2 (P = 0.0013) and Clusterin (P = 1.5E-05) in the control group were significantly higher than that in 5XFAD mice group. Moreover, during the AD progression, a longitudinal study was analyzed. Both at 2 and 6 months, the concentrations of Annexin 2 (P = 0.00031 and P = 7.1E-05, respectively) and Clusterin (P = 5.7E-07 and P = 1.7E-06, respectively) from urinary exosomes in the control group were extremely significant higher than that in 5XFAD mice group (Figures 9B,C). During the course, the levels of Annexin 2 and Clusterin were still lower in 5XFAD mice than that in matched control further suggesting that they could be the non-invasive source of candidates for the prevention of AD.
Remarkably, Clusterin was significantly decreased in the 5XFAD mice, which contrasts the results of previous research (Bai et al., 2020). Clusterin levels were higher in AD patients than in controls, especially in regions with the greatest abundance of Aβ, facilitating the development of AD (Miners et al., 2017). Importantly, a recent report indicated that three proteins, Aβ, TREM2 and Clusterin, display an early increase in patients with severe Aβ pathology but no detectable cognitive defects (Nelson et al., 2012) and in patients with mild cognitive impairment, with continuous accumulation in AD. These proteins are enriched in 12 signaling pathways, including the cytoskeleton and extracellular matrix, membrane transport, and synaptic function (Bai et al., 2020). As a heterodimeric glycoprotein, Clusterin is more abundant in the CSF of some neurodegenerative disease patients than in healthy controls, and could thus serve as a potential biomarker to differentiate Parkinson’s disease from dementia with Lewy bodies (Vranová et al., 2016). All of the evidence demonstrates that the detectable significant difference of Clusterin in urinary exosomes may be an ideal early and non-invasive biomarker to reflect AD pathology. The contrasting levels of Clusterin in the urinary exosomes of 5XFAD mice and in the brains of AD patients may occur because of the increased expression of Clusterin around Aβ plaques, leading to decreased Clusterin in the peripheral blood, resulting in reduced levels in urinary exosomes.
Current AD detection methods mainly include the determination of Aβ, tau, or phosphorylated tau levels in the CSF with invasive diagnostic procedures (He et al., 2010) and imaging techniques such as functional magnetic resonance imaging or positron emission tomography scans (Hare et al., 2015) during the late stages of the disease. Therefore, early diagnosis of AD is urgently required even before the pre-clinical phase to enhance the effects of therapeutic intervention. One challenge is often poor diagnostic specificity or sensitivity, which can be overcome in some instances by combining biomarkers. Biochemical and proteomic characterization of highly purified urinary exosomes identified 88 differentially expressed proteins by comparing 5XFAD and control mice. Among these, 22 proteins were validated by WB, and 15 proteins showed significant changes. Then, five proteins were further examined in an independent set of 12 groups of samples. Many of these proteins have been previously associated with AD but never reported in the urinary exosomal proteins of an AD mouse model. Furthermore, a portion of the proteins further selected for WB detection showed no significant changes, which may have occurred because WB analysis could not detect the limited amounts and concentrations of these proteins in urine exosome samples. In future researches, clinical urinary exosomes samples of AD patients will provide more significant data to validate the differential proteins identified in present study.
AOAH and Ly86 are also brain cell markers, as confirmed by single-cell profiling (Rosenberg et al., 2018). Clusterin has been previously reported to be related to the development of AD as well as a biomarker of AD (Pandey et al., 2019). They displayed the same trend, with significant differences in the proteome and first WB analyses. Alteration of the family of Annexin proteins, including Annexin 2, was observed in pathological neuronal and glial reactions from autopsy cases representing by hypoxic-ischemic injury, seizure disorders, and AD in the human hippocampus (Eberhard et al., 1994). In AD, astrocytic Annexin 2 positive protein was localized to discrete plaque-like areas (Eberhard et al., 1994). Annexin 2 is also related to tissue plasminogen activator mediated microglial activation during injury of the brain (Siao and Tsirka, 2002). N-acetyl-alpha-neuraminidase 1 (NEU1), a lysosomal sialidase, also called sialidase 1, is encoded by the NEU1 gene. Growing evidence suggests that mammalian sialidases play an important role in the development and function of the CNS owing to the nervous tissue is the organ with the highest expression level of sialic acids (Liao et al., 2020). Additionally, chronic stress affects hippocampus-depended spatial learning of rat in the Barnes maze via sialidase activity (Wielgat et al., 2011). Slight changes might be detected by urinary via blood circulation system and metabolism in pathological environments.
Among the differentially expressed proteins, Ectonucleotide pyrophosphatase/phosphodiesterase family member 2 (ENPP2) levels were higher in the CSF of AD patients than the CSF of healthy controls. ENPP2 can be used to specifically discriminate AD from Lewy body dementia, making it a candidate AD biomarker (Heywood et al., 2015). In our study, proteomic and MRM analyses confirmed 8.24- and 1.96-fold increases in ENPP2 in 5XFAD mice, respectively, compared with the control group, but WB analysis showed no significant difference; thus, further confirmation by other methods is required.
Ceruloplasmin (CERU) levels were higher in the control group than in the 5XFAD mice, and the opposite trend of increasing levels was found in the serum of AD patients (Park et al., 2014), but the results were consistent with the CERU levels in the CSF of AD patients (Park et al., 2014). The differences in test results of different body fluids may have occurred because these fluids undergo different metabolic pathways and stages; however, all data showed significant differences. The ratio of CERU concentrations measured by enzymatic methods to those measured by immunological methods (iCP), eCP/iCP, reflects the high specificity of this protein in AD patients as well as a decreased risk of having AD (Siotto et al., 2016). Moreover, CERU had less ferroxidase activity in AD patients than in healthy patients, which also contributes to the development of AD (Bush, 2013).
Cathepsin B levels were also higher in the control group than in the 5XFAD mice according to WB analysis, which is opposite to the proteomic data results. Cathepsin B has been previously reported to be upregulated in brain tissues from APP/PS1 transgenic mice, and changes in Cathepsin B showed a similar direction in healthy mice and the serum of AD patients relative to control patients, making Cathepsin B a potential biomarker of AD (Sun et al., 2015). In addition, Cathepsin B produces brain pyroglutamate A, which represents a potential therapeutic agent for AD (Hook et al., 2014).
Prion protein (PrP) is a cell surface protein widely expressed in a variety of tissues in the central and peripheral nervous system. PrP is best known for its crucial role as a molecular substrate in the pathogenesis of prion diseases such as Creutzfeldt-Jakob disease and familial fatal insomnia in humans. Previous research has reported that PrP is detectable in normal rat urinary exosomes (Conde Vancells et al., 2010). Interestingly, PrP was significantly decreased in 5XFAD mice compared with the control group, although this protein was undetectable in the proteomic data. Several studies have demonstrated that certain misfolded amyloid proteins composed of Aβ, tau, or α-synuclein can be transferred among neurons, suggesting the contribution of mechanisms similar to those by which infectious prions spread through the brain (Conde Vancells et al., 2010). PrP may be a putative receptor and bind to Aβ oligomers, and PrP-dependent Aβ toxicity partially participates in the progression of AD (José et al., 2018; Purro et al., 2018). This finding could open new avenues to investigate the clearance mechanism of Aβ during AD.
These findings support that some urinary exosomal proteins in 5XFAD mouse models enable detection of differences, providing potential early biomarkers before Aβ accumulation for improved diagnosis and prognosis prediction of AD.
The datasets presented in this study can be found in online repositories. The names of the repository/repositories and accession number(s) can be found below: https://www.ebi.ac.uk/pride/archive, accession no: PXD021935.
The animal study was reviewed and approved by The Institutional Animal Care and Use Committee of the Institute of Laboratory Animal Science, Peking Union Medical College (Approved ID: QC19005).
CQ and ZS designed the project and wrote the manuscript. ZS, YX, LZa, LZo, YZ, XL, YH, PY, YQ, and WZ performed majority of the experiments. All authors analyzed the data.
This work was supported by the National Natural Science Foundation of China (Grant No. 81901114); the Fundamental Research Funds for the Central Universities (Grant No. 3332019091); CAMS Innovation Fund for Medical Sciences (Grant Nos. 2019-I2M-1-003 and 2016-12M-2-006); Young Elite Scientists Sponsorship Program by CAST (YESS) (Grant No. 2019QNRC001).
The authors declare that the research was conducted in the absence of any commercial or financial relationships that could be construed as a potential conflict of interest.
ZS wish to extend her deepest appreciation and thanks to her husband, Mr. Xing Le, who always support her career and research.
The Supplementary Material for this article can be found online at: https://www.frontiersin.org/articles/10.3389/fgene.2020.565479/full#supplementary-material
Supplementary Figure 1 | The schematic diagram of how to select the target proteins for further identification.
Aβ, amyloid-β; AD, Alzheimer’s disease; BP, biological processes; CCs, cellular components; CERU, ceruloplasmin; CSF, cerebrospinal fluid; ELISA, enzyme-linked immunosorbent assay; ENPP2, ectonucleotide pyrophosphatase/phosphodiesterase family member 2; ER, endoplasmic reticulum; GO, gene ontology; KEGG, Kyoto Encyclopedia of Genes and Genomes; MFs, molecular functions; MRM, multiple reaction monitoring; NTA, nanoparticle tracking analysis; PrP, prion protein; WB, western blotting.
Adachi, J., Kumar, C., Zhang, Y., Olsen, J. V., and Mann, M. (2006). The human urinary proteome contains more than 1500 proteins, including a large proportion of membrane proteins. Genome Biol. 7:R80.
Bai, B., Wang, X., Li, Y., Chen, P., Yu, K., Dey, K. K., et al. (2020). Deep multilayer brain proteomics identifies molecular networks in Alzheimer’s disease progression. Neuron 106:700. doi: 10.1016/j.neuron.2020.04.031
Bien, J., Jefferson, T., Čaušević, M., Jumpertz, T., Munter, L., Multhaup, G., et al. (2012). The metalloprotease meprin β generates amino terminal-truncated amyloid β peptide species. J. Biol. Chem. 287, 33304–33313. doi: 10.1074/jbc.m112.395608
Butler, D., Hwang, J., Estick, C., Nishiyama, A., Kumar, S. S., Baveghems, C., et al. (2011). Protective effects of positive lysosomal modulation in Alzheimer’s disease transgenic mouse models. PLoS One 6:501. doi: 10.1371/journal.pone.0020501
Conde Vancells, J., Rodriguez Suarez, E., Gonzalez, E., Berisa, A., Gil, D., Embade, N., et al. (2010). Candidate biomarkers in exosome-like vesicles purified from rat and mouse urine samples. Proteom. Clin. Appl. 4, 416–425. doi: 10.1002/prca.200900103
Dinkins, M. B., Dasgupta, S., Wang, G., Zhu, G., and Bieberich, E. (2014). Exosome reduction in vivo is associated with lower amyloid plaque load in the 5XFAD mouse model of Alzheimer’s disease. Neurobiol. Aging 35, 1792–1800. doi: 10.1016/j.neurobiolaging.2014.02.012
Dos, S. P. L., Ozela, P. F., de Fatima, D. B. B. M., Pinheiro, A. A., Padilha, E. C., Braga, F. S., et al. (2018). Alzheimer’s disease: a review from the pathophysiology to diagnosis, new perspectives for pharmacological treatment. Curr. Med. Chem. 25, 3141–3159. doi: 10.2174/0929867323666161213101126
Dubois, B., Padovani, A., Scheltens, P., Rossi, A., and Dell Agnello, G. (2015). Timely diagnosis for Alzheimer’s disease: a literature review on benefits and challenges. J. Alzheimer Dis. 49, 617–631. doi: 10.3233/JAD-150692
Eberhard, D. A., Brown, M. D., and VandenBerg, S. R. (1994). Alterations of annexin expression in pathological neuronal and glial reactions. Immunohistochemical localization of annexins I, II (p36 and p11 subunits), IV, and VI in the human hippocampus. Am. J. Pathol. 145:640.
Filippov, V., Song, M. A., Zhang, K., Vinters, H. V., Tung, S., Kirsch, W. M., et al. (2012). Increased ceramide in brains with Alzheimer’s and other neurodegenerative diseases. J. Alzheimer Dis. 29, 537–547. doi: 10.3233/jad-2011-111202
Haldar, S., Beveridge, A. J., Wong, J., Singh, A., Galimberti, D., Borroni, B., et al. (2013). A low-molecular-weight ferroxidase is increased in the CSF of sCJD cases: CSF ferroxidase and transferrin as diagnostic biomarkers for sCJD. Antioxid. Redox Signal. 19, 1662–1675. doi: 10.1089/ars.2012.5032
Hare, D. J., Doecke, J. D., Faux, N. G., Rembach, A., Volitakis, I., Fowler, C. J., et al. (2015). Decreased plasma iron in Alzheimer’s disease is due to transferrin desaturation. ACS Chem. Neurosci. 6, 398–402. doi: 10.1021/cn5003557
He, X., Huang, Y., Li, B., Gong, C., and Schuchman, E. H. (2010). Deregulation of sphingolipid metabolism in Alzheimer’s disease. Neurobiol. Aging 31, 398–408. doi: 10.1016/j.neurobiolaging.2008.05.010
Heywood, W. E., Galimberti, D., Bliss, E., Sirka, E., Paterson, R. W., Magdalinou, N. K., et al. (2015). Identification of novel CSF biomarkers for neurodegeneration and their validation by a high-throughput multiplexed targeted proteomic assay. Mol. Neurodegen. 10:64.
Hook, G., Yu, J., Toneff, T., Kindy, M., and Hook, V. (2014). Brain pyroglutamate amyloid-β is produced by cathepsin B and is reduced by the cysteine protease inhibitor E64d, representing a potential Alzheimer’s disease therapeutic. J. Alzheimer Dis. 41, 129–149. doi: 10.3233/jad-131370
Huang, Y., Tanimukai, H., Liu, F., Iqbal, K., Grundke Iqbal, I., and Gong, C. X. (2004). Elevation of the level and activity of acid ceramidase in Alzheimer’s disease brain. Eur. J. Neurosci. 20, 3489–3497. doi: 10.1111/j.1460-9568.2004.03852.x
Johnstone, R. M., Adam, M., Hammond, J. R., Orr, L., and Turbide, C. (1987). Vesicle formation during reticulocyte maturation. Association of plasma membrane activities with released vesicles (exosomes). J. Biol. Chem. 262, 9412–9420.
José, A., Ferrer, I., and Gavín, R. (2018). Role of cellular prion protein in interneuronal amyloid transmission. Prog. Neurobiol. 165, 87–102. doi: 10.1016/j.pneurobio.2018.03.001
Kalluri, R., and LeBleu, V. S. (2020). The biology, function, and biomedical applications of exosomes. Science 367:eaau6977. doi: 10.1126/science.aau6977
Kessler, H., Pajonk, F., Meisser, P., Schneider-Axmann, T., Hoffmann, K., Supprian, T., et al. (2006). Cerebrospinal fluid diagnostic markers correlate with lower plasma copper and ceruloplasmin in patients with Alzheimer’s disease. J. Neural. Transm. 113, 1763–1769. doi: 10.1007/s00702-006-0485-7
Li, Y., Zhang, Y., Qiu, F., and Qiu, Z. (2011). Proteomic identification of exosomal LRG1: a potential urinary biomarker for detecting NSCLC. Electrophoresis 32, 1976–1983. doi: 10.1002/elps.201000598
Liang, H., Russell, C., Mitra, V., Chung, R., Hye, A., Bazenet, C., et al. (2015). Glycosylation of human plasma clusterin yields a novel candidate biomarker of Alzheimer’s disease. J. Proteome Res. 14, 5063–5076. doi: 10.1021/acs.jproteome.5b00892
Liao, H., Klaus, C., and Neumann, H. (2020). Control of innate immunity by sialic acids in the nervous tissue. Intern. J. Mol. Sci. 21:5494. doi: 10.3390/ijms21155494
Lieberman, J., Schleissner, L., Tachiki, K. H., and Kling, A. S. (1995). Serum α1-antichymotrypsin level as a marker for Alzheimer-type dementia. Neurobiol. Aging 16, 747–753. doi: 10.1016/0197-4580(95)00056-k
Marshall, M. S., and Bongarzone, E. R. (2016). Beyond Krabbe’s disease: the potential contribution of galactosylceramidase deficiency to neuronal vulnerability in late-onset synucleinopathies. J. Neurosci. Res. 94, 1328–1332. doi: 10.1002/jnr.23751
Miners, J. S., Clarke, P., and Love, S. (2017). Clusterin levels are increased in A lzheimer’s disease and influence the regional distribution of Aβ. Brain Pathol. 27, 305–313. doi: 10.1111/bpa.12392
Mitchell, P. J., Welton, J., Staffurth, J., Mason, M. D., Tabi, Z., and Clayton, A. (2009). Can urinary exosomes act as treatment response markers in prostate cancer? J. Transl. Med. 7:4. doi: 10.1186/1479-5876-7-4
Nelson, P. T., Alafuzoff, I., Bigio, E. H., Bouras, C., Braak, H., Cairns, N. J., et al. (2012). Correlation of Alzheimer disease neuropathologic changes with cognitive status: a review of the literature. J. Neuropathol. Exper. Neurol. 71, 362–381.
Oakley, H., Cole, S. L., Logan, S., Maus, E., Shao, P., Craft, J., et al. (2006). Intraneuronal beta-Amyloid aggregates, neurodegeneration, and neuron loss in transgenic mice with five familial Alzheimer’s disease mutations: potential factors in Amyloid plaque formation. J. Neurosci. 26, 10129–10140. doi: 10.1523/JNEUROSCI.1202-06.2006
Pandey, R. S., Graham, L., Uyar, A., Preuss, C., Howell, G. R., and Carter, G. W. (2019). Genetic perturbations of disease risk genes in mice capture transcriptomic signatures of late-onset Alzheimer’s disease. Mol. Neurodegen. 14:50. doi: 10.1186/s13024-019-0351-3
Park, J. H., Lee, D. W., and Park, K. S. (2014). Elevated serum copper and ceruloplasmin levels in A lzheimer’s disease. Asia Pac. Psychiatr. 6, 38–45. doi: 10.1111/appy.12077
Pisitkun, T., Shen, R., and Knepper, M. A. (2004). Identification and proteomic profiling of exosomes in human urine. Proc. Natl. Acad. Sci. U.S.A. 101, 13368–13373. doi: 10.1073/pnas.0403453101
Purro, S. A., Nicoll, A. J., and Collinge, J. (2018). Prion protein as a toxic acceptor of amyloid-β oligomers. Biol. Psychiatry 83, 358–368. doi: 10.1016/j.biopsych.2017.11.020
Rosenberg, A. B., Roco, C. M., Muscat, R. A., Kuchina, A., Sample, P., Yao, Z., et al. (2018). Single-cell profiling of the developing mouse brain and spinal cord with split-pool barcoding. Science 360, 176–182. doi: 10.1126/science.aam8999
Rygiel, K. (2016). Can angiotensin-converting enzyme inhibitors impact cognitive decline in early stages of Alzheimer’s disease? An overview of research evidence in the elderly patient population. J. Postgrad. Med. 62:242. doi: 10.4103/0022-3859.188553
Siao, C.-J., and Tsirka, S. E. (2002). Tissue plasminogen activator mediates microglial activation via its finger domain through annexin II. J. Neurosci. 22, 3352–3358. doi: 10.1523/jneurosci.22-09-03352.2002
Silva, P. N., Furuya, T. K., Braga, I. L., Rasmussen, L. T., Labio, R. W., Bertolucci, P. H., et al. (2014). Analysis of HSPA8 and HSPA9 mRNA expression and promoter methylation in the brain and blood of Alzheimer’s disease patients. J. Alzheimer Dis. 38, 165–170. doi: 10.3233/jad-130428
Siotto, M., Simonelli, I., Pasqualetti, P., Mariani, S., Caprara, D., Bucossi, S., et al. (2016). Association between serum ceruloplasmin specific activity and risk of Alzheimer’s disease. J. Alzheimer Dis. 50, 1181–1189. doi: 10.3233/jad-150611
Smalley, D. M., Sheman, N. E., Nelson, K., and Theodorescu, D. (2008). Isolation and identification of potential urinary microparticle biomarkers of bladder cancer. J. Proteome Res. 7, 2088–2096. doi: 10.1021/pr700775x
Song, Z., Yang, W., Cheng, G., Zhou, X., Yang, L., and Zhao, D. (2018). Prion protein is essential for the RE1 silencing transcription factor (REST)-dependent developmental switch in synaptic NMDA receptors. Cell Death Dis. 9:541. doi: 10.1038/s41419-018-0576-z
Song, Z., Yang, W., Zhou, X., Yang, L., and Zhao, D. (2017). Lithium alleviates neurotoxic prion peptide-induced synaptic damage and neuronal death partially by the upregulation of nuclear target REST and the restoration of Wnt signaling. Neuropharmacology 123, 332–348. doi: 10.1016/j.neuropharm.2017.05.021
Sramek, J. J., Cutler, N. R., Hurley, D. J., and Seifert, R. D. (1995). The utility of salivary amylase as an evaluation of M3 muscarinic agonist activity in Alzheimer’s disease. Prog. Neuropsychopharmacol. Biol. Psychiatr. 19, 85–91. doi: 10.1016/0278-5846(94)00107-s
Sun, Y., Rong, X., Lu, W., Peng, Y., Li, J., Xu, S., et al. (2015). Translational study of Alzheimer’s disease (AD) biomarkers from brain tissues in AβPP/PS1 mice and serum of AD patients. J. Alzheimer Dis. 45, 269–282. doi: 10.3233/jad-142805
Tyanova, S., Temu, T., and Cox, J. (2016). The MaxQuant computational platform for mass spectrometry-based shotgun proteomics. Nat. Protoc. 11:2301. doi: 10.1038/nprot.2016.136
Vidova, V., and Spacil, Z. (2017). A review on mass spectrometry-based quantitative proteomics: targeted and data independent acquisition. Analyt. Chim. Acta 964, 7–23. doi: 10.1016/j.aca.2017.01.059
Vishnu, V. Y., Modi, M., Sharma, S., Mohanty, M., Goyal, M. K., Lal, V., et al. (2016). Role of plasma clusterin in Alzheimer’s disease—a pilot study in a tertiary hospital in Northern India. PLoS One 11:e0166369. doi: 10.1371/journal.pone.0166369
Vranová, H. P., Hényková, E., Mareš, J., Kaiserová, M., Menšíková, K., Vaštík, M., et al. (2016). Clusterin CSF levels in differential diagnosis of neurodegenerative disorders. J. Neurol. Sci. 361, 117–121. doi: 10.1016/j.jns.2015.12.023
Wang, M., Ye, R., Barron, E., Baumeister, P., Mao, C., and Luo, S. (2010). Essential role of the unfolded protein response regulator GRP78/BiP in protection from neuronal apoptosis. Cell Death Differ. 17, 488–498. doi: 10.1038/cdd.2009.144
Wang, Z., Hill, S., Luther, J. M., Hachey, D. L., and Schey, K. L. (2012). Proteomic analysis of urine exosomes by multidimensional protein identification technology (MudPIT). Proteomics 12, 329–338. doi: 10.1002/pmic.201100477
Wielgat, P., Walesiuk, A., and Braszko, J. J. (2011). Effects of chronic stress and corticosterone on sialidase activity in the rat hippocampus. Behav. Brain Res. 222, 363–367. doi: 10.1016/j.bbr.2011.03.070
Yang, Y., Turner, R. S., and Gaut, J. R. (1998). The chaperone BiP/GRP78 binds to amyloid precursor protein and decreases Aβ40 and Aβ42 secretion. J. Biol. Chem. 273, 25552–25555. doi: 10.1074/jbc.273.40.25552
Zhang, F., Wei, J., Li, X., Ma, C., and Gao, Y. (2018). Early candidate urine biomarkers for detecting Alzheimer’s disease before Amyloid-β plaque deposition in an APP (swe)/PSEN1dE9 transgenic mouse model. J. Alzheimer Dis. 66, 613–637. doi: 10.3233/JAD-180412
Zhou, H., Pisitkun, T., Aponte, A., Yuen, P. S., Hoffert, J. D., Yasuda, H., et al. (2006a). Exosomal Fetuin-A identified by proteomics: a novel urinary biomarker for detecting acute kidney injury. Kidney Int. 70, 1847–1857. doi: 10.1038/sj.ki.5001874
Keywords: urinary exosome proteome, 5XFAD mouse model, Alzheimer’s disease, biomarkers, early diagnosis
Citation: Song Z, Xu Y, Zhang L, Zhou L, Zhang Y, Han Y, Li X, Yu P, Qu Y, Zhao W and Qin C (2020) Comprehensive Proteomic Profiling of Urinary Exosomes and Identification of Potential Non-invasive Early Biomarkers of Alzheimer’s Disease in 5XFAD Mouse Model. Front. Genet. 11:565479. doi: 10.3389/fgene.2020.565479
Received: 26 May 2020; Accepted: 13 October 2020;
Published: 05 November 2020.
Edited by:
Blanka Rogina, University of Connecticut Health Center, United StatesReviewed by:
Srinivas Ayyadevara, Central Arkansas Veterans Healthcare System, Eugene J. Towbin Healthcare Center, United StatesCopyright © 2020 Song, Xu, Zhang, Zhou, Zhang, Han, Li, Yu, Qu, Zhao and Qin. This is an open-access article distributed under the terms of the Creative Commons Attribution License (CC BY). The use, distribution or reproduction in other forums is permitted, provided the original author(s) and the copyright owner(s) are credited and that the original publication in this journal is cited, in accordance with accepted academic practice. No use, distribution or reproduction is permitted which does not comply with these terms.
*Correspondence: Chuan Qin, cWluY2h1YW5AcHVtYy5lZHUuY24=
Disclaimer: All claims expressed in this article are solely those of the authors and do not necessarily represent those of their affiliated organizations, or those of the publisher, the editors and the reviewers. Any product that may be evaluated in this article or claim that may be made by its manufacturer is not guaranteed or endorsed by the publisher.
Research integrity at Frontiers
Learn more about the work of our research integrity team to safeguard the quality of each article we publish.