
94% of researchers rate our articles as excellent or good
Learn more about the work of our research integrity team to safeguard the quality of each article we publish.
Find out more
ORIGINAL RESEARCH article
Front. Genet. , 15 September 2020
Sec. Evolutionary and Population Genetics
Volume 11 - 2020 | https://doi.org/10.3389/fgene.2020.564607
This article is part of the Research Topic Domestication of Agronomic Traits in Legume Crops View all 22 articles
 Qi Zhang1
 Wen-jing Zhang1
 Zhen-gong Yin2
 Wei-jia Li1
 Hao-hao Zhao1
 Shuo Zhang1
 Lin Zhuang1
 Yu-xin Wang1
 Wen-Hui Zhang1
 Ji-Dao Du1,3*
CCCH (C3H) zinc-finger proteins are involved in plant biotic and abiotic stress responses, growth and development, and disease resistance. However, studies on C3H genes in Phaseolus vulgaris L. (common bean) are limited. Here, 29 protein-encoding C3H genes, located on 11 different chromosomes, were identified in P. vulgaris. A phylogenetic analysis categorized the PvC3Hs into seven subfamilies on the basis of distinct features, such as exon–intron structure, cis-regulatory elements, and MEME motifs. A collinearity analysis revealed connections among the PvC3Hs in the same and different species. The PvC3H genes showed tissue-specific expression patterns during the sprout stage, as assessed by real-time quantitative PCR (RT-qPCR). Using RNA-sequencing and RT-qPCR data, PvC3Hs were identified as being enriched through Gene Ontology and Kyoto Encyclopedia of Genes and Genomes analyses in binding, channel activity, and the spliceosome pathway. These results provide useful information and a rich resource that can be exploited to functionally characterize and understand PvC3Hs. These PvC3Hs, especially those enriched in binding, channel activity, and the spliceosome pathway will further facilitate the molecular breeding of common bean and provide insights into the correlations between PvC3Hs and salt-stress responses during the sprout stage.
The zinc transcription factor family is among the largest in eukaryotes (Li et al., 2001). Zinc finger proteins have various functions, such as DNA and RNA binding and transcriptional activation, as well as being involved in protein–protein interactions (Gao et al., 2002). The zinc-finger motif is composed of one or more cysteine residues and one histidine residue. This superfamily is divided into nine categories on the basis of the numbers and distances between conserved cysteine and histidine residues (Wolfe et al., 2000). However, there are limited studies on CCCH (C3H) zinc-finger proteins. C3H type zinc-finger proteins typically possess one or multiple zinc-finger motifs, characterized by three cysteine residues followed by a histidine residue, and they account for approximately 0.8% of all zinc-finger proteins (Hall, 2005).
In plants, at present, the functions of only some C3H zinc-finger proteins have been revealed. The C3H gene families are involved in various plant developmental and adaptation-related processes and play important roles in hormone regulation. In the jasmonic acid (JA) pathway of rice (Oryza sativa), the overexpression of OsDOS results in negative regulation that significantly delays leaf senescence (Kong et al., 2006). In Arabidopsis thaliana, ATML1 is a specific C3H gene that is indispensable for the embryogenesis of seeds (Li, 1998). AtC3H14 and AtC3H15 regulate secondary wall thickening, anther development, and male fertility (Kim et al., 2014; Lu et al., 2014; Chai et al., 2015). Additionally, some C3H zinc-finger proteins participate in abiotic and biotic stress responses. In A. thaliana, TZF1 is involved in sugar signal transduction, and it’s overexpression delayed an increase in salt tolerance (Lin et al., 2014). AtZFP1 improves plant salt tolerance (Han et al., 2014) by maintaining the ion balance and alleviating oxidation and osmotic stress. AtSZF1 and AtSZF2 modulate the expression of many salt-sensitive genes, resulting in enhanced salt tolerance in A. thaliana (Sun et al., 2007). Rice C3H12 regulates rice bacterial blight resistance (Deng et al., 2012) through the JA signaling pathway, and after the over-expression of C3H18 in sweet potato, plant resistance to drought and high salt conditions is enhanced (Zhang et al., 2019) through the regulation of many stress-response genes. In cotton (Gossypium hirsutum), ZFP1 controls salt tolerance, as well as disease resistance, by interacting with dehydrin and disease resistance-related proteins, respectively (Guo et al., 2009).
Phaseolus vulgaris L. is a valuable legume crop and a livelihood source for many people (Broughton et al., 2003; Wu et al., 2020). Additionally, the crop is rich in proteins and micro-nutrients that are essential for human health. The crop yield has slowly improved, particularly in tropical regions, and favorable yields have been realized in temperate countries because of the development of new cultivars (Rosenzweig and Liverman, 1992). The C3H genes participate in many responses related to various abiotic stresses in several plant species. However, the C3H family in P. vulgaris has not been characterized. To screen for potential salt-tolerance genes expressed during the sprout stage of P. vulgaris, members of C3H gene family were identified at the genome level. Here, 29 PvC3H members were detected in the P. vulgaris genome. Furthermore, their distribution among the chromosomes was determined and their conserved domains and collinearity investigated. PvC3H gene expression levels were evaluated in multiple P. vulgaris varieties. Additionally, the expression patterns of the PvC3H genes were analyzed in various tissues at the sprout stage, and the possible regulation of specifically expressed PvC3H genes under salt stress and other stress conditions was investigated. These findings offer crucial information for studying the evolution and functional differentiation of the C3H gene family in common bean.
The HMMER software1 and the Pfam protein family database2 (Finn et al., 2016) were employed to identify candidate C3H proteins containing the C3H domain (PF00642). The protein annotation file was retrieved from the website of Esembl plants3. Subsequently, InterPro4 (Finn et al., 2017) and SMART5 (Letunic et al., 2015; Han et al., 2019) software were applied to verify the reliability of the C3H domain prediction. Lastly, Interpro6, WoLF PSORT7, P3DB8, and the ExPASy Proteomics Server9 were employed to verify the integrity of the C3H domains in the candidate genes. Each C3H gene was named on the basis of their precise position on the chromosome.
The C3H protein sequences of the other species, like Arabidopsis, were obtained from Esembl plants using the C3H domain. C3Hs were introduced into MEGA X to perform multiple sequence alignments. The Maximum-likelihood method with the JTT + G model, which MEGA X predicted as the optimal model, and 1,000 replicates were used to produce bootstrap values. MEGA X was used to revise and construct a phylogenetic tree.
The GSDS platform10 (Guo et al., 2007) was used to display and analyze the exon–intron structures of the PvC3H genes. GeneWise (Birney et al., 2004) was used to examine the correspondence to coordinates in the DNA (comprising both exons and introns) versus protein sequences. Subsequently, in-house perl scripts were used to transform the C3H domain coordinates in the protein sequence to those in the nucleotide sequence. The intron-splicing phase in the hinge and the basic regions of the C3H domains from all the PvC3H genes were characterized and separated into various types. The MEME tool11 (Bailey et al., 2009) was employed to detect additional motifs outside the C3H domain in the protein sequences. Motifs containing 10–50 amino acids and E-value < 1e–20 were characterized. All of the motifs found among the PvC3Hs were compared to identify the group-specific or group-conserved signatures. The motifs were numbered based on the order in which they occurred in the protein sequences.
The mapping of the PvC3Hs to the chromosomes was performed using the chromosomal locations provided by Esembl plants. The Multiple Collinearity Scan toolkit (MCScanX) was used to examine gene duplication events based on default parameters (Wang et al., 2012). Additionally, circos (version 0.6912) was used to generate the visualization as described previously (Krzywinski et al., 2009).
Two kinds of common beans, which are salt-tolerant (R) and salt-sensitive (N), respectively, were selected as the test materials. They were treated with water (W) and 0.4% NaCl (S). The plants were then placed in a 28°C incubator without light for 7 days. The numbers of germination events were recorded consecutively for 7 days.
After 5 days, the bean-free hypocotyls of WN, SN, WR, and SR were selected, with three repeated treatments. All the materials were rapidly frozen in liquid nitrogen at a low temperature and then rapidly ground independently into powder. The RNAs were extracted using TRIzol (Invitrogen, Carlsbad, CA, United States), and the RNA quality was determined using 1% agarose gel electrophoresis and NanoDrop (Thermo, Carlsbad, CA, United States) instrumentation. The concentration and purity of the RNAs were determined using a NanoDrop spectrophotometer. The OD260/280 was required to be between 1.8 and 2.2, and that of the 28S/18S was required to be 1.0 or greater. An Agilent Bioanalyzer 2100 (Agilent Technologies, Carlsbad, California) was used to determine the RNA integrity. All the sequencing samples were rated as A-level, meeting the requirements of library construction. After qualified RNA detection, sequencing libraries were constructed (Supplementary Table 1) on an Illumina HiSeq 2500 PE 150 and referring to the NCBI Common bean (P. vulgaris) reference genome. The heat map was constructed using Tbtools software (Chen et al., 2020). The Kyoto Encyclopedia of Genes and Genomes (KEGG) database13 and the phytozome database14 were used for gene annotation. Gene ontology (GO) annotations were predicted using Blast2GO software (Conesa et al., 2005), and the functional classification of genes was performed using WEGO software (Ye et al., 2006).
Different tissues (cotyledon, hypocotyl, and radicle) of WR were selected on the fifth day during the sprout stage, and hypocotyls of the four samples (WR, WN, SR, and SN) were selected on the fourth, fifth and sixth days. Each sample had three biological repeats. Total RNA was extracted using RNA isolater Total RNA Extraction Reagent (Vazyme Biotech, China). After the extraction, the RNA samples were electrophoresed in 1% agarose gel for detection and quality control. Additionally, a NanoDrop spectrophotometer was used to check the concentration and purity of the RNAs. Samples of poor quality were discarded. Premier 5.0 (Pi et al., 2018) was used to design the RT-qPCR primers (Supplementary Table 2). PvC3Hs were selected from the GO enrichment and KEGG pathways, and some PvC3Hs were selected as candidate genes for verification. ACTIN-11 of common bean served as an internal control gene (Borges et al., 2012). The RNA was transcribed to cDNA, and then, RT-qPCR was performed using 2 × ChamQ Universal SYBR qPCR Master Mix Kit (Vazyme Biotech, China). The RT-qPCR was performed in triplicate. The relative gene expression was determined as follows (Livak and Schmittgen, 2001):
Relative Expression = 2Δ Δ Ct, Where Δ ΔCt = [Ct(Pv target genes) −Ct(PvACTIN-11)].
Office 2013 and SPSS 19.0 were used for data analyses (Li et al., 2018).
In total, 65 protein sequences with C3H domains were identified using a HMM profile analysis from the common bean genome. Furthermore, InterPro and SMART analyses assigned 29 putative members, PvC3H01–29, to the common bean C3H family (Table 1). The 29 PvC3H members were located on the 11 chromosomes (Chrs) of common bean.
Specifically, most of the PvC3Hs were located on Chrs 7 and 3, while few genes were distributed on Chrs 2 and 10 (Figure 1). At least one PvC3H member was mapped to each chromosome.
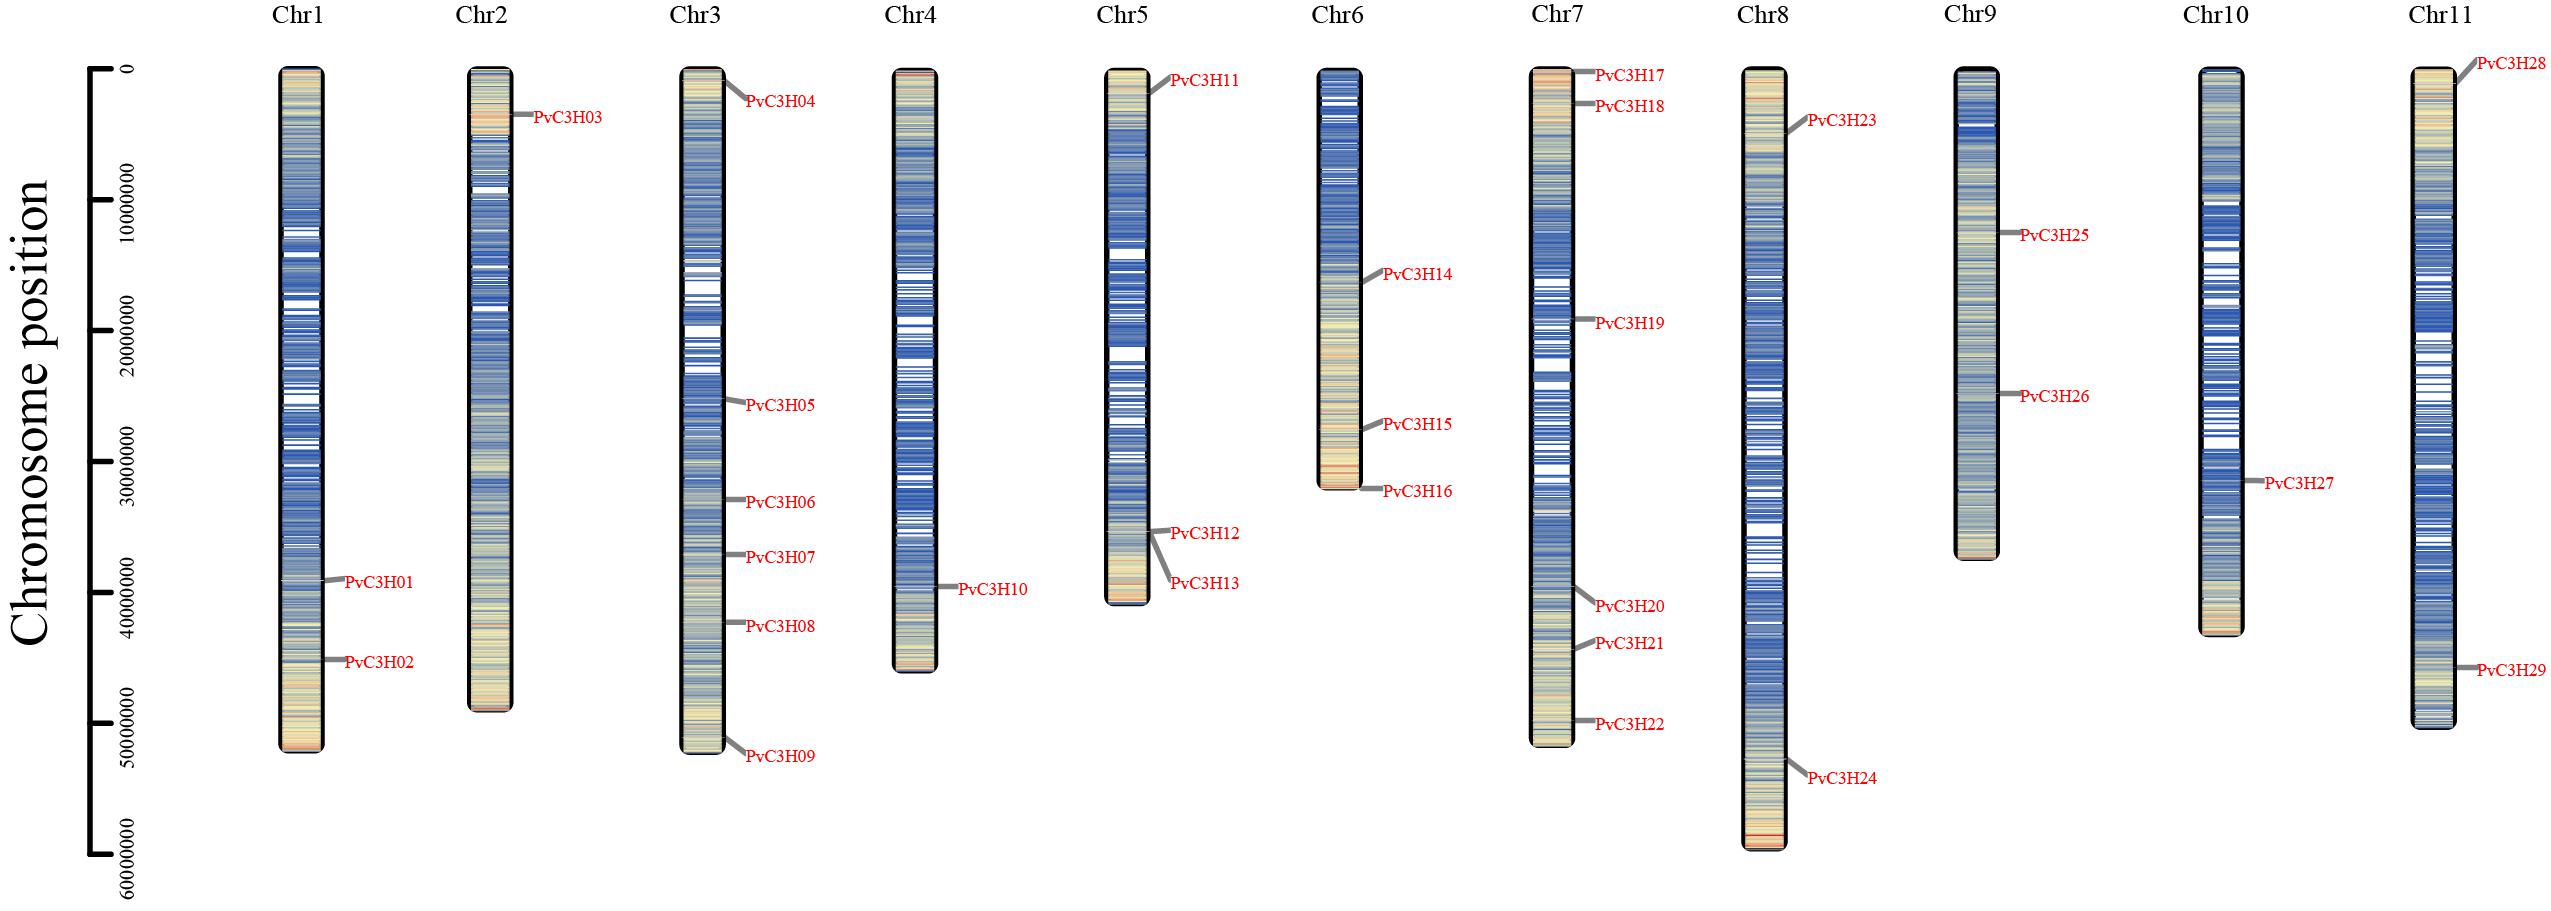
Figure 1. Chromosomal localization of PvC3H members. The y-axis indicates chromosome position. The denser the blue, the greater the gene density of the area.
A comprehensive phylogenetic tree comprising 147 C3H protein sequences from three plants, 29 sequences from common bean (P. vulgaris), 50 from rice (O. sativa.), and 68 from the A. thaliana, was constructed (Figure 2). The PvC3H, rice protein sequences and A. thaliana C3H sequences were obtained from a public database retrieved using the pfam method. The phylogenetic tree of the C3H sequences was generated with the Maximum-likelihood method using a JTT + G model, which was the optimal model as determined by MEGA X software. Using the phylogenetic tree and the classification method applied to the C3H genes in A. thaliana (Wang et al., 2008), which were separated into 11 subfamilies, I–X I, the C3H genes in P. were classified into only seven subfamilies (I, III, V, VI, VII, VIII, and XI).
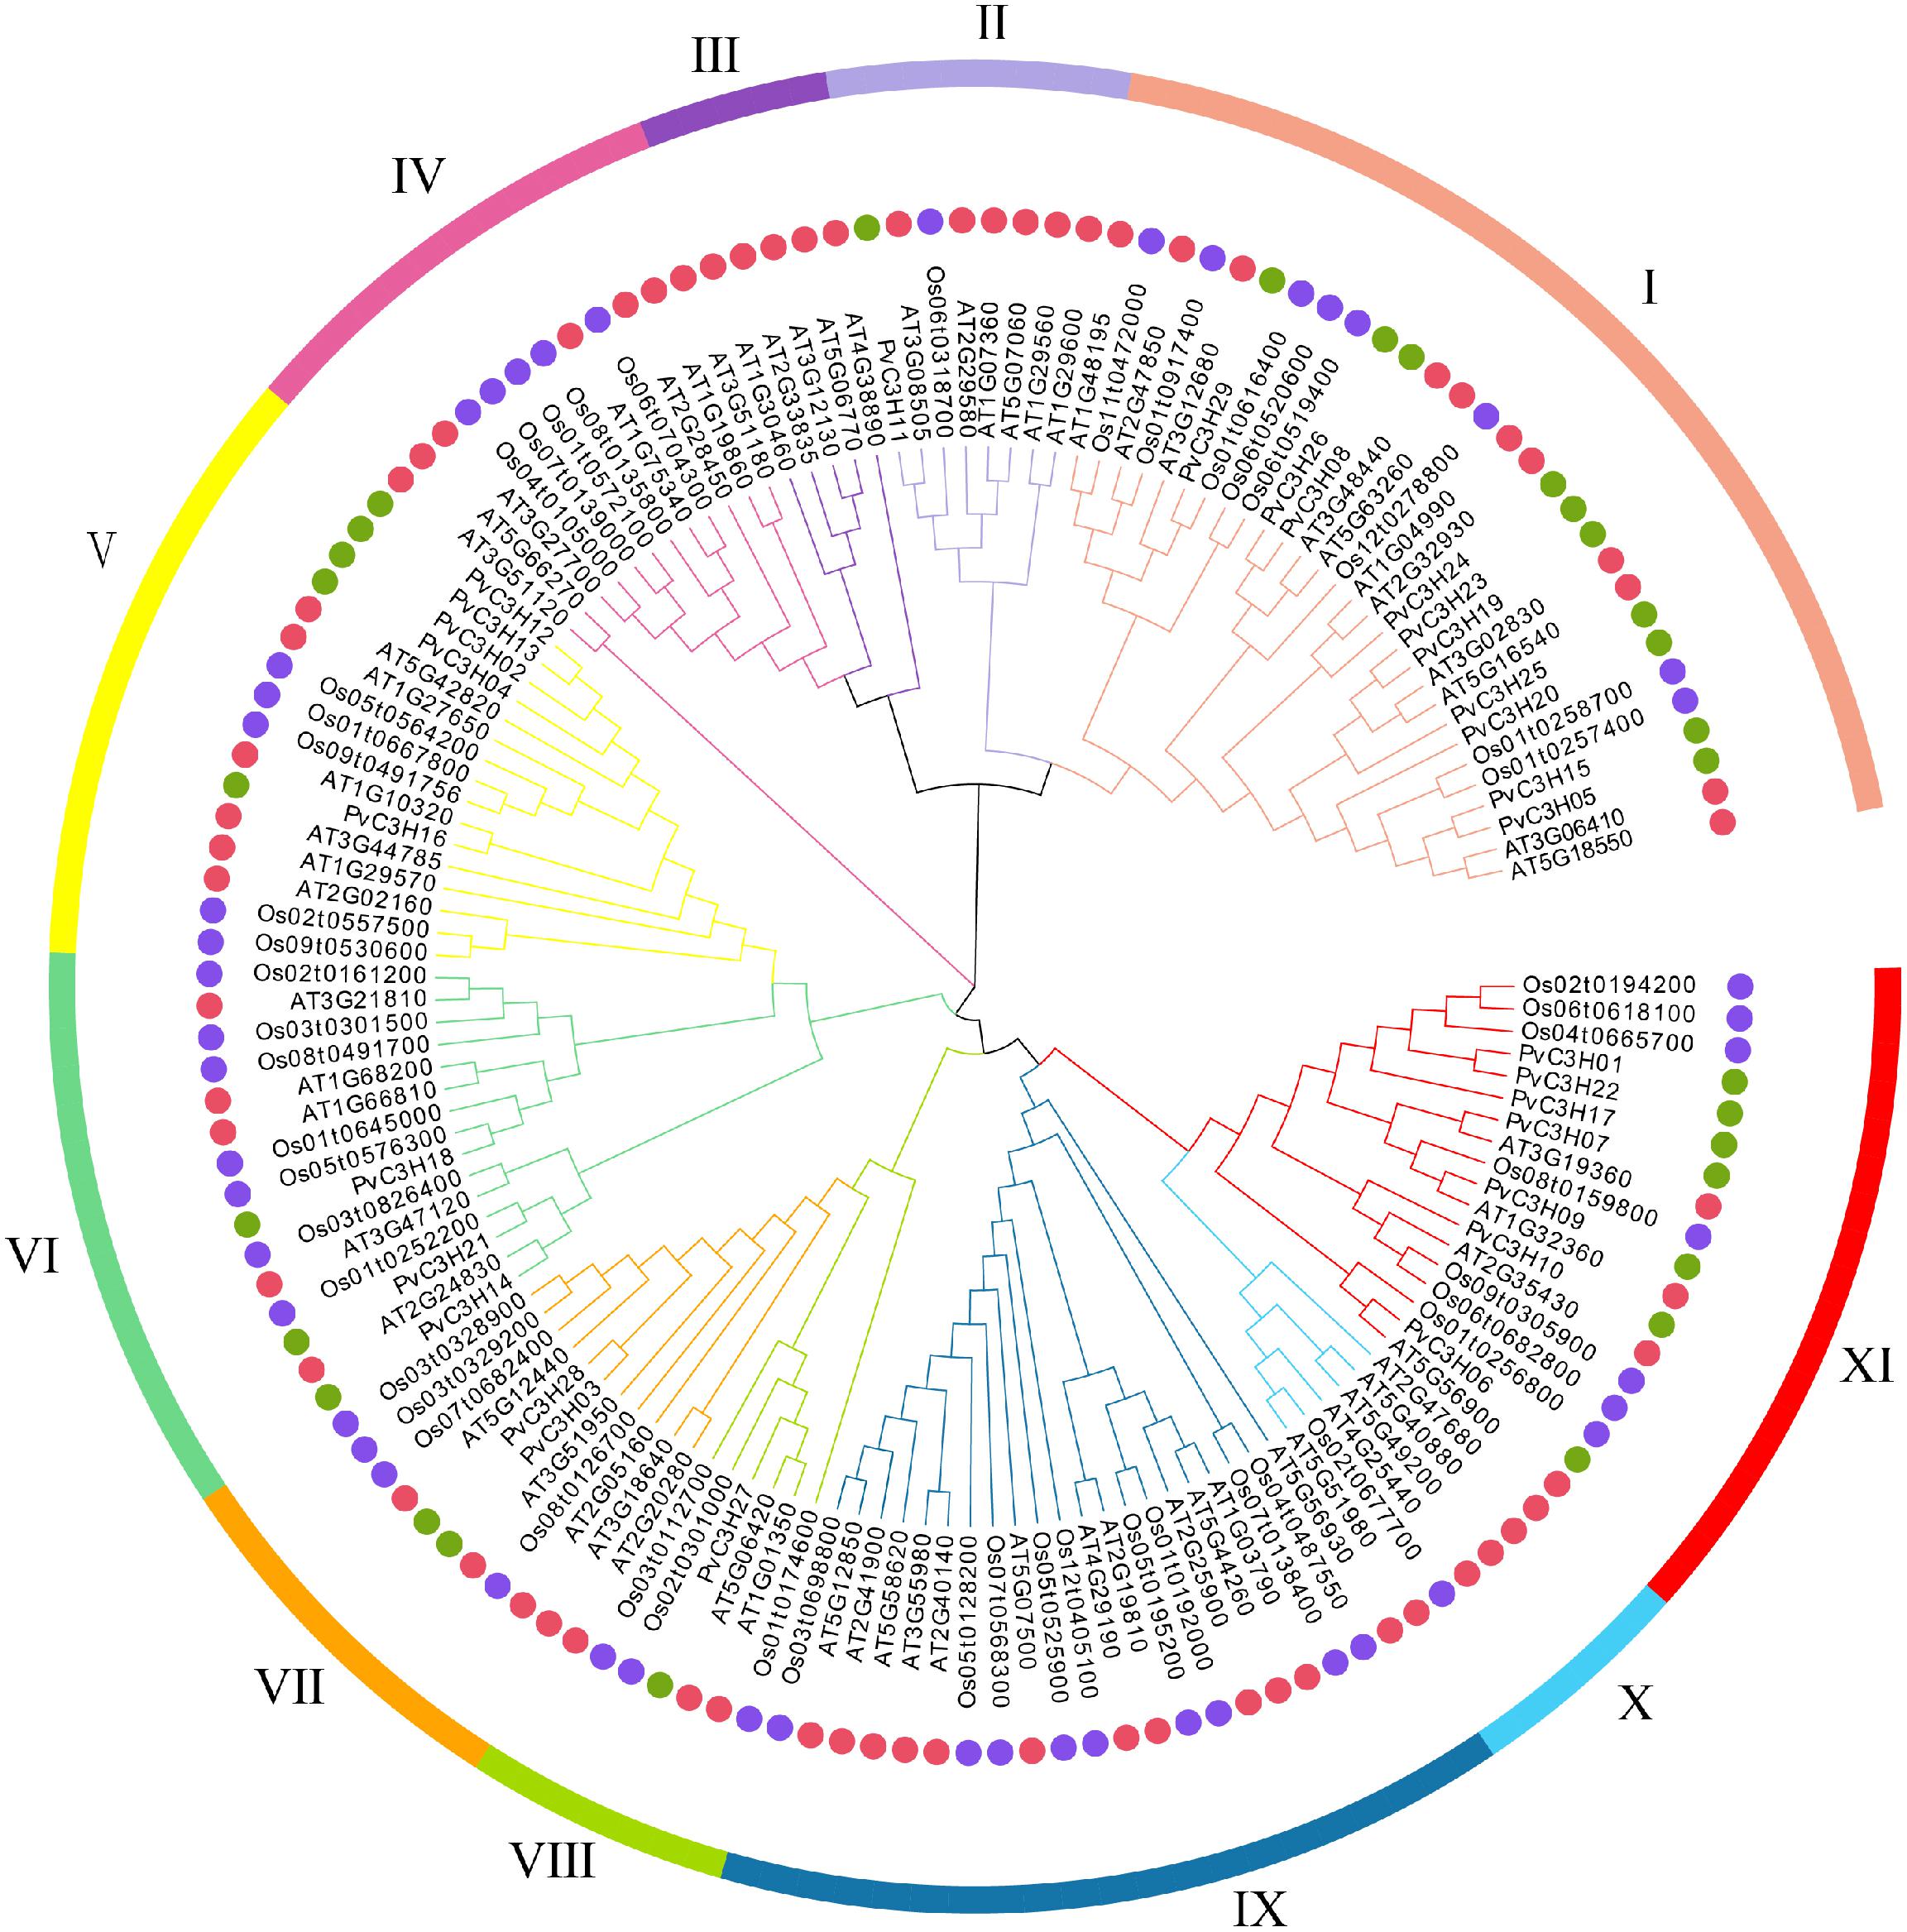
Figure 2. Phylogenetic tree showing the distribution of C3H proteins from three plant species: P. vulgaris L., O. sativa, and A. thaliana. The ML method with the JTT + G model was used to construct the phylogenetic tree in MEGA X. The proteins were divided into 11 subfamilies (I–X I) delineated by different colors. The red, purple, and green circles represent the A. thaliana, O. sativa, and P. vulgaris L. C3H family members, respectively.
The exon–intron structures of the 29 PvC3Hs were examined to reveal the gene structures and the evolutionary trajectory (Figure 3A). Each subfamily had a conserved C3H domain, and the exon and intron numbers, ranging from 0 to 11, were similar in each subfamily. Generally, the PvC3Hs that clustered together showed similar structures (Figure 3B).
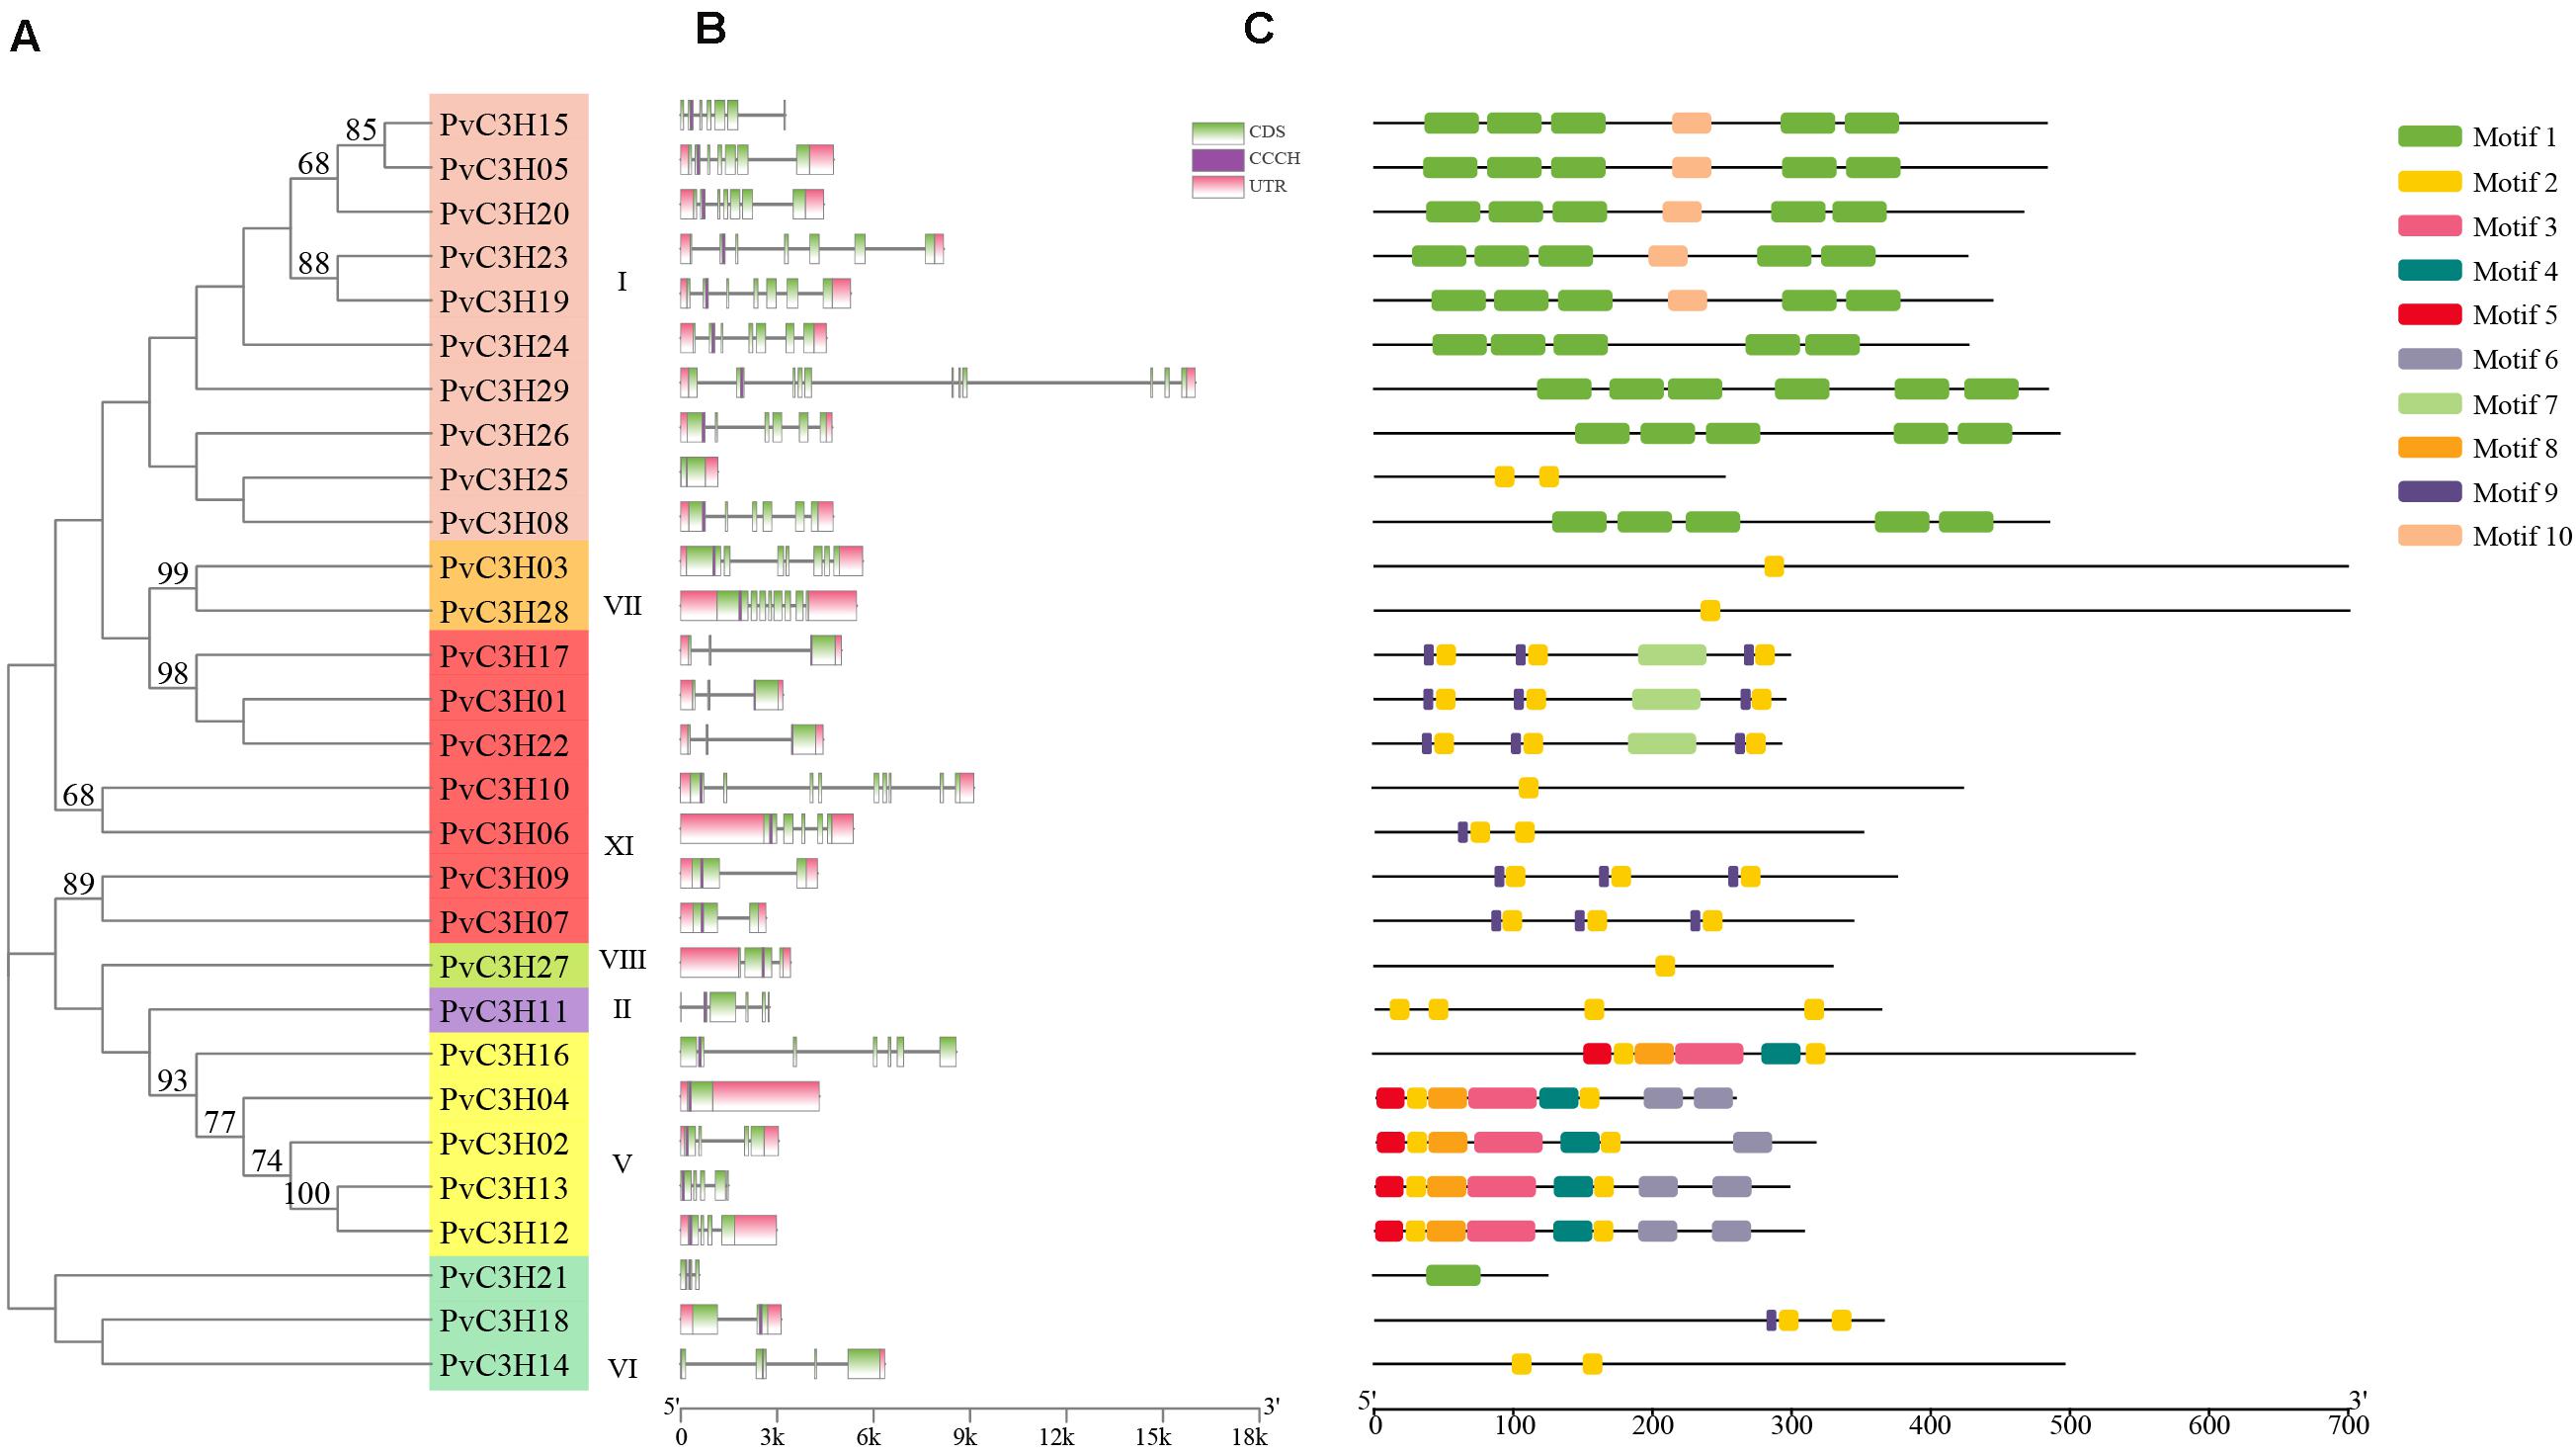
Figure 3. Gene structures and motifs of PvC3H family members. (A) The clustering of PvC3H proteins based on a Maximum-likelihood based phylogenetic tree. Bootstrap values from 1,000 replicates are shown at each node. (B) PvC3H structures. The purple boxes represent C3H domains, the green boxes represent the UTR regions, the yellow boxes represent the exons, and the black lines represent the introns. (C) Schematic depiction of 10 conserved motifs in PvC3H proteins. The MEME online tool was used to identify motifs in the PvC3H proteins. Each motif type is denoted using different-colored blocks, and the numbers in the boxes (1–10) signify motifs 1–10. The length and position of each colored box is scaled to size.
The conservative motifs of the 29 PvC3Hs were analyzed using MEME software. Figure 3C shows the motifs and the composition of each PvC3H. The motifs of each subfamily were relatively similar, which confirmed the close associations among the same subfamilies in the evolutionary tree.
The cis-regulatory elements were analyzed using PlantCARE software, which showed the promoters of PvC3Hs as determined by comparison with the common bean reference genome database. In total, 13 elements, including hormone-forming, stress-related, and seed germination elements, were found, as shown in Figures 4A,B and Supplementary Table 3. The phytohormone responsive cis-acting elements (red) may be activated during plant growth, which suggests that the PvC3H family responds to stress-related hormones. Some of the elements present are induced by low-temperature and drought, indicating that the PvC3Hs may have roles in abiotic stress responses. Other elements (yellow) are involved in plant germination or activated during the sprout stage, which indicates that these elements play roles during the plant germination period.
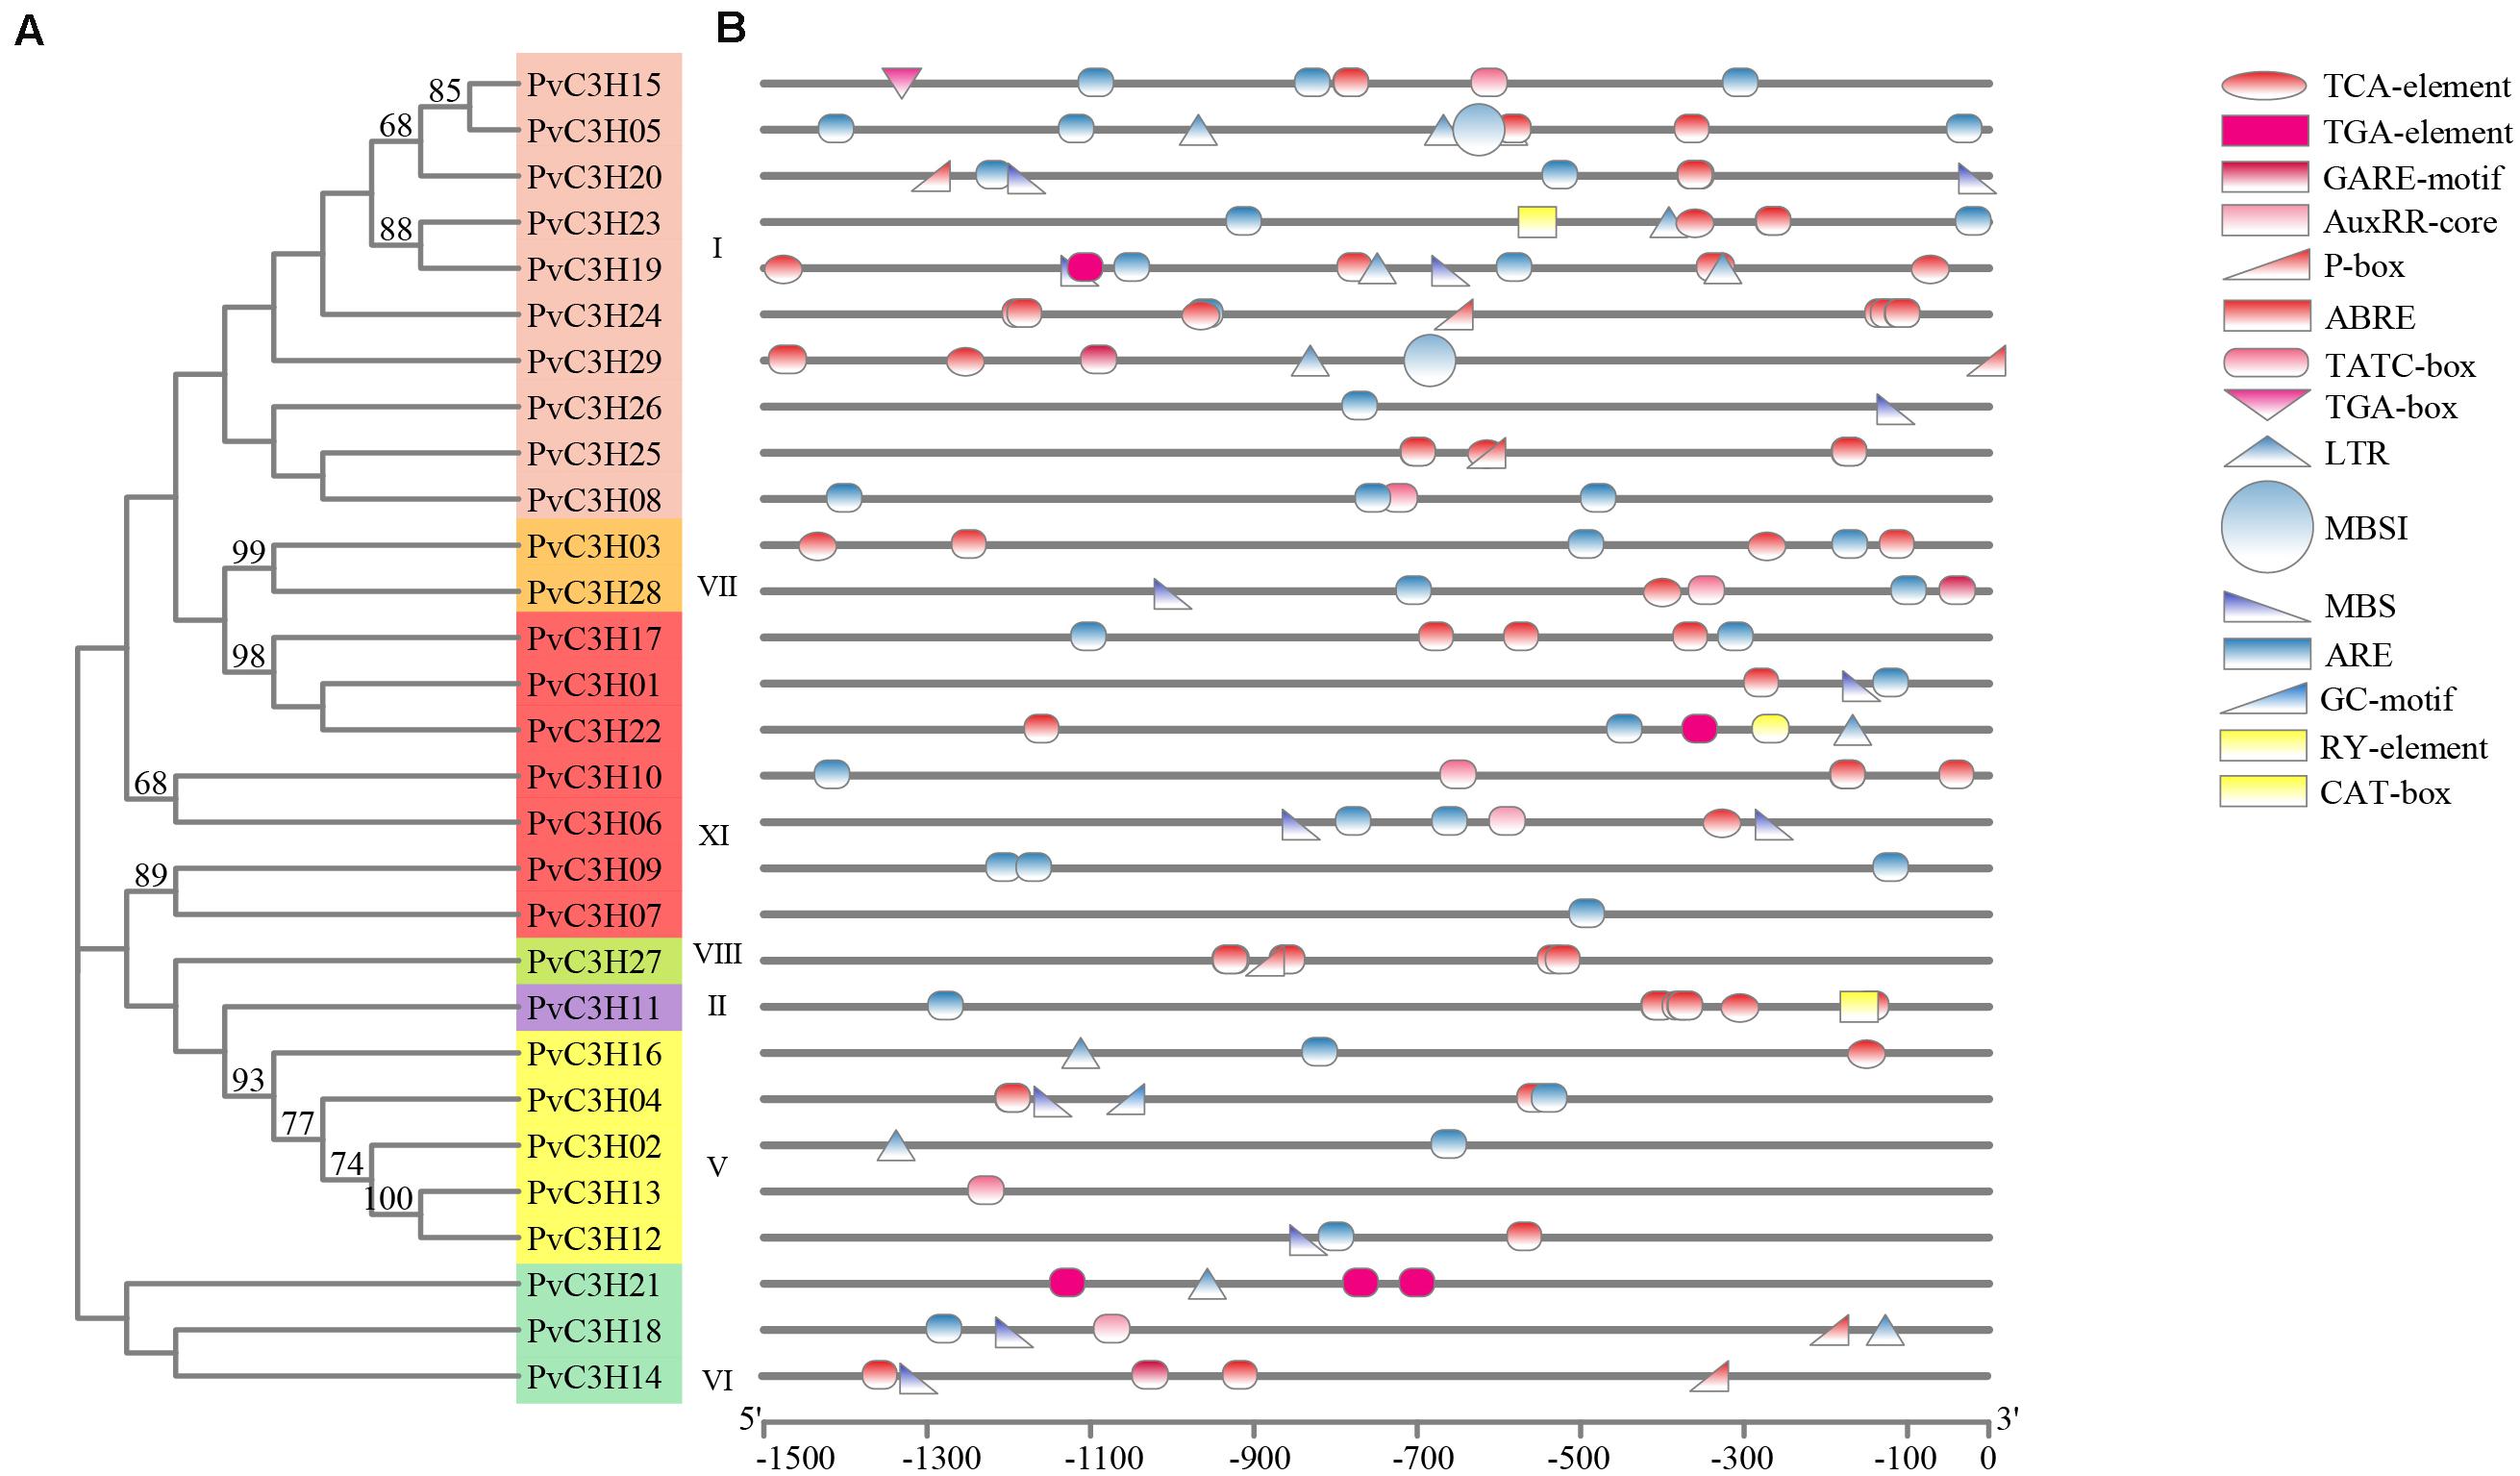
Figure 4. Cis-regulatory element analysis of the PvC3H family. (A) The clustering of PvC3H proteins based on a ML phylogenetic tree. Bootstrap values from 1,000 replicates are shown at each node. (B) Cis-element analysis of the promoter regions of P. vulgaris C3H genes. Different colored shapes represent different kinds of cis-regulatory elements. Red, blue, and yellow represent hormone-, stress-, and seed germination-related elements, respectively.
The collinear analysis of the P. vulgaris C3H family of genes within species and with other legume crops and A. thaliana are shown in Figure 5. Only four pairs of C3H family genes in P. vulgaris were collinear. In leguminous species, there was collinearity between the C3H family genes and 43 genes in soybean (Glycine max), 23 genes in adzuki bean (Vigna angularis), and 11 genes in mung bean (Vigna radiata), which indicated that the P. vulgaris C3H family genes were closely related to genes in the legume family. Additionally, PvC3H05 and PvC3H26 were collinear with AT5G18550, and PvC3H08 and PvC3H15 were collinear with AT5G16540, indicating that the four C3H family genes may have similar functions in P. vulgaris. Selection pressure analyses of collinear genes have revealed that a ratio of the non-synonymous mutation rate (Ka) to the synonymous mutation rate (Ks) = 1 usually represents neutral selection, whereas Ka/Ks < 1 represents negative or purified selection. Supplementary Table 4 shows that the Ka/Ks values of most pairs of replicated CH3 genes in P. vulgaris were less than 1, indicating that they underwent purification and selection after replication, and we speculated that their gene functions did not undergo differentiation, thereby largely maintaining the functional similarities of the PvC3H family members.
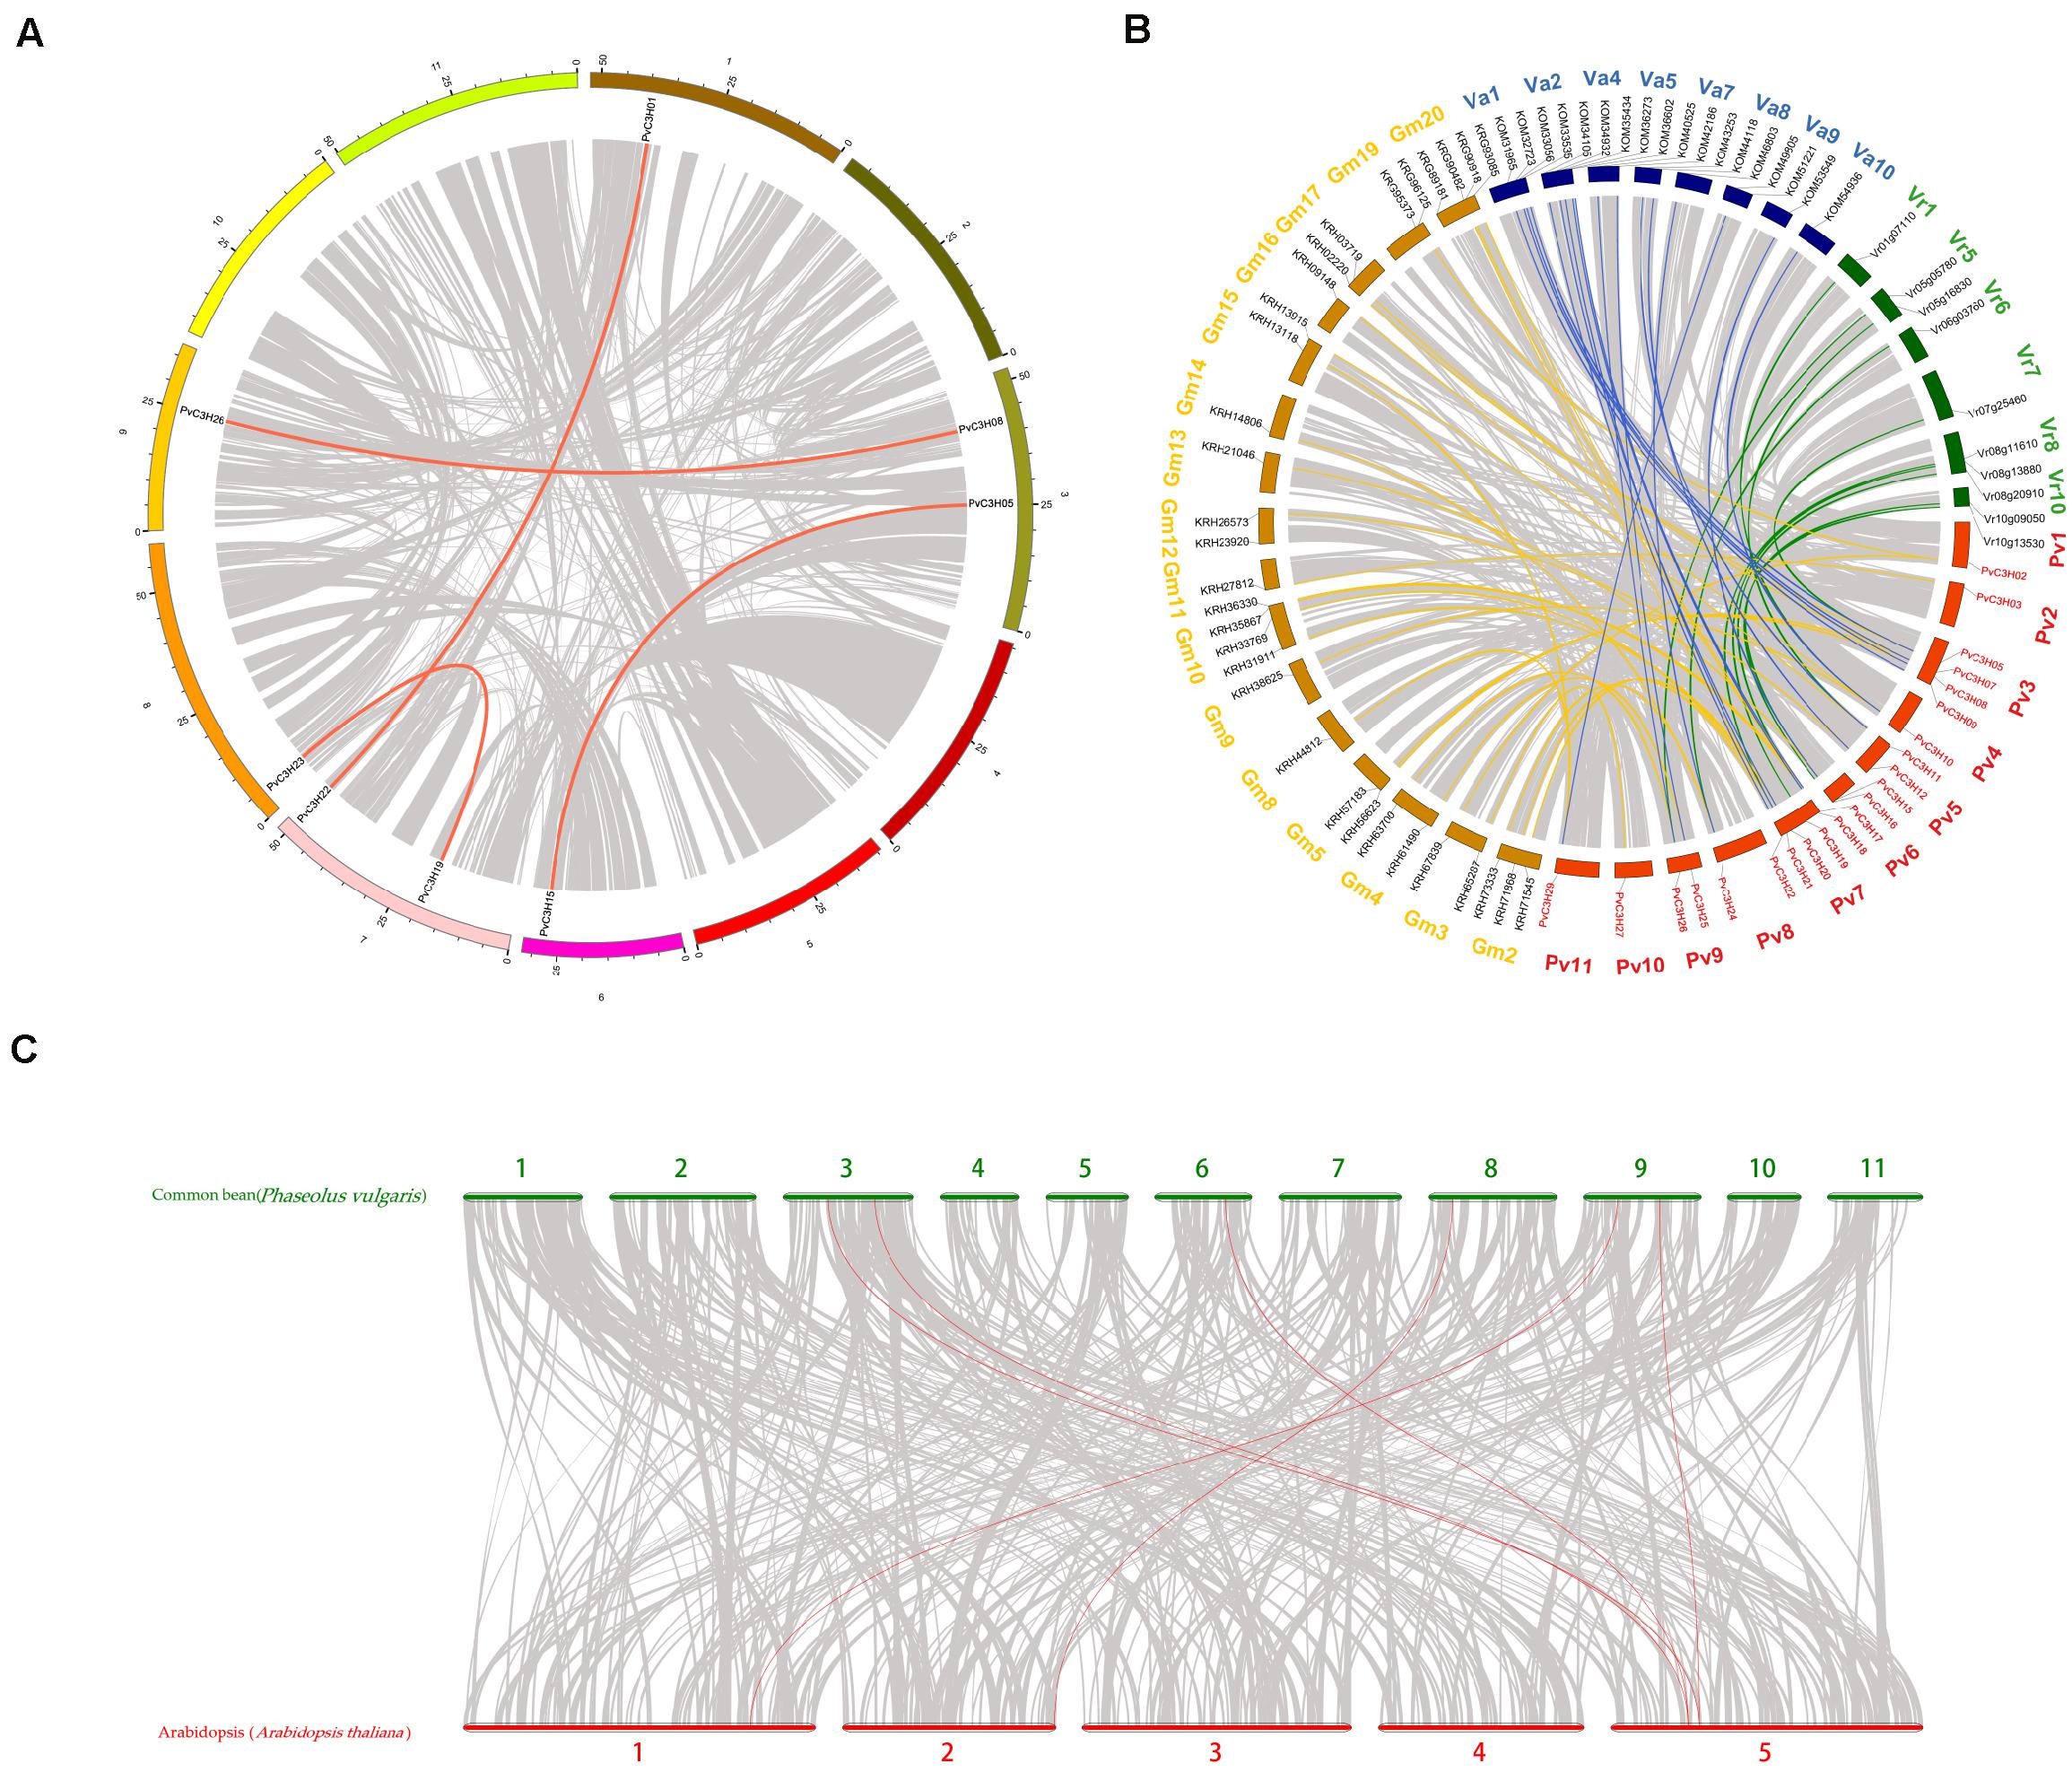
Figure 5. Collinearity analysis of the C3H gene family in P. vulgaris. The bright lines represent collinearity, and the gray lines represent all isomorphic blocks in the genome. The collinear relationship (A) within the common bean species, (B) between common bean and three other species of legumes, and (C) between common bean and A. thaliana.
To clarify the sampling time, the germination numbers of N and R were investigated. The number of germination events for R after each treatment was similar. There was no difference in the number of germination events under S conditions. For N, a significant difference in the number of germination events was found between the two treatments. The difference appeared on the fifth day. The number of germination events between WN and SN differed after 5 day. There was no difference in the germination number of R after 5 days of the W treatment compared with the S treatment, but the germination number of N had decreased (Figure 6). Therefore, the fifth day was used as the sampling time.
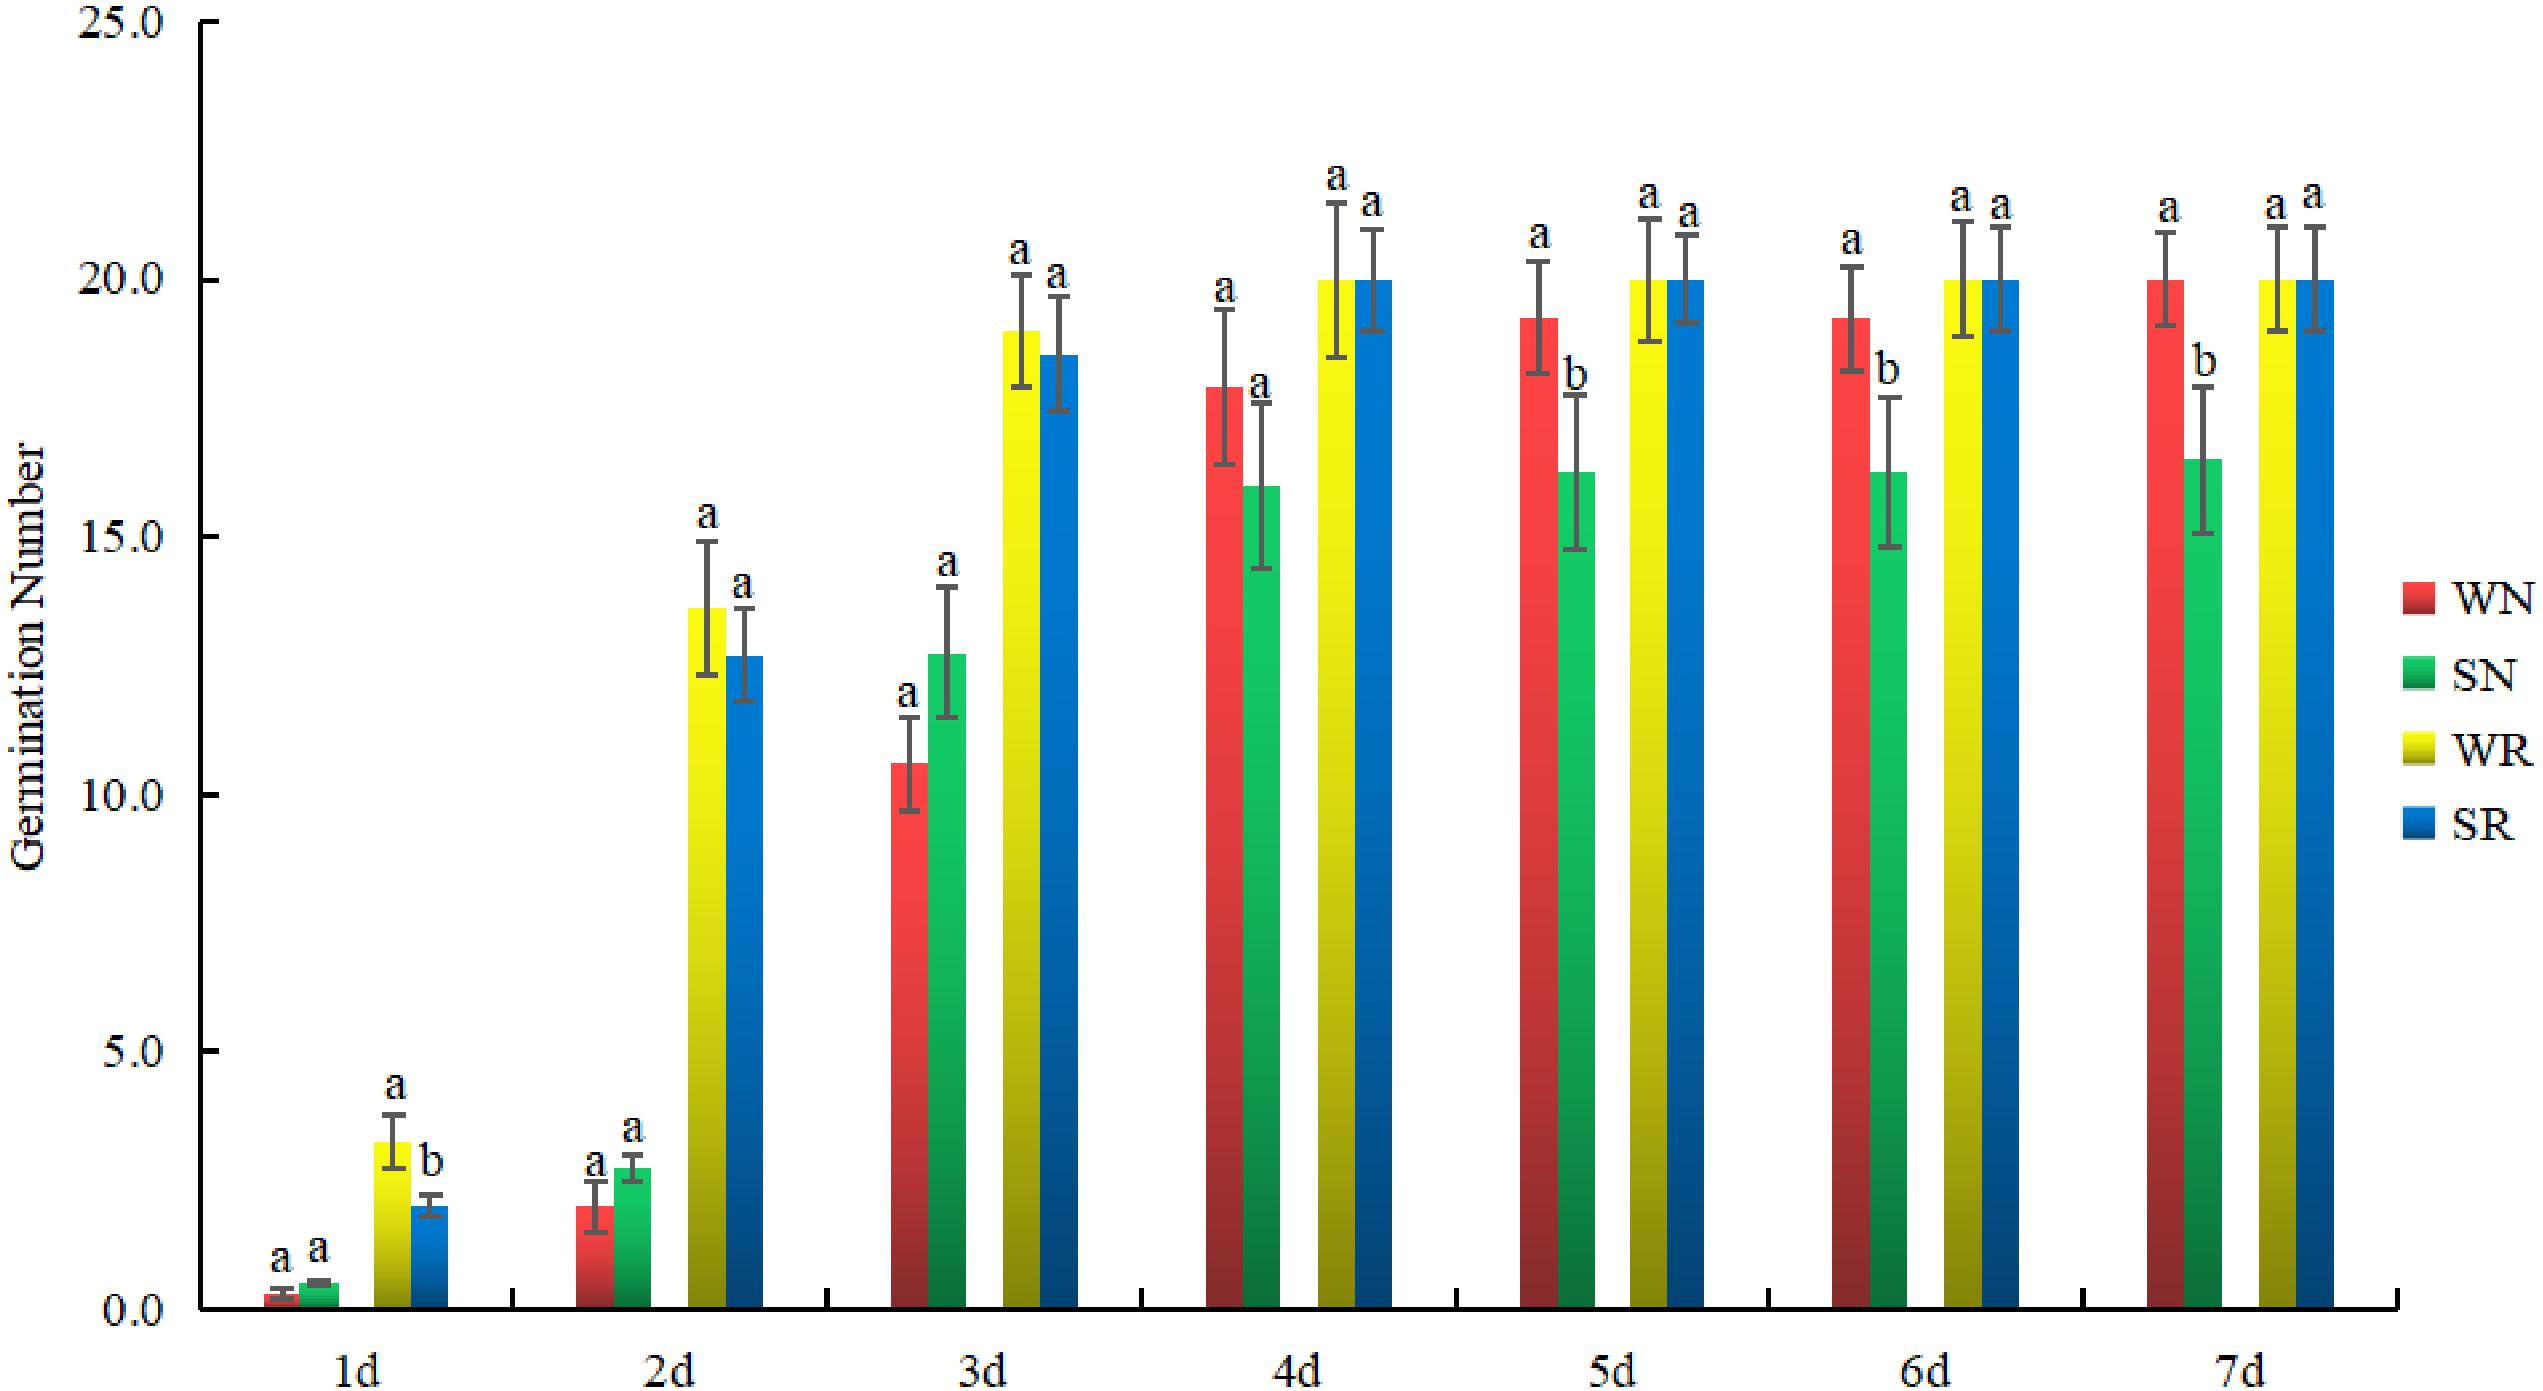
Figure 6. Dynamic variation in germination numbers of salt-tolerant (R) and salt-sensitive (N) common bean varieties. They were treated with water (W) and 0.4% NaCl (S). Green and red bars represent WN and SN, respectively, while yellow and blue bars represent WR and SR, respectively. The x-axis indicates time, and the y-axis indicates the number of germination events. Lower case letter(s) above bars indicate significant differences (α = 0.05, LSD) among the treatments. The x-axis indicates germination time, and the y-axis indicates germination number.
The transcriptional patterns of PvC3Hs in many tissues, including flower buds, flowers, green mature pods, leaves, nodules, roots, trifoliates, stems, pods, and seeds, were examined using high-throughput sequencing data from the Phytozome database. The expression levels of PvC3Hs in various tissues were high, and the expression differences were relatively great (Figure 7A). To elucidate the functions of the C3Hs in P. vulgaris at the sprout stage, six PvC3H genes were chosen randomly for analysis. RT-qPCR analyses of three tissues (cotyledon, hypocotyl, and radicle; Figure 7B) from R during the sprout stage was performed to assess the expression levels of these PvC3H genes on the fifth day. As shown in Figure 7C, the relative expression levels of some PvC3Hs in the radicle and hypocotyl were relatively high, while the expression levels of other PvC3Hs showed no differences among the three tissues. Therefore, the hypocotyl and radicle can be used as sprout tissues for PvC3Hs research.
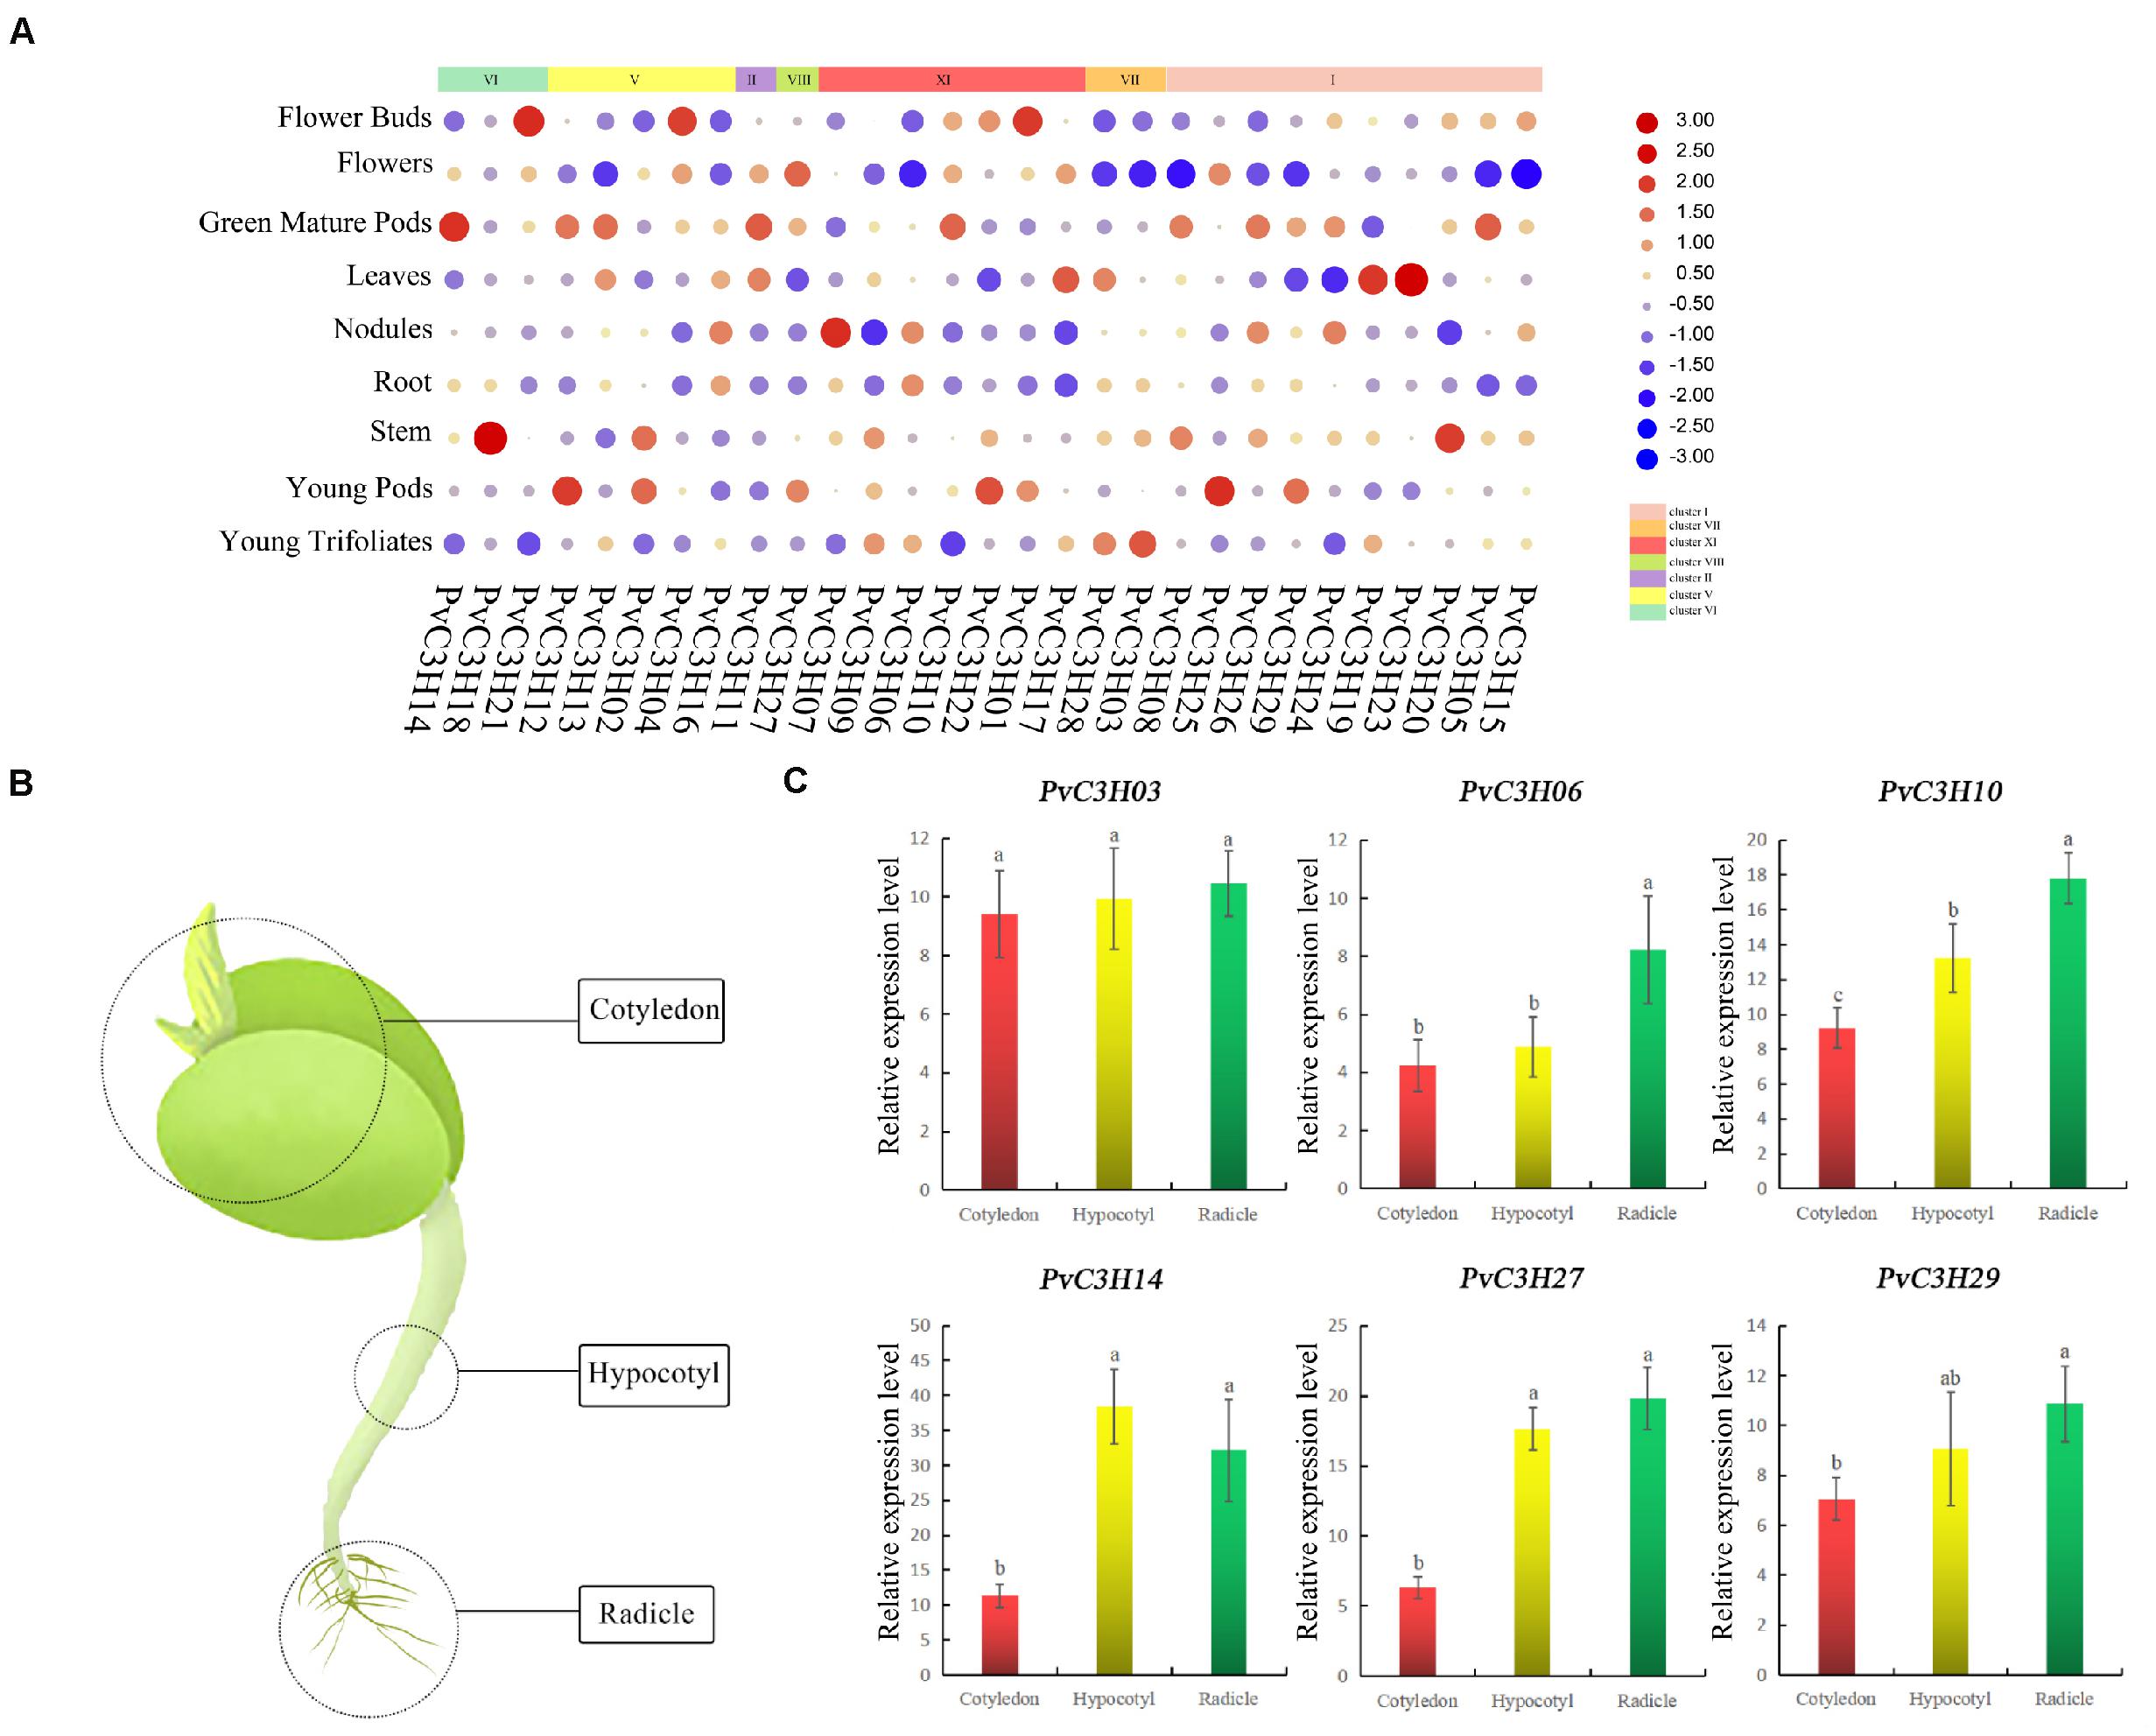
Figure 7. Expression profiles of PvC3Hs. (A) Cluster analysis of expression patterns of PvC3Hs during tissue development. PvC3Hs transcript in various tissues were retrieved from the Phytozome database. The data are presented as heat maps. The color scale indicates expression values; red denotes a high transcriptional level, while blue denotes a low transcriptional level. The circle size is proportional to the level of transcription; a larger circle indicates highly abundant transcripts. (B) Cartoon showing the tissues of the common bean during the sprout stage: cotyledon, hypocotyl, and radicle. PvC3Hs having specific expression profiles were identified. (C) In total, nine PvC3H genes were selected randomly, and their expression levels in different tissues were investigated using the RT-qPCR method. Letters shown above the bars indicate significant differences (α = 0.05, LSD) among the treatments. The x-axis indicates sampling time, and the y-axis indicates relative gene expression.
Two common bean varieties were tested to response to salt stress. R and N, were subjected to two treatments, W and S, and were analyzed after 5 days. The assembled gene dataset, deposited at the National Center for Biotechnology Information under the accession number PRJNA55837615, was used as a reference for further analyses (Supplementary Table 5). Using the constructed bean-free hypocotyl transcriptome, differences in PvC3H gene expression levels were identified (Figure 8A). Six PvC3Hs were randomly selected for RT-qPCR analyses, and the results under W and S conditions were consistent with the transcriptome results (Figure 8B). Compared with N, the relative expression levels of the PvC3Hs showed more differences between WR and SR. Two PvC3Hs were selected randomly and RT-qPCR was performed using samples taken over 3 days. Although the change trend of the curve was different, the PvC3Hs in R showed greater changes in expression under the W and S treatments compared with those in N (Figure 8C). Thus, under salt-stress conditions, the differential expression of PvC3Hs may affect the salt tolerance of plants.
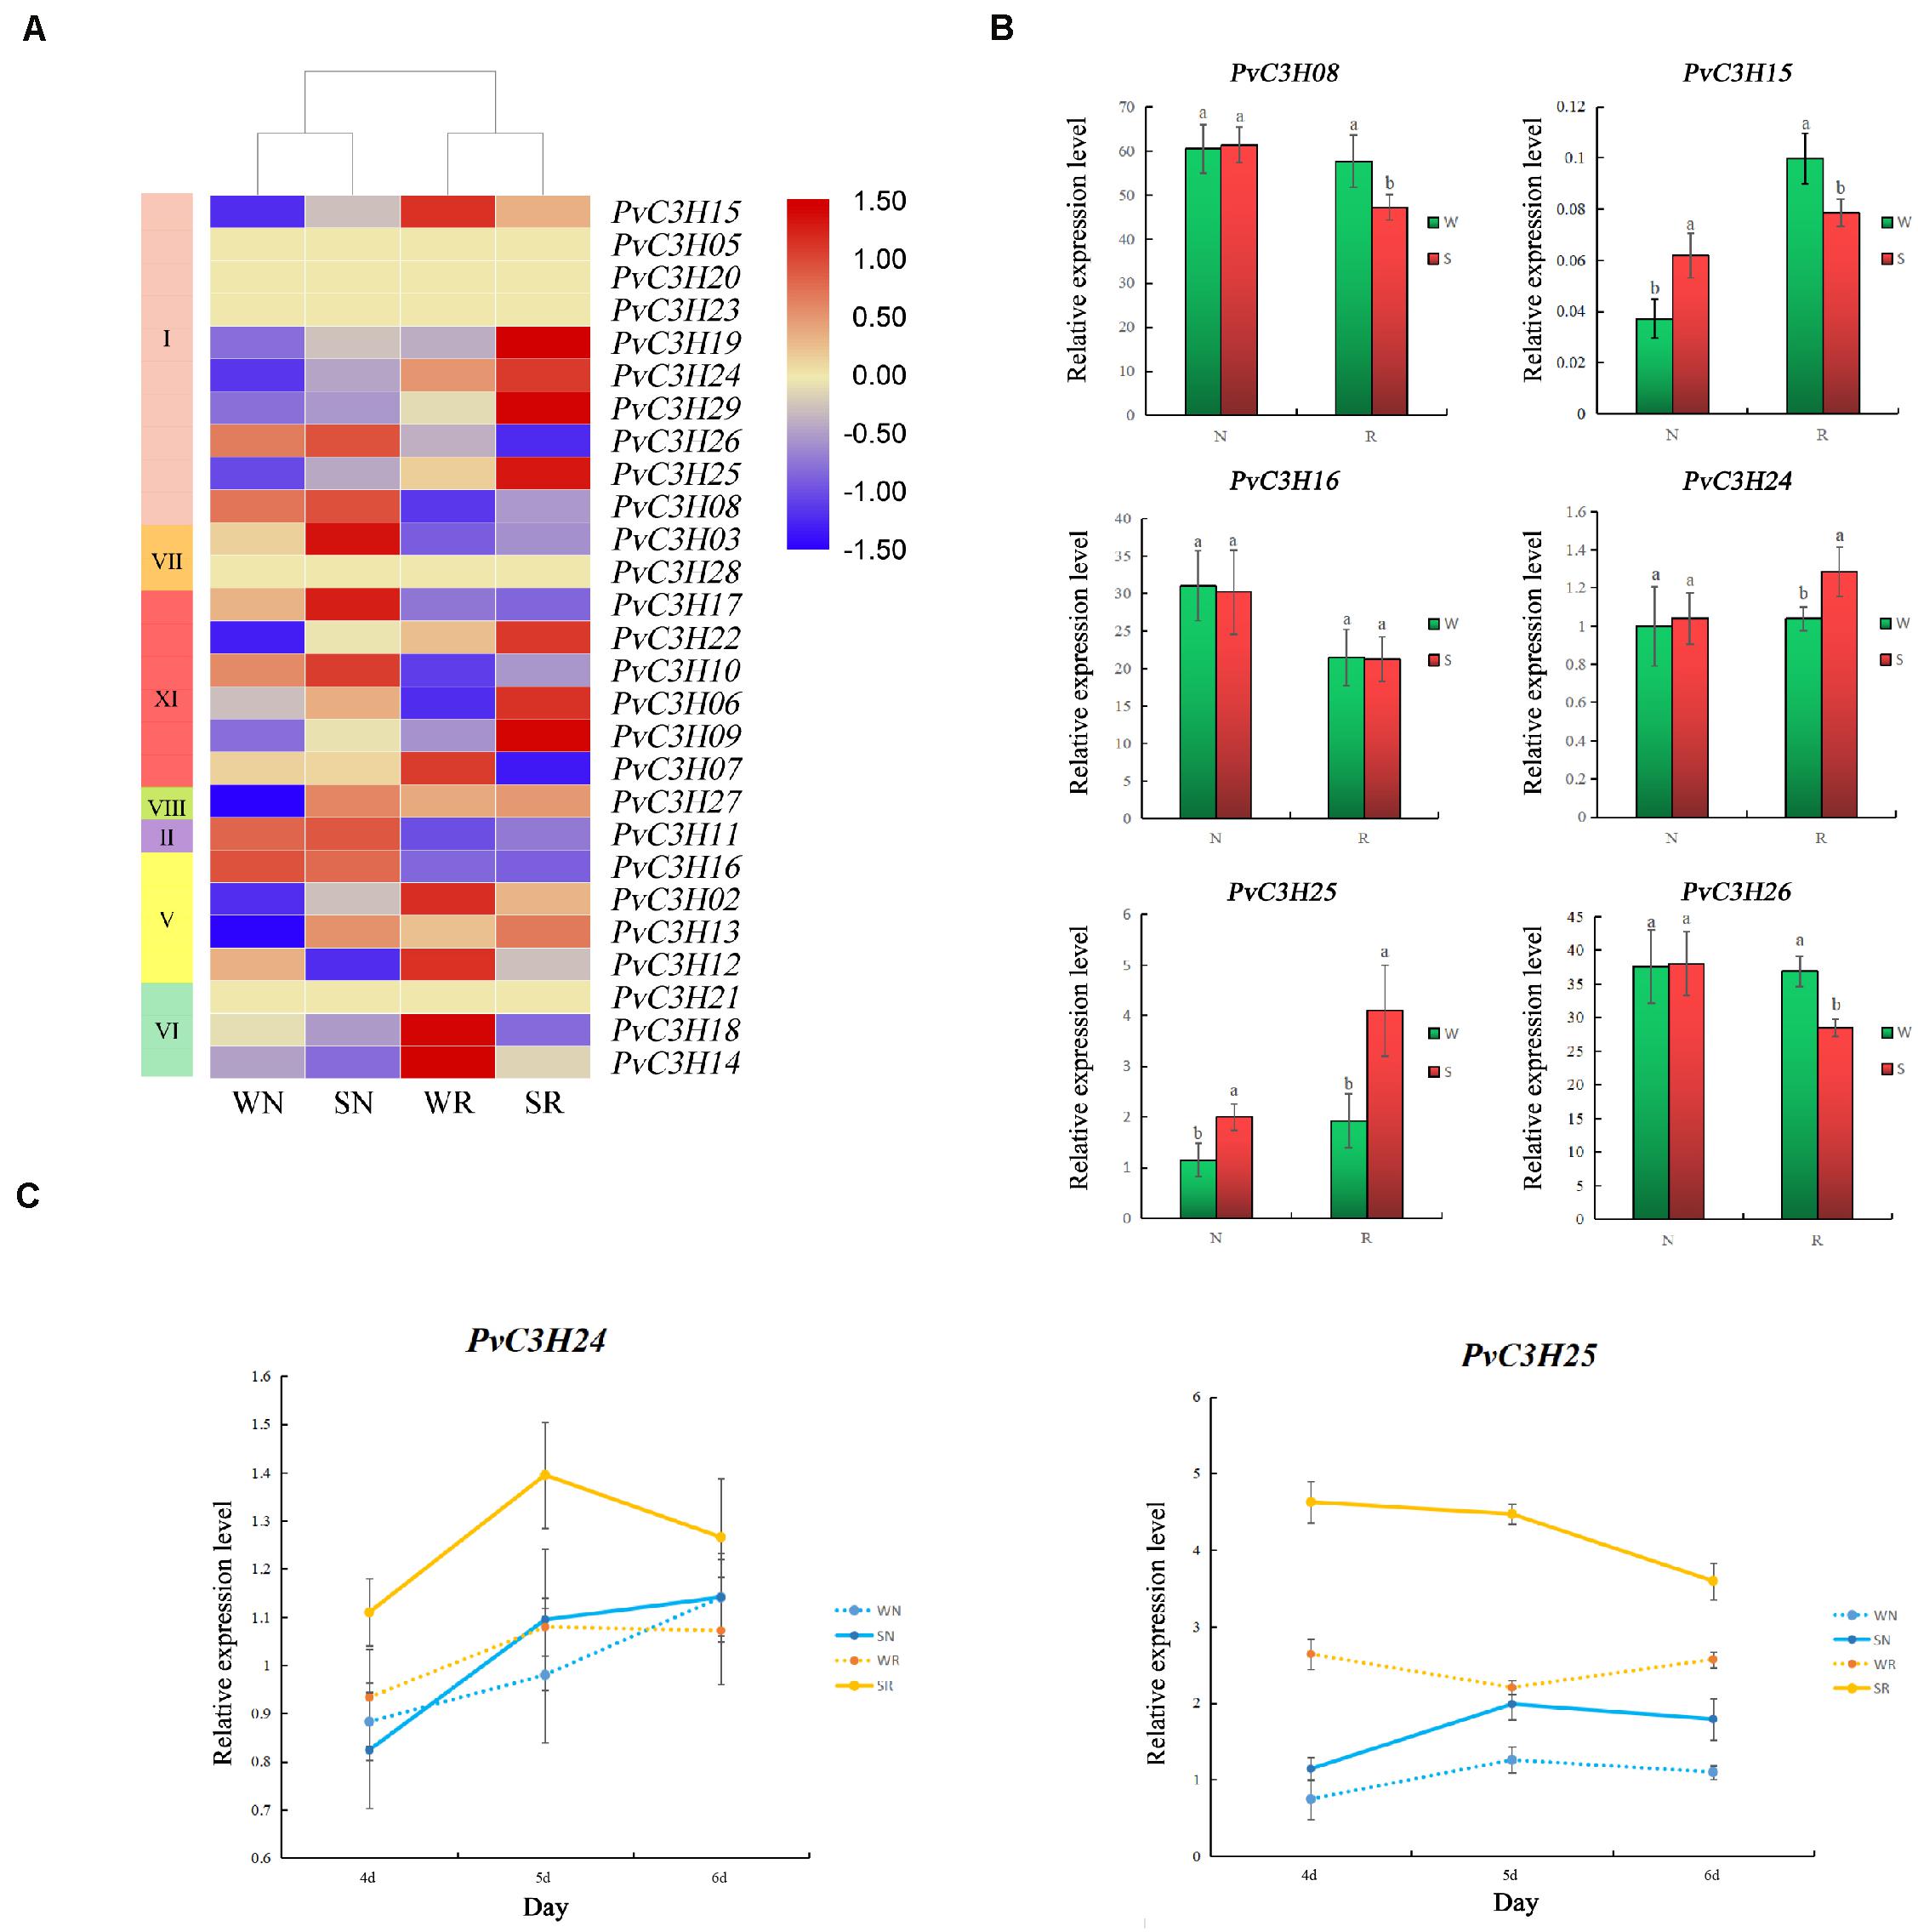
Figure 8. Transcriptome analysis of salt-tolerant (R) and salt-sensitive (N) common bean varieties under salt-stress conditions. The x-axis indicates sampling time, and the y-axis indicates relative gene expression. (A) A heat map with clustering was constructed using PvC3Hs in the different varieties under salt-stress conditions. The color scale varies from blue to red, representing relatively low to high expression, respectively. (B) Six PvC3Hs were selected and their expression assessed by RT-qPCR to determine the reliability of the transcriptome, the y-axis indicates relative gene expression. Lower case letter(s) above bars indicate significant differences (α = 0.05, LSD) between the treatments. (C) The expression changes of the two PvC3Hs on the fourth, fifth, and sixth day. The yellow line represents R, and the blue line represents N; The x-axis indicates sampling time, and the y-axis indicates relative gene expression.
The GO enrichment analysis of PvC3Hs showed that they were enriched in many terms, such as ion binding, cation binding, metal ion binding, amide transport, sodium channel regulator, inhibitor activities, binding, and ion channel inhibitor activity (Figure 9A). Two GO categories were enriched after screened: ion binding and channel activity. Three genes enriched in the two terms were randomly selected for RT-qPCR verification. For the three PvC3Hs enriched in channel activity (PvC3H01, PvC3H17, and PvC3H22; Figure 9B), and the three genes enriched in ion binding (PvC3H07, PvC3H18, and PvC3H19; Figure 9C), the differences in R between the W and S treatments were greater those in N. Thus, these genes may affect the expression of salt-tolerance traits during the sprout stage.
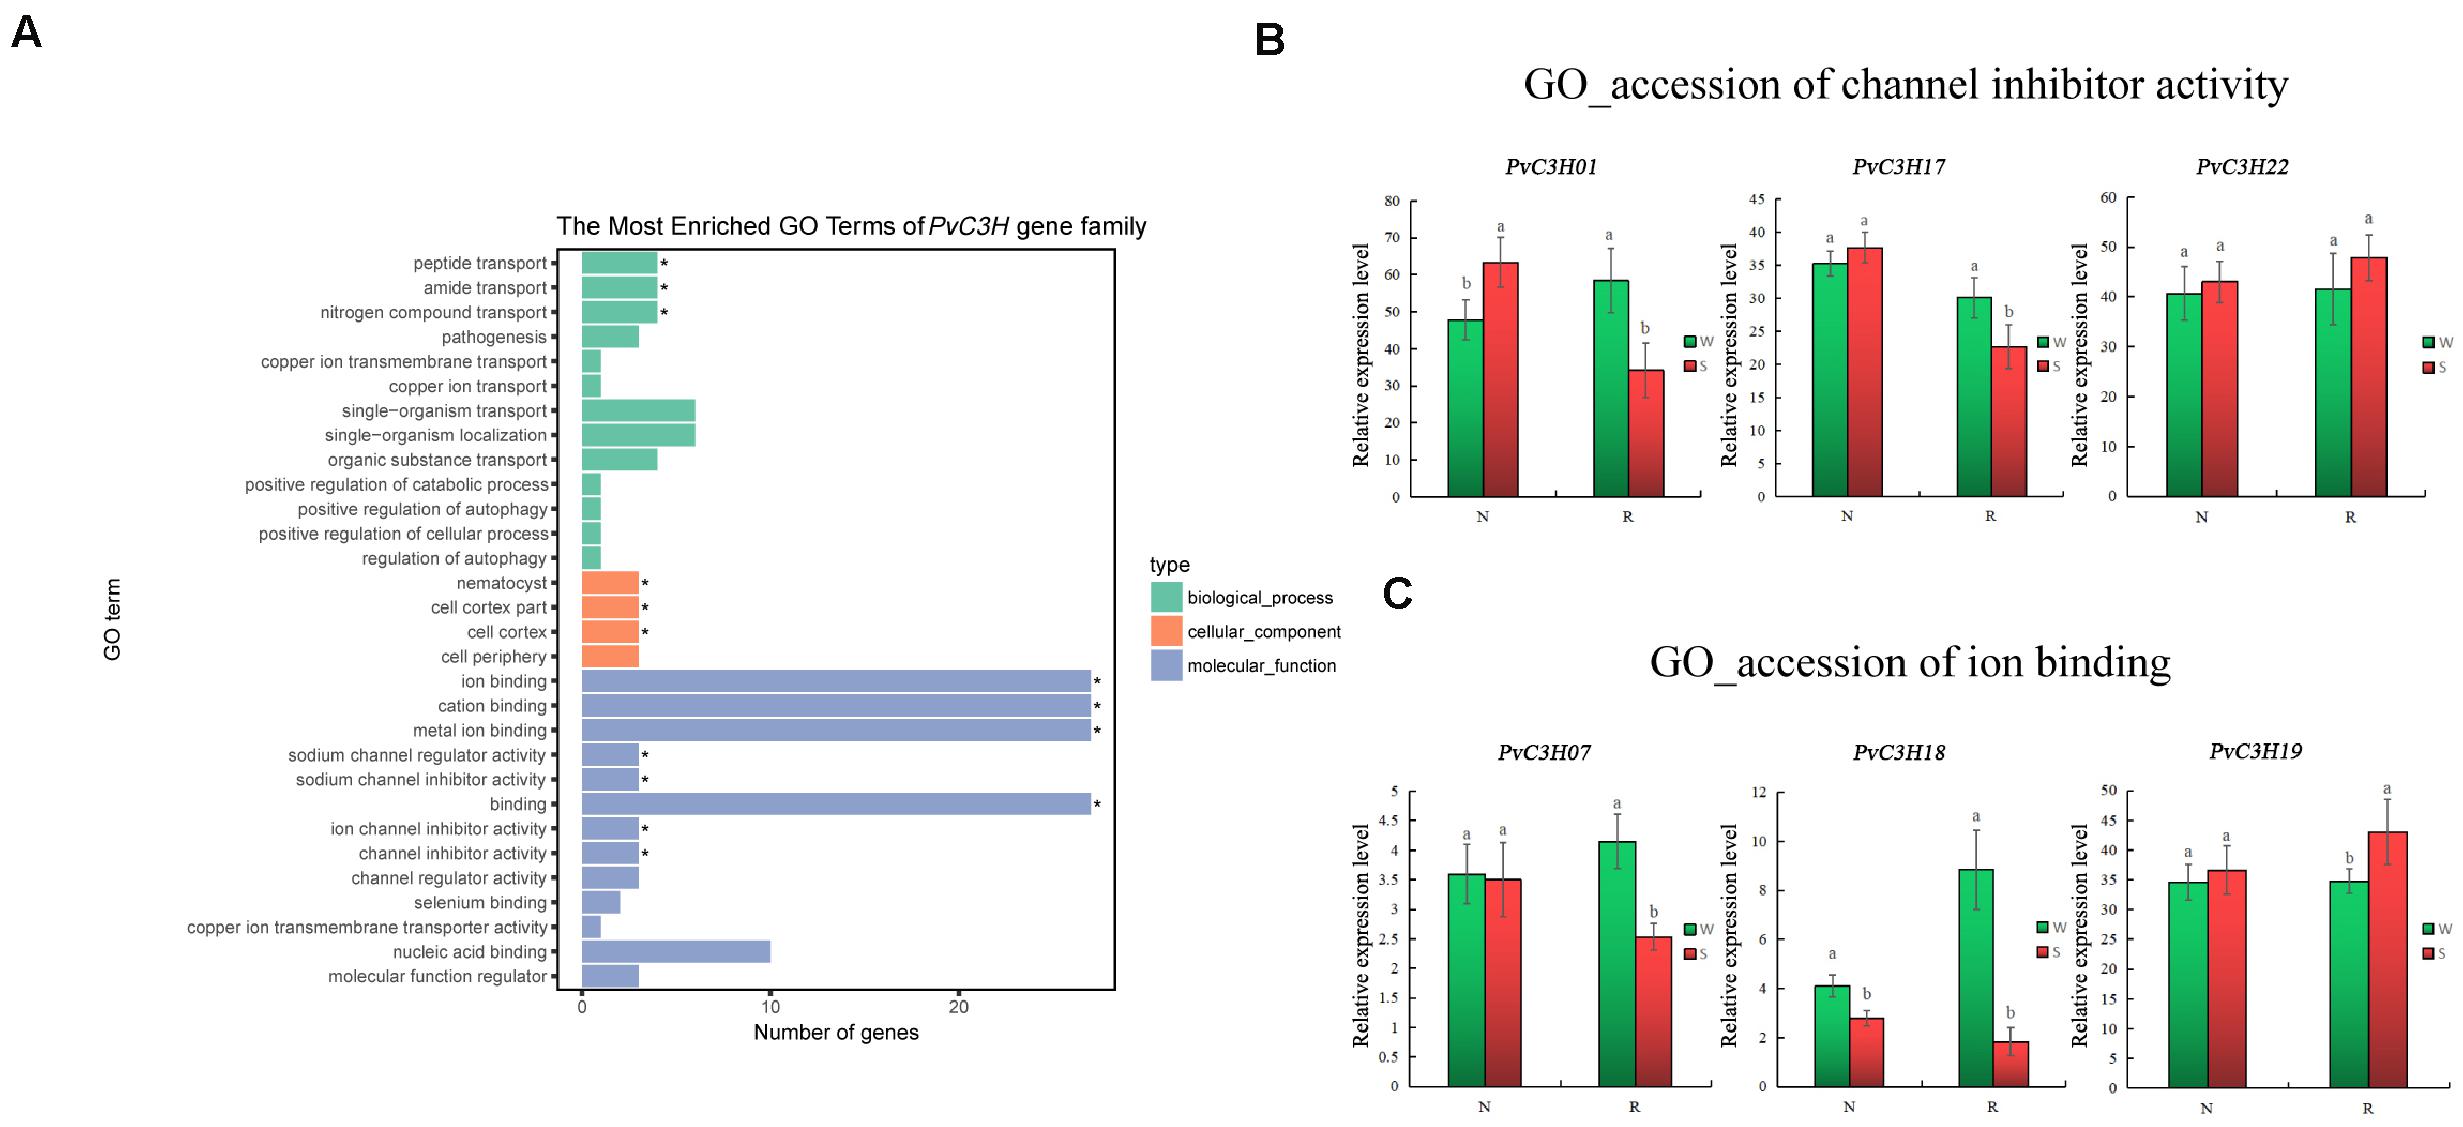
Figure 9. GO verified results of PvC3H enrichment. (A) Enrichment of GO terms in the transcriptome. The P-values for binding and channel activity are less than 0.05, reaching significance. (B,C) RT-qPCR analysis of PvC3H genes enriched in binding and channel activity. Letters above bars indicate significant differences (α = 0.05, LSD) between the treatments. The x-axis indicates sampling time, and the y-axis indicates relative gene expression.
The KEGG analysis of PvC3Hs showed that they were enriched in the “Spliceosome” (pvu03040) pathway in common bean, having a corrected P-value of 7.03e–8. The PvC3Hs belonged to the U2-related module in the spliceosome (Figure 10). The RT-qPCR analysis of radicles from the two varieties showed that, compared with the S treatment, the changes in some genes’ expression levels (PvC3H02, PvC3H04, PvC3H12, and PvC3H13) in R were greater than in N, which indicated that the change in the abscisic acid content affected the expression levels of the PvC3H genes under salt-stress conditions, which may further affect the salt tolerance of the common bean during the sprout stage.
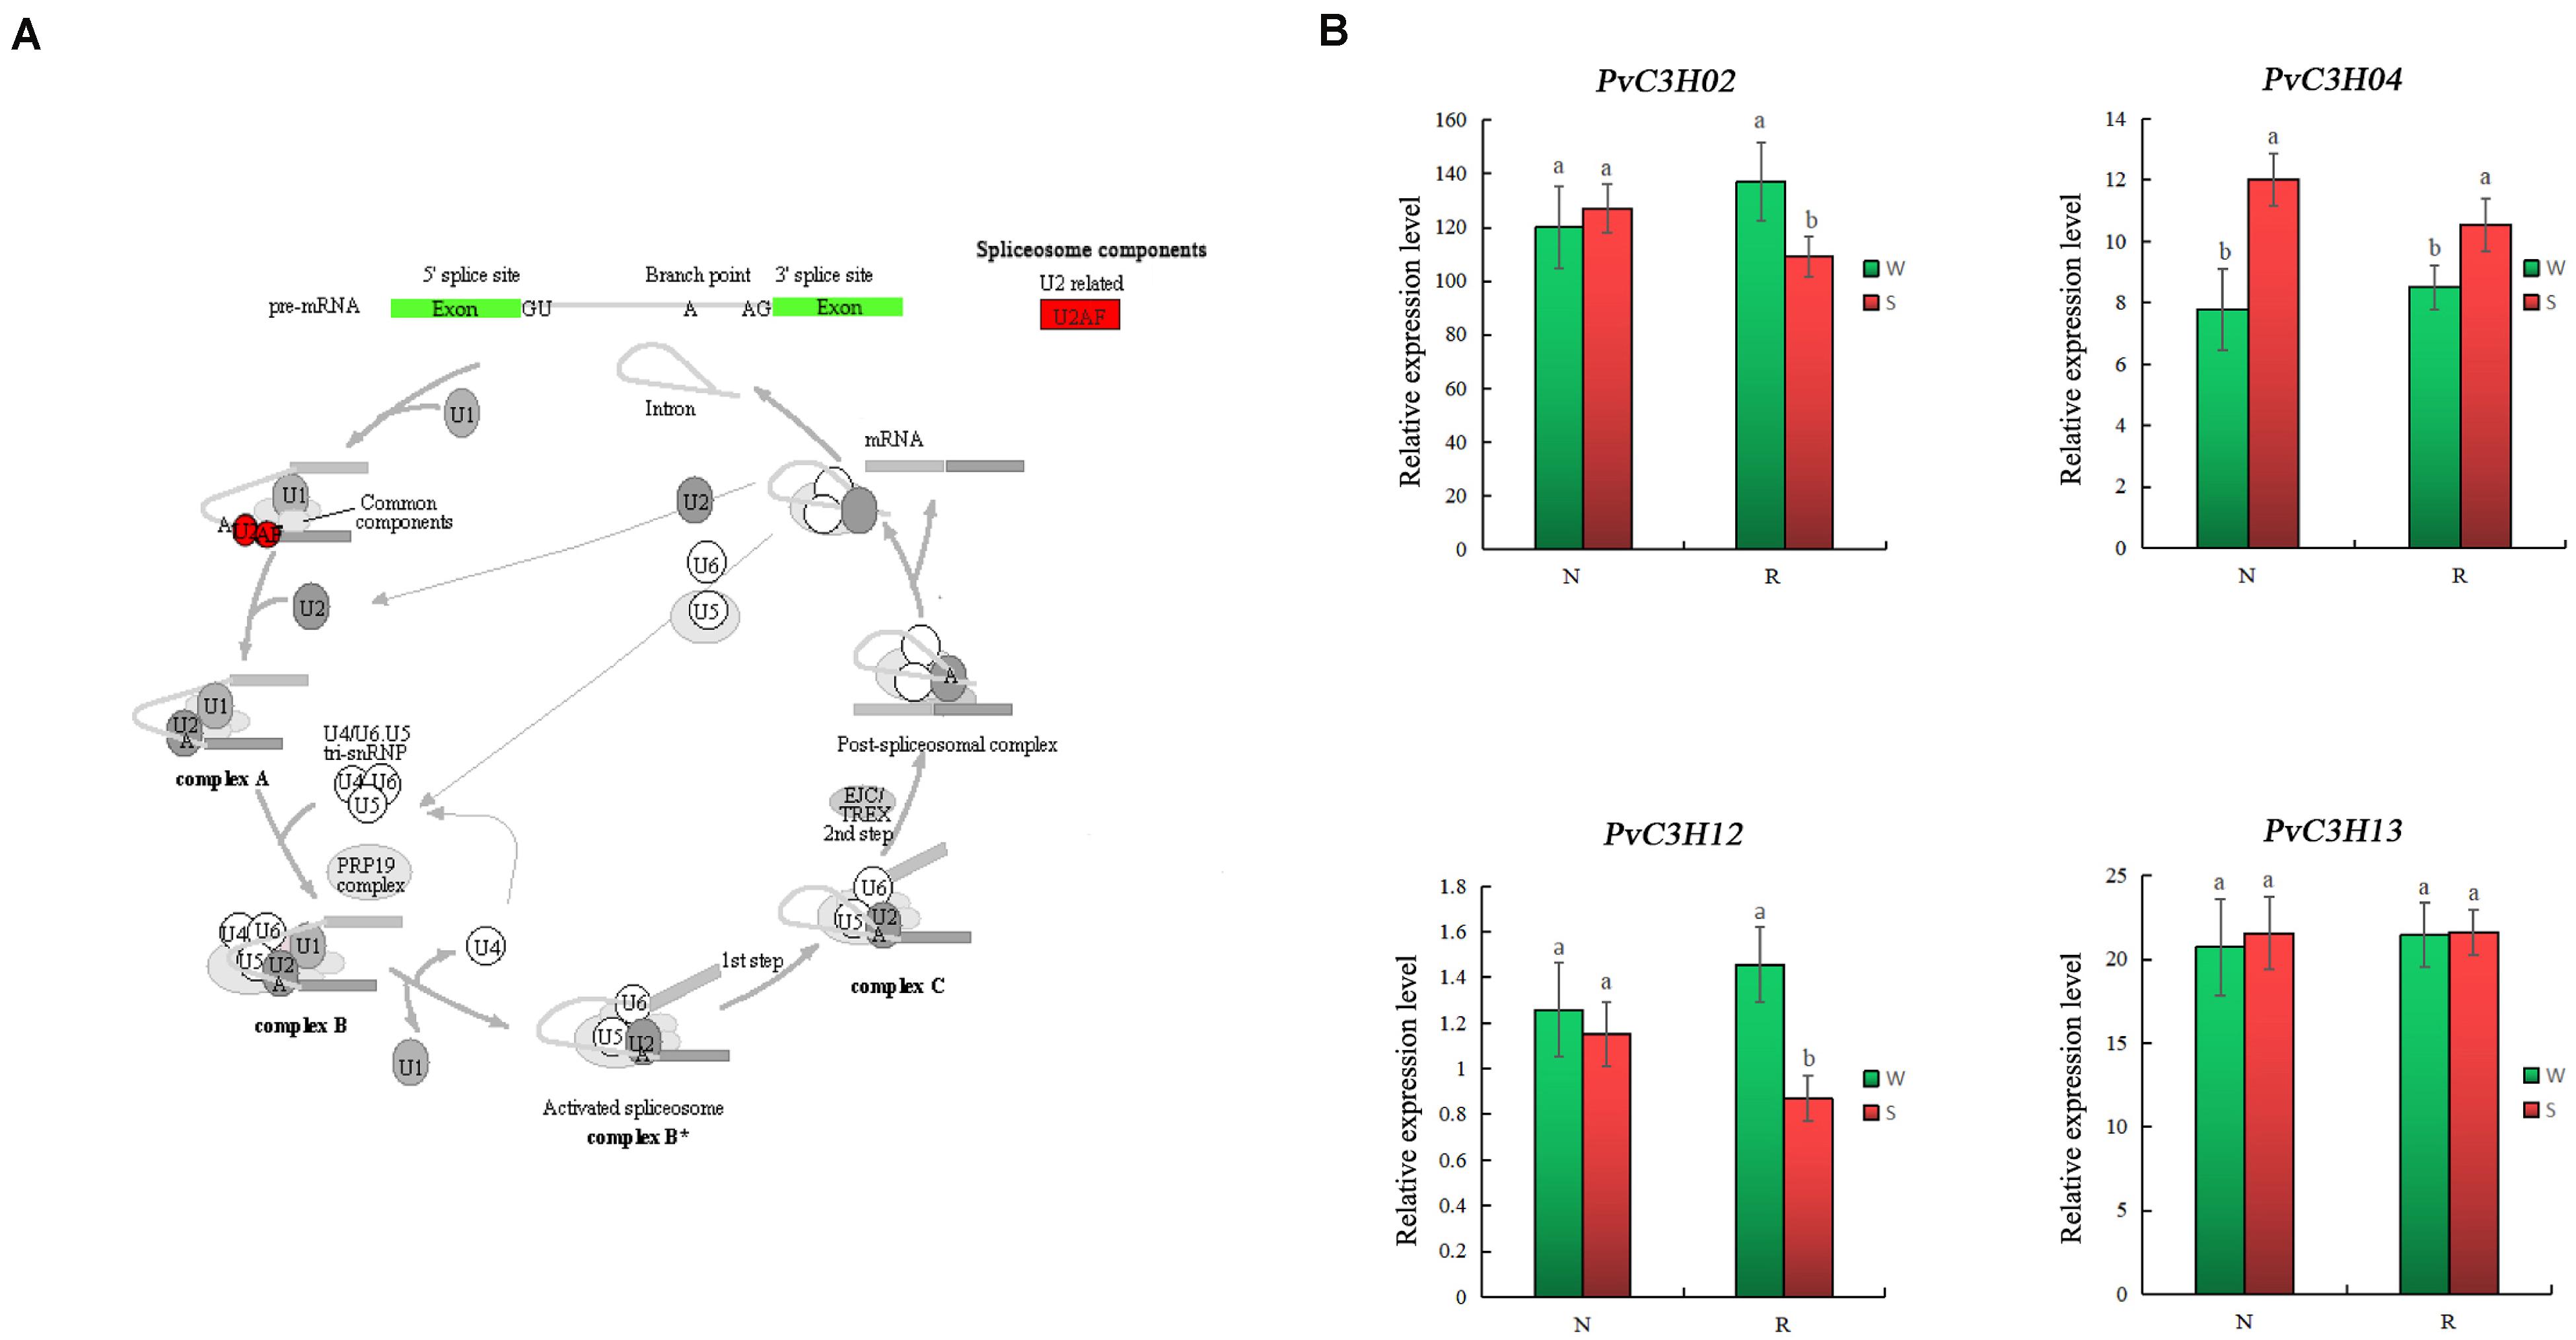
Figure 10. KEGG verified results of PvC3H enrichment. (A) Schematic diagram of the PvC3Hs enriched in the “Spliceosome” (pvu03040) pathway. (B) RT-qPCR analysis PvC3H expression in the “Spliceosome” (pvu03040) pathway. Lower case letter(s) above bars indicate significant differences (α = 0.05, LSD) between the treatments. The x-axis indicates sampling time, and the y-axis indicates relative gene expression.
Here, 29 PvC3Hs were recognized from the genome of P. vulgaris L, suggesting that the C3H gene family has a wider distribution in common bean than in A. thaliana or rice. The PvC3H family was separated into seven subfamilies on the basis of the phylogenetic analysis. A similar method was used to identify subfamilies in maize (Peng et al., 2012), citrus (Liu et al., 2014), and Brassica rapa (Pi et al., 2018). Furthermore, the phylogenetic relationships of the PvC3Hs were confirmed using their conserved motifs and gene structures. A gene structure analysis revealed that the PvC3Hs contain from 0 to 11 introns. Additionally, every subfamily exhibited a similar exon–intron organization and contained cis-regulatory elements. These results may help reveal the functions of various gene families. According to the conserved motif analysis, the C3H domain (motif 1) was common to all the PvC3H proteins. Each subfamily harbored similar motifs, and the motif sequences in each subfamily were relatively similar, which indicated that PvC3H subfamily members may be conserved. Generally, the same subfamily shared an analogous exon–intron organization, as well as motif composition, and this has also been observed in rapeseed, poplar (Chai et al., 2012), rice (Wang et al., 2008), chickpea (Pradhan et al., 2017), Solanum lycopersicum (Xu, 2014), and Medicago truncatula (Zhang et al., 2013).
A comparative genomic analysis was performed to assess the structure of the genome at the syntenic block level, which reveals features that are conserved in multiple genomes (Ghiurcuta and Moret, 2014). This enables functional information to be transferred from a known taxon to a less-studied taxon. In this study, collinearity revealed that some PvC3H genes may have been generated through gene duplication. Moreover, segmental duplication events were vital in PvC3H evolution. The Arabidopsis homologous gene HSFC1 responds to stress and also has a binding effect (Gaudet et al., 2011). AtC3H14, which contains a C3H zinc-finger protein, also binds to its target mRNAs during A. thaliana growth (Kim et al., 2014). The PvC3H homologous genes in Arabidopsis produce JA to induce the biosynthesis of the metabolite Nδ-acety lornithine, which enhances the defense functions (Adewale et al., 2011).
Therefore, the collinear PvC3Hs of common bean revealed in this study may also be involved in plant resistance. Thus comparative genomic analyses between common bean and other species form an important basis for future studies on the roles of PvC3H genes.
Salt, which acts as important abiotic stress in agricultural production (Liang et al., 2018), is different from other biological stresses. Salt stress may exist from the plant’s germination stage, through its growth, and into maturity. The sprout stage is the initial period of crop growth, and stress during this period negatively affects the entire growth period. Additionally, seed germination is a critical stage for crop establishment (Hubbard et al., 2012), and it is the least tolerant to abiotic stress (Patade et al., 2011). Various abiotic stresses, especially salt stress, reduce the germination rate and delay the germination of high-quality but salt-sensitive seeds (Khan and Gul, 2006; Ansari and Sharif-Zadeh, 2012; Fazlali et al., 2013; Thiam et al., 2013). Therefore, it is very important to analyze the expression levels of PvC3Hs during the sprout stage.
In this study, through the germination of R and N during W and S treatments, day five was selected as the sampling time. The tissue-specific expression results showed that the hypocotyl and radicle may be used as the sampling materials when studying PvC3Hs, and hypocotyl growth has also been reported to be affected by salt stress (Rossi et al., 2016).
Recent evidence showed that C3H genes play crucial roles in the adaptation to various abiotic stresses, especially salt stress, by plants, such as A. thaliana (Seok et al., 2018), rice (Jan et al., 2013), tobacco (Guo et al., 2009), and sweet potato (Zhang et al., 2019), but there is limited information on common bean. Transcriptome data from R and N indicated that the expression levels of PvC3H genes may cause salt tolerance in common bean sprouts. PvC3Hs were enriched in the binding and channel activity GO terms and in the “Spliceosome” pathway. A RT-qPCR analysis of the PvC3Hs enriched in GO and KEGG analyses was conducted. The differences in the expression levels of PvC3Hs in R were more significant than those in N, suggesting that PvC3Hs participate in the enrichment of the pathway and traits. The pathways for inhibitor activities, binding, and ion channel inhibitor, which were enriched in the GO analysis have been reported in previous studies on salt tolerance in plants, such as A. thaliana (Li et al., 2014; Kim et al., 2019; Wang et al., 2019), rice (Mansuri et al., 2019), cotton (Mu et al., 2019), poplar (Gaudet et al., 2011), and alfalfa (Lai et al., 2014). The spliceosome pathway has anti-stress effects in A. thaliana (Feng et al., 2015; Narasimha et al., 2018), O. sativa (Ashwini et al., 2018), and Cannabis sativa (Liu et al., 2016). Additionally, C3H has been reported to enhance stress resistance through spliceosome drivenRNA splicing (Bogamuwa and Jang, 2014). Thus, the enrichment results of these analyses provide new ideas and valuable information for studying the relationship between PvC3Hs and salt stress.
Despite the importance of C3H genes in responses to salt stress, the precise roles of C3H gene family members in common bean have not been elucidated. Here, a reference genome of common been was used to comprehensively analyze 29 PvC3Hs, including the identification of sequences, construction of phylogenetic trees, characterization of motif composition, and analyses of cis-regulatory elements, gene structure, collinearity, and expression levels in different tissues during the sprout stage. RNA-seq and RT-qPCR analyses confirmed that the expression levels of the PvC3Hs underwent greater changes in R than in N. Through a GO analysis and KEGG enrichment, the PvC3Hs were found to be enriched in ion binding, channel regulator activity, and the spliceosome pathway. These findings will aid further studies on the C3H and other gene families in common bean.
The datasets presented in this study can be found in online repositories. The names of the repository/repositories and accession number(s) can be found in the article/Supplementary Material.
QZ and J-DD conceived the study and designed and managed the experiments. W-JZ, WL, and ZY provided the plant lines. SZ, HZ, LZ, YW, and QZ performed the trials and collected the data. ZY and QZ completed the statistical analysis of the phenotypic data and wrote the manuscript. All authors contributed to writing the manuscript.
This study was supported by the Research Project of Heilongjiang Bayi Agricultural University (XDB2011-02).
The authors declare that the research was conducted in the absence of any commercial or financial relationships that could be construed as a potential conflict of interest.
The Supplementary Material for this article can be found online at: https://www.frontiersin.org/articles/10.3389/fgene.2020.564607/full#supplementary-material
Adewale, M. A., Clare, L. C., Martin, D. V., Jae, H. K., Vijay, J., Baohua, L., et al. (2011). Biosynthesis and defensive function of Nδ-acetylornithine, a jasmonate-induced Arabidopsis metabolite. Plant Cell. 23, 3303–3318. doi: 10.1105/tpc.111.088989
Ansari, O., and Sharif-Zadeh, F. (2012). Osmo and hydro priming improvement germination characteristics and enzyme activity of Mountain Rye (Secale montanum) seeds under drought stress. J. Stress Physiol. Biochem. 8, 253–261.
Ashwini, N., Sajeevan, R. S., Udayakumar, M., and Nataraja, K. N. (2018). Identification of splice variant of OsGBF1 in Oryza sativa ssp. indica genotypes under salinity stress. 3 Biotech 8:345. doi: 10.1007/s13205-018-1370-4
Bailey, T. L., Boden, M., Buske, F. A., Frith, M., Grant, C. E., Clementi, L., et al. (2009). MEME SUITE: tools for motif discovery and searching. Nucleic Acids Res. 37, W202–W208. doi: 10.1093/nar/gkp335
Birney, E., Clamp, M., and Durbin, R. (2004). Genewise and genomewise. Genome Res. 14, 988–995. doi: 10.1101/gr.1865504
Bogamuwa, S. P., and Jang, J. C. (2014). Tandem CCCH zinc finger proteins in plant growth, development and stress response. Plant Cell Physiol. 55, 1367–1375. doi: 10.1093/pcp/pcu074
Borges, A., Tsai, S. M., and Caldas, D. G. (2012). Validation of reference genes for RT-qPCR normalization in common bean during biotic and abiotic stresses. Plant Cell. 31, 827–838. doi: 10.1007/s00299-011-1204-x
Broughton, W. J., Hernandez, G., Blair, M. W., Beebe, S., and Vanderleyden, J. (2003). Beans (Phaseolus spp.): model food legumes. Plant Soil 252:74. doi: 10.1023/a:1024146710611
Chai, G., Hu, R., Zhang, D., Qi, G., Zuo, R., Cao, Y., et al. (2012). Comprehensive analysis of CCCH zinc finger family in poplar (Populus trichocarpa). BMC Genomics 13:253. doi: 10.1186/1471-2164-13-253
Chai, G., Kong, Y., Zhu, M., Yu, L., Qi, G., Tang, X., et al. (2015). Arabidopsis C3H14 and C3H15 have overlapping roles in the regulation of secondary wall thickening and anther development. J. Exp. Bot. 66, 2595–2609. doi: 10.1093/jxb/erv060
Chen, C., Chen, H., Zhang, Y., Thomas, H. R., Frank, M. H., He, Y., et al. (2020). TBtools - an integrative toolkit developed for interactive analyses of big biological data [published online ahead of print, 2020 Jun 22]. Mol. Plant. 13, 1194–1202. doi: 10.1016/j.molp.2020.06.009
Conesa, A., Götz, S., García-Gómez, J. M., Terol, J., Talón, M., and Robles, M. (2005). Blast2GO: a universal tool for annotation, visualization and analysis in functional genomics research. Bioinformatics 21, 3674–3676. doi: 10.1093/bioinformatics/bti610
Deng, H. Q., Liu, H. B., Li, X. H., Xiao, J. L., and Wang, S. P. (2012). A CCCH-type zinc finger nucleic acid-binding protein quantitatively confers resistance against rice bacterial blight disease. Plant Physiol. 158, 876–889. doi: 10.1104/pp.111.191379
Fazlali, R., Asli, D. E., and Moradi, P. (2013). The effect of seed priming by ascorbic acid on bioactive compounds of naked seed pumpkin (Cucurbita pepo var. styriaca) under salinity stress. Int. J. Farm. Alli. Sci. 2, 587–590.
Feng, J., Li, J., Gao, Z., Lu, Y., Yu, J., Zheng, Q., et al. (2015). SKIP confers osmotic tolerance during salt stress by controlling alternative gene splicing in Arabidopsis. Mol. Plant. 8, 1038–1052. doi: 10.1016/j.molp.2015.01.011
Finn, R. D., Attwood, T. K., Babbitt, P. C., Bateman, A., Bork, P., Bridge, A. J., et al. (2017). InterPro in 2017-beyond protein family and domain annotations. Nucleic Acids Res. 45, D190–D199. doi: 10.1093/nar/gkw1107
Finn, R. D., Coggill, P., Eberhardt, R. Y., Eddy, S. R., Mistry, J., Mitchell, A. L., et al. (2016). The Pfam protein families database: towards a more sustainable future. Nucleic Acids Res. 44, D279–D285. doi: 10.1093/nar/gkv1344
Gao, G., Guo, X., and Goff, S. P. (2002). Inhibition of retroviral RNA production by ZAP, a CCCH-type zinc finger protein. Science 297, 1703–1706. doi: 10.1126/science.1074276
Gaudet, P., Livstone, M. S., Lewis, S. E., and Thomas, P. D. (2011). Phylogenetic-based propagation of functional annotations within the gene ontology consortium. Brief Bioinform. 12, 449–462. doi: 10.1093/bib/bbr042
Ghiurcuta, C. G., and Moret, B. M. (2014). Evaluating synteny for improved comparative studies. Bioinformatics 30, i9–i18. doi: 10.1093/bioinformatics/btu259
Guo, A. Y., Zhu, Q. H., Chen, X., and Luo, J. C. (2007). GSDS: a gene structure display server. Yi Chuan. 29, 1023–1026. doi: 10.1360/yc-007-1023
Guo, Y.-H., Yu, Y.-P., Wang, D., Wu, C.-A., Yang, G.-D., Huang, J.-G., et al. (2009). GhZFP1, a novel CCCH-type zinc finger protein from cotton, enhances salt stress tolerance and fungal disease resistance in transgenic tobacco by interacting With GZIRD21A and GZIPR5. New Phytol. 183, 62–75. doi: 10.1111/j.1469-8137.2009.02838.x
Hall, T. M. (2005). Multiple models of RNA recognition by zinc finger proteins. Curr. Opin. Struct. Biol. 15, 367–373. doi: 10.1016/j.sbi.2005.04.004
Han, G. L., Wang, M. J., Yuan, F., Sui, N., Song, J., and Wang, B. S. (2014). The CCCH zinc finger protein gene AtZFP1 improves salt resistance in Arabidopsis thaliana. Plant Mol. Biol. 86, 237–253. doi: 10.1007/s11103-014-0226-5
Han, Z., Liu, Y., Deng, X., Liu, D., Liu, Y., Hu, Y., et al. (2019). Genome-wide identification and expression analysis of expansin gene family in common wheat (Triticum aestivum L.). BMC Genom. 20:101. doi: 10.1186/s12864-019-5455-1
Hubbard, M., Germida, J., and Vujanovic, V. (2012). Fungal endophytes improve wheat seed germination under heat and drought stress. Botany 90, 137–149. doi: 10.1139/b11-091
Jan, A., Maruyama, K., Todaka, D., Kidokoro, S., Abo, M., Yoshimura, E., et al. (2013). OsTZF1, a CCCH-tandem zinc finger protein, confers delayed senescence and stress tolerance in rice by regulating stress-related genes. Plant Physiol. 161, 1202–1216. doi: 10.1104/pp.112.205385
Khan, M., and Gul, B. (2006). “Halophyte seed germination,” in Ecophysiology of High Salinity Tolerant Plants. Tasks for Vegetation Science, vol 40,, eds M. Khan and D. Weber (Dordrecht: Springer).
Kim, W. C., Kim, J. Y., Ko, J. H., Kang, H., Kim, J., and Han, K. H. (2014). AtC3H14, a plant-specific tandem CCCH zinc-finger protein, binds to its target mRNAs in a sequence-specific manner and affects cell elongation in Arabidopsis thaliana. Plant J. 80, 772–784. doi: 10.1111/tpj.12667
Kim, Y.-O., Kang, H., and Ahn, S.-J. (2019). Overexpression of phytochelatin synthase AtPCS2 enhances salt tolerance in Arabidopsis thaliana. J. Plant Physiol. 240:153011. doi: 10.1016/j.jplph.2019.153011
Kong, Z., Li, M., Yang, W., Xu, W., and Xue, B. (2006). A novel nuclear-localized CCCH-type zinc finger protein, OsDOS, is involved in delaying leaf senescence in rice. Plant Physiol. 141, 1376–1388. doi: 10.1104/pp.106.082941
Krzywinski, M., Schein, J., Birol, I., Connors, J., Gascoyne, R., and Horsman, D. (2009). Circos: an information aesthetic for comparative genomics. Genome Res. 19, 1639–1645. doi: 10.1101/gr.092759.109
Lai, D., Mao, Y., Zhou, H., Li, F., and Xie, Y. (2014). Endogenous hydrogen sulfide enhances salt tolerance by coupling the reestablishment of redox homeostasis and preventing salt-induced k+ loss in seedlings of medicago sativa. Plant Sci. 225, 117–129. doi: 10.1016/j.plantsci.2014.06.006
Letunic, I., Doerks, T., and Bork, P. (2015). Smart: recent updates, new developments and status in 2015. Nucleic Acids Res. 43, D257–D260. doi: 10.1093/nar/gku949
Li, J., Jia, D. X., and Chen, J. X. (2001). HUA1, a regulator of stamen and carpel identities in Arabidopsis, codes for a nuclear RNA binding protein. Plant Cell. 13, 2269–2281. doi: 10.2307/3871507
Li, J., Jia, H., Wang, J., Cao, Q., and Wen, Z. (2014). Hydrogen sulfide is involved in maintaining ion homeostasis via regulating plasma membrane Na+/H+ antiporter system in the hydrogen peroxide-dependent manner in salt-stress Arabidopsis thaliana root. Protoplasma 251, 899–912. doi: 10.1007/s00709-013-0592-x
Li, M., Zhang, K., Sun, Y., Cui, H., Cao, S., Yan, L., et al. (2018). Growth, physiology, and transcriptional analysis of Two contrasting Carex rigescens genotypes under Salt stress reveals salt-tolerance mechanisms. J. Plant Physiol. 229, 77–88. doi: 10.1016/j.jplph.2018.07.005
Li, Z. (1998). PEI1, an embryo-specific zinc finger protein gene required for heart-stage embryo formation in Arabidopsis. Plant Cell. 10, 383–398. doi: 10.1105/tpc.10.3.383
Liang, W., Ma, X., Wan, P., and Liu, L. (2018). Plant salt-tolerance mechanism: a review. Biochem. Biophys. Res. Commun. 495, 286–291. doi: 10.1016/j.bbrc.2017.11.043
Lin, P. C., Pomeranz, M. C., Jikumaru, Y., Kang, S. G., Hah, C., Fujioka, S., et al. (2014). The Arabidopsis tandem zinc finger protein AtTZF1 affects ABA and GA ediated growth, stress and gene expression responses. Plant J. 65, 253–268. doi: 10.1111/j.1365-313X.2010.04419.x
Liu, J., Qiao, Q., Cheng, X., Du, G., Deng, G., Zhao, M., et al. (2016). Transcriptome differences between fiber-type and seed-type Cannabis sativa variety exposed to salinity. Physiol. Mol. Biol. Plants 22, 429–443. doi: 10.1007/s12298-016-0381-z
Liu, S., Rehman, M., Khan, G., Li, Y., Zhang, J., and Hu, C. (2014). Comprehensive analysis of CCCH-type zinc finger gene family in citrus (Clementine mandarin) by genome-wide characterization. Mol. Genet. Genomics 289, 855–872. doi: 10.1007/s00438-014-0858-9
Livak, K. J., and Schmittgen, T. D. (2001). Analysis of relative gene expression data using real-time quantitative PCR and the 2-ΔΔCT. Method 25, 402–408. doi: 10.1006/meth.2001.1262
Lu, P. L., Chai, M. F., Yang, J. E., Ning, G., Wang, G. L., and Ma, H. (2014). The Arabidopsis callose defective microsfore1 gene is required for male fertility through regulating callose metabolism during microsporogenesis. Plant Physiol. 164, 1893–1904. doi: 10.1104/pp.113.233387
Mansuri, R. M., Shobbar, Z. S., Jelodar, N. B., Ghaffari, M. R., and Asari, S. (2019). Dissecting molecular mechanisms underlying salt tolerance in rice: a comparative transcriptional profiling of the contrasting genotypes. Rice 12:13. doi: 10.1186/s12284-019-0273-2
Mu, C., Zhou, L., Shan, L., Li, F., and Li, Z. (2019). Phosphatase GhDsPTP3a interacts with annexin protein GhANN8b to reversely regulate salt tolerance in cotton (Gossypium Spp.). New Phytol. 223, 1856–1872. doi: 10.1111/nph.15850
Narasimha, A., Sivarajan, S. R., Makarala, U., and Nataraja, K. N. (2018). Identification of splice variant of OsGBF1 in Oryza sativa ssp. indica genotypes under salinity stress. Biotech 8:345. doi: 10.1007/s13205-018-1370-4
Patade, V. Y., Maya, K., and Zakwan, A. (2011). A. Seed priming mediated germination improvement and tolerance to subsequent exposure to cold and salt stress in capsicum. Res. J. Seed Sci. 4, 125–136. doi: 10.3923/rjss.2011.125.136
Peng, X., Zhao, Y., Cao, J., Zhang, W., Jiang, H., Li, X., et al. (2012). CCCH-type zinc finger family in maize: genome-wide identification, classification and expression profiling under abscisic acid and drought treatments. PLoS One 7:e40120. doi: 10.1371/journal.pone.0040120
Pi, B., He, X., Ruan, Y., Jang, J. C., and Huang, Y. (2018). Genome-wide analysis and stress-responsive expression of CCCH zinc finger family genes in Brassica rapa. BMC Plant Biol. 18:373. doi: 10.1186/s12870-018-1608-7
Pradhan, S., Kant, C., Verma, S., and Bhatia, S. (2017). Genome-wide analysis of the CCCH zinc finger family identifies tissue specific and stress responsive candidates in chickpea (Cicer arietinum L.). PLoS One 12:e0180469. doi: 10.1371/journal.pone.0180469
Rosenzweig, C., and Liverman, D. (1992). Global Climate Change: Implications, Challenges and Mitigation Measures. Philadelphia, PA: Pennsylvania Academy of Sciences, 342–361.
Rossi, L., Borghi, M., Francini, A., Lin, X., Xie, D. Y., and Sebastiani, L. (2016). Salt stress induces differential regulation of the phenylpropanoid pathway in Olea europaea cultivars Frantoio (salt-tolerant) andLeccino (salt-sensitive). J. Plant Physiol. 204, 8–15. doi: 10.1016/j.jplph.2016.07.014
Seok, H. Y., Nguyen, L. V., Park, H. Y., Tarte, V. N., Ha, J., Lee, S. Y., et al. (2018). Arabidopsis non-TZF gene AtC3H17 functions as a positive regulator in salt stress response. Biochem. Biophys. Res. Commun. 15, 954–959. doi: 10.1016/j.bbrc.2018.03.088
Sun, J., Hongling, J., Yingxiu, X., Hongmei, L., Xiaoyan, W., Qi, X., et al. (2007). The CCCH-type zinc finger proteins AtSZF1 and AtSZF2 regulate salt stress responses in Arabidopsis. Plant Cell Physiol. 178, 2622–2631. doi: 10.1093/pcp/pcm088
Thiam, M., Champion, A., Diouf, D., and Mame Ourèye, S. Y. (2013). NaCl effects on in vitro germination and growth of some senegalese cowpea (Vigna unguiculata (L.) Walp.) cultivars. ISRN Biotech. 2013:382417.
Wang, D., Guo, Y., Wu, C., Yang, G., Li, Y., and Zheng, C. (2008). Genome-wide analysis of CCCH zinc finger family in Arabidopsis and rice. BMC Genomics 9:44. doi: 10.1186/1471-2164-9-44
Wang, P. H., Lee, C. E., Lin, Y. S., Lee, M. H., Chen, P. Y., Chang, H. C., et al. (2019). The glutamate receptor-like protein GLR3.7 interacts with 14-3-3ω and participates in salt stress response in Arabidopsis thaliana. Front. Plant Sci. 10:1169. doi: 10.3389/fpls.2019.01169
Wang, Y., Tang, H., DeBarry, J. D., Tan, X., Li, J., Wang, X., et al. (2012). MCScanX: a toolkit for detection and evolutionary analysis of gene synteny and collinearity. Nucleic Acids Res. 40:e49. doi: 10.1093/nar/gkr1293
Wolfe, S. A., Nekludova, L., and Pabo, C. O. (2000). DNA recognition by Cys2His2 zinc finger proteins. Annu. Rev. Biophys. Biomol. Struct. 29, 183–212. doi: 10.1146/annurev.biophys.29.1.183
Wu, J., Wang, L., Fu, J., Chen, J., Wei, S., Zhang, S., et al. (2020). Resequencing of 683 common bean genotypes identifies yield component trait associations across a north–south cline. Nat. Genet. 52, 118–125. doi: 10.1038/s41588-019-0546-0
Xu, R. (2014). Genome-wide analysis and identification of stress-responsive genes of the CCCH zinc finger family in Solanum lycopersicum. Mol. Genet. Genomics 289, 965–979. doi: 10.1007/s00438-014-0861-1
Ye, J., Fang, L., Zheng, H. K., Zhang, Y., Chen, J., Zhang, J., et al. (2006). WEGO: a web tool for plotting GO annotations. Nucleic Acids Res. 34, W293–W297. doi: 10.1093/nar/gkl031
Zhang, C., Zhang, H., Zhao, Y., Jiang, H., Zhu, S., Cheng, B., et al. (2013). Genome-wide analysis of the CCCH zinc finger gene family in Medicago truncatula. Plant Cell Rep. 32, 1543–1555. doi: 10.1007/s00299-013-1466-1466
Keywords: C3H gene family, common bean, sprout stage, salt stress, gene expression analysis, transcriptome
Citation: Zhang Q, Zhang W, Yin Z, Li W, Zhao H, Zhang S, Zhuang L, Wang Y, Zhang W-H and Du J-D (2020) Genome- and Transcriptome-Wide Identification of C3Hs in Common Bean (Phaseolus vulgaris L.) and Structural and Expression-Based Analyses of Their Functions During the Sprout Stage Under Salt-Stress Conditions. Front. Genet. 11:564607. doi: 10.3389/fgene.2020.564607
Received: 22 May 2020; Accepted: 19 August 2020;
Published: 15 September 2020.
Edited by:
Xin Chen, Jiangsu Academy of Agricultural Sciences, ChinaReviewed by:
Pengtao Ma, Yantai University, ChinaCopyright © 2020 Zhang, Zhang, Yin, Li, Zhao, Zhang, Zhuang, Wang, Zhang and Du. This is an open-access article distributed under the terms of the Creative Commons Attribution License (CC BY). The use, distribution or reproduction in other forums is permitted, provided the original author(s) and the copyright owner(s) are credited and that the original publication in this journal is cited, in accordance with accepted academic practice. No use, distribution or reproduction is permitted which does not comply with these terms.
*Correspondence: Ji-Dao Du, ZGpkYnluZEAxNjMuY29t
Disclaimer: All claims expressed in this article are solely those of the authors and do not necessarily represent those of their affiliated organizations, or those of the publisher, the editors and the reviewers. Any product that may be evaluated in this article or claim that may be made by its manufacturer is not guaranteed or endorsed by the publisher.
Research integrity at Frontiers

Learn more about the work of our research integrity team to safeguard the quality of each article we publish.