 Seyed Ali Madani Tonekaboni
 Gangesh Beri
 Benjamin Haibe-Kains1,2,3,4,5*
95% of researchers rate our articles as excellent or good
Learn more about the work of our research integrity team to safeguard the quality of each article we publish.
Find out more
ORIGINAL RESEARCH article
Front. Genet. , 09 September 2020
Sec. Computational Genomics
Volume 11 - 2020 | https://doi.org/10.3389/fgene.2020.01016
Lapatinib and trastuzumab (Herceptin) are targeted therapies designed for patients with HER2+ breast tumors. Although these therapies improved survival rates of patients with this tumor type, not all the patients harboring HER2 amplification respond to these drugs. The NeoALTTO clinical trial was designed to test whether a higher response rate can be achieved by combining lapatinib and trastuzumab. Although the combination therapy showed almost double the response rate compared to the monotherapies, 40% of the patients did not respond to the treatment. In this study, we sought to identify biomarkers of HER2+ breast cancer patients’ response to drugs relying on gene expression profiles of tumors. We show that univariate gene expression-based biomarkers are significant but weak predictors of drug response. We further show that pathway activities, estimated from gene expression patterns quantified using the recent transcriptional similarity coefficient (TSC) between the tumor samples, yield high predictive value for therapy response (concordance index >0.8, p < 0.05). Moreover, machine learning models, built using multiple algorithms including logistic regression, naive Bayes, random forest, k-nearest neighbor, and support vector machine, for predicting drug response in the NeoALTTO clinical trial, resulted in lower performance compared to our pathway-based approach. Our results indicate that transcriptional similarity of biological pathways can be used to predict lapatinib and trastuzumab response in HER2+ breast cancer.
Unsupervised clustering of breast tumor samples based on high-throughput expression profiles enabled the identification of HER2+ breast cancer subtype (Carey et al., 2006; Wirapati et al., 2008; Onitilo et al., 2009). Breast cancer survival differed by subtype (p < 0.001), with shortest survival among HER2+ and basal-like subtypes. To treat HER2+ tumors, trastuzumab and lapatinib have been designed to target the EGFR/ERBB2 pathway and yielded a 30% rate of clinical response in the NeoALTTO clinical trial for patients with HER2+ breast tumors (Baselga et al., 2012). This led to their adoption as standard-of-care therapies for HER2+ breast cancer patients (Baselga et al., 2012). To increase the response rate of HER2+ tumors, the biomedical research community sought to design combination therapies. Concurrent treatment with these drugs with a response rate of almost 60% proved a higher efficacy of combination therapy with respect to lapatinib and trastuzumab as monotherapies (Baselga et al., 2012). However, there is a need to identify the non-responders to further improve the rate of treatment response in HER2+ breast cancer patients.
Stratification of responders and non-responders to lapatinib, trastuzumab, and their combination therapies was conducted using either gene-based or pathway (or gene set)-based approaches. In gene-based approaches, mutation, amplification, or expression of individual genes with known association with HER2+ breast tumor biology was investigated as potential biomarkers of response to these therapies (Gomez et al., 2007; Bianchini et al., 2011; Dave et al., 2011; Loibl et al., 2014; Schneeweiss et al., 2014; Vici et al., 2014; Menyhárt et al., 2015). In spite of successful studies as part of gene-based analysis, they could not capture the whole picture of resistance mechanisms to targeted therapies in HER2+ breast cancer patients due to the complexity of HER2+ tumor biology (Nahta, 2012; de Melo Gagliato et al., 2016; Zhang et al., 2017). Hence, pathway (or gene set) approaches were conducted trying to identify the association of multiple genes or pathways to therapy response in HER2+ breast cancer patients.
The association of biological pathways to treatment response in HER2+ breast cancer patients has been conducted based on pathway enrichment analysis using individual genes identified either (1) based on higher activity in responders (or non-responders) versus non-responders (or responders) (Wu et al., 2012; Boulbes et al., 2015; Nam et al., 2015) or (2) as individual or multigene biomarkers of response (Harris et al., 2007; Willis et al., 2018). Here we present an alternative approach where pathways are used directly as features for predicting treatment response in HER2+ breast cancer patients.
In this study, we used our recent Similarity Identification in Gene Expression (SIGN) approach (Madani Tonekaboni et al., 2019) as a classifier relying on expression patterns in biological pathways for the classification of patient tumor samples to predict the response of cancer patients in each arm of the NeoALTTO clinical trial. We showed that the transcriptional similarity coefficient (TSC), identified comparing each patient tumor sample to responders versus non-responders, can be used to identify new pathway-based biomarkers of drug response in HER2+ breast cancer patients.
The overall design of our study is illustrated in Figure 1. In brief, we used the similarity of patterns of gene expression in biological pathways from patients responding to lapatinib, trastuzumab, and their combination to predict therapy response using our SIGN methodology (Madani Tonekaboni et al., 2019). In this framework, a leave-one-out cross-validation was used to assess the performance of each biomarker in predicting the response of cancer patients in each treatment category (Figure 1). The data and detailed methods are described below.
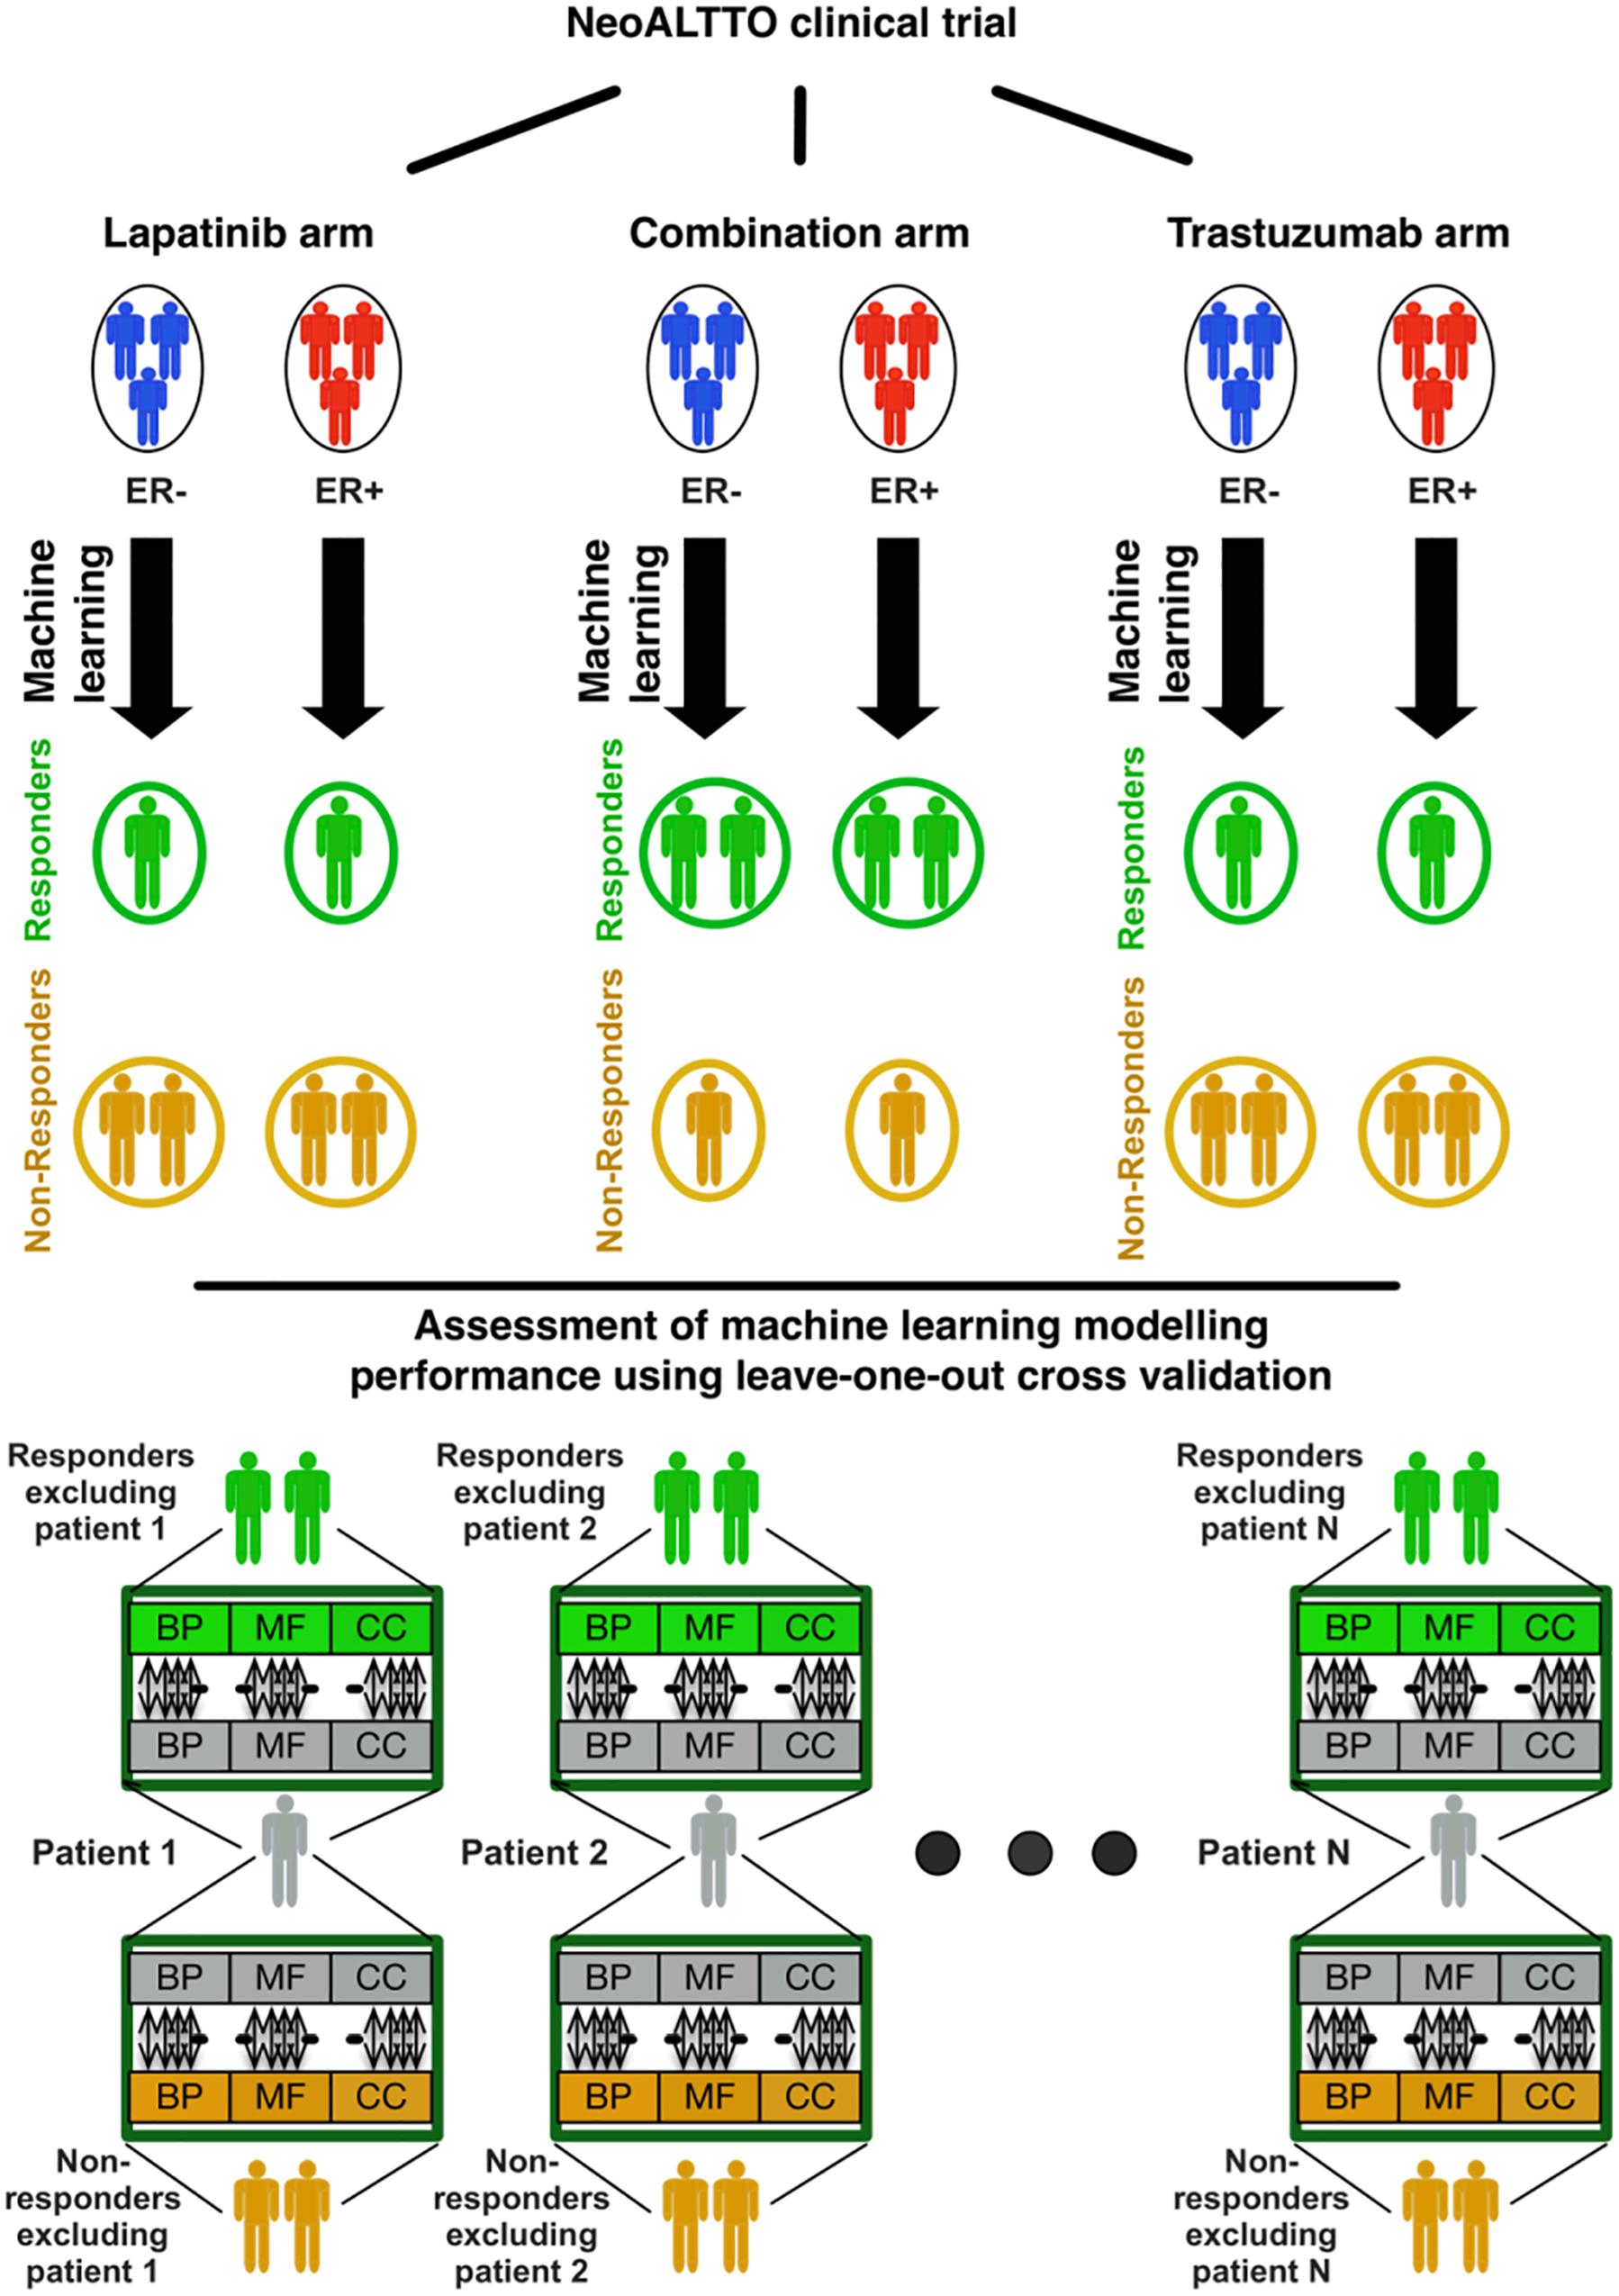
Figure 1. Design of the study regarding identification of responders to lapatinib, trastuzumab, and their combination therapy in the NeoALTTO clinical trial. BP, MF, and CC stand for the Gene Ontology (GO) terms for biological processes, molecular functions, and cellular components, respectively.
RNA-seq raw data of tumor samples in the NeoALTTO clinical trial were quantified with Kallisto (Bray et al., 2016) in Toil pipeline (Vivian et al., 2017) using the GENCODE version 23 (ALL version) transcriptome annotation. Transcript level abundances are summarized to gene level using the same approach as described in Soneson et al. (2015).
Responders and non-responders in the NeoALTTO clinical trial were determined using the rate of pathological complete response (pCR) (Baselga et al., 2012). Any patient without a recorded pCR was regarded as a non-responder. A pathological complete response is defined as no invasive cancer in the breast or only non-invasive in situ cancer in the breast specimen. Surgical breast and axillary node resection specimens were evaluated for pathologic tumor response according to the National Surgical Adjuvant Breast and Bowel Project (NSABP) guidelines1.
Similarities of samples within each arm of the NeoALTTO clinical trial were identified using Spearman’s rank-order correlation (Wissler, 1905). The hierarchical clustering was then implemented on the similarity matrix between the samples using Euclidean distance and Ward’s minimum variance method (Murtagh and Legendre, 2014).
Concordance indices between the expression of each gene and the binarized vector of drug response were calculated as the prediction performance of each gene as a univariate biomarker. The significance of each identified C-index was calculated using a permutation test. The observations were randomly permuted, and the C-index between the expression of each gene and the observed classes for the tumor samples was calculated. Then the fraction of times in which the C-index of the gene expression with real observed classes was lower than the C-indices identified with permuted observed classes was considered as the significance (or FDR) of the C-index identified for that gene.
We used the concordance index (C-index) to quantify the predictive value of our drug response predictors. The C-index estimates the probability that, for a pair of randomly chosen comparable samples, the sample with the higher predicted value will experience an event before the other sample or belongs to a higher binary class (Harrell et al., 1982). We used the implementation of the concordance index available in the survcomp R package (version 1.34.0) (Schröder et al., 2011).
The transcriptional similarity coefficient (TSC) between each sample and the responders and non-responders were identified using the TSC function in the SIGN R package (version 0.1.0) (Madani Tonekaboni et al., 2019). Let P be the matrix of expression of genes within a pathway for a set of biological samples where rows are genes and columns are samples. Then the TSC is defined as follows:
where P1 and P2 represent the matrix of gene expressions of a given pathway in two sets of samples (populations 1 and 2), i is the row index (i.e., gene index) within each matrix, j is the column index (i.e., sample index) within each matrix, and Pm0 (either P10 or P20)
where m is either 1 for population 1 or 2 for population 2. Deducting the diagonal elements in the above equation was initially proposed to the bioinformatics community for analyzing genomics data (Smilde et al., 2009). This term will make sure that the identified similarities do not depend on the number of samples compared between the datasets.
The TSC captures the similarity of the pathway expression pattern between two samples and/or sample sets that is in the range [−1,1].
The TSC for each pathway was identified between one sample and the remaining samples, divided into two groups of responders and non-responders (Baselga et al., 2012). GO terms in level C5 with 10 to 30 genes are used in this study to identify the similarity between samples based on their gene expression pattern (Madani Tonekaboni et al., 2019). We limited the number of genes in GO terms to exclude large GO terms (at the top of the GO term hierarchy) that are parents of the GO terms in our study (at the bottom of the GO hierarchy). If the TSC for similarity for the responders was higher than that for the non-responders, the given sample was considered as a responder and vice versa. This process was repeated for every given sample in each arm of the trial. The method’s performance for predicting the response of cancer patients was assessed using the concordance index.
Each model was validated using leave-one-out cross-validation. In this setting, a target sample was put aside, and the rest of the samples were used for the prediction of drug response in the target sample. The TSC of each pathway between the set-aside sample and the randomly selected five samples from responders and non-responders were calculated. Then the median of the TSCs of all the pathways was calculated to assess if the sample has a higher similarity to responders or non-responders. This process was repeated 100 times for each sample, and majority votes of the 100 times were considered as the predicted class of the sample to be responder or non-responder.
We leveraged the gene expression and clinical information of HER2+ breast cancer patients in the NeoALTTO clinical trial to identify biomarkers of drug response. The NeoALTTO clinical trial was a phase three randomized clinical trial designed to assess the efficacy of anti-HER2 monoclonal antibody trastuzumab, the tyrosine kinase inhibitor lapatinib, and their combination therapies on HER2-overexpressing breast cancer patients. The response (pCR) rate was significantly higher in the group given lapatinib and trastuzumab (51.3%) than in the group given trastuzumab alone (29.5%; p < 0.05). However, no significant difference in pCR between the lapatinib (24.7%) and the trastuzumab (p = 0.34) groups was observed.
We identified correlations of tumor samples based on their gene expression profiles in three arms of the clinical trial separated based on the treatment type including trastuzumab alone, lapatinib alone, and their combination therapies (Figure 1). The unsupervised clustering of samples could not stratify the patients based on their responses, relying on the rate of pathological complete response (Figure 2A).
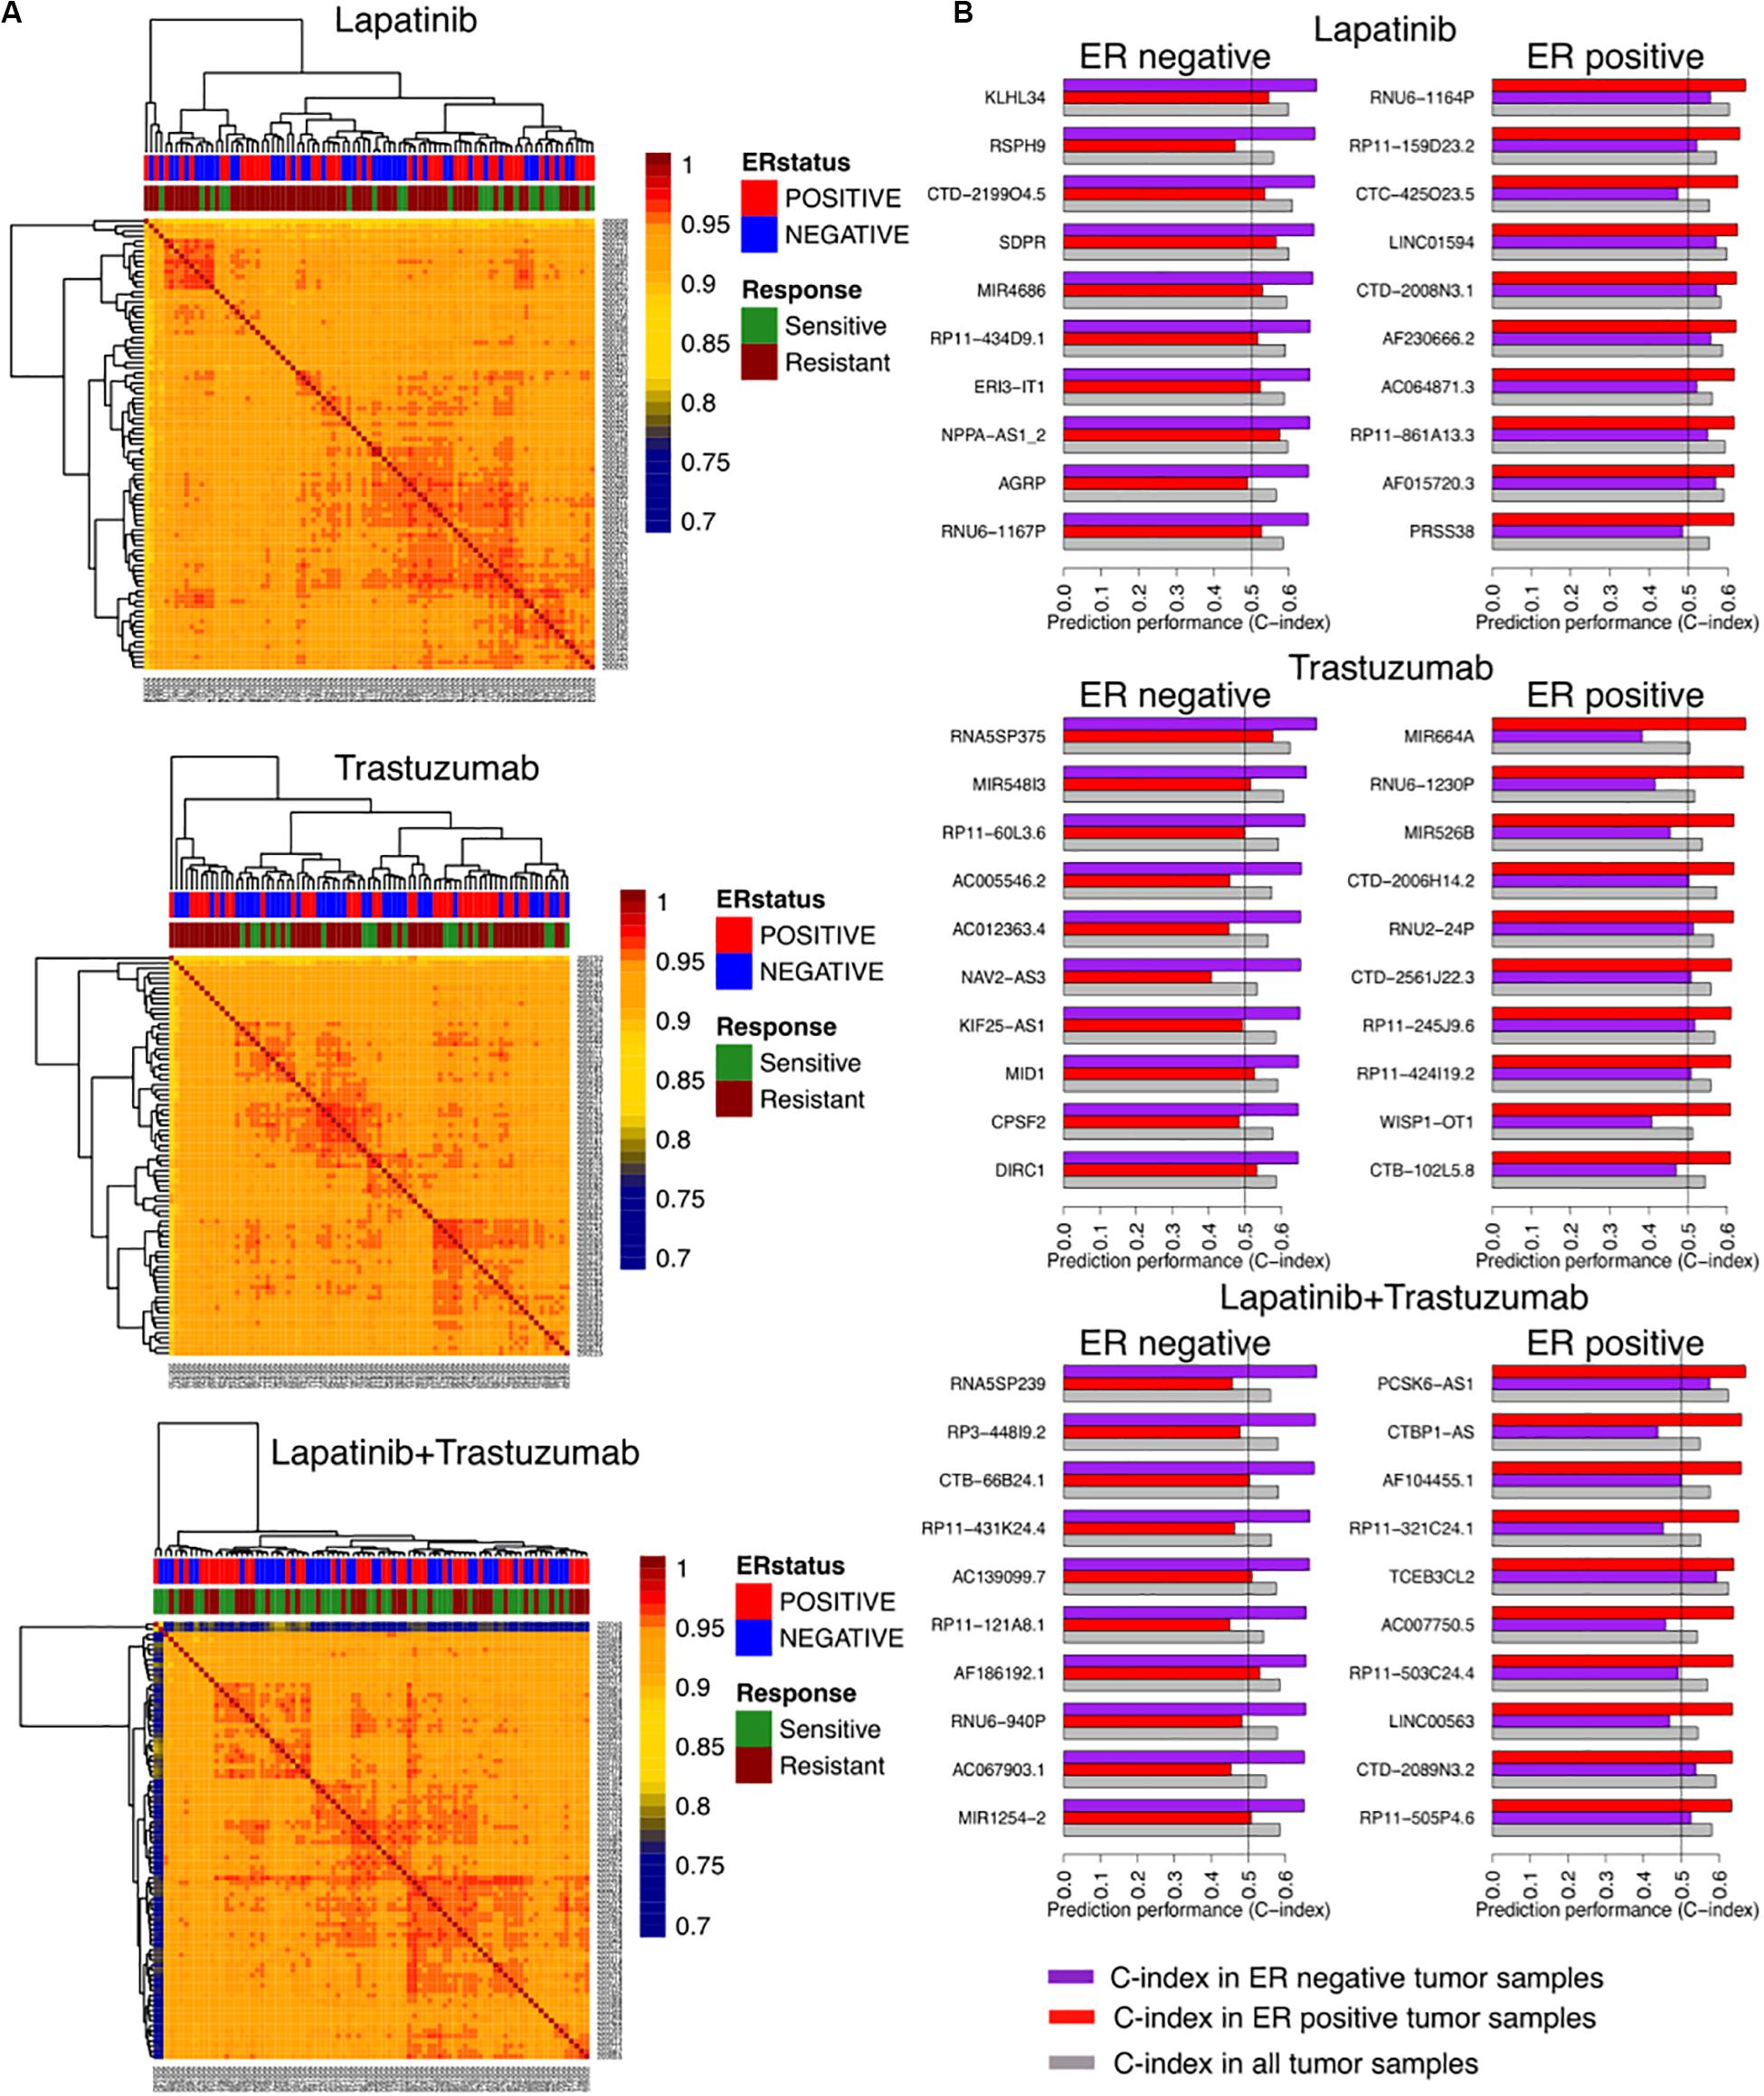
Figure 2. Identifying responders to lapatinib, trastuzumab, and their combination therapy in the NeoALTTO clinical trial using genes as univariate predictors of response. (A) Clustering of samples based on their similarity, defined as the Spearman correlation between gene expression profiles of the sample. (B) Top 10 genes as univariate biomarkers of drug response in ER+ and ER– cohorts within each arm of the NeoALTTO clinical trial.
We further computed the C-index of genes as univariate biomarkers of drug response in each arm of the NeoALTTO trial. Relying on the common knowledge on ER being one of the main drivers in breast cancer development and progression (Fuqua, 1997), we stratified our analyses based on the ER status. Top predictors of response yield a C-index of 0.68 (Figure 2B), while the C-index of ERBB2 as a univariate biomarker of response in all the arms does not exceed 0.59 (the full list can be found in the Supplementary Material). The low performance of univariate modeling could be due to high correlation of patient tumor samples, as more than 90% of the tumor sample pairs had Pearson correlation of more than 0.9 using their gene expression profiles.
We recently showed the high performance of a new method called SIGN in predicting the survival rate of breast cancer patients under different therapeutic regimens (Madani Tonekaboni et al., 2019). We sought to use SIGN to predict the drug response of patients in each arm of the NeoALTTO trial. We used C-indices of the pathways, identified between the TSC of the pathways and the drug response in each arm of the trial, to cluster the arms. Trastuzumab alone and the combination therapy arms were clustered more closely compared to the lapatinib alone arm using the C-indices of the pathways, although the difference is not significant (p > 0.05) (Figure 3A). Moreover, the pathway biomarkers of ER− and ER+ patient tumors showed low commonality revealing differences in the mechanism of response caused by the ER status of the patient tumors (absolute Spearman correlation <0.08) (Figure 3B). Top pathway biomarkers for patients with the same treatment regimen and ER status had C-indices of more than 0.8 except for ER− patients under trastuzumab alone therapy (Figure 3C).
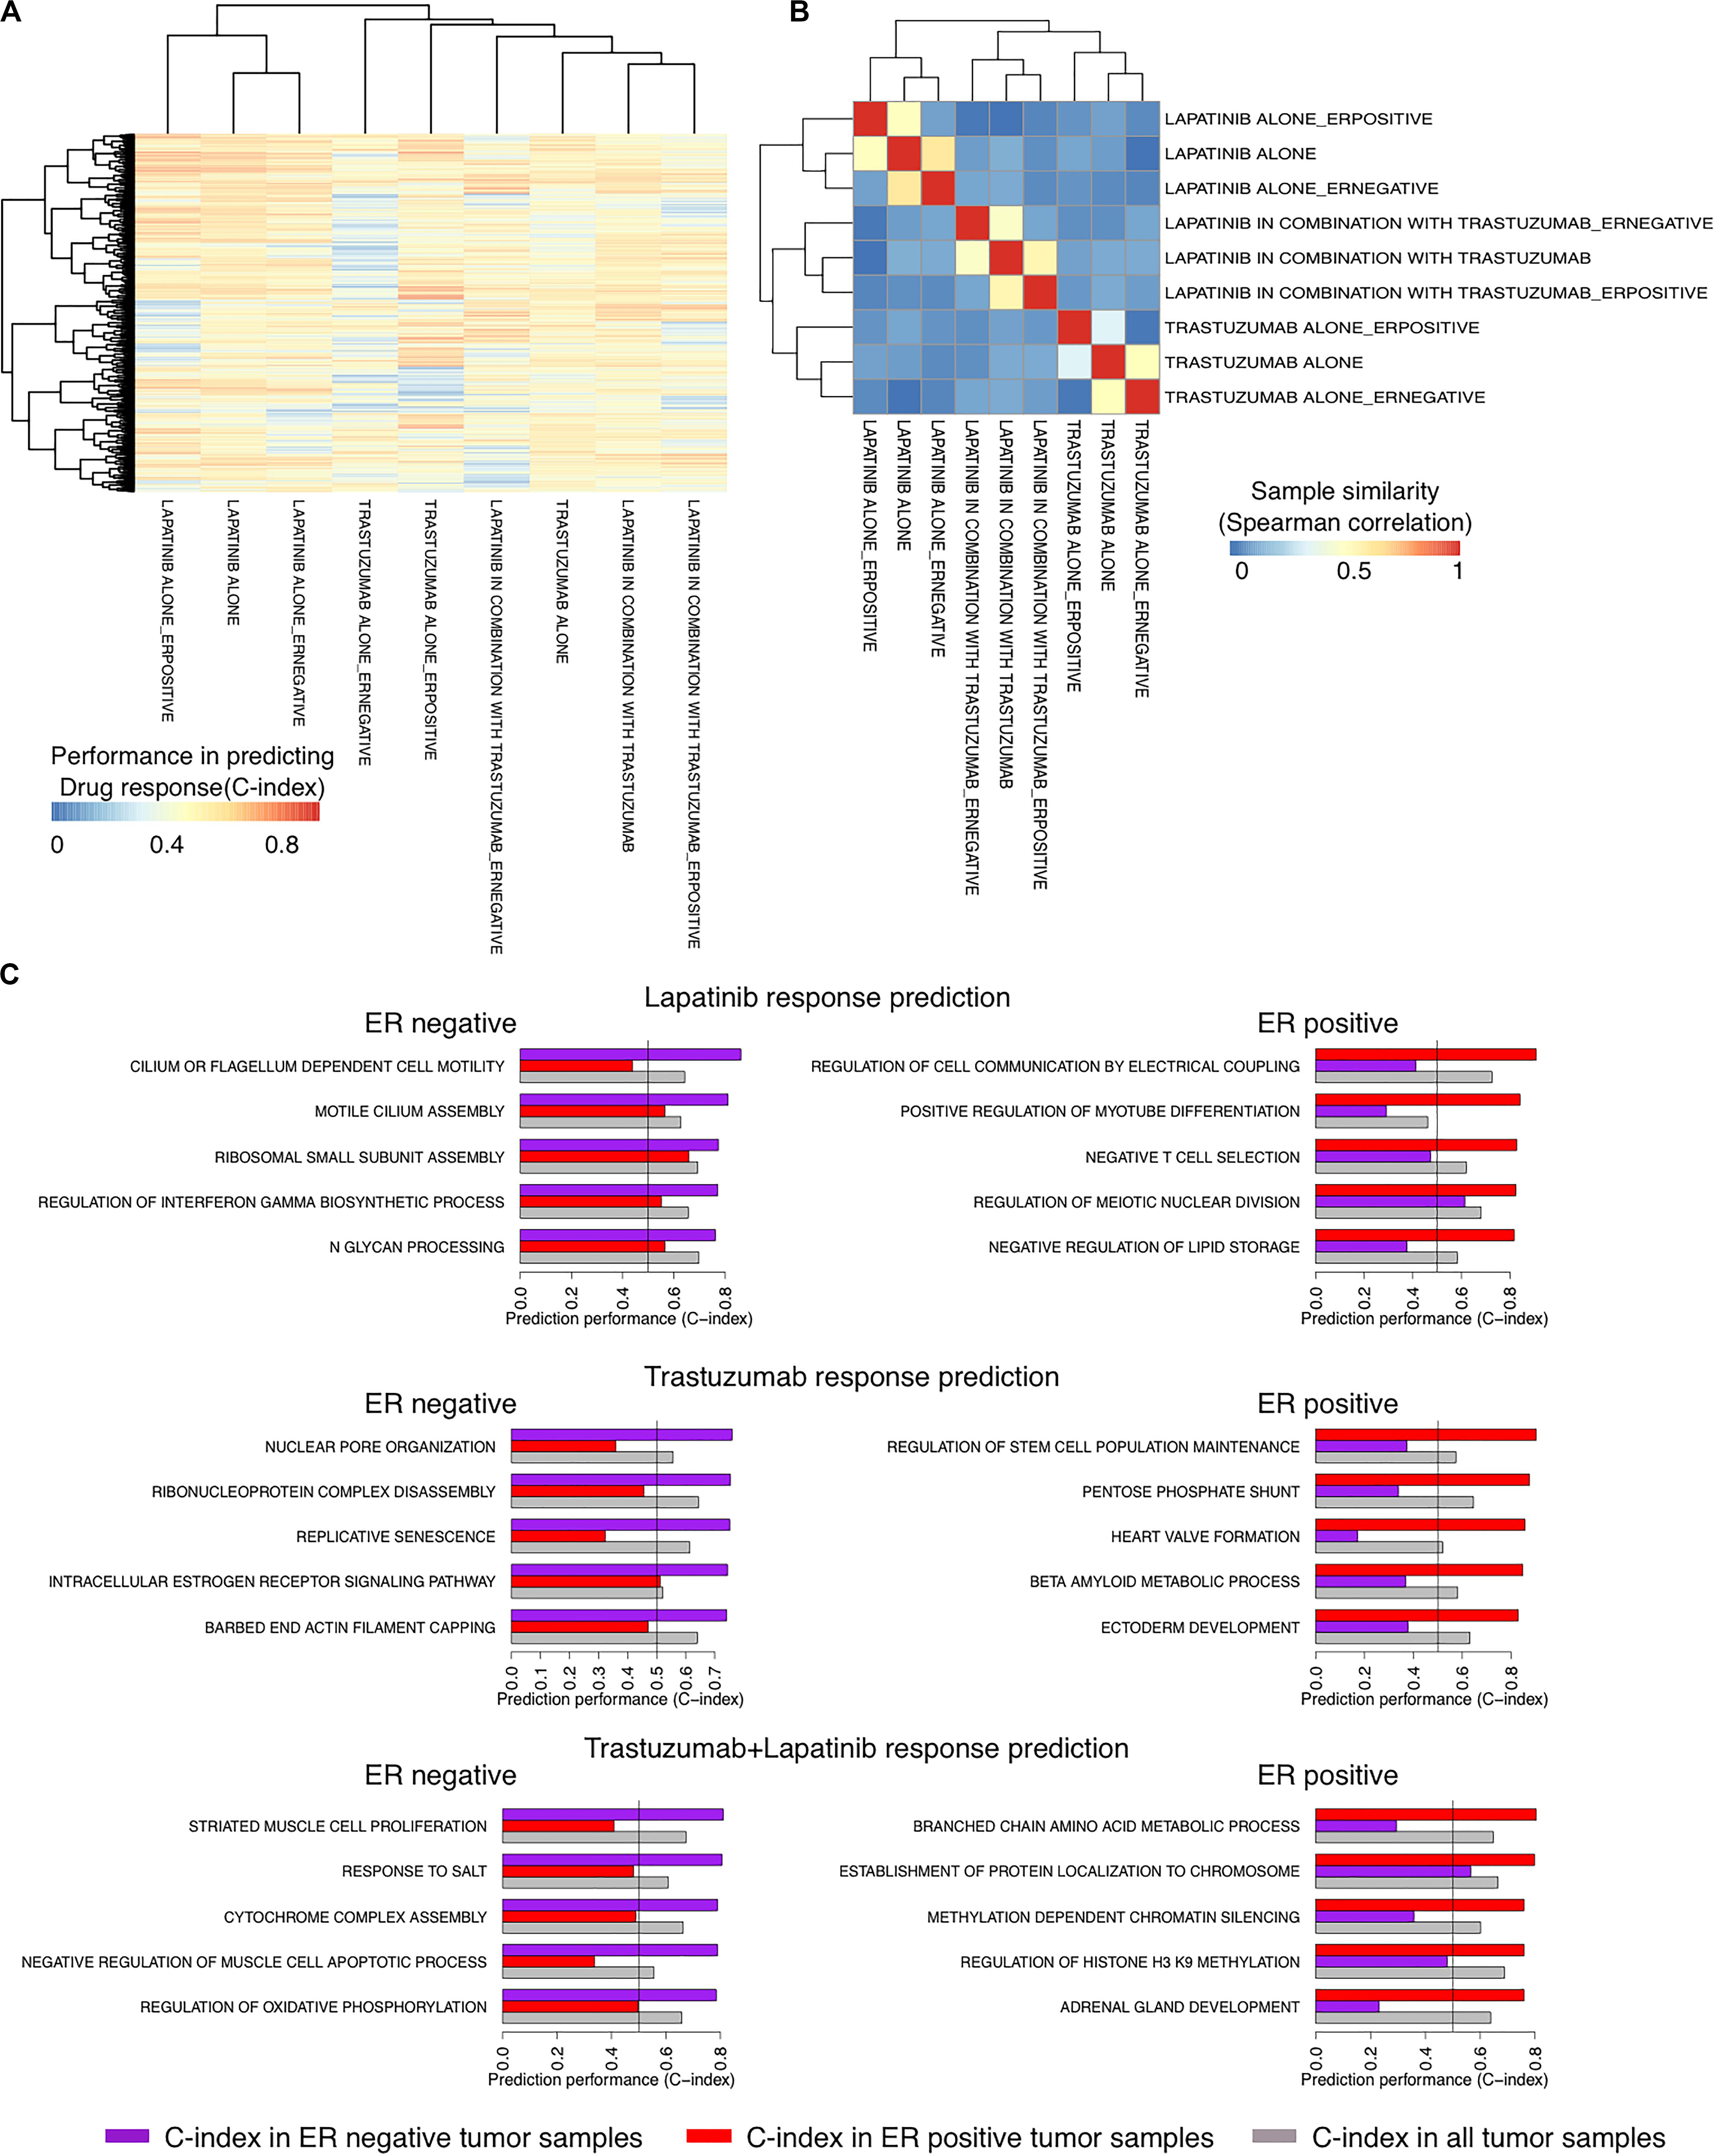
Figure 3. Identifying responders to lapatinib, trastuzumab, and their combination therapy in the NeoALTTO clinical trial using the transcriptional similarity coefficient (TSC) of pathways. (A) Concordance indices of delta TSCs of GO terms, comparing each sample with responders and non-responders, in predicting the response of patients to lapatinib, trastuzumab, and their combination. (B) Clustering of groups of patients based on Concordance indices of delta TSC of GO terms (A). (C) Top pathways as predictors of lapatinib, trastuzumab, and their combination in ER+ and ER– tumor samples in the NeoALTTO clinical trial.
Although the biological function of the identified pathways as biomarkers of drug response requires experimental validation, we found some evidence on their biological relevance. For example, among top identified biomarkers of drug response, there are REGULATION OF INTERFERON GAMMA BIOSYNTHETIC PROCESS and NEGATIVE T-CELL SELECTION for ER− and ER+ cancer patients under lapatinib treatment, respectively. These are in agreement with previous literature on the importance of immune signaling in lapatinib response in cancer patients (Griguolo et al., 2019).
We compared the top seven biomarkers identified in each arm of the NeoALTTO clinical trial for patients with ER− or ER+ status with the performance of 35 machine learning models (Figure 4). These models were built using five different machine learning algorithms, including logistic regression, k-nearest-neighbor (k-NN), naive Bayes, random forest, and support vector machine (SVM), and seven different feature selection approaches (Figure 4). SIGN-based biomarkers outperformed all 35 models in all treatment categories. We used the same leave-one-out cross-validation strategy as used for SIGN to compare the performance of these models.
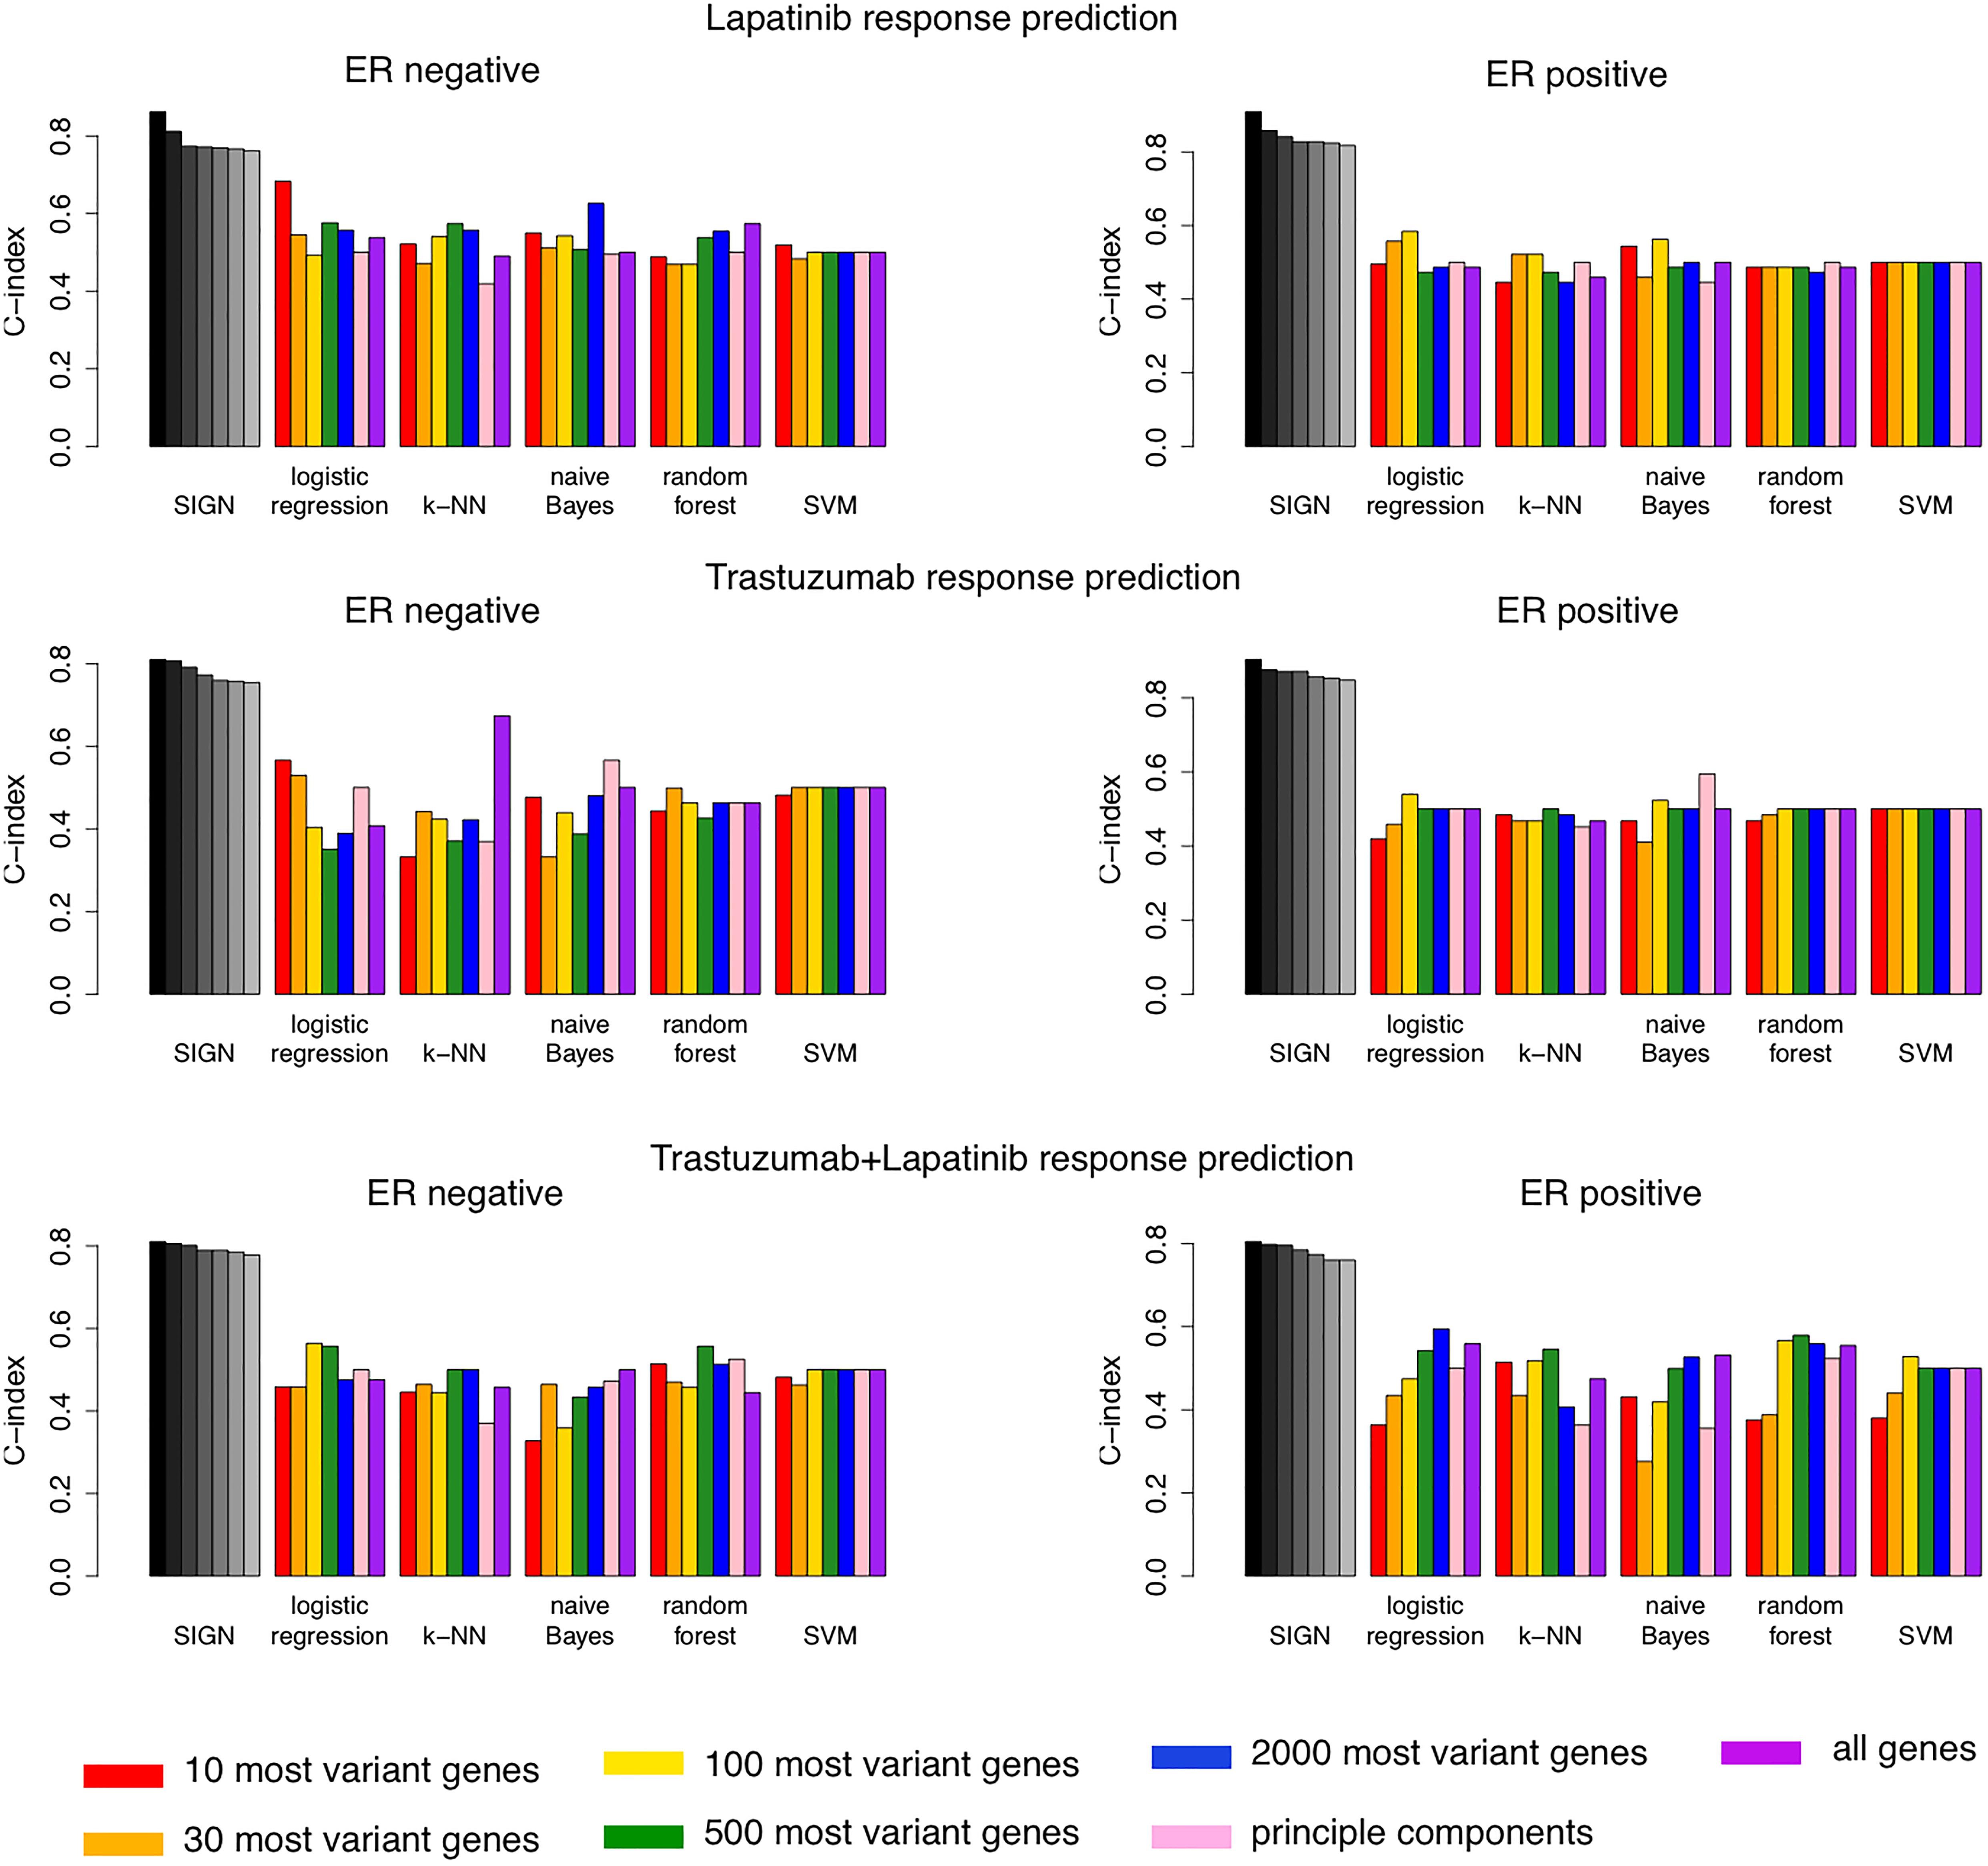
Figure 4. Comparison of performance of top seven biomarkers of drug response using Similarity Identification in Gene Expression (SIGN) and 35 machine learning models built combining five machine learning methods and seven different feature selection approaches.
We propose SIGN as a new approach to identify biomarkers of drug response in other subtypes of breast cancer or other tumor types. We showed the utility of SIGN in predicting the response of HER2+ breast cancer patients to lapatinib, trastuzumab, and their combination therapies using transcription patterns within biological pathways. Our results further emphasize the information gained upon using genes within biological pathways instead of individual markers of drug response. Furthermore, it suggests transcriptional similarity coefficient (TSC) as a new measure of similarity between tumor samples to be used in predicting their response to drug response. SIGN-based biomarkers outperformed 35 different machine learning models in predicting drug response in each treatment category. Moreover, the SIGN approach provides us with highly interpretable pathway-based biomarkers of drug response. Although SIGN showed promising performance for predicting response to lapatinib, trastuzumab, and their combination in HER2+ breast cancer patients, this approach needs further validation to ensure its generalizability in new clinical datasets. Upon having access to further clinical data of HER2+ patients in each one of these treatment categories, our findings in this study can be further assessed and validated.
The datasets generated for this study can be found in the ClinicalTrials.gov Identifier: NCT00553358.
SM led the project and performed the computational analysis of the work under supervision of BH-K. GB and SM collected and curated the data. All authors contributed to the article and approved the submitted version.
This study was conducted with the support of the Cancer Research Society and the Ontario Institute for Cancer Research through funding provided by the Government of Ontario. SM was supported by Connaught the International Scholarships for Doctoral Students, Genome Canada, and the Ontario Research Funds. BH-K was supported by the Gattuso–Slaight Personalized Cancer Medicine Fund at Princess Margaret Cancer Centre, the Natural Sciences and Engineering Research Council, and the Canadian Institutes of Health Research.
The authors declare that the research was conducted in the absence of any commercial or financial relationships that could be construed as a potential conflict of interest.
The authors thank the organizers of the NeoALTTO clinical trial for sharing their valuable data with the scientific community.
The Supplementary Material for this article can be found online at: https://www.frontiersin.org/articles/10.3389/fgene.2020.01016/full#supplementary-material
Baselga, J., Bradbury, I., Eidtmann, H., Di Cosimo, S., de Azambuja, E., Aura, C., et al. (2012). Lapatinib with trastuzumab for HER2-positive early breast cancer (NeoALTTO): a randomised, open-label, multicentre, phase 3 trial. Lancet 379, 633–640. doi: 10.1016/s0140-6736(11)61847-3
Bianchini, G., Prat, A., Pickl, M., Belousov, A., Koehler, A., Semiglazov, V., et al. (2011). Response to neoadjuvant trastuzumab and chemotherapy in ER and ER- HER2-positive breast cancers: gene expression analysis. J. Clin. Oncol. 29, 529–529. doi: 10.1200/jco.2011.29.15_suppl.529
Boulbes, D. R., Chauhan, G. B., Jin, Q., Bartholomeusz, C., and Esteva, F. J. (2015). CD44 expression contributes to trastuzumab resistance in HER2-positive breast cancer cells. Breast Cancer Res. Treat. 151, 501–513. doi: 10.1007/s10549-015-3414-3
Bray, N. L., Pimentel, H., Melsted, P., and Pachter, L. (2016). Erratum: Near-optimal probabilistic RNA-seq quantification. Nat. Biotechnol. 34:888. doi: 10.1038/nbt0816-888d
Carey, L. A., Perou, C. M., Livasy, C. A., Dressler, L. G., Cowan, D., Conway, K., et al. (2006). Race, breast cancer subtypes, and survival in the carolina breast cancer study. JAMA 295, 2492–2502.
Dave, B., Migliaccio, I., Carolina Gutierrez, M., Wu, M.-F., Chamness, G. C., Wong, H., et al. (2011). Loss of phosphatase and tensin homolog or phosphoinositol-3 kinase activation and response to trastuzumab or lapatinib in human epidermal growth factor receptor 2-overexpressing locally advanced breast cancers. J. Clin. Oncol. 29, 166–173. doi: 10.1200/jco.2009.27.7814
de Melo Gagliato, D., Jardim, D. L. F., Marchesi, M. S. P., and Hortobagyi, G. N. (2016). Mechanisms of resistance and sensitivity to anti-HER2 therapies in HER2+ breast cancer. Oncotarget 7, 64431–64446. doi: 10.18632/oncotarget.7043
Fuqua, S. A. W. (1997). The role of the estrogen receptor in breast cancer development and progression. Steroids 11.62:723.
Gomez, H. L., Chavez, M. A., Doval, D. C., Franco, S., Arbushites, M., Berger, M. S., et al. (2007). Investigation of tumor biomarkers as response predictors in a monotherapy study with lapatinib (L) as a first line treatment in ErbB2 amplified women with breast cancer. J. Clin. Oncol. 25, 10562–10562. doi: 10.1200/jco.2007.25.18_suppl.10562
Griguolo, G., Pascual, T., Dieci, M. V., Guarneri, V., and Prat, A. (2019). Interaction of host immunity with HER2-targeted treatment and tumor heterogeneity in HER2-positive breast cancer. J. Immunother. Cancer 7:90.
Harrell, F. E. Jr., Califf, R. M., Pryor, D. B., Lee, K. L., and Rosati, R. A. (1982). Evaluating the yield of medical tests. JAMA 247, 2543–2546. doi: 10.1001/jama.247.18.2543
Harris, L. N., You, F., Schnitt, S. J., Witkiewicz, A., Lu, X., Sgroi, D., et al. (2007). Predictors of resistance to preoperative trastuzumab and vinorelbine for HER2-positive early breast cancer. Clin. Cancer Res. 13, 1198–1207. doi: 10.1158/1078-0432.ccr-06-1304
Loibl, S., von Minckwitz, G., Schneeweiss, A., Paepke, S., Lehmann, A., Rezai, M., et al. (2014). PIK3CA mutations are associated with lower rates of pathologic complete response to anti-human epidermal growth factor receptor 2 (HER2) therapy in primary HER2-overexpressing breast cancer. J. Clin. Oncol. 32, 3212–3220. doi: 10.1200/jco.2014.55.7876
Madani Tonekaboni, S. A., Kumar Manem, V. S., El-Hachem, N., and Haibe-Kains, B. (2019). SIGN: similarity identification in gene expression. Bioinformatics 35, 4830–4833. doi: 10.1093/bioinformatics/btz485
Menyhárt, O., Santarpia, L., and Gyõrffy, B. (2015). A comprehensive outline of trastuzumab resistance biomarkers in HER2 overexpressing breast cancer. Curr. Cancer Drug Targets 15, 665–683. doi: 10.2174/156800961508151001101742
Murtagh, F., and Legendre, P. (2014). Ward’s hierarchical agglomerative clustering method: which algorithms implement ward’s criterion? J. Classif. 31, 274–295. doi: 10.1007/s00357-014-9161-z
Nahta, R. (2012). molecular mechanisms of trastuzumab-based treatment in HER2-overexpressing breast cancer. ISRN Oncol. 2012:428062.
Nam, S., Chang, H. R., Jung, H. R., Gim, Y., Kim, N. Y., Grailhe, R., et al. (2015). A pathway-based approach for identifying biomarkers of tumor progression to trastuzumab-resistant breast cancer. Cancer Lett. 356, 880–890. doi: 10.1016/j.canlet.2014.10.038
Onitilo, A. A., Engel, J. M., Greenlee, R. T., and Mukesh, B. N. (2009). Breast cancer subtypes based on ER/PR and Her2 expression: comparison of clinicopathologic features and survival. Clin. Med. Res. 7, 4–13. doi: 10.3121/cmr.2008.825
Schneeweiss, A., Chia, S., Hegg, R., Tausch, C., Deb, R., Ratnayake, J., et al. (2014). Evaluating the predictive value of biomarkers for efficacy outcomes in response to pertuzumab- and trastuzumab-based therapy: an exploratory analysis of the TRYPHAENA study. Breast Cancer Res. 16, bcr3690. doi: 10.1186/bcr3690
Schröder, M. S., Culhane, A. C., Quackenbush, J., and Haibe-Kains, B. (2011). survcomp: an R/Bioconductor package for performance assessment and comparison of survival models. Bioinformatics 27, 3206–3208. doi: 10.1093/bioinformatics/btr511
Smilde, A. K., Kiers, H. A. L., Bijlsma, S., Rubingh, C. M., and van Erk, M. J. (2009). Matrix correlations for high-dimensional data: the modified RV-coefficient. Bioinformatics 25, 401–405. doi: 10.1093/bioinformatics/btn634
Soneson, C., Love, M. I., and Robinson, M. D. (2015). Differential analyses for RNA-seq: transcript-level estimates improve gene-level inferences. F1000Research 4:1521. doi: 10.12688/f1000research.7563.1
Vici, P., Mottolese, M., Pizzuti, L., Barba, M., Sperati, F., Terrenato, I., et al. (2014). The Hippo transducer TAZ as a biomarker of pathological complete response in HER2-positive breast cancer patients treated with trastuzumab-based neoadjuvant therapy. Oncotarget 5, 9619–9625. doi: 10.18632/oncotarget.2449
Vivian, J., Rao, A. A., Nothaft, F. A., Ketchum, C., Armstrong, J., Novak, A., et al. (2017). Toil enables reproducible, open source, big biomedical data analyses. Nat. Biotechnol. 35, 314–316. doi: 10.1038/nbt.3772
Willis, S., Polydoropoulou, V., Sun, Y., Young, B., Tsourti, Z., Karlis, D., et al. (2018). Exploratory analysis of single-gene predictive biomarkers in HERA DASL cohort reveals that C8A mRNA expression is prognostic of outcome and predictive of benefit of trastuzumab. JCO Prec. Oncol. 2, 1–12. doi: 10.1200/po.18.00016
Wirapati, P., Sotiriou, C., Kunkel, S., Farmer, P., Pradervand, S., Haibe-Kains, B., et al. (2008). Meta-analysis of gene expression profiles in breast cancer: toward a unified understanding of breast cancer subtyping and prognosis signatures. Breast Cancer Res. 10:124. doi: 10.1186/bcr2124
Wissler, C. (1905). The spearman correlation formula. Science 22, 309–311. doi: 10.1126/science.22.558.309
Wu, Y., Ginther, C., Kim, J., Mosher, N., Chung, S., and Slamon, D. (2012). Expression of Wnt3 activates Wnt/b-catenin pathway and promotes EMT-like phenotype in trastuzumab-resistant HER2-overexpressing breast cancer cells. Mol. Cancer Res. 10, 1597–1606. doi: 10.1158/1541-7786.mcr-12-0155-t
Keywords: breast cancer, human epidermal growth factor receptor 2, lapatinib, trastuzumab, transcriptional similarity coefficient, estrogen receptor
Citation: Madani Tonekaboni SA, Beri G and Haibe-Kains B (2020) Pathway-Based Drug Response Prediction Using Similarity Identification in Gene Expression. Front. Genet. 11:1016. doi: 10.3389/fgene.2020.01016
Received: 07 October 2019; Accepted: 10 August 2020;
Published: 09 September 2020.
Edited by:
Harinder Singh, J. Craig Venter Institute (La Jolla), United StatesReviewed by:
Yang Dai, University of Illinois at Chicago, United StatesCopyright © 2020 Madani Tonekaboni, Beri and Haibe-Kains. This is an open-access article distributed under the terms of the Creative Commons Attribution License (CC BY). The use, distribution or reproduction in other forums is permitted, provided the original author(s) and the copyright owner(s) are credited and that the original publication in this journal is cited, in accordance with accepted academic practice. No use, distribution or reproduction is permitted which does not comply with these terms.
*Correspondence: Seyed Ali Madani Tonekaboni, YWxpLm1hZGFuaXRvbmVrYWJvbmlAbWFpbC51dG9yb250by5jYQ==; Benjamin Haibe-Kains, QmVuamFtaW4uSGFpYmUtS2FpbnNAdWhucmVzZWFyY2guY2E=
Disclaimer: All claims expressed in this article are solely those of the authors and do not necessarily represent those of their affiliated organizations, or those of the publisher, the editors and the reviewers. Any product that may be evaluated in this article or claim that may be made by its manufacturer is not guaranteed or endorsed by the publisher.
Research integrity at Frontiers
Learn more about the work of our research integrity team to safeguard the quality of each article we publish.