- 1Data, Analytics & AI, Larsen & Toubro Infotech Ltd., Pune, India
- 2Department of Computer Science & Engineering, Jadavpur University, Kolkata, India
- 3Department of Computer Science and Engineering, National Institute of Technical Teachers' Training and Research, Kolkata, India
- 4Computational Intelligence Research Group, Institute of Computer Science, University of Wroclaw, Wroclaw, Poland
- 5Department of Computer Science and Information Technology, SOA University, Bhubaneshwar, India
- 6Faculty of Mathematics and Information Science, Warsaw University of Technology, Warsaw, Poland
- 7Institute of Informatics, University of Warsaw, Warsaw, Poland
- 8Centre of New Technologies, University of Warsaw, Warsaw, Poland
Genome-wide analysis of miRNA molecules can reveal important information for understanding the biology of cancer. Typically, miRNAs are used as features in statistical learning methods in order to train learning models to predict cancer. This motivates us to propose a method that integrates clustering and classification techniques for diverse cancer types with survival analysis via regression to identify miRNAs that can potentially play a crucial role in the prediction of different types of tumors. Our method has two parts. The first part is a feature selection procedure, called the stochastic covariance evolutionary strategy with forward selection (SCES-FS), which is developed by integrating stochastic neighbor embedding (SNE), the covariance matrix adaptation evolutionary strategy (CMA-ES), and classifiers, with the primary objective of selecting biomarkers. SNE is used to reorder the features by performing an implicit clustering with highly correlated neighboring features. A subset of features is selected heuristically to perform multi-class classification for diverse cancer types. In the second part of our method, the most important features identified in the first part are used to perform survival analysis via Cox regression, primarily to examine the effectiveness of the selected features. For this purpose, we have analyzed next generation sequencing data from The Cancer Genome Atlas in form of miRNA expression of 1,707 samples of 10 different cancer types and 333 normal samples. The SCES-FS method is compared with well-known feature selection methods and it is found to perform better in multi-class classification for the 17 selected miRNAs, achieving an accuracy of 96%. Moreover, the biological significance of the selected miRNAs is demonstrated with the help of network analysis, expression analysis using hierarchical clustering, KEGG pathway analysis, GO enrichment analysis, and protein-protein interaction analysis. Overall, the results indicate that the 17 selected miRNAs are associated with many key cancer regulators, such as MYC, VEGFA, AKT1, CDKN1A, RHOA, and PTEN, through their targets. Therefore the selected miRNAs can be regarded as putative biomarkers for 10 types of cancer.
1. Introduction
MicroRNAs (miRNAs) belong to the non-coding RNA family. They consist of 19–25 nucleotides and play an important role in the regulation of gene silencing. These non-coding RNAs are present in every eukaryotic cell and can also be encoded by a viral genome (Ray and Maiti, 2015; Bruscella et al., 2017). The miRNAs are formed by RNA polymerase II in the cell nucleus and are then transferred to the cytoplasm (Bartel, 2009) for biological activities such as cell cycle control, apoptosis, and oncogenesis. They interact with the complementary strand of mRNAs and lead to the degradation of the corresponding mRNAs; they also interfere with protein production by suppressing protein synthesis (Valencia-Sanchez et al., 2006). A miRNA molecule can bind one or more targets, thus forming a complex underlying regulatory network. These networks have a profound impact on cancer signaling pathways (Wang et al., 2017). Previously, low-throughput and high-cost technologies were the main obstacle to answering systems-level biological questions. However, recent advancements in next generation sequencing (NGS) have enabled researchers to address such complex problems (van Dijk et al., 2014). Moreover, new sequencing technologies and genomic datasets have helped us to gain better understanding of the biological complexities related to genomic abnormalities in cancer. The considerable achievements in sequencing techniques have made high-throughput techniques a fundamental platform for miRNA, RNA, and DNA research. Generally, miRNAs are involved in a wide range of diseases, including neurological disease, heart disease, and cancer (Giza et al., 2014; Paul et al., 2018). In many cases of cancer in humans, dysregulation of miRNA expression has been observed, and it is well-known that miRNAs can serve as potential cancer biomarkers (Lu et al., 2005; Jacobsen et al., 2013; Wong et al., 2017). In this regard, scientific communities are also trying to understand the role of miRNAs in paring with mRNAs (Zhang et al., 2014; Shrestha et al., 2017), in different cancer types by ranking miRNAs (Li et al., 2014) to elucidate their effects and drug resistance (Ma et al., 2010; Li and Yang, 2014; Cheerla and Gevaert, 2017).
To reduce the time taken for clinical trials, and to provide better and more accurate treatments while avoiding unnecessary interventions, the proper selection of miRNAs as biomarkers is crucial. For this purpose, miRNAs are often used as features in statistical learning methods viz. clustering, classification, and regression in order to identify potential biomarkers (Song et al., 2016; Yang et al., 2017; Yokoi et al., 2017). Song et al. (2016) performed a clustering analysis on breast cancer data in order to find miRNAs that could be prognostic biomarkers; these miRNAs are up-regulated in this type of cancer and are linked to local relapse, distant metastasis, and poor clinical outcomes. Similarly, Yang et al. (2017) used clustering to find miRNA biomarkers for breast cancer. The identified miRNAs have higher specificity and sensitivity than single-gene biomarkers. On the other hand, Yokoi et al. (2017) used a classification task to inform the development of a predictive model to distinguish patients with ovarian cancer tumors from healthy subjects. In this study, eight miRNAs were found as biomarkers for ovarian cancer. Jacob et al. (2017) conducted a study on colon cancer and identified 16 miRNA signatures, which act as prognostic biomarkers at cancer stages II and III. Apart from the aforementioned works, regression analysis has been used to predict the survival rates of patients with different types of cancer (Liang et al., 2018). Liang et al. (2018) used Cox regression analysis for pancreatic cancer and identified five miRNAs as independent prognostic factors. The progress in this regard can be found in the literature (e.g., Peng and Croce, 2016; Hosseinahli et al., 2018).
Generally, in miRNA-based cancer studies, statistical learning algorithms viz. clustering, classification, and regression are used separately for different cancer types, as described above and in the literature (Akhtar et al., 2015; Ang et al., 2016; Li et al., 2016; Lin and Lane, 2017). However, to leverage the advantages of the different algorithms, it may be useful to integrate them into a single method for identifying potential biomarker miRNAs. Besides, little work exists on multi-class classification of diverse cancer types using NGS data. These two facts motivated us to develop the method described in this paper, which can not only classify 10 types of cancer (bladder, breast, colon, glioblastoma, head and neck squamous cell, kidney renal clear cell, lung adenocarcinoma, lung squamous cell, ovarian, and uterine corpus endometrial carcinoma) but also find putative miRNAs that are highly associated with these cancer types. The proposed two-part wrapper-based feature selection method, referred to as the stochastic covariance evolutionary strategy with forward selection (SCES-FS), uses stochastic neighbor embedding (SNE) (Hinton and Roweis, 2003) in conjunction with the covariance matrix adaptation evolutionary strategy (CMA-ES) (Hansen et al., 2003) and a simple classifier, either random forest (RF) (Breiman, 2001), support vector machine (SVM) (Cortes and Vapnik, 1995), naive Bayes (NB) classifier (George and Langley, 1995), K-nearest-neighbors (K-NN) classifier (Altman, 1992), or decision tree (DT) (Quinlan, 1986), in the first part. Here SNE is used to reorder the features by performing an implicit clustering, such that neighboring features are highly correlated. Then, from these clusters of features, a subset of features is selected randomly in order to perform the multi-class classification task for the diverse cancer types. However, as the features are randomly selected, this classification task is treated as an underlying optimization problem for CMA-ES to find the features automatically. Hence, the final set of features/miRNAs is obtained by using forward selection (Whitney, 1971).
In the second part of the method, survival analysis is performed using Cox regression (Cox, 1972), where the levels of miRNA expression and corresponding clinical data are used. The experiment is conducted with data collected from The Cancer Genome Atlas (TCGA)1 for 10 different types of cancer. The performance of the proposed wrapper-based feature selection method is compared with the following methods in terms of classification accuracy, with the top 17 miRNAs selected as putative biomarkers: ensemble SVM-recursive feature elimination (ESVM-RFE) (Anaissi et al., 2016), the least absolute shrinkage and selection operator (LASSO) (Tibshirani, 1996), the non-dominated sorting genetic algorithm II-based stacked ensemble (NSGA-II-SE) (Saha et al., 2017), the SVM-wrapped multi-objective genetic algorithm (MOGA) (Mukhopadhyay and Maulik, 2013), SVM-based novel recursive feature elimination (SVM-nRFE) (Peng et al., 2009), SVM recursive feature elimination (SVM-RFE) (Guyon et al., 2002), conditional mutual information (CMIM) (Fleuret, 2004), interaction capping (ICAP) (Jakulin, 2005), smoothly clipped absolute deviation (SCAD) (Fan and Li, 2001), joint mutual information (JMI) (Bennasar et al., 2015), conditional infomax feature extraction (CIFE) (Brown et al., 2012), minimum redundancy maximum relevance (mRMR) (Peng et al., 2005), feature selection with Cox regression (FSCOX) (Kim et al., 2014), double-input symmetrical relevance (DISR) (Brown et al., 2012), signal-to-noise ratios (SNRs) (Mishra and Sahu, 2011), and the Wilcoxon rank-sum test (RankSum) (Troyanskaya et al., 2002). Thereafter, the significance of the 17 selected miRNAs to 10 different cancer types is determined using Cox regression analysis. Finally, survival analysis, network analysis, expression analysis using hierarchical clustering in the form of heatmaps, KEGG pathway analysis (Kanehisa and Goto, 2000), gene ontology (GO) enrichment analysis (Kuleshov et al., 2016), and protein-protein interaction (PPI) network analysis (Szklarczyk et al., 2019) are performed to assess the biological significance of the selected miRNAs. Additionally, a web-based cancer predictor application is developed to predict 10 different types of cancer given the expression of 17 miRNAs.
2. Materials and Methods
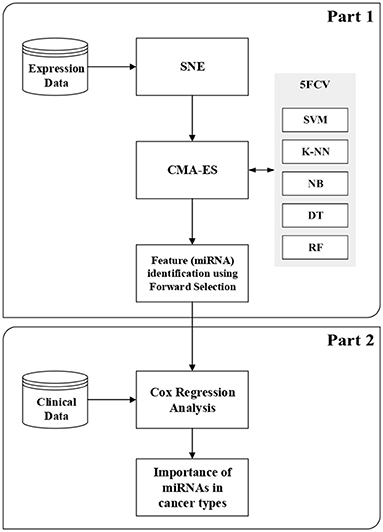
In this section, we briefly describe SNE (Hinton and Roweis, 2003), CMA-ES (Hansen, 2006), and Cox regression analysis (Cox, 1972). More details about classification techniques and feature selection methods are given in the Supplementary Material2 for this article. This section also describes the proposed method, which consists of two parts. The first part is the wrapper-based SCES-FS. In the second part, the selected features, such as expression of miRNAs and clinical data, are used in survival analysis to assess the importance of the selected miRNAs in different types of cancer and to evaluate the effectiveness of the selected miRNAs. Figure 1 shows the flowchart of the proposed method.
2.1. Stochastic Neighbor Embedding
Let denote a set of n observations, where . SNE (Hinton and Roweis, 2003) constructs a low-dimensional embedding that recreates in a space of lower dimension as , where . In SNE, both and are represented as discrete probability distributions P and Q, where
that model pairwise distances between data points. The values of vari ∈ ℝ are adjusted in such a way that the entropies of all distributions Pi are equal.
The mismatch between P and Q is reduced through minimization of Kullback-Leibler (KL) divergence objective , by altering Q with gradient-based optimization methods. Optimization is difficult due to the existence of multiple local optima, and entirely different embeddings may be obtained with different initial Q distributions.
2.2. Covariance Matrix Adaptation Evolution Strategy
Evolutionary strategies are black-box optimization algorithms which belong to a broader group of evolutionary algorithms. In such methods, a set of candidate solutions is maintained. In successive iterations of the procedure, these candidate solutions are perturbed and evaluated, and in each iteration the best solution is left unchanged and carried over to the next set of candidate solutions. CMA-ES (Hansen and Ostermeier, 1996) is an evolutionary strategy where the set of candidate solutions is modeled and sampled from a multivariate Gaussian distribution . The covariance matrix C represents pairwise relationships between attributes. The objective function of CMA-ES maximizes two likelihoods: (a) the likelihood of having the best individuals in previous iterations, and (b) the likelihood of taking the best search steps in previous iterations. At the end of each iteration, (a) guides updates of the mean m as a weighted average of μ best solutions, where is the ith best solution in iteration g + 1 and wi is its weight, and (b) updates the covariance matrix C as follows:
Finally, is a vector that amplifies the updates in favorable directions:
where c1, cμ, cc ∈ ℝ are weights, σ(g) ∈ ℝ is an adaptive step size, which is dependent on the iteration, and z ∈ ℝ is a normalizing constant. Details of the parameters of CMA-ES can be found in Hansen and Ostermeier (1996) and Hansen et al. (2003).
2.3. Cox Regression Analysis
The Cox regression model (Cox, 1972) is a proportional hazards regression model in which the hazard ratio is constant but other contents have the same baseline hazard function. Based on this assumption, the survival function is calculated as
where H0(τ) represents the cumulative baseline hazard function at time τ and S0(τ) = exp(−H0(τ)) is the baseline survival function; H0(τ) is taken to be Breslow's estimator (Breslow, 1974), which is the most widely used and given by
As the Cox model is based on the proportional hazards assumption, it is represented as
for an given instance i = 1, 2, 3, …, n, where the baseline hazard function h0(τ) can be an arbitrary negative function of time, and xi = (xi1, xi2, …, xiD) is the corresponding covariate vector for instance i and is the coefficient vector. The Cox model is a semi-parametric algorithm where the baseline hazard function h0(τ) is unspecified. For any two instances x1 and x2, the hazard ratio is given by
This means that the hazard ratio is independent of the baseline hazard function.
2.4. Wrapper-Based Feature Selection Integrating SNE and CMA-ES
The first part of our proposed method performs the task of miRNA selection for diverse cancer types, which is considered a multi-class classification problem here. SNE is used to reorder the features by performing an implicit clustering such that neighboring features are highly correlated. Then, the underlying multi-class classification task is performed using well-known classifiers and treated as an optimization problem for which CMA-ES is used to find the miRNAs automatically. The miRNAs thus found are further refined using forward selection (FS). Therefore, we call this wrapper-based feature selection method as stochastic covariance evolutionary strategy with forward selection (SCES-FS).
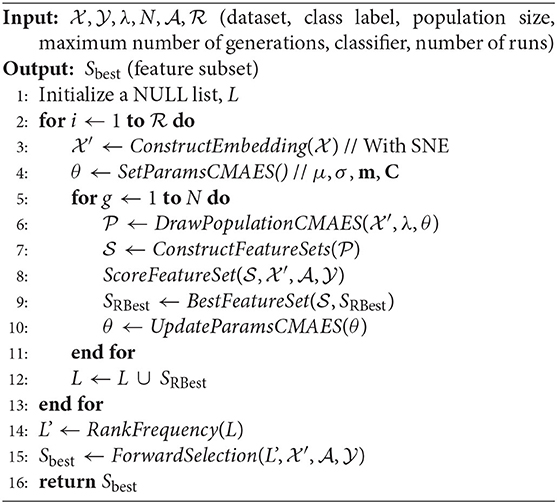
Algorithm 1 presents the SCES-FS method in detail. It starts with the dataset , which denotes a set of n observations with , the class label , the population size λ, the maximum number of generations N, the classifier , and the number of runs as inputs. In the dataset, each feature is characterized by expression levels of the samples. The features of the original dataset are reordered using SNE in the ConstructEmbedding step, producing the embedding dataset whose size is the same as that of the original dataset. The parameters are initialized in the SetParamsCMAES step. The individuals/vectors in CMA-ES are encoded as a simple threshold weight vector, with a single weight for each miRNA. An individual x ∈ ℝH encodes a weight vector w ∈ ℝH and a threshold t ∈ ℝ, where H ≤ D is the number of weights. Only those features whose weights exceed the threshold are eventually selected into a feature set S:
where t ∈ ℝ is a threshold that is chosen carefully. The population of vectors is drawn in the DrawPopulationCMAES step from , where m is the mean, C is the covariance matrix, and σ is the step-size control parameter of CMA-ES. In the ConstructFeatureSets step, each individual xi is translated to a feature set Si according to Equation (8).
In the ScoreFeatureSet step, each feature set is evaluated by training a classifier on a dataset restricted to only the selected features. The objective function of CMA-ES combines the accuracy obtained from the classifier for each individual x and the size of the feature set S as follows:
where D is the dimension of the dataset, Υ is the target number of features, and α ∈ ℝ+ balances the penalty for the excessive number of features. The objective function is designed in this way so that higher classification accuracy can be achieved for a small number of features, and it incorporates L0 regularization term as penalty, which is bounded by Υ in order to have redundancy in selected subsets of features. The optimization with CMA-ES allows inter-feature relationships with covariance matrices. Finally, the parameters are updated according to CMA-ES update rules in the UpdateParamsCMAES step, and the best set of features/miRNAs in a particular run are kept in SRBest.
2.5. Preparation of the Final Set of Features
The SCES-FS is random in nature to reduce the probability of returning sub-optimal solutions. Therefore, a single run of SCES-FS does not guarantee a reliable solution. To overcome this limitation, SCES-FS is executed up to a maximum number of runs, . In each run, a set of best features/miRNAs are collected into a list, L. After completion of the maximum number of runs, RankFrequency sorts the cumulative set of features in descending order according to the frequency of occurrence in each run and produces a modified list, L′. Thereafter, ForwardSelection applies the forward feature selection method, using the classifier to evaluate the feature set iteratively to obtain the best feature set, Sbest.
2.6. Justification for miRNA Selection
Because of the random nature of the algorithm, there is a chance of false positives or false negatives occurring in the selection of miRNAs. To reduce the probability of having false positives or false negatives in the selected set of miRNAs, the SCES-FS algorithm is run 50 times, and then the miRNAs are ranked based on their frequencies of occurrence in 50 different sets of features. Thus, a stable set of miRNAs is selected on the basis of maximum classification accuracy, which is computed by considering the miRNAs cumulatively from the top of the list. By this process, 17 distinct miRNAs are selected.
This procedure does not, however, ensure the absence of false positives or false negatives, so additional measures are taken. The presence of false positives is made unlikely by the sorting procedure. In fact, since a given false positive is supposed to occur less frequently than all the true positives, it will appear in the tail after sorting. Consequently, it is likely that this false positive will be filtered out when selecting the final list of miRNAs. On the other hand, the presence of false negatives is related to the choice of the number of runs and the corresponding expected number of miRNAs belonging to the sorted list. In this regard, a mathematical argument is given below to justify that the SCES-FS does not exhibit random behavior.
Suppose that at each run the SCES-FS randomly selects 10 miRNAs from the whole collection of miRNAs. We first compute the expected number of distinct miRNAs reported after all the runs, and then we compare this number with the results of our experiments. We have the following parameters: D = 199 is the number of miRNAs, S = 10 is the number of miRNAs returned after each run, and is the number of runs. For i = 1, …, D, let Vi be a Bernoulli-distributed indicator variable, where Vi = 1 if the miRNA mi never shows up. The probability that mi is selected in one run is S/D, so the probability that it is never selected is 1−S/D. Since each of the runs is independent, the following equation can be written:
Let be the random variable that counts the number of miRNAs that do not belong to the final set of miRNAs reported at least once. By linearity of the expectation, we obtain the equation
Hence, the number of expected miRNAs reported at least once is
Substituting the above-mentioned values for the parameters, we obtain that
• the expected number of miRNAs reported at least once after 50 iterations is 183; and
• the number of new miRNAs added in a further iteration would be 1.
As the number of sorted miRNAs in our experiment is 39 (see the Supplementary Material), this difference suggests that 50 runs are enough to conclude that all the true positives are included in the sorted list and so false negatives are unlikely.
2.7. Cox Regression Analysis for Evaluating miRNAs
The second part of the proposed method is for the evaluation of selected miRNAs using Cox regression analysis. The primary objective of this stage is to assess the importance of the miRNAs selected in the first part of the method, and this is done using Cox regression analysis for survival in 10 different cancer types. Expression data of the selected miRNAs and the associated clinical data are used for the Cox regression analysis. In the clinical data, the vital status of each patient, indicating whether the patient is still alive or has died, and the number of days since the last followup are taken into account when performing the survival analysis. Based on the expression levels and the clinical data of the selected miRNAs in each cancer type, the Cox coefficient, hazard ratio, and p-value are computed. A higher value of the Cox coefficient signifies greater importance of that miRNA to the respective cancer type. Moreover, the up- and down-regulation of all the selected miRNAs are observed to understand their behavior with respect to that particular cancer type based on change in expression in tumor and normal samples.
2.8. Complexity Analysis
Let D be the number of features and n the number of samples in the input dataset. As the available approximations may considerably lower the overall complexity, we discuss the complexity of each building block separately. A single step of SNE requires computing relations between all data points. We embed a transposed dataset, making an optimization step in O(D2) time. Computing SNE usually involves performing principal component analysis for preliminary dimension reduction, though its cost is negligible. The internal complexity of CMA-ES is estimated as O(D2), due to sampling and updating of the covariance matrix. The matrix needs to be factorized, which can be done by eigen decomposition in O(D3) time. Factorization does not happen in every generation, which gives O(D2) amortized time. Empirical evidence suggests that the sufficient number of objective function evaluations usually scales sub-quadratically with D (Ros and Hansen, 2008). The computation time is similar, since the vast majority of it is time spent training similar classifiers. On the other hand, the time complexity of Cox regression analysis is O(nD2) for a single run (Kelley, 1999).
3. Results and Discussion
The performance of the proposed method (SCES-FS) was tested on real miRNA expression datasets for 10 different cancer types and compared with the results of 16 existing methods, namely ESVM-RFE (Anaissi et al., 2016), LASSO (Tibshirani, 1996), NSGA-II-SE (Saha et al., 2017), MOGA (Mukhopadhyay and Maulik, 2013), SVM-nRFE (Peng et al., 2009), SVM-RFE (Guyon et al., 2002), CMIM (Fleuret, 2004), ICAP (Jakulin, 2005), SCAD (Fan and Li, 2001), JMI (Bennasar et al., 2015), CIFE (Brown et al., 2012), mRMR (Peng et al., 2005), FSCOX (Kim et al., 2014), DISR (Brown et al., 2012), SNRs (Mishra and Sahu, 2011), and RankSum (Troyanskaya et al., 2002) (see section 1 for the full names of these methods), as well as the results with all features (i.e., without feature selection).
3.1. Dataset Preparation and Parameter Setting
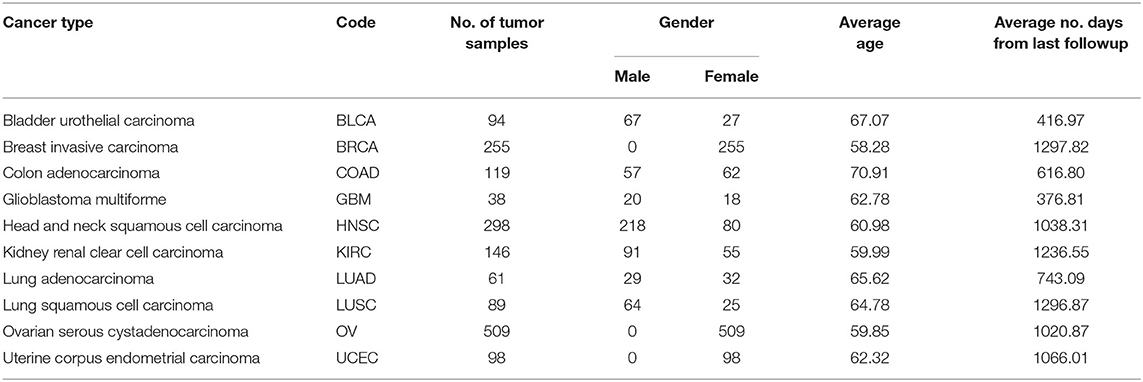
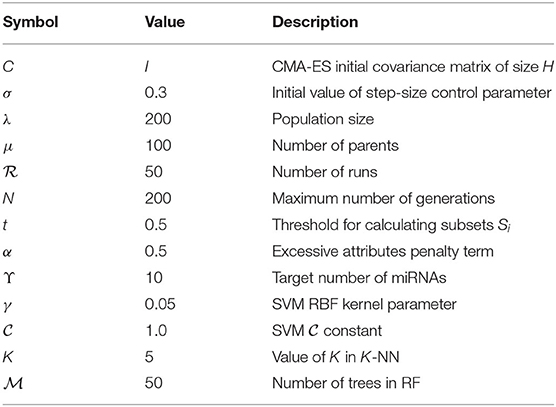
The miRNA expression and clinical datasets of bladder, breast, colon, glioblastoma, head and neck squamous cell, kidney renal clear cell, lung adenocarcinoma, lung squamous cell, ovarian, and uterine corpus endometrial carcinoma were obtained from TCGA. These 10 cancer types have also been studied previously (see, e.g., Jacobsen et al., 2013). Moreover, Hoadley et al. (2018) found that the characteristics of certain cancers out of 33 types provided in TCGA are overlapping in nature. As a result, 10–15 distinct groups of cancer were reported in Hoadley et al. (2018), which are similar to the cancer types studied in the present article. Our choice of cancer types was based on: (1) careful review of the literature, (2) the availability of tissue-specific tumor and normal samples to avoid the class imbalance problem in classification, and (3) the availability of common miRNA expression data for different cancer types and their corresponding clinical data. Thus, 10 cancer types were selected for our study. The expression data were generated using an Illumina high-throughput sequencing machine in the form of read counts of 199 miRNAs, normalized to reads per million, while the clinical data contain gender, age, days since last followup, and vital status. After removing miRNAs that contain more than 60% zeros in each cancer type and taking the miRNAs common to all the cancer types, we found 199 miRNAs and considered their expression in different cancer types. The number of samples and other details for each cancer type are given in Table 1; we also included 333 normal samples in the analysis with the expression of same miRNAs. For convenience, the expression datasets containing reads per million are further normalized onto a log2 scale. These processed datasets can be downloaded from the Supplementary Material website3. To construct the final ranking of miRNAs, the SCES-FS algorithm was run 50 times. Five-fold cross-validation was applied during each classification to avoid the issue of overfitting or underfitting. The parameters used in the experiments are shown in Table 2 and were obtained either experimentally or from the literature (Latinne et al., 2001; Oshiro et al., 2012; Hansen, 2016).
3.2. Experimental Outcomes
The problem of finding miRNAs that can correctly distinguish different cancer types were posed as a multi-class classification task using expression data of miRNAs, and the importance of the selected miRNAs was evaluated using Cox regression analysis with the help of clinical data. The classification results of SCES-FS using the classifiers RF, SVM, NB, K-NN, and DT over 50 runs are reported in Table 3 and compared with the results of ESVM-RFE, LASSO, NSGA-II-SE, MOGA, SVM-nRFE, SVM-RFE, CMIM, ICAP, SCAD, JMI, CIFE, mRMR, FSCOX, DISR, SNR, and RankSum, as well as the results with all features (i.e., without feature selection). These results show that SCES-FS with RF achieved the highest classification accuracy, 96.881, with a standard deviation of 0.039, while the accuracy results of SCES-FS with SVM, NB, K-NN, and DT are 96.332 ± 0.194, 96.251 ± 0.168, 96.132 ± 0.369, and 94.232 ± 0.057, respectively, still better than those of the other existing feature selection methods.
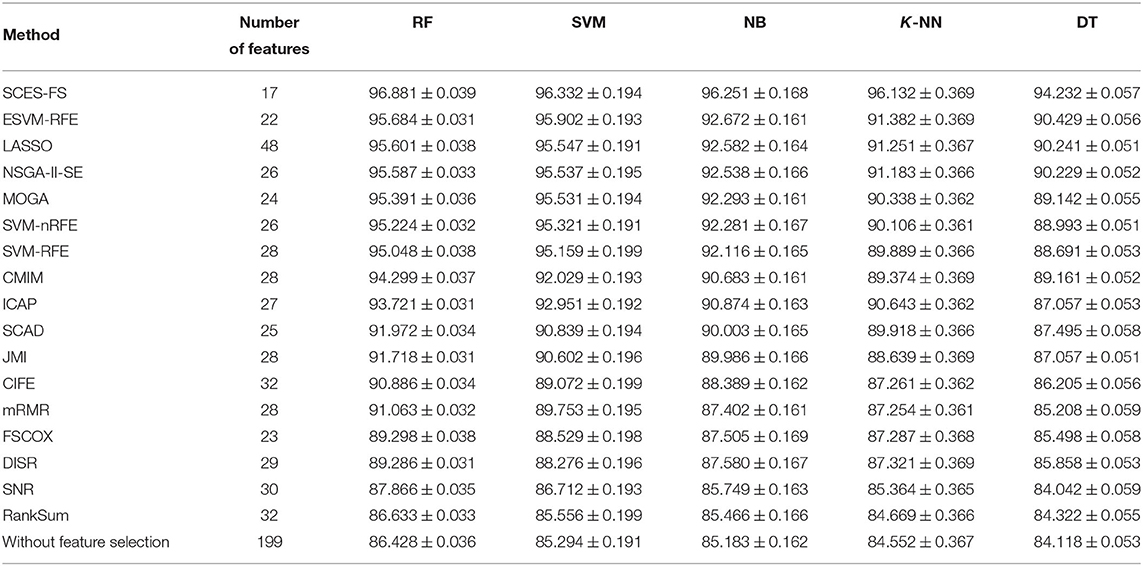
Table 3. Number of features and classification accuracy of feature selection methods for five classifiers with five-fold cross-validation.
It is to be noted that our results have been verified with FSCOX, which computes important miRNAs via Cox regression on all miRNAs and subsequently uses them for the classification. It has been observed that the overall classification accuracy of FSCOX is less than the accuracy attained by SCES-FS as reported in Table 3. Other omics-based analyses, such as protein array, copy number variation (CNV), and methylation studies, also have potential applications in pan-cancer classification, as explained in Zhang et al. (2015, 2016, 2019), where the overall accuracy achieved in the range of 93–97%. The cancer dataset used in Zhang et al. (2015, 2016, 2019) was carefully selected for protein array, CNV, and methylation studies and is not directly suitable for experimenting with miRNAs, as it creates a class imbalance problem when selecting miRNA expression data for both tumor and normal cases. However, the overall accuracy of our method is higher than 96%, which is on the higher side of the accuracy range reported by Zhang et al. (2015, 2016, 2019), suggesting that our selected miRNAs can also be considered potential markers for pan-cancer classification.
The results of SCES-FS have been further validated by survival analysis, including Cox regression, network analysis, expression analysis using hierarchical clustering in the form of heatmaps, KEGG pathway analysis, GO enrichment analysis, and PPI network analysis, as described in the following.
3.2.1. Survival Analysis
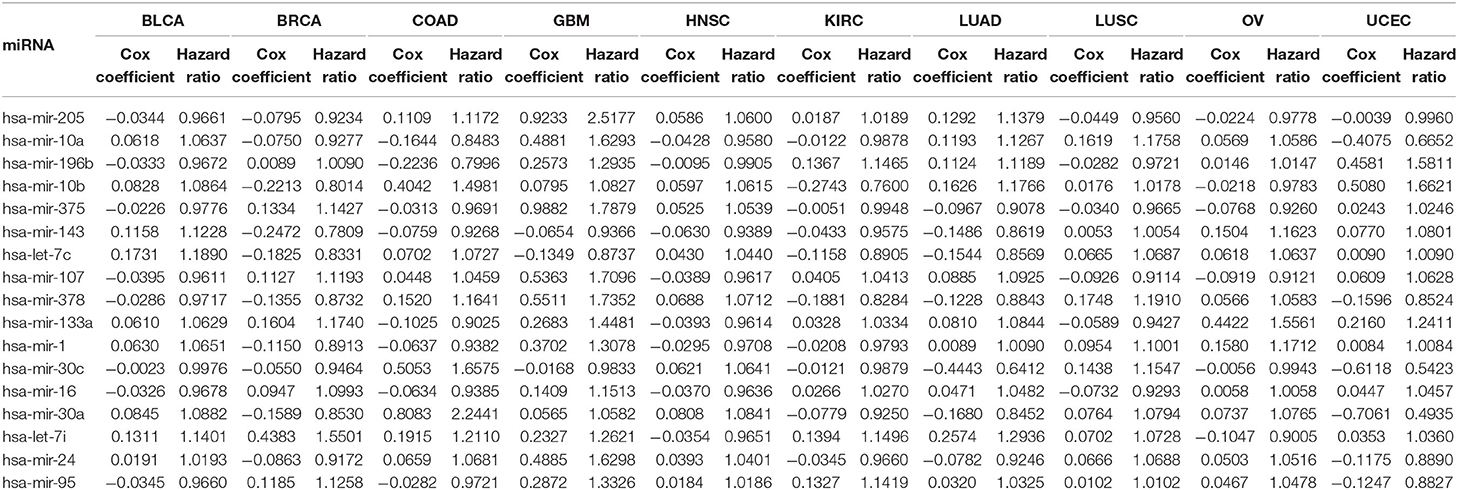
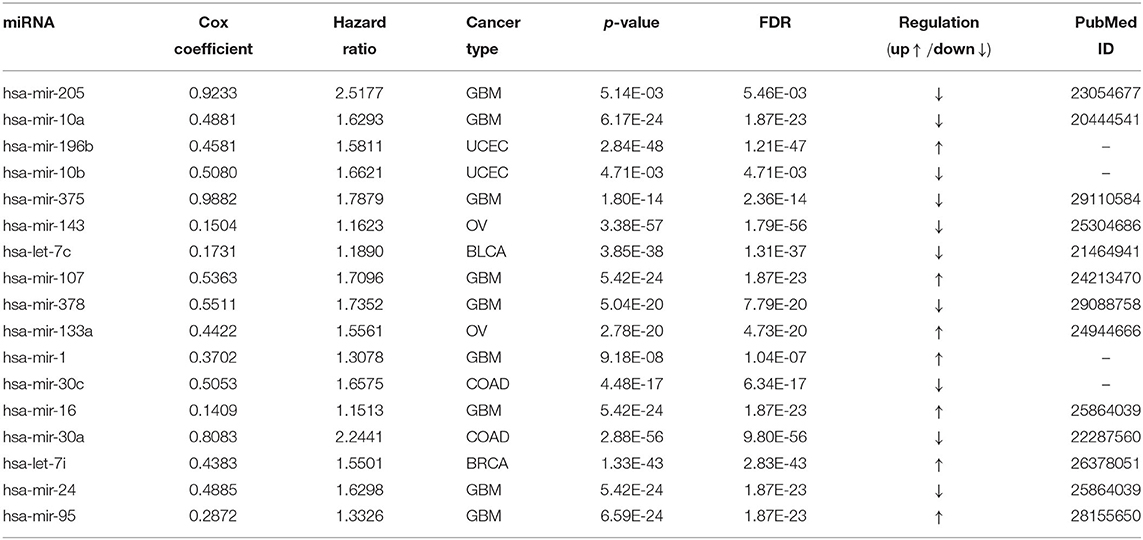
Table 4 reports the results of the Cox regression analysis, i.e., the Cox coefficient and hazard ratio values, for 10 cancer types in order to evaluate the importance of the 17 selected miRNAs with respect to these cancer types. The Cox regression analysis was performed by integrating the miRNA expression and clinical data to assess the effect of miRNA expression on cancer survival. Higher Cox coefficient and hazard ratio values indicate greater influence of the miRNA on the cancer type. For example, the miRNA hsa-mir-375 has the highest Cox coefficient, 0.9882, and hazard ratio, 1.7879, for the GBM cancer type. To help visualize the importance of each miRNA to the different cancer types, a circos plot of Table 4 is shown in Figure 2. In the figure, a broader band signifies a stronger association between the miRNA and the particular cancer type. Table 5 summarizes the cancer types that are most highly associated with the selected miRNAs. In this table, for each miRNA, the cancer type for which that miRNA has the highest Cox coefficient is shown, along with the associated p-value, false discovery rate (FDR), and up- or down-regulation of the miRNA expression in that cancer type. Similarly, Supplementary Table 2 gives the up- and down-regulations along with the corresponding FDR values of the selected miRNAs for all cancer types. The up- and down-regulations of the miRNAs are computed after evaluating the change in expression of the selected miRNAs between tumor samples and normal samples or the population for a particular cancer type using the ANOVA test; this is discussed further in section 3.2.3. Here, the change in expression is considered significant if the p < 0.05, and the up- or down-regulation is computed if the change in population expression is positive or negative, respectively. In summary, we find that hsa-mir-205, hsa-mir-10a, hsa-mir-196b, hsa-mir-10b, hsa-mir-375, hsa-mir-143, hsa-let-7c, hsa-mir-107, hsa-mir-378, hsa-mir-133a, hsa-mir-1, hsa-mir-30c, hsa-mir-16, hsa-mir-30a, hsa-let-7i, hsa-mir-24, and hsa-mir-95 are highly associated with GBM, UCEC, OV, BLCA, COAD, and BRCA.
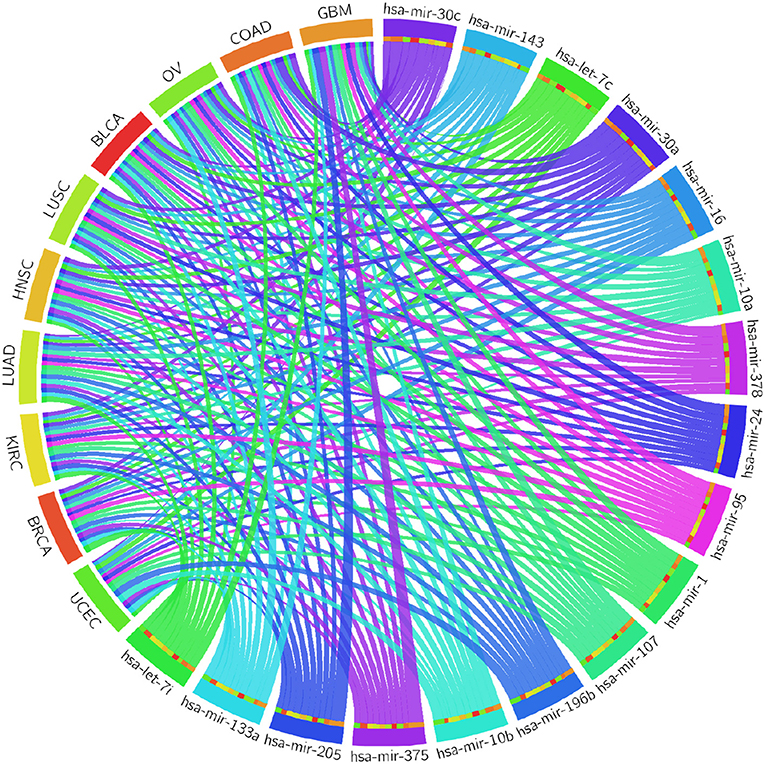
Figure 2. Circos plot of Cox regression analysis results: Cox coefficient values are used to graphically visualize the association of 17 miRNAs with ten cancer types; a broader band signifies a stronger association between the miRNA and the particular cancer type.
3.2.2. Network Analysis
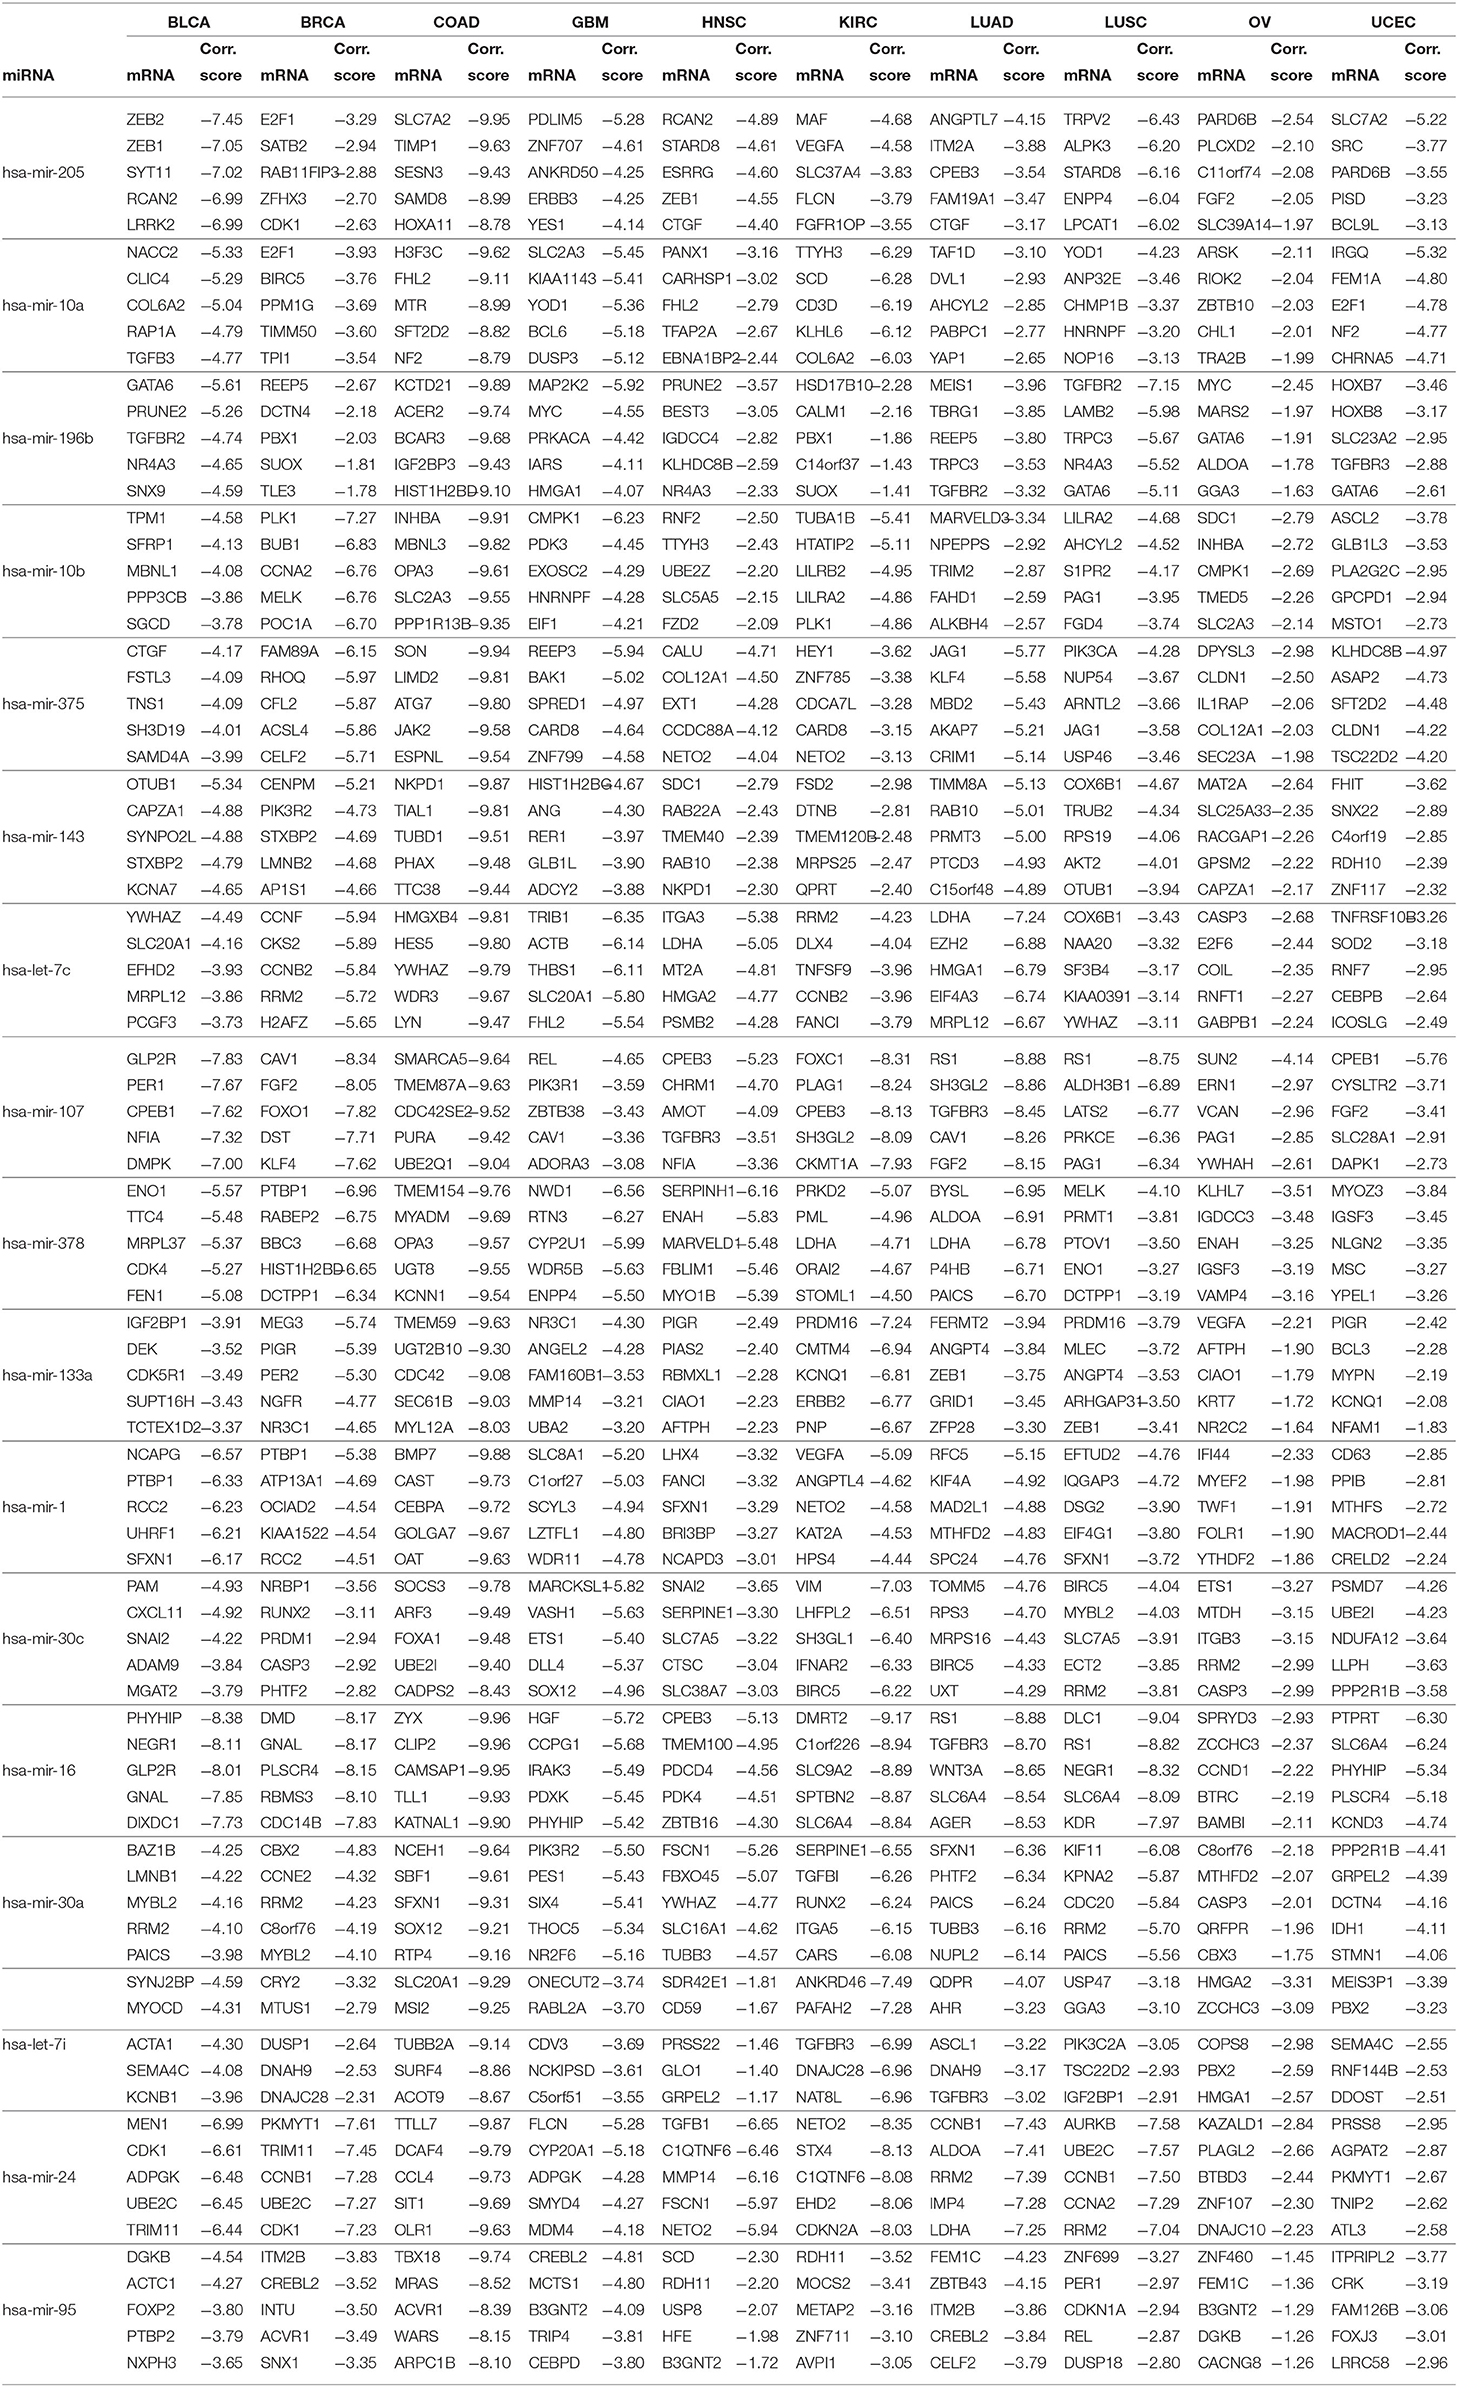
For the 17 selected miRNAs, miRTarBase (Huang et al., 2020) was used to find their targets in order to elucidate their role in the different cancer types. To identify the most correlated targets, we computed the Pearson correlation between the expression values of miRNAs and mRNAs obtained from TCGA for the 10 cancer types and took the negative correlation value used in Zhou et al. (2015) as indicating strong association. The top five negatively correlated mRNAs associated with each of the 17 miRNAs are reported in Table 6; the rest are reported in Supplementary Material. To construct the interaction network, the miRNAs and their targets were ranked based on the cumulative negative correlation score and their presence in different cancer types as indicated by the association number. These results are reported in Supplementary Table 3. For example, hsa-mir-16 and its target, PHYHIP, are related to six cancer types and the cumulative negative correlation score is −4.142. Similarly, hsa-mir-24 is correlated with C1QTNF6 in another six cancer types, with a cumulative negative correlation score of −3.906. The subset of such targeted mRNAs is used to construct the interaction network shown in Figure 3. The network reveals that the miRNAs hsa-mir-205, hsa-mir-10a, hsa-mir-107, hsa-mir-378, and hsa-mir-16 and their targets {CYR61, STARD8, TNFSF8}, {TTYH3, CARHSP1, LILRA2}, {CPEB3, TGFBR3, FGF2}, {NME4, NWD1, ORAI2}, and {PHYHIP, CPEB3, CTDSPL} play a crucial role in different types of cancer. The red, blue, pink, dark green, light green, and black edges in Figure 3 signify that the number of cancer types associated with the corresponding pair of miRNA and target mRNA is 6, 5, 4, 3, 2, and 1, respectively. The targets of the miRNAs are investigated further using KEGG pathway, GO enrichment, and PPI network analysis in the following subsections in order to see their impact on the different types of cancer.
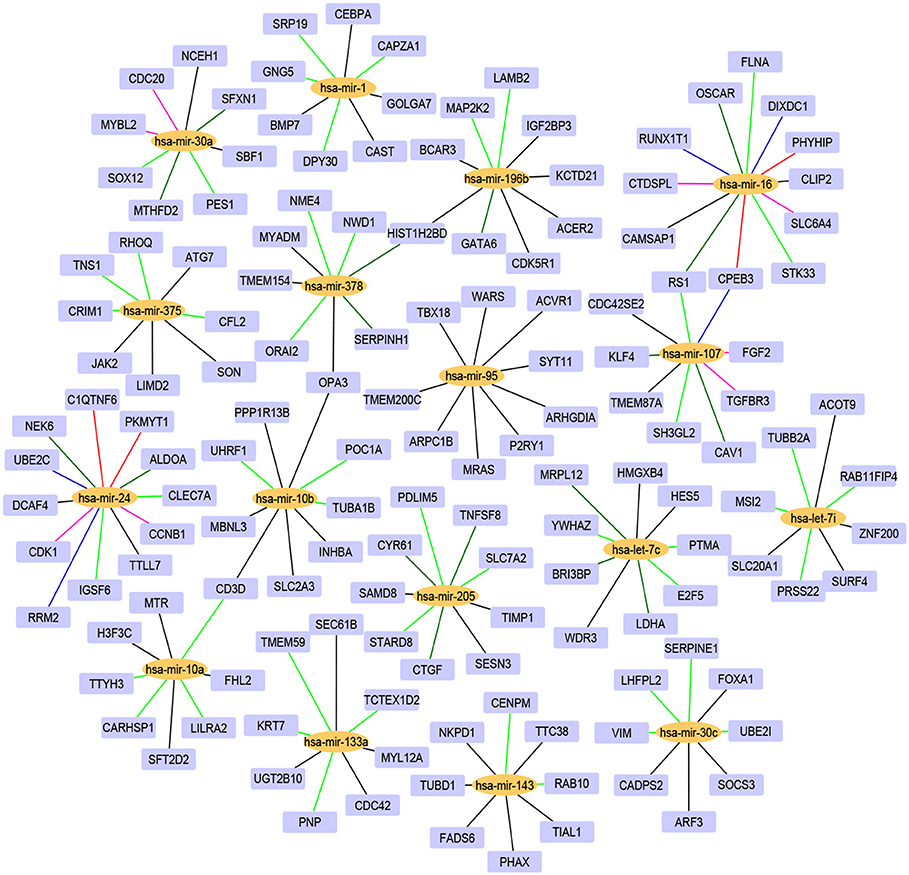
Figure 3. The interaction network of miRNAs and their target genes, where yellow nodes represent miRNAs and purple nodes represent genes. The edge colors red, blue, pink, dark green, light green, and black indicate that the corresponding miRNA-gene pair is associated with 6, 5, 4, 3, 2, and 1 cancer types, respectively.
3.2.3. Expression Analysis
Expression analysis was conducted using a one-way ANOVA test in order to evaluate the statistical significance of the differential expression of the 17 selected miRNAs. Alternative techniques can also be used (Conesa et al., 2016; Costa-Silva et al., 2017; Crow et al., 2019). To perform the test, the population of patients was divided into tumor and normal groups for a given miRNA in a particular cancer type. As a result of ANOVA, significant (p < 0.05) changes in expression were observed between the tumor and normal groups for the 17 selected miRNAs. For example, the p-values of hsa-mir-10a, hsa-mir-196b, hsa-mir-10b, hsa-mir-375, hsa-mir-143, hsa-let-7c, hsa-mir-107, hsa-mir-378, hsa-mir-133a, and hsa-mir-30c were 6.17E-24, 2.84E-48, 4.71E-03, 1.80E-14, 3.38E-57, 3.85E-38, 5.42E-24, 5.04E-20, 2.78E-20, and 4.48E-17 respectively. Additionally, box plots of the selected miRNAs in tumor and normal samples are provided in Supplementary Figure 3. To investigate the relationship between the expression levels of miRNAs for each cancer type, hierarchical clustering was performed on the tumor and normal samples of the 17 selected miRNAs. The results are shown in Figure 4, from which the change in expression levels of the miRNAs between tumor and normal samples is evident. In the cluster plots, red indicates high expression levels and green low expression levels; black corresponds to not significantly expressed samples.
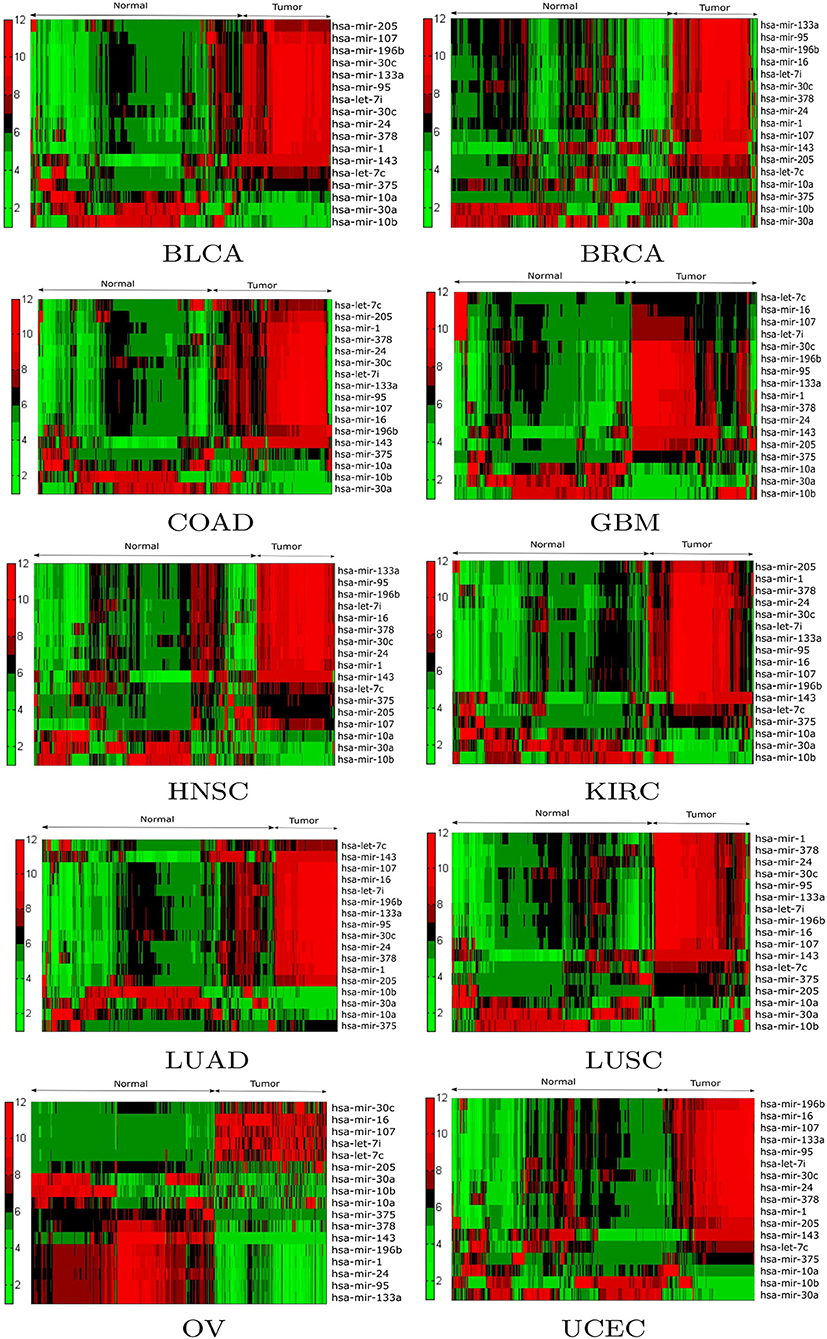
Figure 4. Hierarchical clustering results of the differentially expressed miRNAs for the BLCA, BRCA, COAD, GBM, HNSC, KIRC, LUAD, LUSC, OV, and UCEC datasets. Red indicates high expression levels, green low expression levels, and black not significantly expressed samples.
3.2.4. KEGG Pathway Analysis
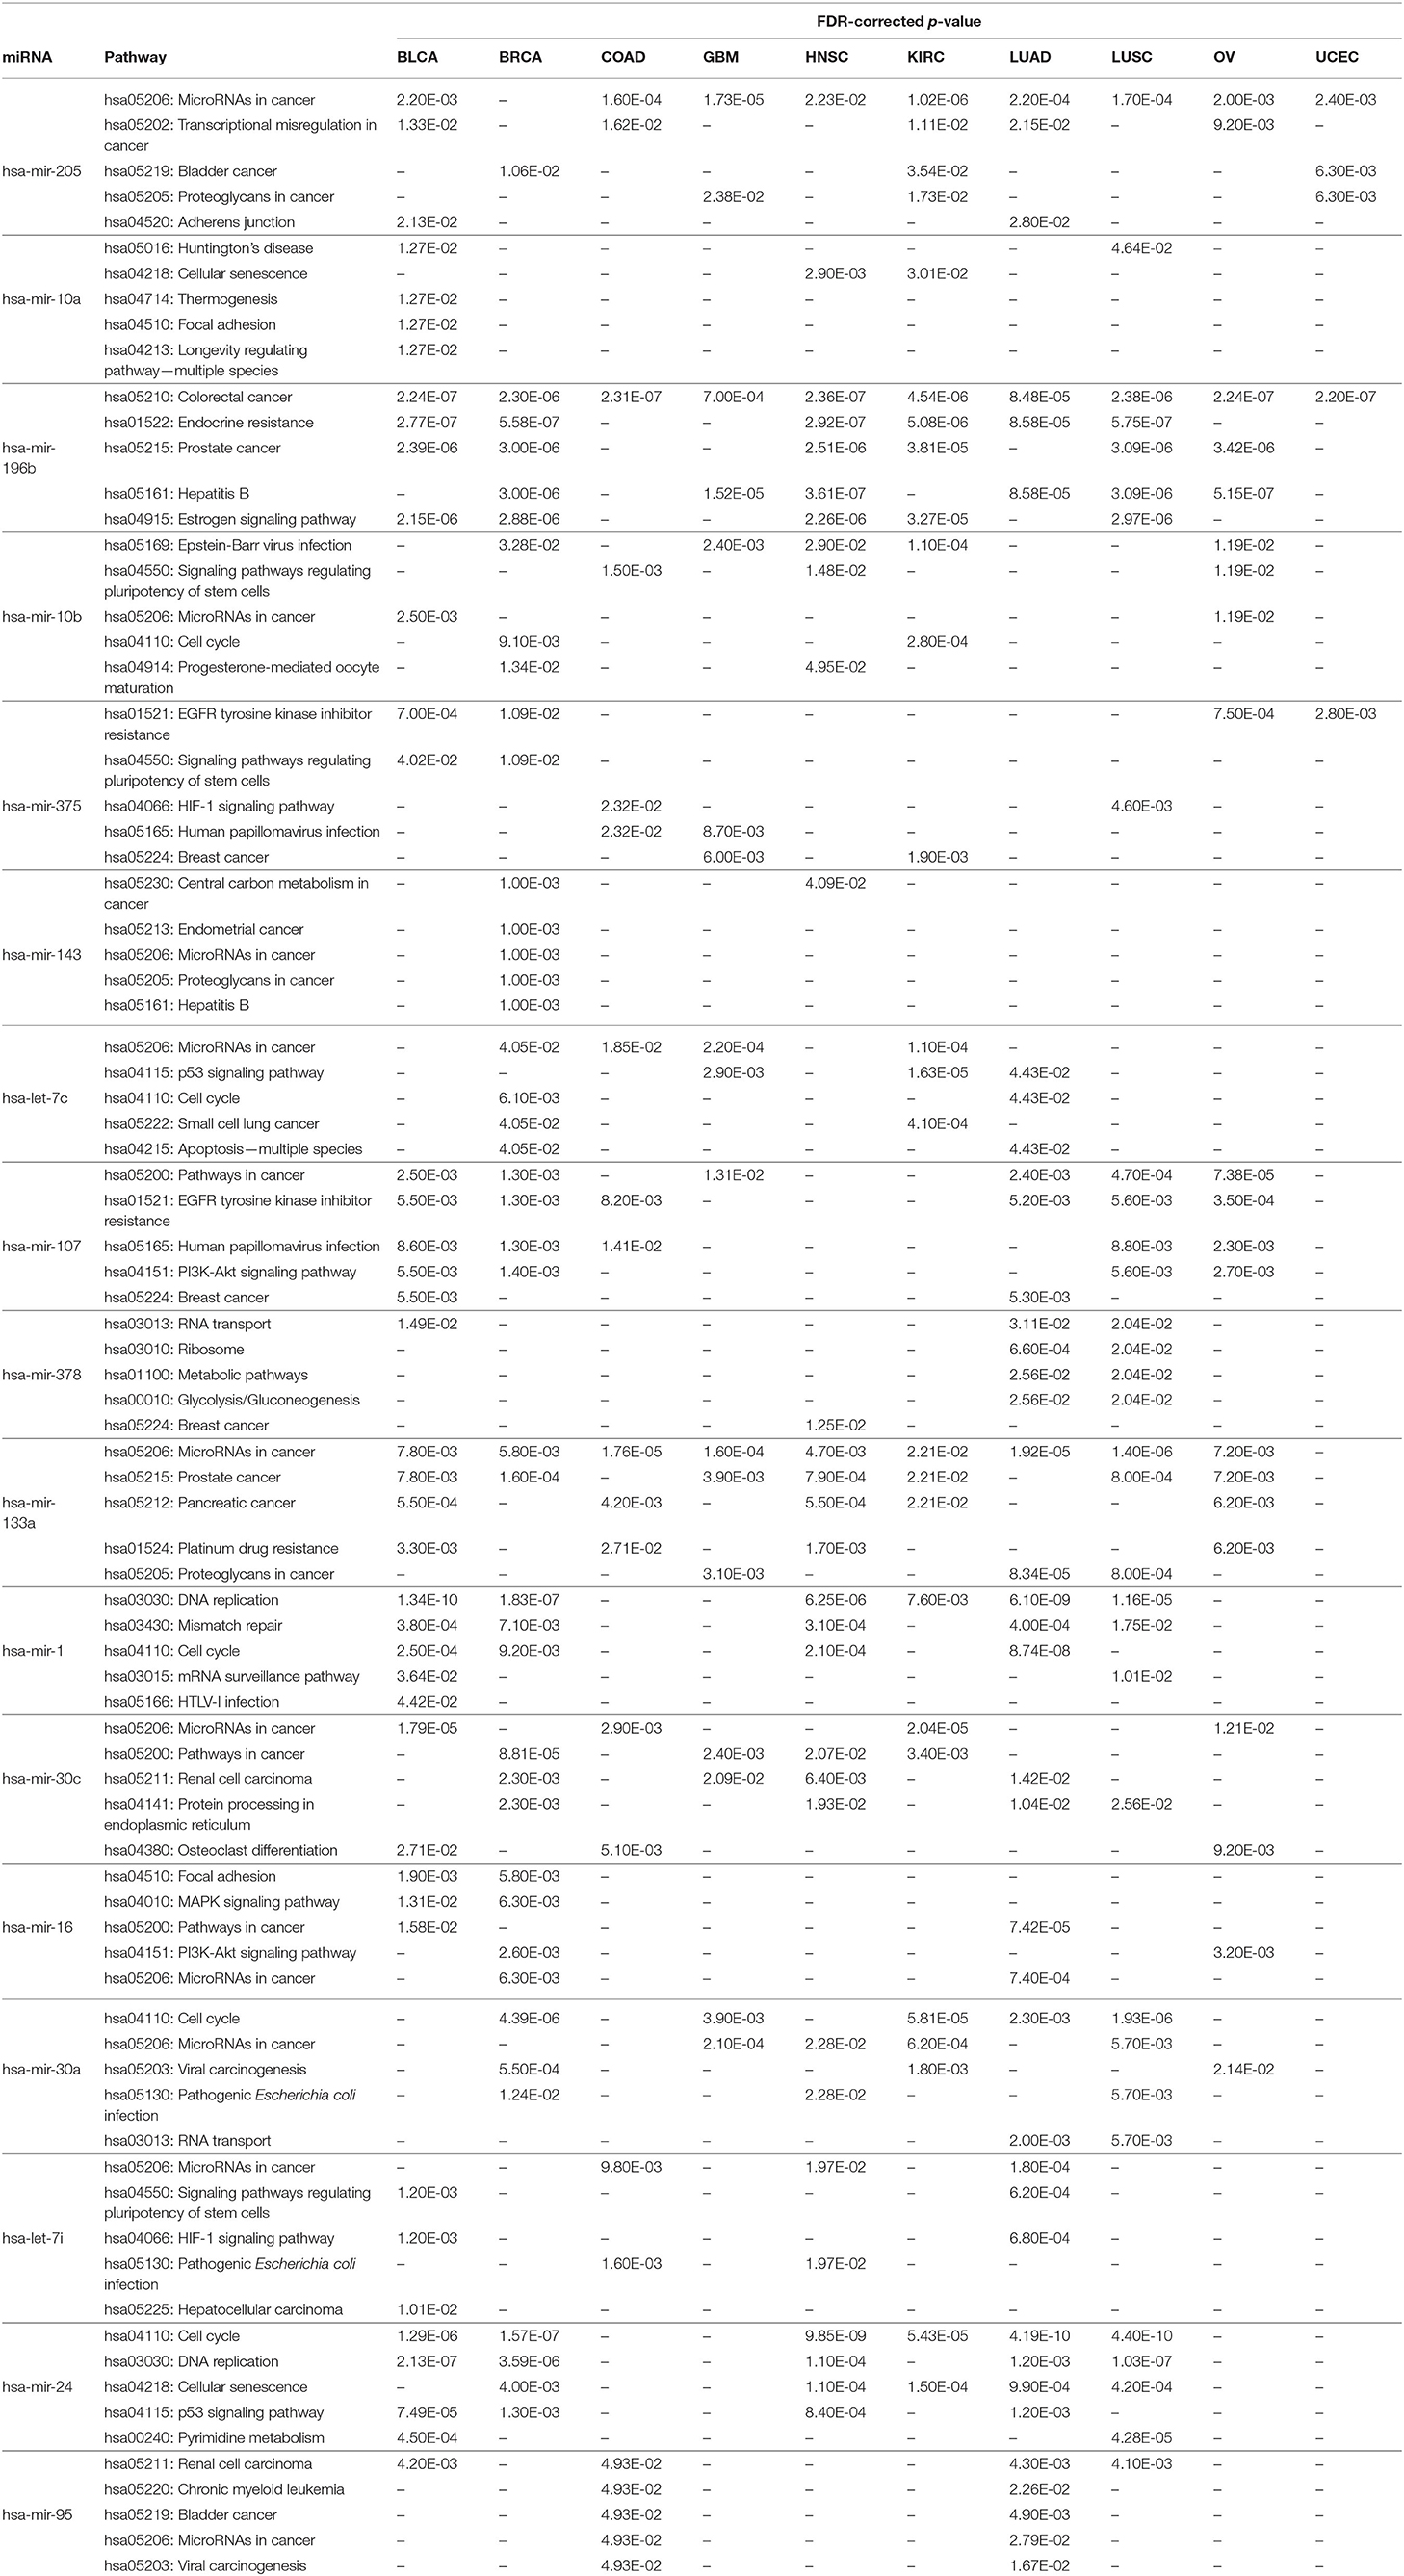
In order to perform KEGG pathway analysis for the 17 selected miRNAs in 10 cancer types, their targets were identified based on negative correlation values as described in section 3.2.2. Then, these target mRNAs were used in the DIANA tool (Vlachos et al., 2015) separately to identify significant KEGG pathways associated with the selected miRNAs in different cancer types. The five most significant pathways for each of the 17 miRNAs according to the FDR-corrected p-value within 5% statistical significance for the different cancer types are reported in Table 7. The detailed pathways of the 17 miRNAs with all their targets are presented in Supplementary Material. It can be seen from Table 7 that the most significantly enriched pathways are involved in various cancer types. For example, hsa-mir-205 and hsa-mir-133a are found to be enriched in pathways relating to hsa05206: MicroRNAs in cancer for nine cancer types. Similarly, hsa-mir-196b is found to be enriched in the pathway of hsa05210: Colorectal cancer for all 10 cancer types, with the FDR-corrected p-values of BLCA, BRCA, COAD, GBM, HNSC, KIRC, LUAD, LUSC, OV, and UCEC being 2.24E-07, 2.30E-06, 2.31E-07, 7.00E-04, 2.36E-07, 4.54E-06, 8.48E-05, 2.38E-06, 2.24E-07, and 2.20E-07, respectively. In addition, critical pathways such as the PI3K-Akt signaling pathway, p53 signaling pathway, Bladder cancer, Pancreatic cancer, Prostrate cancer, and Lung cancer are also found for the 17 miRNAs with FDR-corrected p-values within 5% statistical significance in 10 different cancer types. The presence of such critical pathways for the 17 selected miRNAs suggests that these miRNAs play a significant role in various cancer types, including the 10 types considered in this paper.
3.2.5. Gene Ontology Enrichment Analysis
Similar to the KEGG pathway analysis, GO enrichment analysis was also performed with the targets of the selected miRNAs using the Enrichr tool (Kuleshov et al., 2016), to assess the significance of the roles the selected miRNAs play in different biological activities. The results of different analyses for biological processes, molecular functions, and cellular components are reported in Table 8 and in Supplementary Tables 4, 5, respectively; the details of the enrichment analysis are also given in Supplementary Material. In Table 8, we see that various biological process GO terms which are related to the targets of the 17 selected miRNAs have important roles in cancer development. For example, GO:0023051 is linked with regulation of signaling, which is involved in the development of colorectal cancer. Similarly, GO:0051252 is linked with regulation of the RNA metabolic process of bladder urothelial carcinoma, with an FDR-corrected p-value of 1.30E-03, which is <0.05. Other GO terms for biological processes, such as GO:0051171, GO:0048519, and GO:0009653, are linked with the regulation of nitrogen compound metabolic process, negative regulation of biological process, and anatomical structure morphogenesis, respectively, for different cancer types.
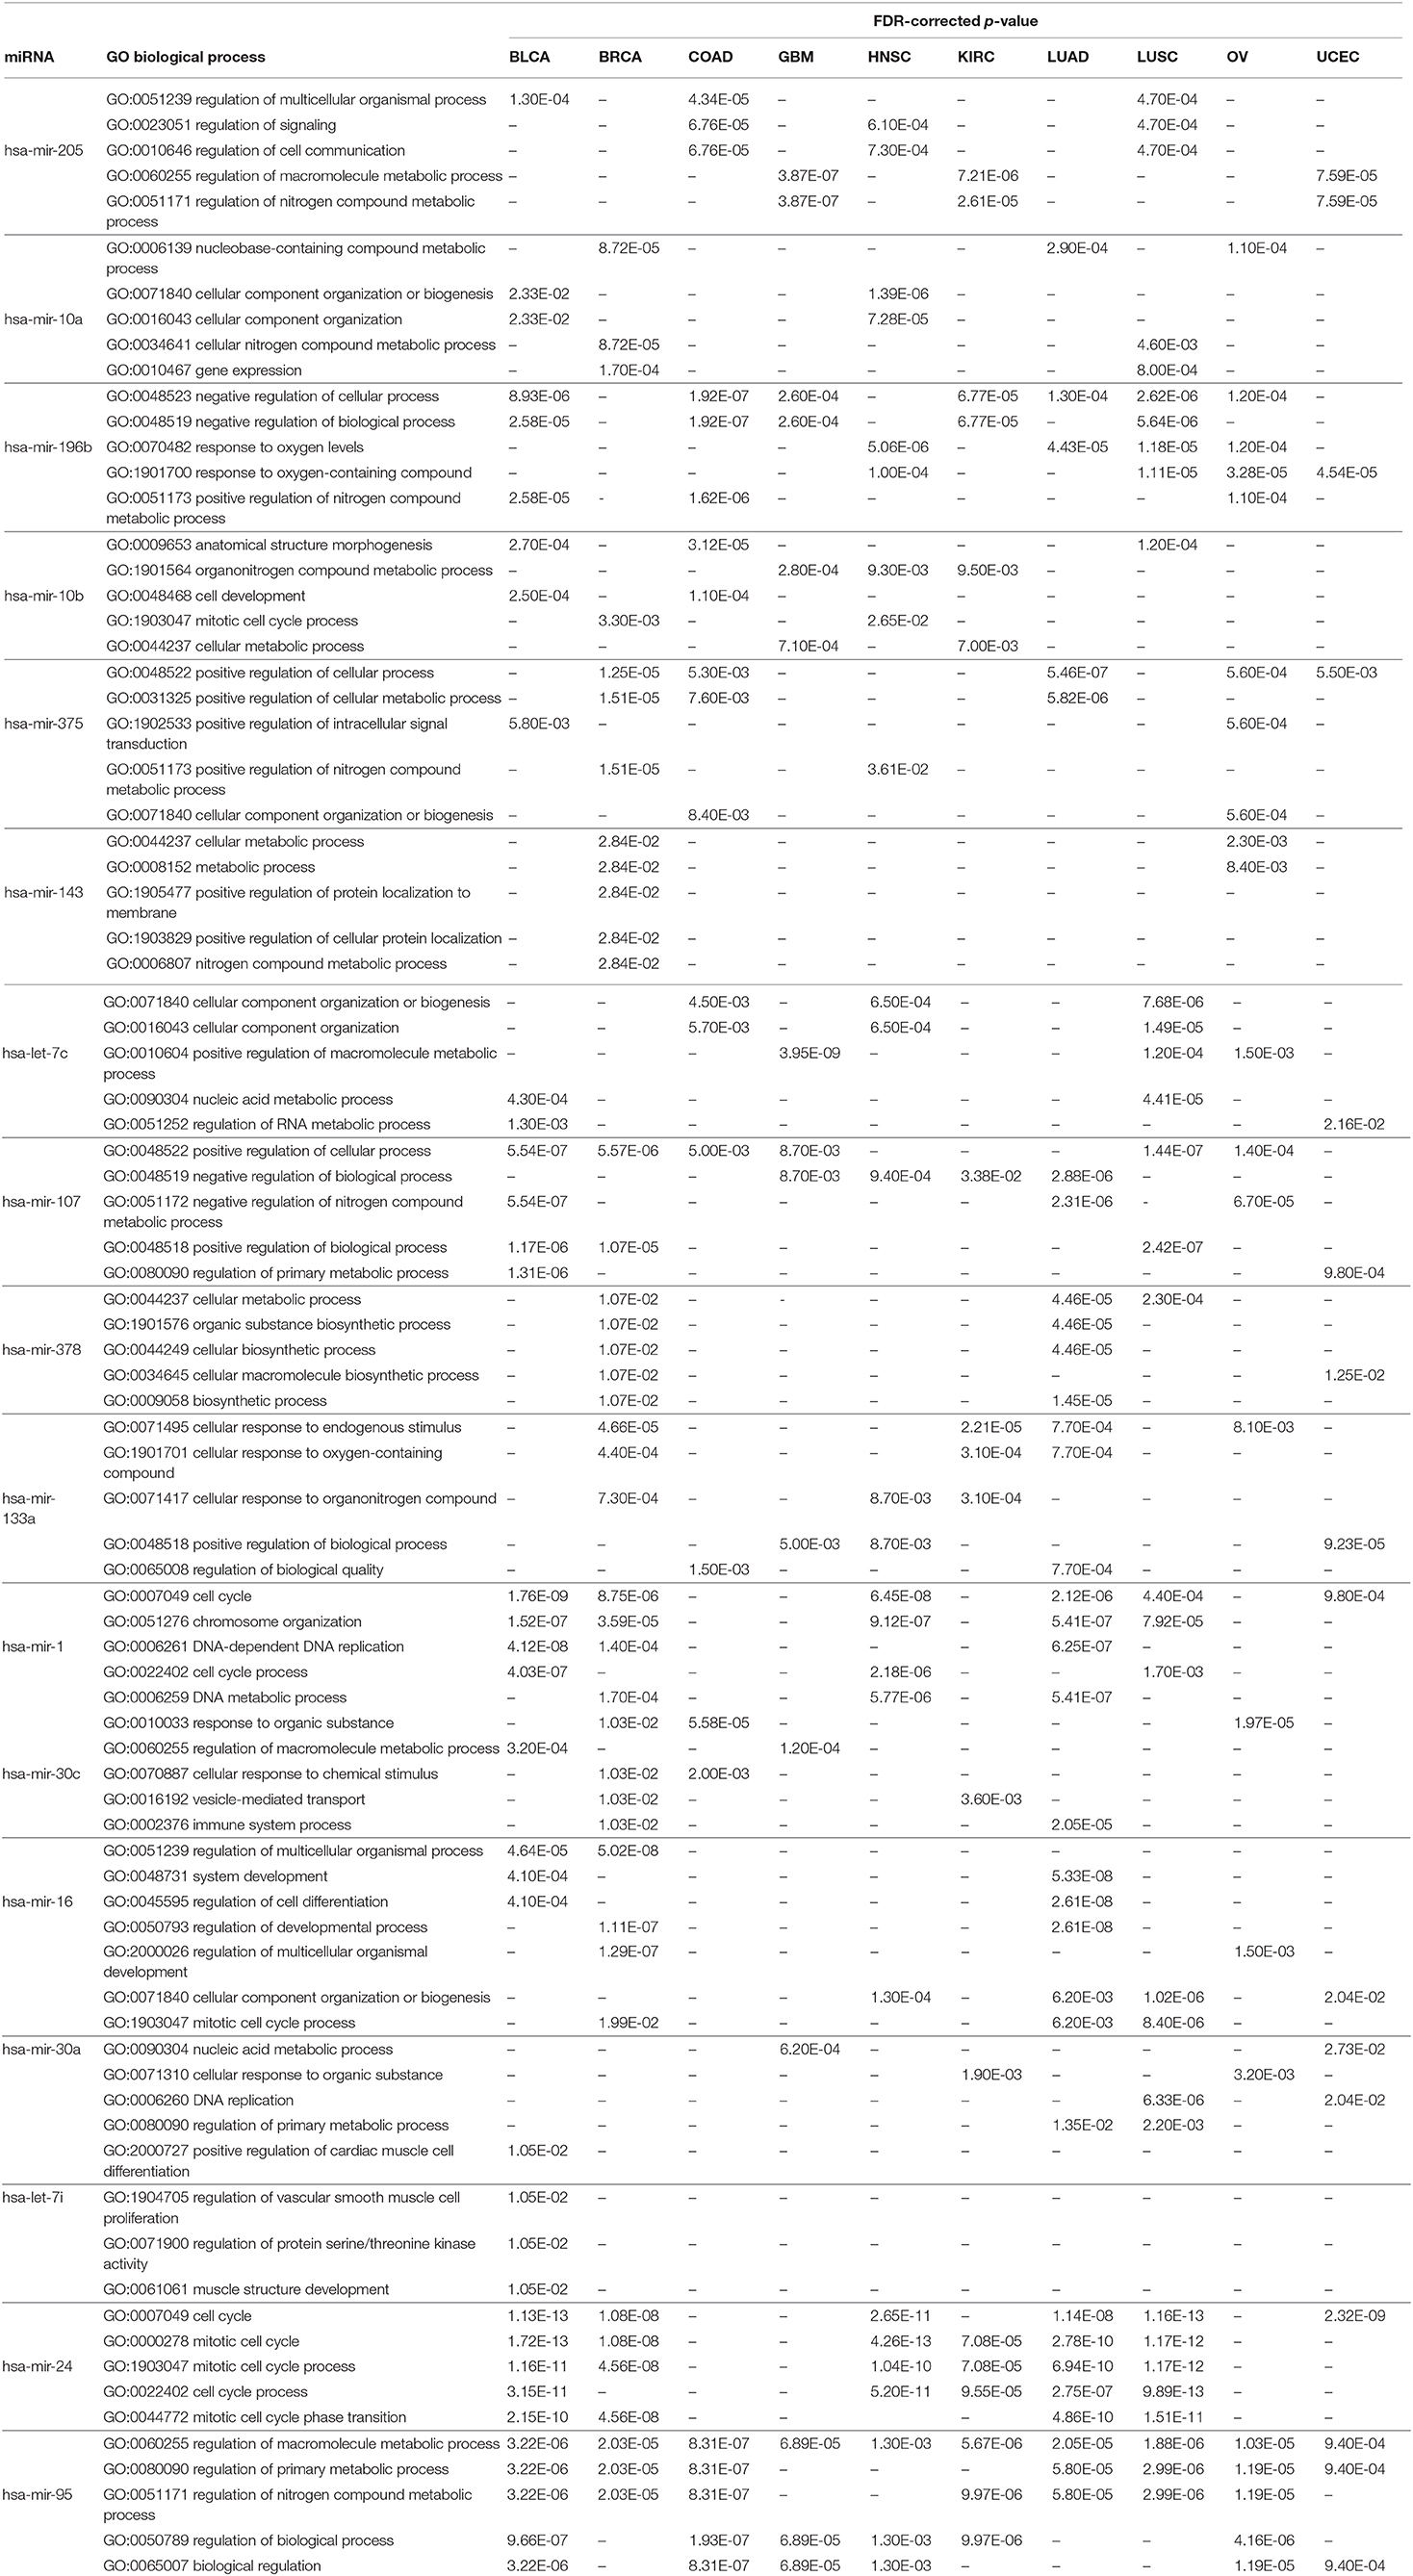
Table 8. Five significant GO biological processes for each of the 17 selected miRNAs in 10 cancer types.
As with the biological processes, GO terms for molecular functions were also found to be significant in the development of various types of cancer, as reported in Supplementary Table 4. For example, GO:0008134 is linked with transcription factor binding, which plays an important role in BRCA, GBM, KIRC, LUAD, OV, and UCEC, with respective FDR-corrected p-values 8.10E-03, 8.31E-06, 6.80E-06, 4.70E-03, 3.76E-05, and 3.40E-03 all being <0.05. Other important GO terms such as GO:0044877, GO:0003723, GO:0003676, and GO:0008092 are found to be linked to protein-containing complex binding, RNA binding, nucleic acid binding, and cytoskeletal protein binding, respectively, for different cancer types. Supplementary Table 5 reports the significant GO terms for cellular components in various cancer types. GO:0070013 is linked to intracellular organelle lumen, which has FDR-corrected p-values within the 5% significance level for seven different cancer types, namely BLCA, BRCA, COAD, GBM, HNSC, KIRC, and LUSC. In addition, GO:0043227, GO:0005654, and GO:0044444 are associated with membrane-bounded organelle, nucleoplasm, and cytoplasmic part, respectively, which are critical processes in the progression of different types of cancer. The relationship between these GO terms and important activities in cancer development have also been cross-validated in other studies (Waldman et al., 1997; Dhillon et al., 2007; He et al., 2013; Reimand et al., 2013; McClurg and Robson, 2015). Taken together, all of these evidences point to the potential importance of the 17 selected miRNAs in the development of various types of cancer.
3.2.6. Protein-Protein Interaction Network Analysis
In PPI networks, a node and an edge signify the interaction of a given protein and the protein-protein association. Here, related proteins share common functions, although they do not necessarily physically interact with each other. In our study, to perform the PPI network analysis, 170 sets of targets relating to 17 miRNAs in 10 different cancer types were used to compute the PPI networks using the STRING database (Szklarczyk et al., 2019). Then, the 170 interaction networks were further analyzed to rank the proteins based on the degree of their nodes and their presence in 10 cancer types. The top 30 proteins are reported in Table 9, while the rest are given in Supplementary Material. For example, MYC has degrees 34, 28, 41, 85, 33, 133, 54, 25, 38, and 32 with respect to BLCA, BRCA, COAD, GBM, HNSC, KIRC, LUAD, LUSC, OV, and UCEC, respectively. Therefore, the total degree of MYC is 503. Similarly, other proteins have certain degrees in different cancer types. Moreover, their presence in the different cancer types is indicated by the association count; for example, MYC has an association count of 10. The proteins in Table 9 are used to construct the final consolidated PPI network shown in Figure 5, which represents the associations between the top 30 proteins and 10 different cancer types. The average node degree in this network is 13.7, with PPI enrichment p < 1.0E-16. In Figure 5, the significant proteins are MYC, PTEN, CDK1, BRCA1, AKT1, PIK3R1, etc. MYC is the most important protein, known to be oncogenic for breast cancer. Similarly, AKT1 is very significant for breast, lung, and colon cancers. PIK3R1 also plays an important role in breast cancer. The detailed list of PPI networks is provided in Supplementary Material. In summary, the PPI network analysis suggests that the 17 selected miRNAs can be considered important biomarkers with respect to diagnosis of 10 different cancer types.
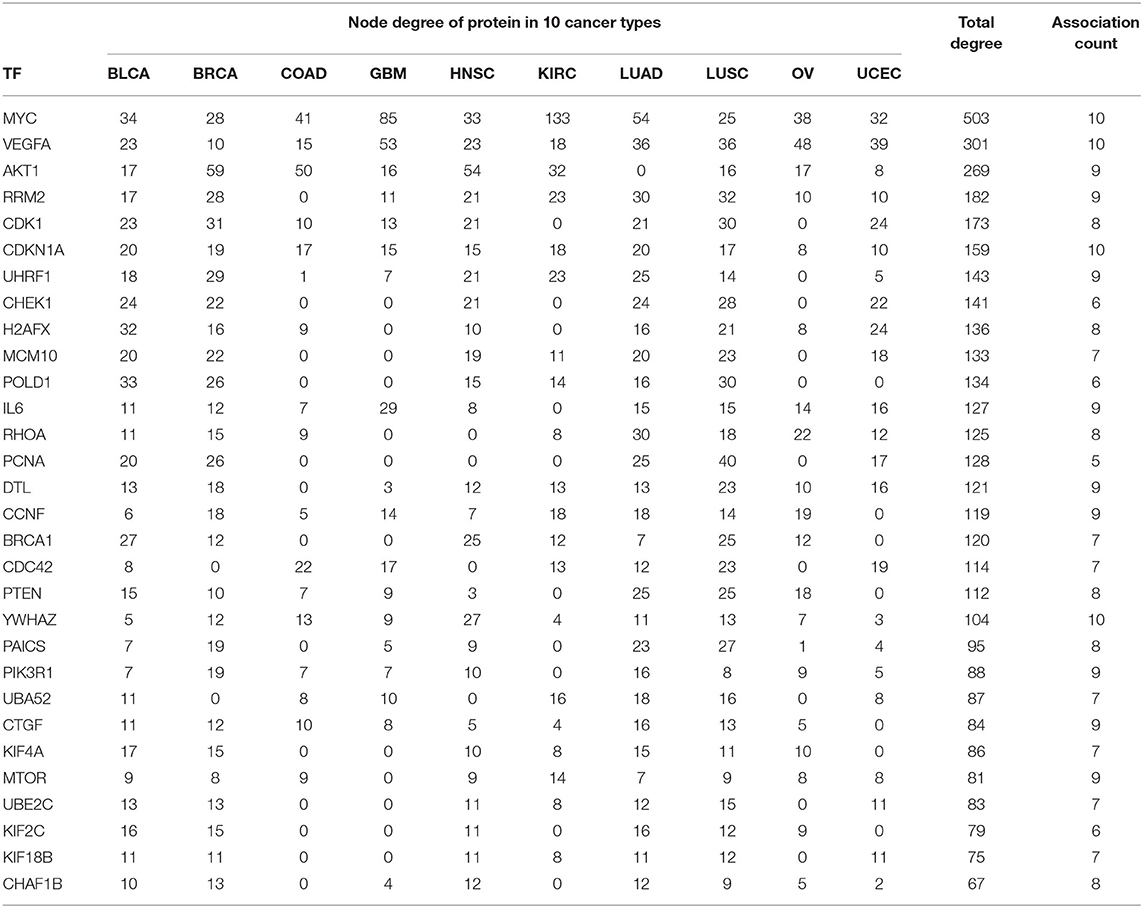
Table 9. Association of top 30 proteins in 10 cancer types for the 17 selected miRNAs through their targets.
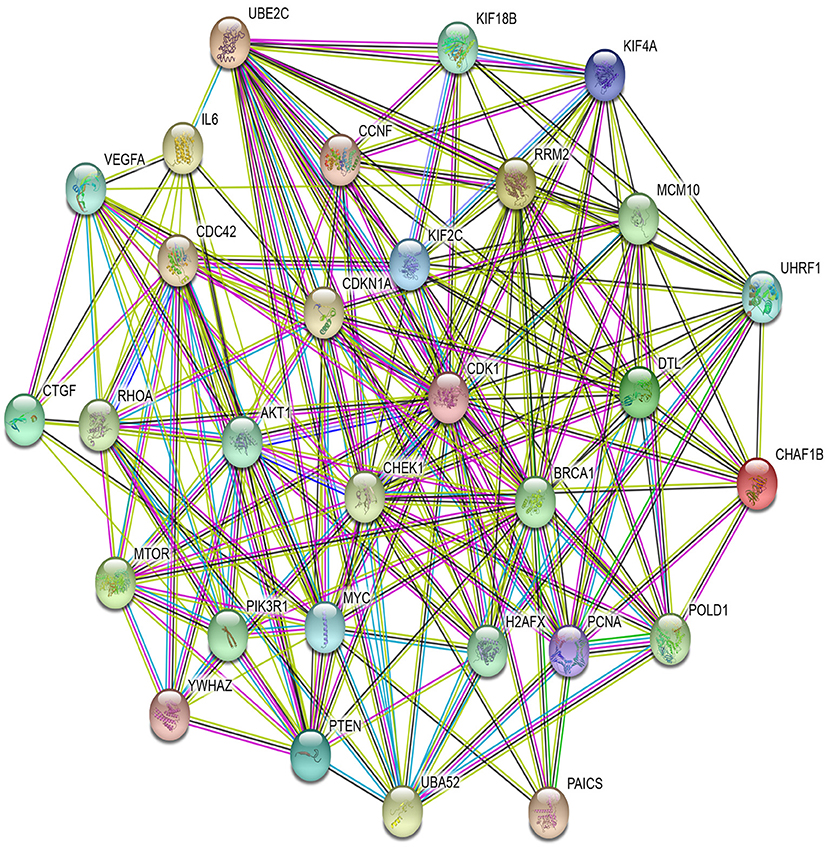
Figure 5. PPI network of top 30 proteins associated with 10 cancer types, with p-value <1.0E-16 and average node degree 13.7.
3.3. Web Application for Prediction of 10 Cancer Types
A web version of the predictor4 was developed for use of the scientific and medical communities to aid in cancer diagnosis. The application uses the random forest and the expression of 17 miRNAs to predict the occurrence of 10 different types of cancer. The random forest was chosen as it outperformed other classifiers in our experiments. To predict the type of cancer for a particular patient or set of patients, the expression values of 17 miRNAs in those patients need to be uploaded in a specific format, instructions are provided on the website. The application will return and display the predicted cancer types for the given set of patients.
4. Conclusions
We have proposed a statistical learning method for feature selection that integrates clustering, classification, and regression to find putative miRNAs by solving a multi-class classification problem on 10 cancer types. The first part of the method is a wrapper-based feature selection algorithm, called stochastic covariance evolutionary strategy with forward selection (SCES-FS), which involves stochastic neighbor embedding (SNE), covariance matrix adaptation evolutionary strategy (CMA-ES), forward selection (FS), and a classification technique. Features are reordered using SNE by performing clustering of highly correlated features. From the result of the clustering, a subset of features is randomly selected to perform multi-class classification on 10 cancer types. Although the features are randomly selected, the underlying classification task is treated as an optimization problem for CMA-ES in order to find the features automatically. Thereafter, a final set of features/miRNAs is obtained using forward selection. The results of the first part of SCES-FS have been compared with the results of some well-known feature selection methods, including ESVM-RFE, LASSO, NSGA-II-SE, MOGA, SVM-nRFE, SVM-RFE, CMIM, ICAP, SCAD, JMI, CIFE, mRMR, FSCOX, DISR, SNRs, and RankSum, as well as the result with all features, in terms of classification accuracy. The SCES-FS method selected 17 putative miRNAs associated with 10 cancer types and achieved higher classification accuracy than the other methods. Using the 17 selected miRNAs, a web-based multi-class cancer predictor application has been developed.
These selected miRNAs are used in the second part of the proposed method, which employs Cox regression analysis to examine their importance with respect to survival of particular types of cancer. The analysis uses data on expression of the 17 selected miRNAs together with clinical data. A high Cox coefficient value signifies the importance of an miRNA for a particular cancer type. For example, it is found that hsa-mir-375 has the highest Cox coefficient, 0.9882, for the glioblastoma multiform cancer type. Similar results were obtained for other miRNAs, associated with different cancer types. The up- and down-regulations of the 17 selected miRNAs have been computed based on the ANOVA test. Furthermore, network analysis, expression analysis using hierarchical clustering, KEGG pathway analysis, GO enrichment analysis, and PPI network analysis have been performed to assess the biological significance of the selected miRNAs. The network analysis revealed the association of different cancer types with each pair of miRNA and its target mRNA. The hierarchical clustering analysis demonstrated the effective changes in expression levels of the miRNAs between tumor and normal samples. Both the KEGG and GO enrichment analyses reveals the significant pathways and biological functions in different cancer types. Moreover, using PPI networks, key cancer regulators such as MYC, VEGFA, AKT1, CDKN1A, RHOA, and PTEN are identified. All these evidences suggest that our selected miRNAs play key roles in the development of 10 different types of cancer. A future research direction is the integration of multi-omics data for finding effective regulators pan-cancer biomarkers.
Data Availability Statement
Publicly available datasets were analyzed in this study. This data can be found here: https://portal.gdc.cancer.gov/ and http://www.nitttrkol.ac.in/indrajit/projects/mirna-prediction-multicalss/.
Author Contributions
JPS, IS, and AL conceived and designed the experiments. JPS, IS, AL, NG, AD, and PL performed the experiments. JPS, IS, MW, and AD wrote the manuscript. JPS, IS, GB, and DP corrected and edited the manuscript. All authors read and approved the final manuscript.
Funding
This work was supported by the Polish National Science Centre (2014/15/B/ST6/05082, 2019/35/O/ST6/02484), the Foundation for Polish Science (TEAM to DP), and a grant from the Department of Science and Technology, India (Indo-Polish/Polish-Indo project no. DST/INT/POL/P-36/2016). The work was also supported by grant 1U54DK107967-01 Nucleome Positioning System for Spatiotemporal Genome Organization and Regulation within the 4DNucleome NIH program, and was partially supported by the Academy of Development as the Key to Strengthen Human Resources of the Polish Economy co-financed by the European Union under the European Social Fund. This research was also partially supported under the RENOIR Project of the European Union Horizon 2020 Research and Innovation Programme under the Marie Sklodowska-Curie grant agreement no. 691152 and by the Ministry of Science and Higher Education of Poland under grant nos. W34/H2020/2016 and 329025/PnH/2016.
Conflict of Interest
JPS was employed by company Larsen & Toubro Infotech Ltd.
The remaining authors declare that the research was conducted in the absence of any commercial or financial relationships that could be construed as a potential conflict of interest.
Supplementary Material
The Supplementary Material for this article can be found online at: https://www.frontiersin.org/articles/10.3389/fgene.2020.00982/full#supplementary-material
Footnotes
1. ^https://tcga-data.nci.nih.gov/tcga/
2. ^http://www.nitttrkol.ac.in/indrajit/projects/mirna-prediction-multicalss/
3. ^http://www.nitttrkol.ac.in/indrajit/projects/mirna-prediction-multicalss/
4. ^http://www.nitttrkol.ac.in/indrajit/projects/mirna-prediction-multicalss/
References
Akhtar, M. M., Micolucci, L., Islam, M. S., Olivieri, F., and Procopio, A. D. (2015). Bioinformatic tools for microRNA dissection. Nucleic Acids Res. 44, 24–44. doi: 10.1093/nar/gkv1221
Altman, N. S. (1992). An introduction to kernel and nearest-neighbor nonparametric regression. Am. Stat. 46, 175–185. doi: 10.1080/00031305.1992.10475879
Anaissi, A., Goyal, M., Catchpoole, D. R., Braytee, A., and Kennedy, P. J. (2016). Ensemble feature learning of genomic data using support vector machine. PLoS ONE 11:e157330. doi: 10.1371/journal.pone.0157330
Ang, J. C., Mirzal, A., Haron, H., and Hamed, H. N. A. (2016). Supervised, unsupervised, and semi-supervised feature selection: a review on gene selection. IEEE/ACM Trans. Comput. Biol. Bioinform. 13, 971–989. doi: 10.1109/TCBB.2015.2478454
Bartel, D. P. (2009). MicroRNAs: target recognition and regulatory functions. Cell 136, 215–233. doi: 10.1016/j.cell.2009.01.002
Bennasar, M., Hicks, Y., and Setchi, R. (2015). Feature selection using joint mutual information maximisation. Expert Syst. Appl. 42, 8520–8532. doi: 10.1016/j.eswa.2015.07.007
Breslow, N. (1974). Covariance analysis of censored survival data. Biometrics 30, 89–99. doi: 10.2307/2529620
Brown, G., Pocock, A., Zhao, M. J., and Lujan, M. (2012). Conditional likelihood maximisation: a unifying framework for information theoretic feature selection. J. Mach. Learn. Res. 13, 27–66. Available online at: http://jmlr.org/papers/v13/brown12a.html
Bruscella, P., Bottini, S., Baudesson, C., Pawlotsky, J.-M., Feray, C., and Trabucchi, M. (2017). Viruses and miRNAs: more friends than foes. Front. Microbiol. 8:824. doi: 10.3389/fmicb.2017.00824
Cheerla, N., and Gevaert, O. (2017). MicroRNA based pan-cancer diagnosis and treatment recommendation. BMC Bioinformatics 18:32. doi: 10.1186/s12859-016-1421-y
Conesa, A., Madrigal, P., Tarazona, S., Gomez-Cabrero, D., Cervera, A., McPherson, A., et al. (2016). A survey of best practices for RNA-seq data analysis. Genome Biol. 17:13. doi: 10.1186/s13059-016-0881-8
Cortes, C., and Vapnik, V. (1995). Support-vector networks. Mach. Learn. 20, 273–297. doi: 10.1007/BF00994018
Costa-Silva, J., Domingues, D., and Lopes, F. M. (2017). RNA-Seq differential expression analysis: an extended review and a software tool. PLoS ONE 12:e190152. doi: 10.1371/journal.pone.0190152
Cox, D. R. (1972). Regression models and life-tables. J. R. Stat. Soc. Ser. B 34, 187–202. doi: 10.1111/j.2517-6161.1972.tb00899.x
Crow, M., Lim, N., Ballouz, S., Pavlidis, P., and Gillis, J. (2019). Predictability of human differential gene expression. Proc. Natl. Acad. Sci. U.S.A. 116, 6491–6500. doi: 10.1073/pnas.1802973116
Dhillon, A. S., Hagan, S., Rath, O., and Kolch, W. (2007). MAP kinase signalling pathways in cancer. Oncogene 26, 3279–3290. doi: 10.1038/sj.onc.1210421
Fan, J., and Li, R. (2001). Variable selection via nonconcave penalized likelihood and its oracle properties. J. Am. Stat. Assoc. 96, 1348–1360. doi: 10.1198/016214501753382273
Fleuret, F. (2004). Fast binary feature selection with conditional mutual information. J. Mach. Learn. Res. 5, 1531–1555. Available online at: https://www.jmlr.org/papers/v5//fleuret04a.html
George, H., and Langley, J. P. (1995). Estimating continuous distributions in Bayesian classifiers. Proc Elev. Conf. Uncertain. Artif. Intell. 69, 338–345.
Giza, D. E., Vasilescu, C., and Calin, G. A. (2014). Key principles of miRNA involvement in human diseases. Discoveries 2:e34. doi: 10.15190/d.2014.26
Guyon, I., Weston, J., and Barnhill, S. (2002). Gene selection for cancer classification using support vector machines. Mach. Learn. 46, 389–422. doi: 10.1023/A:1012487302797
Hansen, N. (2006). The CMA evolution strategy: a comparing review. Towards New Evol. Comput. 192, 75–102. doi: 10.1007/11007937_4
Hansen, N. (2016). The CMA evolution strategy: a tutorial. Comput. Res. Reposit. 1–39. Available online at: http://arxiv.org/abs/1604.00772
Hansen, N., Muller, S. D., and Koumoutsakos, P. (2003). Reducing the time complexity of the derandomized evolution strategy with covariance matrix adaptation (CMA-ES). Evol. Comput. 11, 1–18. doi: 10.1162/106365603321828970
Hansen, N., and Ostermeier, A. (1996). “Adapting arbitrary normal mutation distributions in evolution strategies: the covariance matrix adaptation,” in Proceedings of IEEE International Conference on Evolutionary Computation, 1996 (Nagoya), 312–317. doi: 10.1109/ICEC.1996.542381
He, W., Zhang, M. G., Wang, X. J., Zhong, S., Shao, Y., Zhu, Y., et al. (2013). KAT5 and KAT6B are in positive regulation on cell proliferation of prostate cancer through PI3K-AKT signaling. Int. J. Clin. Exp. Pathol. 6, 2864–2871.
Hinton, G. E., and Roweis, S. T. (2003). “Stochastic neighbor embedding,” in Advances in Neural Information Processing Systems, 857–864. Available online at: http://papers.nips.cc/paper/2276-stochastic-neighbor-embedding.pdf
Hoadley, K., Yau, C., Hinoue, T., Stuart, J. M., Benz, C. C., and Laird, P. W. (2018). Cell-of-origin patterns dominate the molecular classification of 10,000 tumors from 33 types of cancer. Bioinformatics 173, 291–304. doi: 10.1016/j.cell.2018.03.022
Hosseinahli, N., Aghapour, M., Duijf, P. H., and Baradaran, B. (2018). Treating cancer with microRNA replacement therapy: a literature review. J. Cell. Physiol. 233, 5574–5588. doi: 10.1002/jcp.26514
Huang, H.-Y., Lin, Y.-C.-D., Li, J., Huang, K.-Y., Shrestha, S., Hong, H.-C., et al. (2020). miRTarBase 2020: updates to the experimentally validated microRNA-target interaction database. Nucleic Acids Res. 48, D148–D154. doi: 10.1093/nar/gkz896
Jacob, H., Stanisavljevic, L., Storli, K. E., Dahl, K. E. H. O., and Myklebust, M. P. (2017). Identification of a sixteen-microRNA signature as prognostic biomarker for stage II and III colon cancer. Oncotarget 8, 87837–87847. doi: 10.18632/oncotarget.21237
Jacobsen, A., Silber, J., Harinath, G., Huse, J. T., Schultz, N., and Sander, C. (2013). Analysis of microRNA-target interactions across diverse cancer types. Nat. Struct. Mol. Biol. 20, 1325–1332. doi: 10.1038/nsmb.2678
Jakulin, A. (2005). Machine learning based on attribute interactions (Ph.D. thesis). Univerza v Ljubljani, Ljubljana, Slovenia.
Kanehisa, M., and Goto, S. (2000). KEGG: kyoto encyclopedia of genes and genomes. Nucleic Acids Res. 28, 27–30. doi: 10.1093/nar/28.1.27
Kelley, C. T. (1999). Iterative methods for optimization. Soc. Indus. Appl. Math. 18, 1–188. doi: 10.1137/1.9781611970920
Kim, S., Park, T., and Kon, M. (2014). Cancer survival classification using integrated data sets and intermediate information. Artif. Intell. Med. 62, 23–31. doi: 10.1016/j.artmed.2014.06.003
Kuleshov, M. V., Jones, M. R., Rouillard, A. D., Fernandez, N. F., Duan, Q., Wang, Z., et al. (2016). Enrichr: a comprehensive gene set enrichment analysis web server 2016 update. Nucleic Acids Res. 44, W90–W97. doi: 10.1093/nar/gkw377
Latinne, P., Debeir, O., and Decaestecker, C. (2001). “Limiting the number of trees in random forests,” in Proceedings of the Second International Workshop on Multiple Classifier Systems (Cambridge, UK), 178–187. doi: 10.1007/3-540-48219-9_18
Li, F., Piao, M., Piao, Y., Li, M., and Ryu, K. H. (2014). A new direction of cancer classification: positive effect of low-ranking MicroRNAs. Osong Public Health Res. Perspect. 5, 279–285. doi: 10.1016/j.phrp.2014.08.004
Li, H., and Yang, B. B. (2014). MicroRNA-in drug resistance. Oncoscienc 14, 3–4. doi: 10.18632/oncoscience.2
Li, Y., Wu, F.-X., and Ngom, A. (2016). A review on machine learning principles for multi-view biological data integration. Brief. Bioinformatics 19, 325–340. doi: 10.1093/bib/bbw113
Liang, L., Wei, D. M., Li, J. J., Luo, D. Z., Chen, G., Dang, Y. W., et al. (2018). Prognostic microRNAs and their potential molecular mechanism in pancreatic cancer: a study based on The Cancer Genome Atlas and bioinformatics investigation. Mol. Med. Rep. 17, 939–951. doi: 10.3892/mmr.2017.7945
Lin, E., and Lane, H.-Y. (2017). Machine learning and systems genomics approaches for multi-omics data. Biomark. Res. 5:2. doi: 10.1186/s40364-017-0082-y
Lu, J., Getz, G., Miska, E. A., Alvarez-Saavedra, E., Lamb, J., Peck, D., et al. (2005). MicroRNA expression profiles classify human cancers. Nature 435, 834–838. doi: 10.1038/nature03702
Ma, J., Dong, C., and Ji, C. (2010). MicroRNA and drug resistance. Cancer Gene Ther. 17, 523–531. doi: 10.1038/cgt.2010.18
McClurg, U. L., and Robson, C. N. (2015). Deubiquitinating enzymes as oncotargets. Oncotarget 6, 9657–9668. doi: 10.18632/oncotarget.3922
Mishra, D., and Sahu, B. (2011). Feature selection for cancer classification: a signal-to-noise ratio approach. Int. J. Sci. Eng. Res. 2, 1–7. Available online at: https://www.ijser.org/viewPaperDetail.aspx?APR1117
Mukhopadhyay, A., and Maulik, U. (2013). An SVM-wrapped multiobjective evolutionary feature selection approach for identifying cancer-microRNA markers. IEEE Trans. Nanobiosci. 12, 275–281. doi: 10.1109/TNB.2013.2279131
Oshiro, T. M., Perez, P. S., and Baranauskas, J. A. (2012). “How many trees in a random forest?,” in Proceedings of 8th International Conference of Machine Learning and Data Mining in Pattern Recognition (Berlin), 154–168. doi: 10.1007/978-3-642-31537-4_13
Paul, P., Chakraborty, A., Sarkar, D., Langthasa, M., Rahman, M., Bari, M., et al. (2018). Interplay between miRNAs and human diseases. J. Cell. Physiol. 233, 2007–2018. doi: 10.1002/jcp.25854
Peng, H., Long, F., and Ding, C. (2005). Feature selection based on mutual information: criteria of max-dependency, max-relevance, and min-redundancy. IEEE Trans. Pattern Anal. Mach. Intell. 27, 1226–1238. doi: 10.1109/TPAMI.2005.159
Peng, S., Zeng, X., Li, X., Peng, X., and Chen, L. (2009). Multi-class cancer classification through gene expression profiles: microRNA versus mRNA. J. Genet. Genomics 36, 409–416. doi: 10.1016/S1673-8527(08)60130-7
Peng, Y., and Croce, C. M. (2016). The role of MicroRNAs in human cancer. Signal Transd. Target. Ther. 1:15004. doi: 10.1038/sigtrans.2015.4
Ray, S. S., and Maiti, S. (2015). Noncoding RNAs and their annotation using metagenomics algorithms. Wiley Interdisc. Rev. 5, 1–20. doi: 10.1002/widm.1142
Reimand, J., Wagih, O., and Bader, G. D. (2013). The mutational landscape of phosphorylation signaling in cancer. Sci. Rep. 3:2651. doi: 10.1038/srep02651
Ros, R., and Hansen, N. (2008). “A simple modification in CMA-ES achieving linear time and space complexity,” in Proceedings of Parallel Problem Solving from Nature (Dortmund), 296–305. doi: 10.1007/978-3-540-87700-4_30
Saha, S., Mitra, S., and Yadav, R. K. (2017). A stack-based ensemble framework for detecting cancer MicroRNA biomarkers. Genom. Proteom. Bioinformatics 15, 381–388. doi: 10.1016/j.gpb.2016.10.006
Shrestha, S., Yang, C. D., Hong, H. C., Chou, C. H., Tai, C. S., Chiew, M. Y., et al. (2017). Integrated MicroRNA-mRNA analysis reveals miR-204 inhibits cell proliferation in gastric cancer by targeting CKS1B, CXCL1 and GPRC5A. Int. J. Mol. Sci. 19:87. doi: 10.3390/ijms19010087
Song, C., Zhang, L., Wang, J., Huang, Z., Li, X., Wu, M., et al. (2016). High expression of microRNA-183/182/96 cluster as a prognostic biomarker for breast cancer. Sci. Rep. 6:24502. doi: 10.1038/srep24502
Szklarczyk, D., Gable, A. L., Lyon, D., Junge, A., Wyder, S., Huerta-Cepas, J., et al. (2019). String v11: Protein-protein association networks with increased coverage, supporting functional discovery in genome-wide experimental datasets. Nucleic Acids Res. 47, D607–D613. doi: 10.1093/nar/gky1131
Tibshirani, R. (1996). Regression shrinkage and selection via the lasso. J. R. Stat. Soc. Ser. B 58, 267–288. doi: 10.1111/j.2517-6161.1996.tb02080.x
Troyanskaya, O. G., Garber, M. E., Brown, P. O., Botstein, D., and Altman, R. B. (2002). Nonparametric methods for identifying differentially expressed genes in microarray data. Bioinformatics 18, 1454–1461. doi: 10.1093/bioinformatics/18.11.1454
Valencia-Sanchez, M. A., Liu, J., Hannon, G. J., and Parke, R. (2006). Control of translation and mRNA degradation by miRNAs and siRNAs. Genes Dev. 20, 515–524. doi: 10.1101/gad.1399806
van Dijk, E. L., Auger, H., Jaszczyszyn, Y., and Thermes, C. (2014). Ten years of next-generation sequencing technology. Trends Genet. 30, 418–426. doi: 10.1016/j.tig.2014.07.001
Vlachos, I. S., Zagganas, K., Paraskevopoulou, M. D., Georgakilas, G., Karagkouni, D., Vergoulis, T., et al. (2015). DIANA-miRPath v3.0: deciphering microRNA function with experimental support. Nucleic Acids Res. 43, W460–W466. doi: 10.1093/nar/gkv403
Waldman, T., Zhang, Y., Dillehay, L., Yu, J., Kinzler, K., Vogelstein, B., et al. (1997). Cell-cycle arrest versus cell death in cancer therapy. Nat. Med. 3, 1034–1036. doi: 10.1038/nm0997-1034
Wang, D., Xin, L., Lin, J. H., Liao, Z., Ji, J. T., Du, T. T., et al. (2017). Identifying miRNA-mRNA regulation network of chronic pancreatitis based on the significant functional expression. Medicine 96:e6668. doi: 10.1097/MD.0000000000006668
Whitney, A. W. (1971). A direct method of nonparametric measurement selection. IEEE Trans. Comput. C-20, 1100–1103. doi: 10.1109/T-C.1971.223410
Wong, N. W., Chen, Y., Chen, S., and Wang, X. (2017). OncomiR: an online resource for exploring pan-cancer microRNA dysregulation. Bioinformatics 34, 713–715. doi: 10.1093/bioinformatics/btx627
Yang, Y., Huang, N., and Kong, L. H. W. (2017). A clustering-based approach for efficient identification of microRNA combinatorial biomarkers. BMC Genomics 18:210. doi: 10.1186/s12864-017-3498-8
Yokoi, A., Yoshioka, Y., Hirakawa, A., Yamamoto, Y., Ishikawa, M., Ikeda, S. I., et al. (2017). A combination of circulating miRNAs for the early detection of ovarian cancer. Oncotarget 8, 89811–89823. doi: 10.18632/oncotarget.20688
Zhang, J., Le, T. D., Liu, L., Liu, B., He, J., Goodall, G. J., et al. (2014). Identifying direct miRNA-mRNA causal regulatory relationships in heterogeneous data. J. Biomed. Inform. 52, 438–447. doi: 10.1016/j.jbi.2014.08.005
Zhang, N., Wang, M., Zhang, P., and Huang, T. (2016). Classification of cancers based on copy number variation landscapes. Biochim. Biophys. Acta 1860, 2750–2755. doi: 10.1016/j.bbagen.2016.06.003
Zhang, P.-W., Chen, L., Huang, T., Zhang, N., Kong, X.-Y., and Cai, Y.-D. (2015). Classifying ten types of major cancers based on reverse phase protein array profiles. PLoS ONE 10:e0123147. doi: 10.1371/journal.pone.0123147
Zhang, Y.-H., Zeng, T., Pan, X., Guo, W., Gan, Z., Zhang, Y., et al. (2019). Screening dys-methylation genes and rules for cancer diagnosis by using the pan-cancer study. IEEE Access 8, 489–501. doi: 10.1109/ACCESS.2019.2961402
Keywords: cancer, cox regression, feature selection, gene ontology, KEGG pathway, machine learning, next generation sequencing, stochastic neighbor embedding
Citation: Sarkar JP, Saha I, Lancucki A, Ghosh N, Wlasnowolski M, Bokota G, Dey A, Lipinski P and Plewczynski D (2020) Identification of miRNA Biomarkers for Diverse Cancer Types Using Statistical Learning Methods at the Whole-Genome Scale. Front. Genet. 11:982. doi: 10.3389/fgene.2020.00982
Received: 25 October 2019; Accepted: 03 August 2019;
Published: 13 November 2020.
Edited by:
Natalia Polouliakh, Sony Computer Science Laboratories, JapanReviewed by:
Jaromir Gumulec, Masaryk University, CzechiaTao Huang, Shanghai Institute for Biological Sciences (CAS), China
Copyright © 2020 Sarkar, Saha, Lancucki, Ghosh, Wlasnowolski, Bokota, Dey, Lipinski and Plewczynski. This is an open-access article distributed under the terms of the Creative Commons Attribution License (CC BY). The use, distribution or reproduction in other forums is permitted, provided the original author(s) and the copyright owner(s) are credited and that the original publication in this journal is cited, in accordance with accepted academic practice. No use, distribution or reproduction is permitted which does not comply with these terms.
*Correspondence: Indrajit Saha, aW5kcmFqaXRAbml0dHRya29sLmFjLmlu; Dariusz Plewczynski, ZC5wbGV3Y3p5bnNraUBjZW50LnV3LmVkdS5wbA==
†These authors have contributed equally to this work
 Jnanendra Prasad Sarkar
 Indrajit Saha
 Adrian Lancucki4†
 Nimisha Ghosh
 Grzegorz Bokota
 Dariusz Plewczynski