 Ruo-Nan Wang
 Richard I. Milne
 Xin-Yu Du1
 Jie Liu
95% of researchers rate our articles as excellent or good
Learn more about the work of our research integrity team to safeguard the quality of each article we publish.
Find out more
ORIGINAL RESEARCH article
Front. Genet. , 08 July 2020
Sec. Evolutionary and Population Genetics
Volume 11 - 2020 | https://doi.org/10.3389/fgene.2020.00729
Debregeasia is an economically important genus of the nettle family (Urticaceae). Previous systematic studies based on morphology, or using up to four plastome regions, have not satisfactorily resolved relationships within the genus. Here, we report 25 new plastomes for Urticaceae, including 12 plastomes from five Debregeasia species and 13 plastomes from other genera. Together with the one published plastome for Debregeasia, we analyzed plastome structure and character, identified mutation hotspots and loci under selection, and constructed phylogenies. The plastomes of Debregeasia were found to be very conservative, with a size from 155,743 bp to 156,065 bp, and no structural variation. Eleven mutation hotspots were identified, including three (rpoB-trnC-GCA, trnT-GGU-psbD and ycf1) that are highly variable both within Debregeasia and among genera; these show high potential value for future DNA barcoding, population genetics and phylogenetic reconstruction. Selection pressure analysis revealed nine genes (clpP, ndhF, petB, psbA, psbK, rbcL, rpl23, ycf2, and ycf1) that may experience positive selection. Phylogenomic analyses results suggest that Debregeasia was monophyletic, and closest to Boehmeria among genera examined. Within Debregeasia, D. longifolia was sister to D. saeneb, whereas D. elliptica, D. orientalis with D. squamata formed the other subclade. This study enriches organelle genome resources for Urticaceae, and highlights the utility of plastome data for detecting mutation hotspots for evolutionary and systematic analysis.
Chloroplasts are vital organelles within plants (Raubeson and Jansen, 2005), and their genomes comprise 120 kb to 160 kb of often highly conserved DNA and gene sequences (Wicke et al., 2011), providing rich resources for the study of evolution, DNA barcoding, taxonomy and phylogeny (Borsch and Quandt, 2009; Dong et al., 2012; Ruhfel et al., 2014). Over the past decade, analysis of whole plastomes and/or protein-coding genes has been used successfully to address phylogenetic relationships at multiple taxonomic levels (e.g., Ma et al., 2014; Du et al., 2017; Li H. T. et al., 2019). Repeating sequences can cause structural changes in genomes, and because of their variability between and within lineages, they can be used to study the population genetics of taxa (Timme et al., 2007), such as in Aristolochia (Li X. et al., 2019); they can also serve as information regions for developing genomic markers for phylogenetic analysis, including taxonomically challenging species complexes. Such repeating markers include simple sequence repeats (SSRs), known as microsatellites, which comprise 1–6 nucleotide repeat units and are ubiquitous in the genome (Powell et al., 1996). Certain genes exhibit high variability, especially ycf1, which can therefore potentially be used as a barcode for terrestrial plants (Dong et al., 2015), and rpl20, which has an important role in protein synthesis and is involved in protein translation (Weglöhner and Subramanian, 1992). Furthermore, understanding plastome genetic variation within and between populations provides important information that can be used for conserving species and populations, helping them adapt to climate and habitat changes, and for more successful plant breeding (Daniell et al., 2016). Combining genome-wide information with that from hyper-variable regions provides the best approach to elucidate relationships and identify species among taxonomically critical groups (e.g., Bi et al., 2018; Fu et al., 2019).
Debregeasia Gaud. (Urticaceae) occurs mostly in East Asia, and comprises about eight species (Chen et al., 2003; Wilmot-Dear and Friis, 2012). Debregeasia is economically important because of its stem fibers, which are usually used to make ropes and fishing nets, and its edible fruits can be used to make wines (Chen et al., 2003). Additionally, Debregeasia has been used to treat diarrhea, bone fractures, tumors, skin diseases and urinary complaints, and contains compounds with anti-bacterial, immune suppressant, anti-fungal and anti-inflammatory properties (Akbar and Malik, 2002; Almubayedh and Ahmad, 2019). Thus far, morphology-based taxonomic treatments for Debregeasia have been controversial (Chen et al., 2003; Wilmot-Dear and Friis, 2012), whereas phylogenetic analyses have so far used too few loci to achieve full resolution within Debregeasia (Wu et al., 2013, 2018). Therefore, new methods based on plastome genomic data need to be explored to study the systematics of Debregeasia. However, only one plastome (D. orientalis) has been reported in Debregeasia (Wang et al., 2019), and neither plastome characteristics nor mutation hotspots have so far been investigated in the genus.
In the present study, a total of 25 complete plastomes of Urticaceae were newly assembled and annotated (including 12 individuals from 5 Debregeasia species). Together with the one published plastome, these were used to: (1) analyze variation in genome size, content and structure, as well as IR contraction and expansion; (2) identify microsatellite types, hotspot regions for sequence divergence and variation and adaptive selection; (3) reconstruct phylogenetic relationships of Debregeasia. The present study therefore enriches organelle genome resources for Urticaceae.
Leaf materials were collected from healthy living plants in the field, and subsequently dried and stored in silica gel. In addition, a few individuals were sampled from herbarium specimens. In total, thirteen individuals of five Debregeasia species were included (Supplementary Table S1), all newly sequenced except for Debregeasia orientalis_LAD10 (MH196364) (Wang et al., 2019) which was downloaded from GenBank. An additional 13 species within Urticaceae, which represented all four main clades of the family (Wu et al., 2013, 2018) were adopted as outgroups (Table 1). All voucher specimens were deposited in the herbarium of Kunming Institute of Botany, Chinese Academy of Sciences (KUN); Royal Botanic Garden, Edinburgh (E); and Royal Botanic Gardens, Kew (K) (Supplementary Table S1).
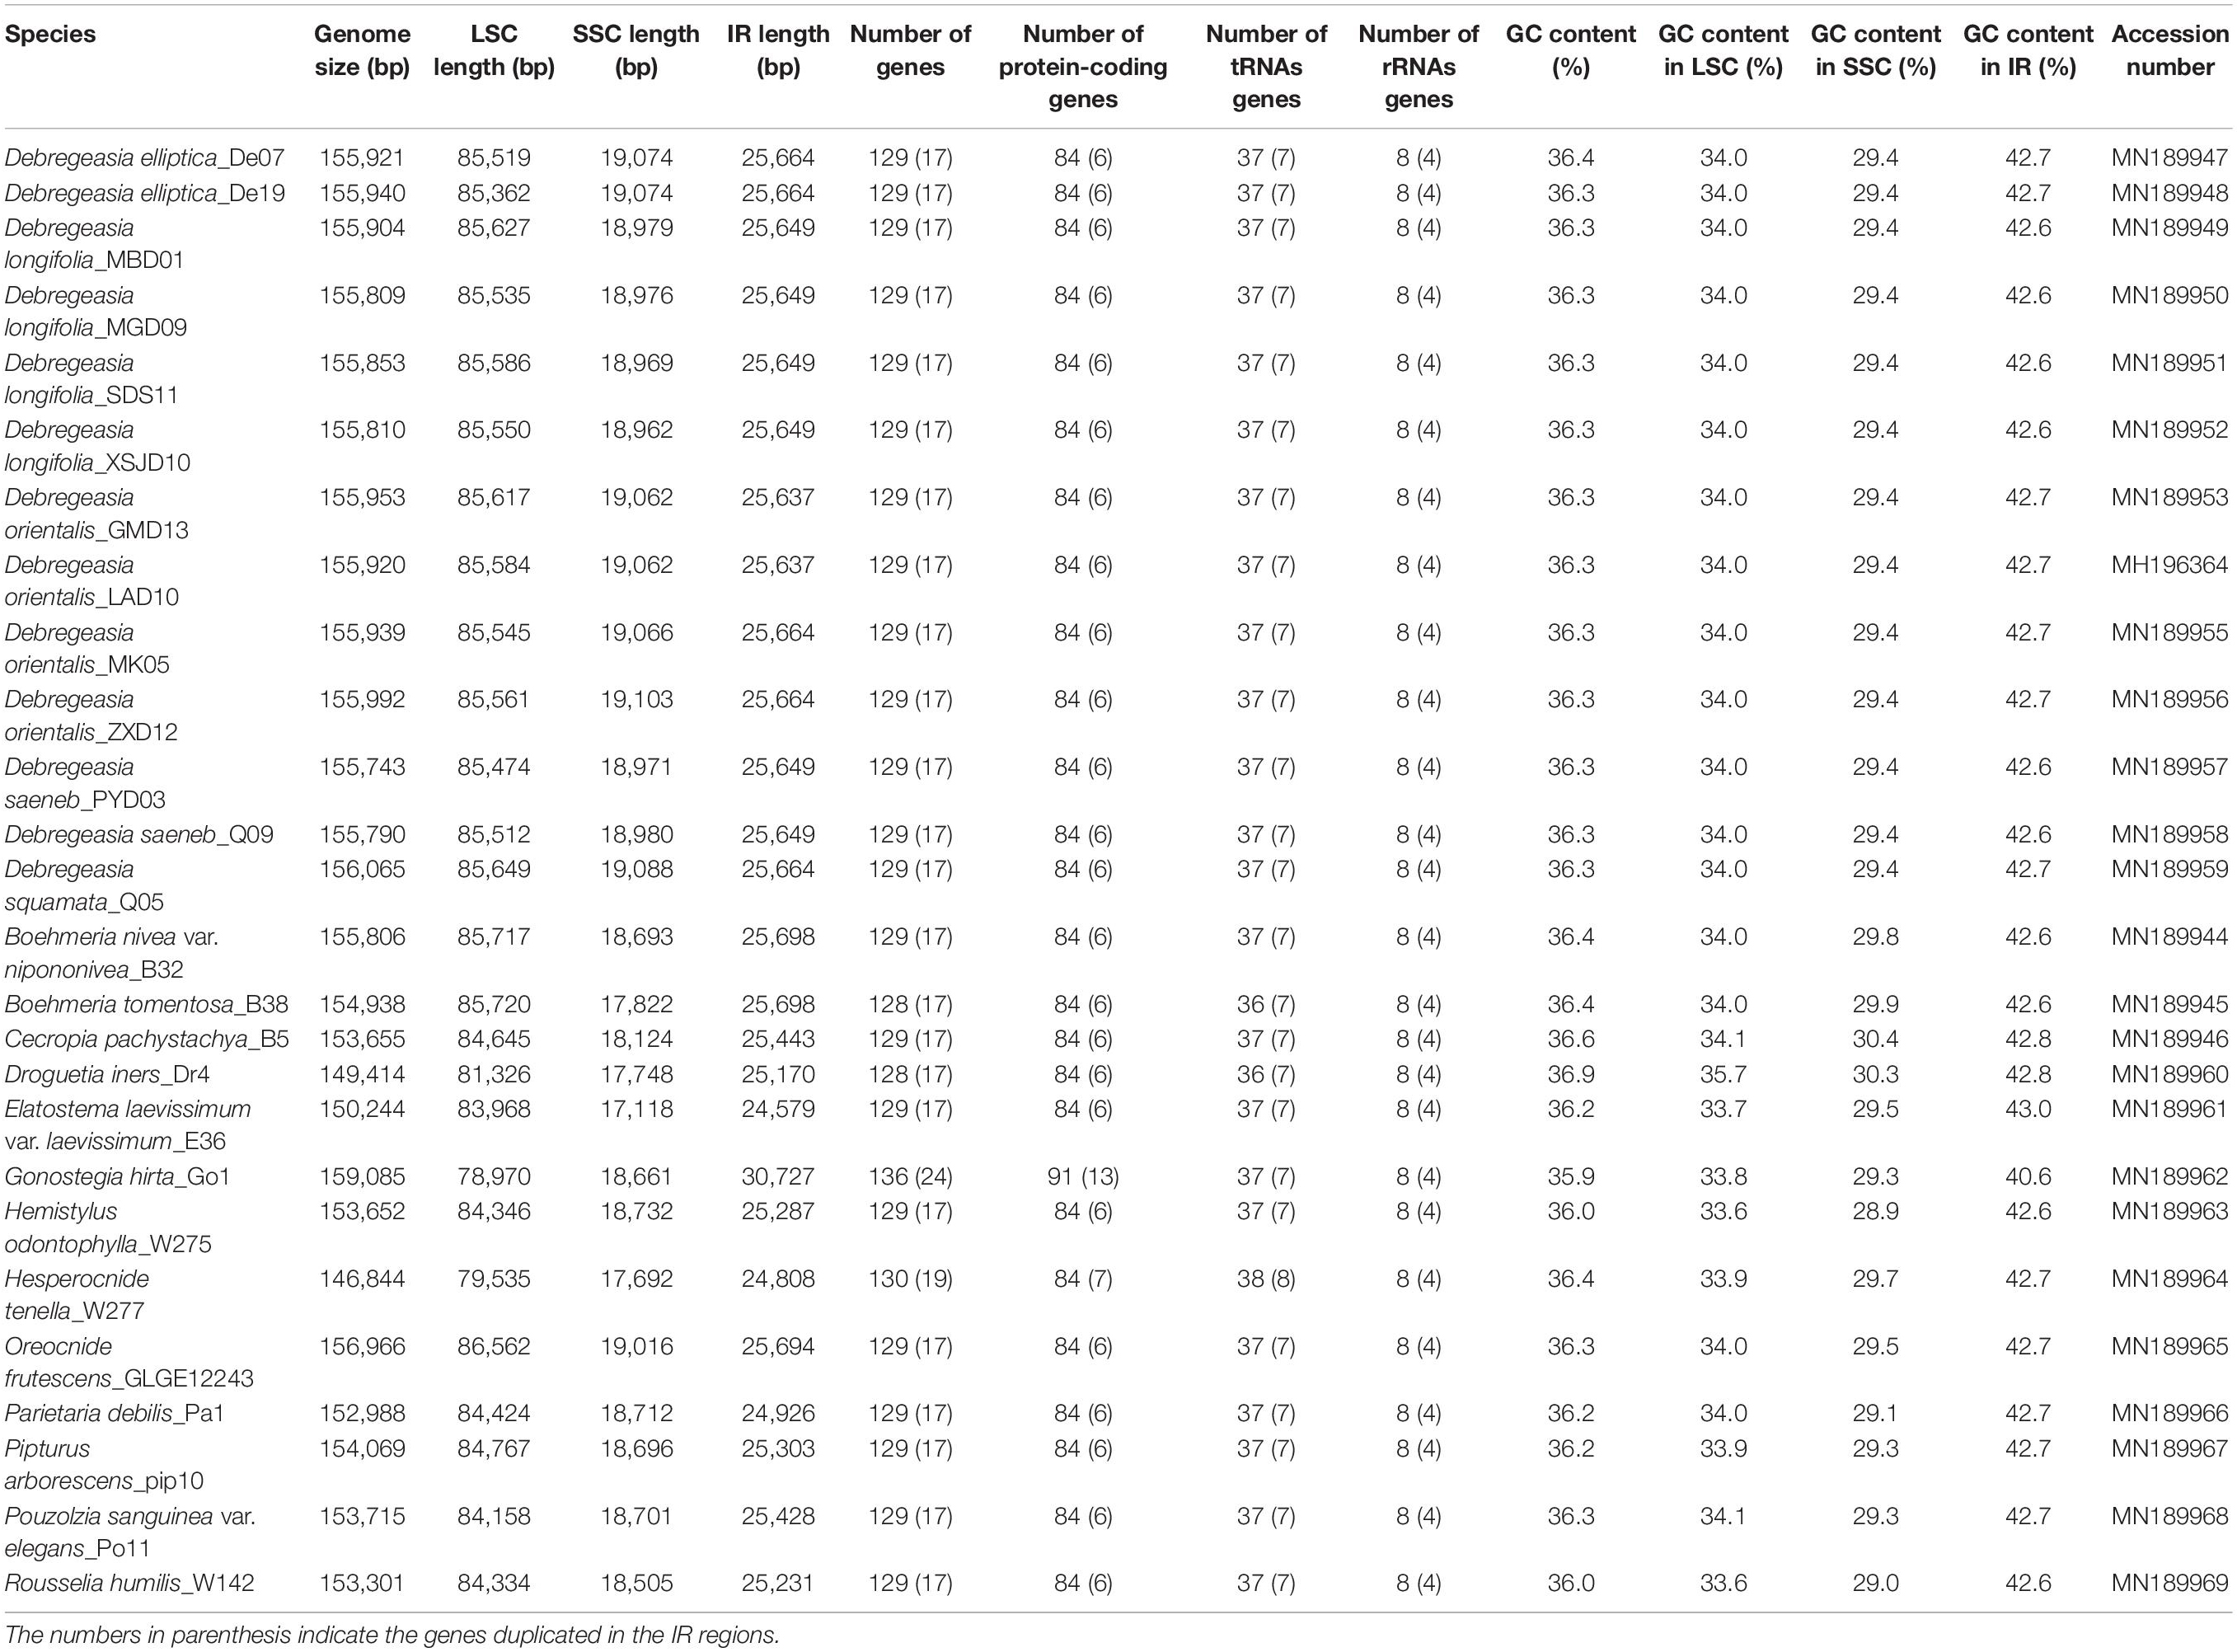
Table 1. Comparison of plastomes features in Debregeasia and other Urticaceae species examined in this study.
For silica gel dried materials, DNA was extracted using a modified hexadecyltrimethylammonium bromide (CTAB) method (Doyle and Doyle, 1987), whereas for herbarium specimens, DNA was extracted using Tiangen DNA secure Plant Kits (DP320) (Tiangen Biotech, Beijing, China). The quality and quantity of DNA were measured on 1% Tris–acetate–ethylenediamine tetraacetic acid (TAE) agarose gels and using fluorometric quantification on the Qubit (Invitrogen, Carlsbad, California, United States). Paired-end libraries with 500 bp insert-size were prepared and then sequenced using the Illumina HiSeq X Ten platform, the length of reads was 150 bp. A total of 2 to 4 Gb clean data were generated for each individual. De novo assemblies were constructed with Spades (Bankevich et al., 2012). GetOrganelle v1.7.0 (Jin et al., 2018) was used to improve accuracy and efficiency in de novo assembly. Reference-guided connecting was subsequently conducted using Bandage (Wick et al., 2015) and Geneious v8.1 (Kearse et al., 2012), to generate circular plastomes. The newly generated genomes were automatically annotated by PGA (Qu et al., 2019), then adjusted and confirmed using Geneious. The patterns of genomic variation among the plastomes were calculated and visualized using OGDRAW v1.3.1 (Greiner et al., 2019) and Circos v0.69-9 (Krzywinski et al., 2009).
REPuter (Kurtz et al., 2001) was used to identify dispersed (including forward, reverse and complement repeat sequences) and palindrome repeat sequences according to the following settings: sequence identity was 90%, Hamming distance equal to 3, the minimum repeat size was 30 bp and the maximum computed repeats was 100. The tandem repeats were identified using the online Tandem Repeats Finder (Benson, 1999). The alignment parameters match, mismatch, and indels were 2, 7, and 7, respectively. The minimum alignment score to report repeats was 80. The maximum period size and TR array size were limited to 500 bp and two million bp, respectively. ESTs (Thiel et al., 2003) was used to identify simple sequence repeats (SSRs) with the minimum repeat number set to 10, 5, 4, 3, 3, and 3 for mono-, di-, tri-, tetra-, penta- and hexa-nucleotides, respectively.
In order to determine the structure and sequence divergence of the plastomes of Debregeasia, we used the Mauve alignment tool embedded in Geneious, and the VISTA framework (Frazer et al., 2004) to compare the 13 plastomes. The boundaries between the IR and SC regions of these were compared and analyzed. Individual coding and non-coding regions were extracted by Geneious, and homologous loci were aligned using MAFFT v1.3.3 (Katoh et al., 2002). Then we determined the percentage of variable sites, calculated thus: (number of nucleotide substitutions + number of indels) / (length of aligned sites minus length of indels + number of indels) * 100%. Following this, the seven regions with the highest mutation rate were identified as mutation hotspots for Debregeasia. Due to the over-conserved genomic structure of Debregeasia plastomes, we compared in a similar way the 13 outgroup species, with each other and with Debregeasia, to investigate plastome structures and sequence divergence across Urticaceae, and hence identified the seven most variable regions at family level.
Non-synonymous (dN) and synonymous (dS) nucleotide substitution rates, as well as their ratios (w = dN/dS) were analyzed using Codeml (PAML v4.7) (Yang and Nielsen, 2002; Yang, 2007). The protein-coding genes were extracted and aligned using MAFFT. Six site-specific models (M0, M1, M2, M3, M7, and M8) were applied, to identify the selection pressure across plastomes. These models allowed the ω ratio to vary among sites, with a fixed ω ratio in all the branches. The dN, dS, and ω values were calculated with Codeml (seqtype = 1, model = 0, NSsites = 0, 1, 2, 3, 7, 8). Then we compared pairs of site-specific models as follows: M0 (one-ratio) vs. M3 (discrete), M1 (nearly neutral) vs. M2 (positive selection) and M7 (β) vs. M8 (β and ω) to analyze the existence of positive selection, with p values for each comparison determined via a Likelihood ratio test (LRT). Bayes Empirical Bayes inferences were calculated in site models M2 and M8 to estimate the posterior probabilities and positive selection pressures of the selected genes.
Phylogenetic relationships of the examined Debregeasia species, plus 13 outgroup species, were analyzed using four datasets, all based on plastome data. These were (a) complete plastomes, (b) plastome protein-coding genes, (c) those mutational hotspots identified that were among the seven most variable at both genus and family level (i.e., rpoB-trnC-GCA, trnT-GGU-psbD, and ycf1), and (d) those mutational hotspots identified that were among the seven most variable at genus level, or at family level, or both (i.e., psbK-psbI, rpl36-rps8, rpoB-trnC-GCA, trnK-UUU-rps16-trnQ-UUG, trnP-UGG-psaJ, trnT-GGU-psbD, trnT-UGU-trnL-UAA, ycf4-cemA, matK, ndhF, and ycf1). The datasets were aligned with MAFFT. The best substitution model (TVM+G) was determined by the Bayesian information criterion (BIC) in jModelTest2 (Darriba et al., 2012). Maximum likelihood (ML) analyses were performed using RAxML v2.0.1 (Stamatakis, 2006) with 1000 bootstrap replicates. Maximum Parsimony (MP) phylogenetic trees were constructed using MEGA v7.0 (Kumar et al., 2016). Bayesian inference (BI) was carried out by MrBayes v3.2 (Ronquist et al., 2012) at the CIPRES Science Gateway v3.3 (Miller et al., 2010). One-million-generation iterations were performed, with trees being sampled every 200 generations, with four runs, each with four chains run in parallel. The Markov Chain Monte Carlo (MCMC) output (infile.nex.run1.p files) was examined to check convergence and to ensure that all the Effective Sample Sizes (ESS) values were above 200. Figtree v1.4 (Rambaut, 2012) was used to visualize and annotate the output trees.
The plastomes of all five Debregeasia species had a typical quadripartite structure, comprising a large single-copy (LSC) region and a small single-copy (SSC) region separated by a pair of inverted repeats (IRa and IRb) (Figure 1). The total length of the plastomes of these five species ranged from 155,743 bp (D. saeneb_PYD03) to 156,065 bp (D. squamata_Q05). The length of the LSC region ranged from 85,362 bp (D. elliptica_De19) to 85,649 (D. squamata_Q05), whereas that of the SSC region ranged from 18,962 bp (D. longifolia_XSJD10) to 19,103 bp (D. orientalis_ZXD12). The two IR regions had identical lengths within any individual, ranging from 25,637 bp (D. orientalis_GMD13 and D. orientalis_LAD10) to 25,664 bp (D. elliptica_De07, D. elliptica_De19, D. orientalis_MK05, D. orientalis_ZXD12, and D. squamata_Q05). For full details, plus those for the 13 outgroup species, see Table 1.
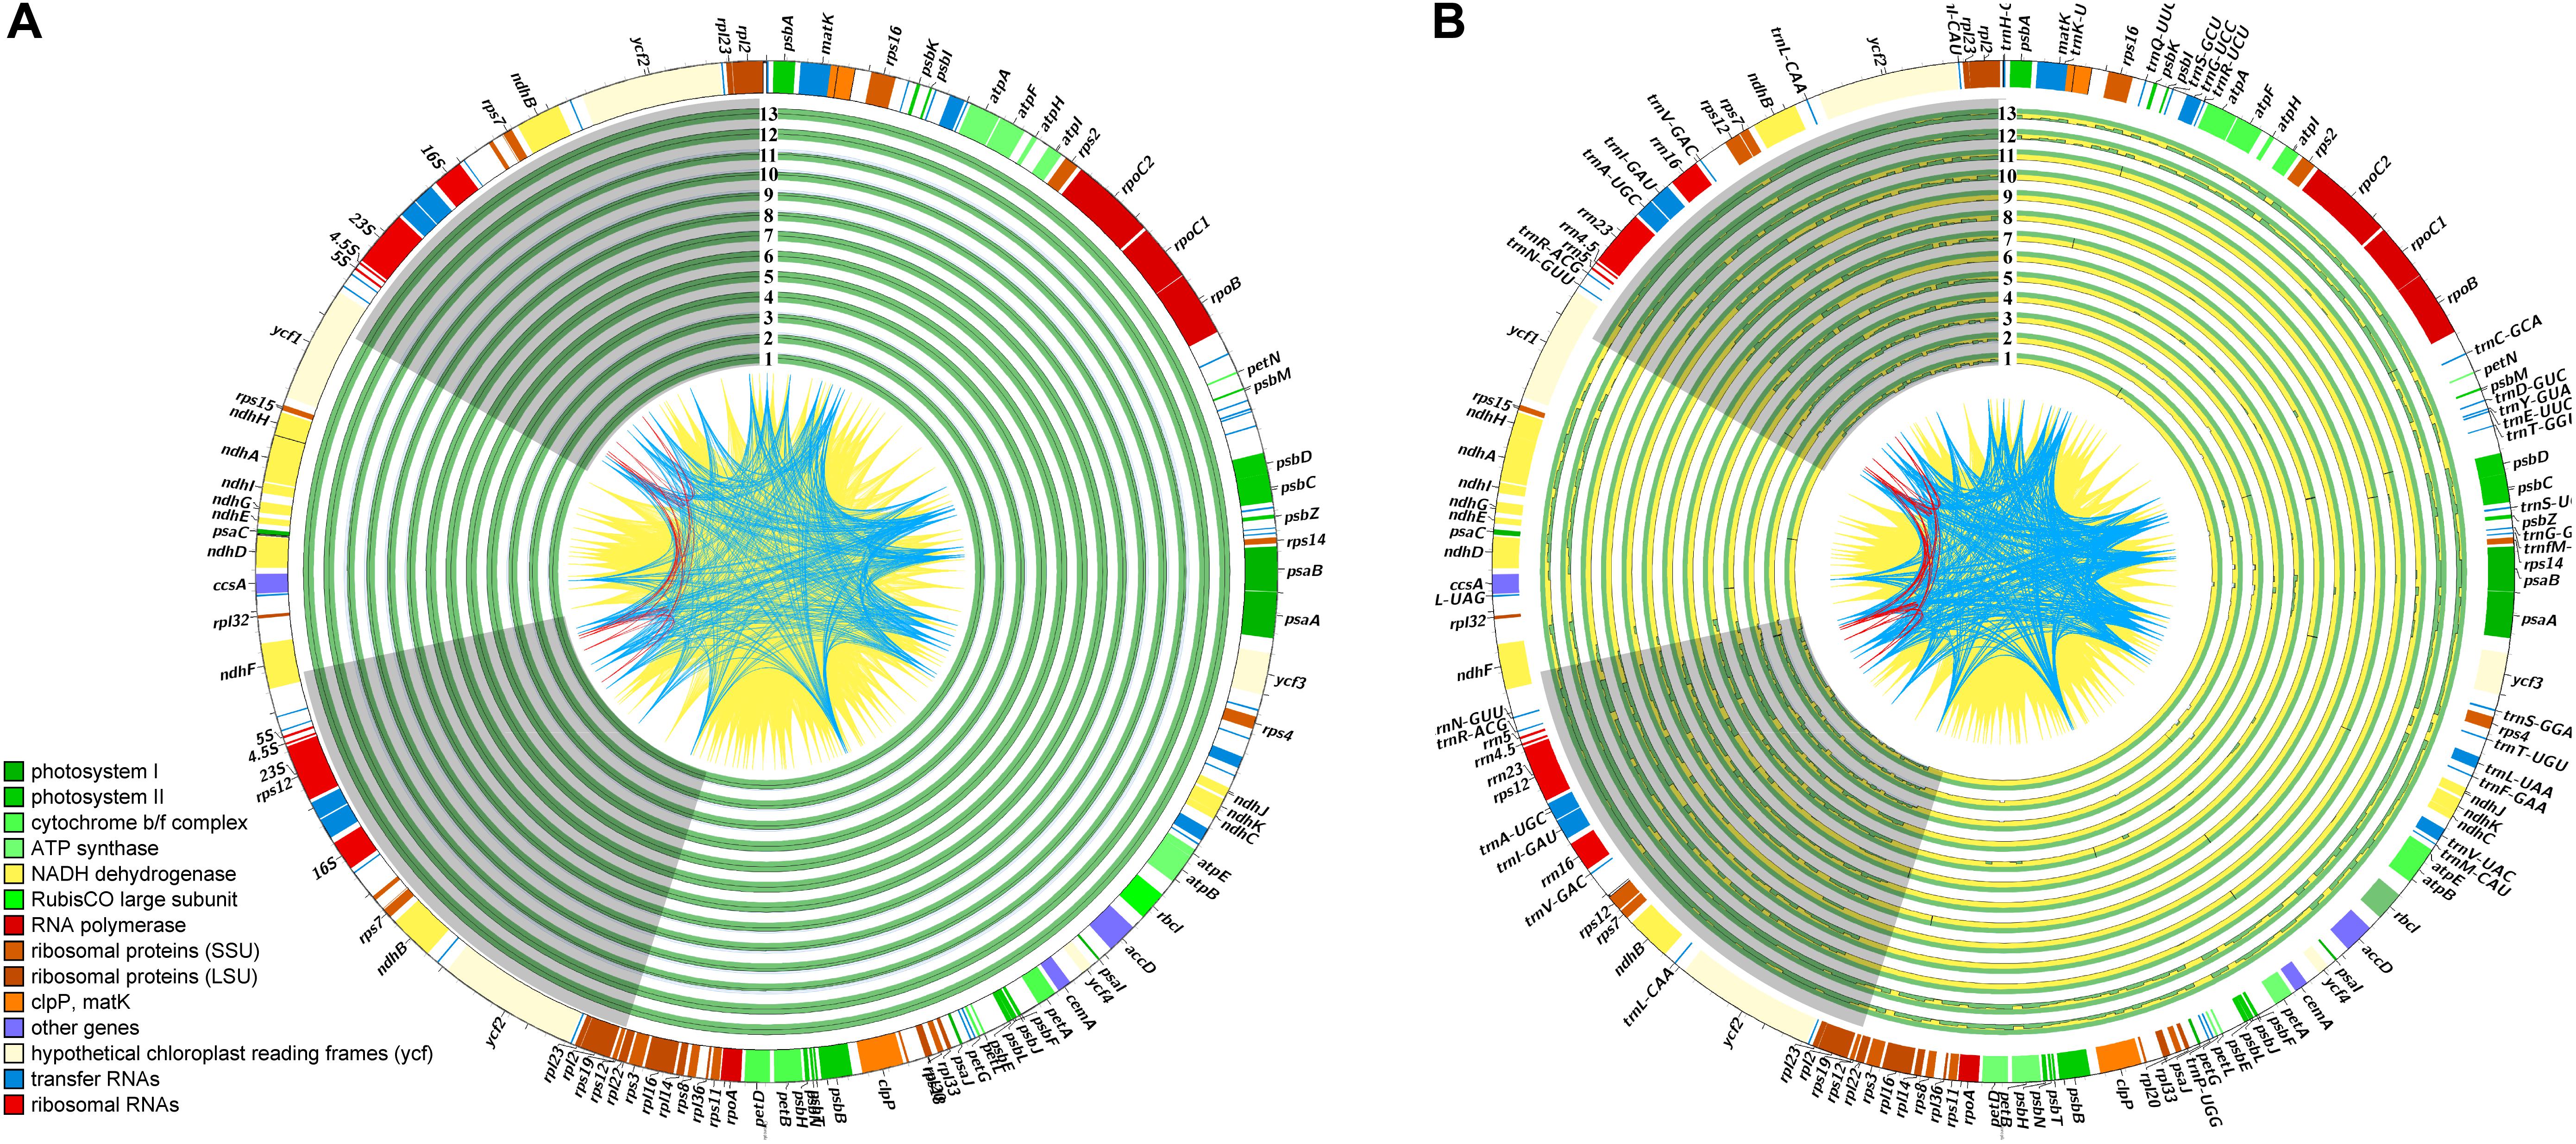
Figure 1. An overview of plastome variation. In the quadripartite structure of these plastomes, the two IR regions (IRa and IRb) are shown with gray background, while the large and small single-copy regions (LSC and SSC) are displayed with blank background. The lines, CDS to CDS, are filled with yellow ridges while the tRNA to tRNA are occupied with blue ridges, and other red lines are rRNA to rRNA. The identical sites is filled with green ridges while the variations are occupied with yellow ridges. (A) An overview of plastome variation across the Debregeasia, with D. elliptica_De07 as reference. The studied Debregeasia species are indicated as in Supplementary Table S6. (B) An overview of plastome variation across the Urticaceae, with D. elliptica_De07 as reference. The sampled Urticaceae species information are listed in Supplementary Table S7.
A total of 129 genes were identified, comprising 84 protein coding genes, 37 tRNA genes and 8 rRNA genes. Of these, 17 genes (6 protein coding genes, 7 tRNA genes and 4 rRNA genes) were duplicated in the IR regions in all Debregeasia species (Tables 1, 2). The gene rps19 crossed both the LSC and IRb regions (Supplementary Figure S1), whereas both ndhF and ycf1 were situated in the SSC but crossed the two IR regions in different directions. Eighteen genes had introns, among which fifteen genes (atpF, ndhA, ndhB, petB, petD, rpl2, rpl16, rpoC1, rps16, trnA-UGC, trnG-UCC, trnI-GAU, trnK-UUU, trnL-UAA, and trnV-UAC) contained a single intron, whereas three (clpP, rps12, and ycf3) contained two introns (Table 2).
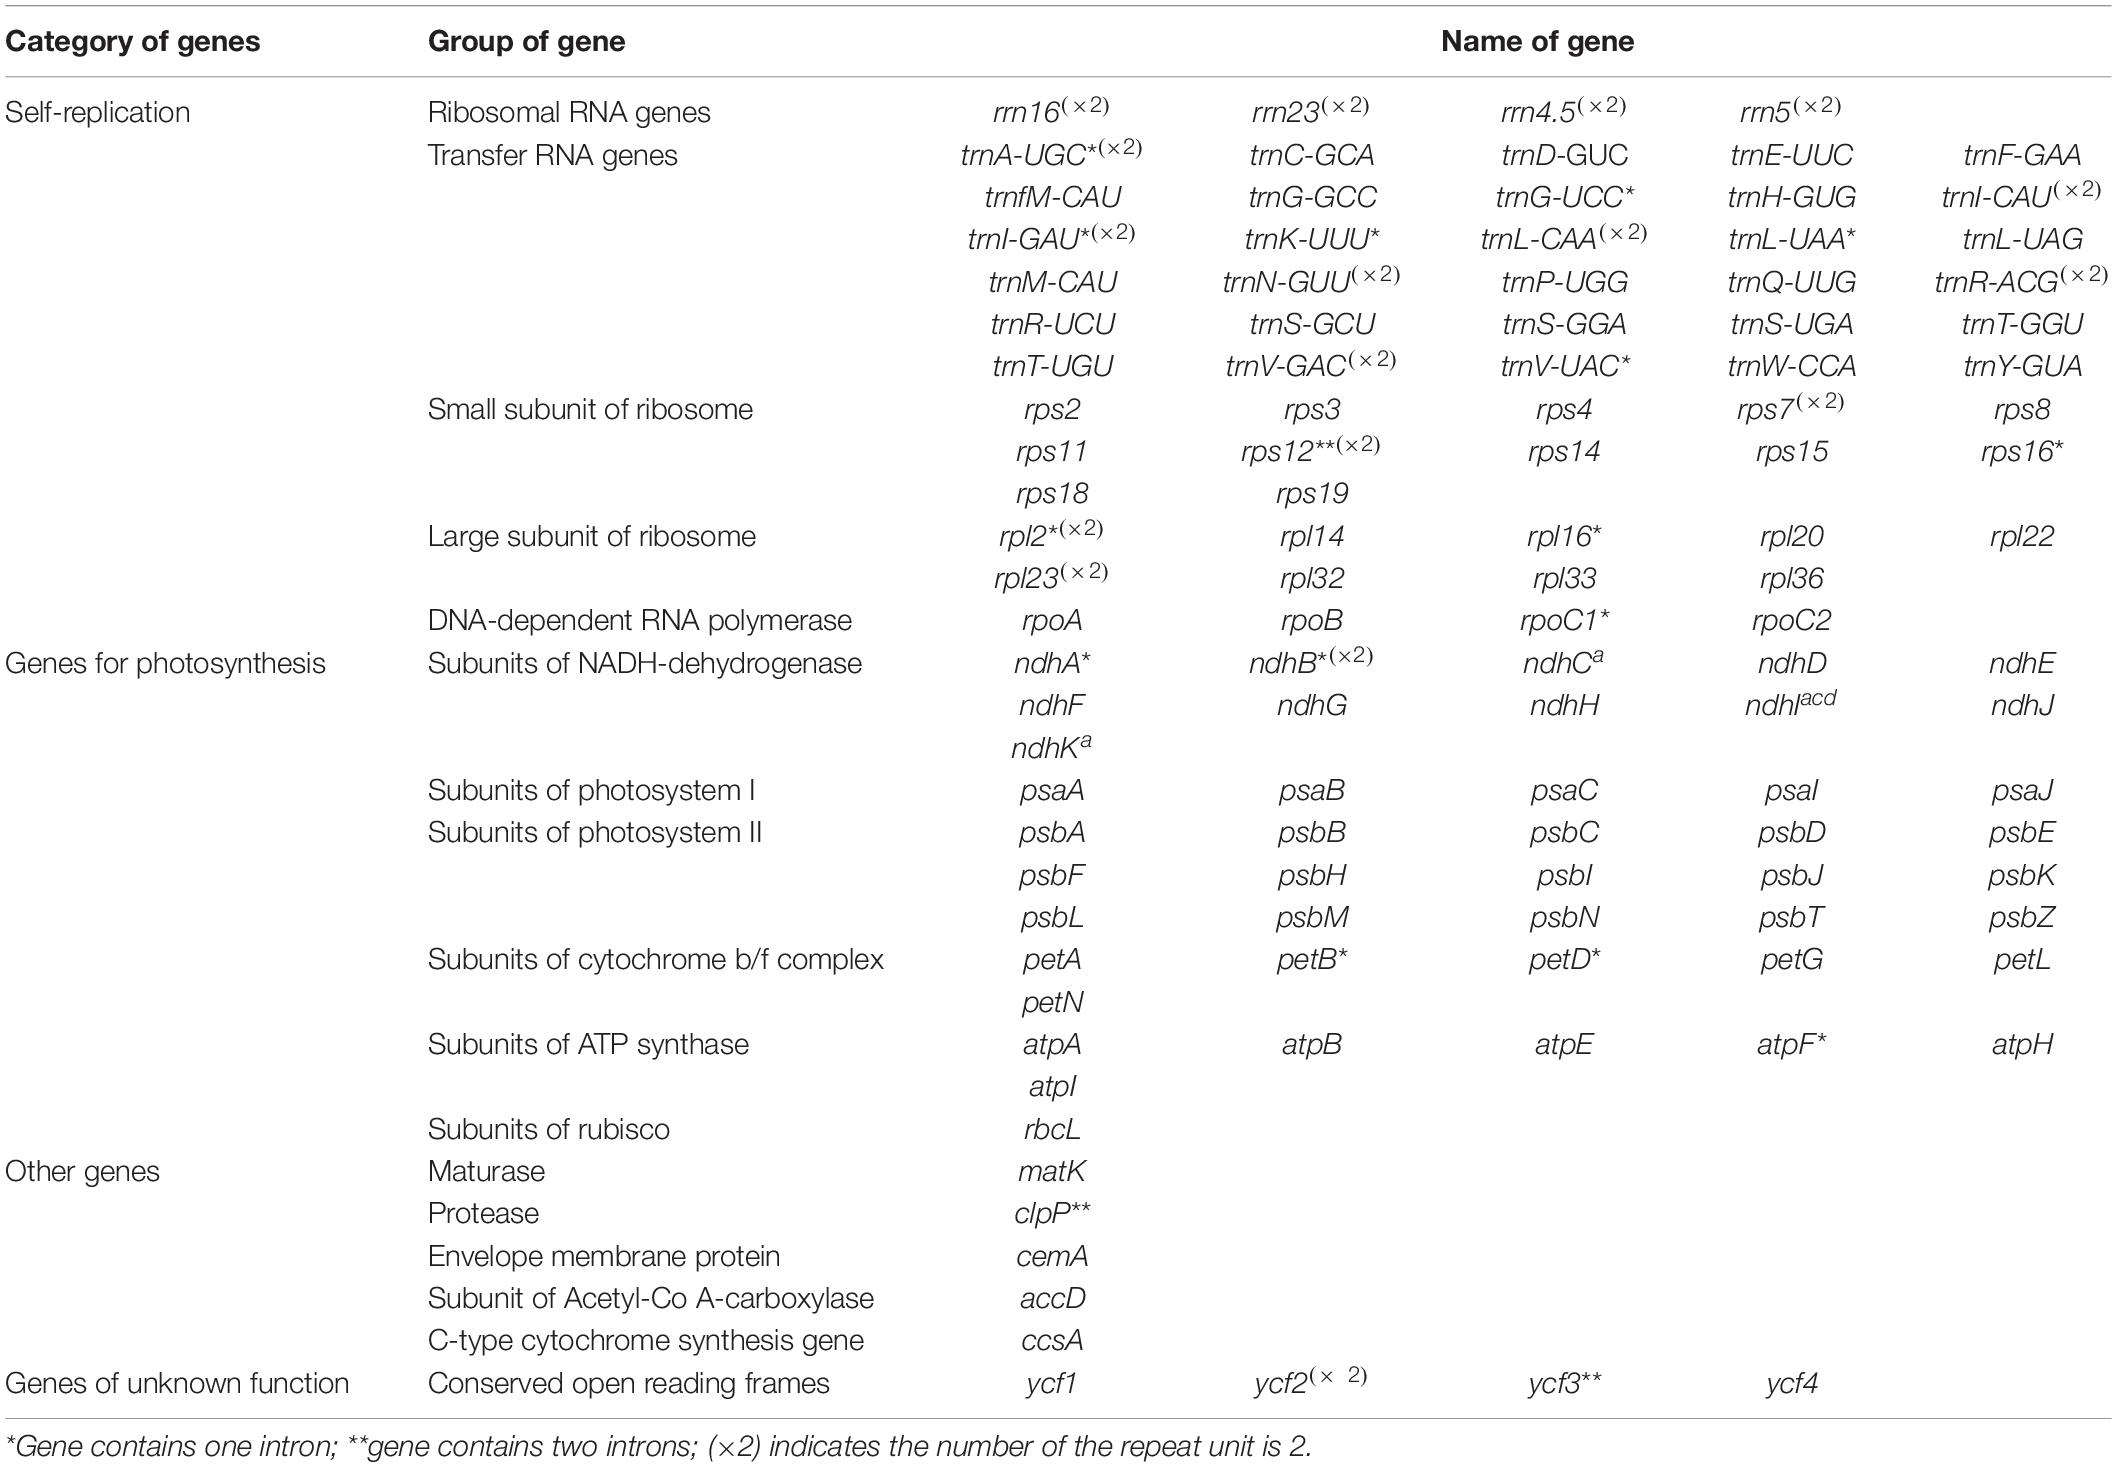
Table 2. List of genes present in the plastomes of five Debregeasia species.
Within Debregeasia, no IR contraction was observed in any plastomes, whereas IR expansion generally seemed very conservative. In outgroups, the LSC/IR and IR/SSC boundaries showed some differences from Debregeasia (Figure 2). In Gonostegia hirta_Go1, the gene rps11 crossed from LSC to IRb, and the rpl36 gene was near the IRa/LSC boundary. In Droguetia iners_Dr4, the gene rps19 was only in the large single-copy. In Parietaria debilis_Pa1, the genes rps19 and trnH-GUG crossed from the LSC to the IRb and IRa regions, respectively. In Hesperocnide tenella_W277, trnH-GUG was copied in both IR regions.
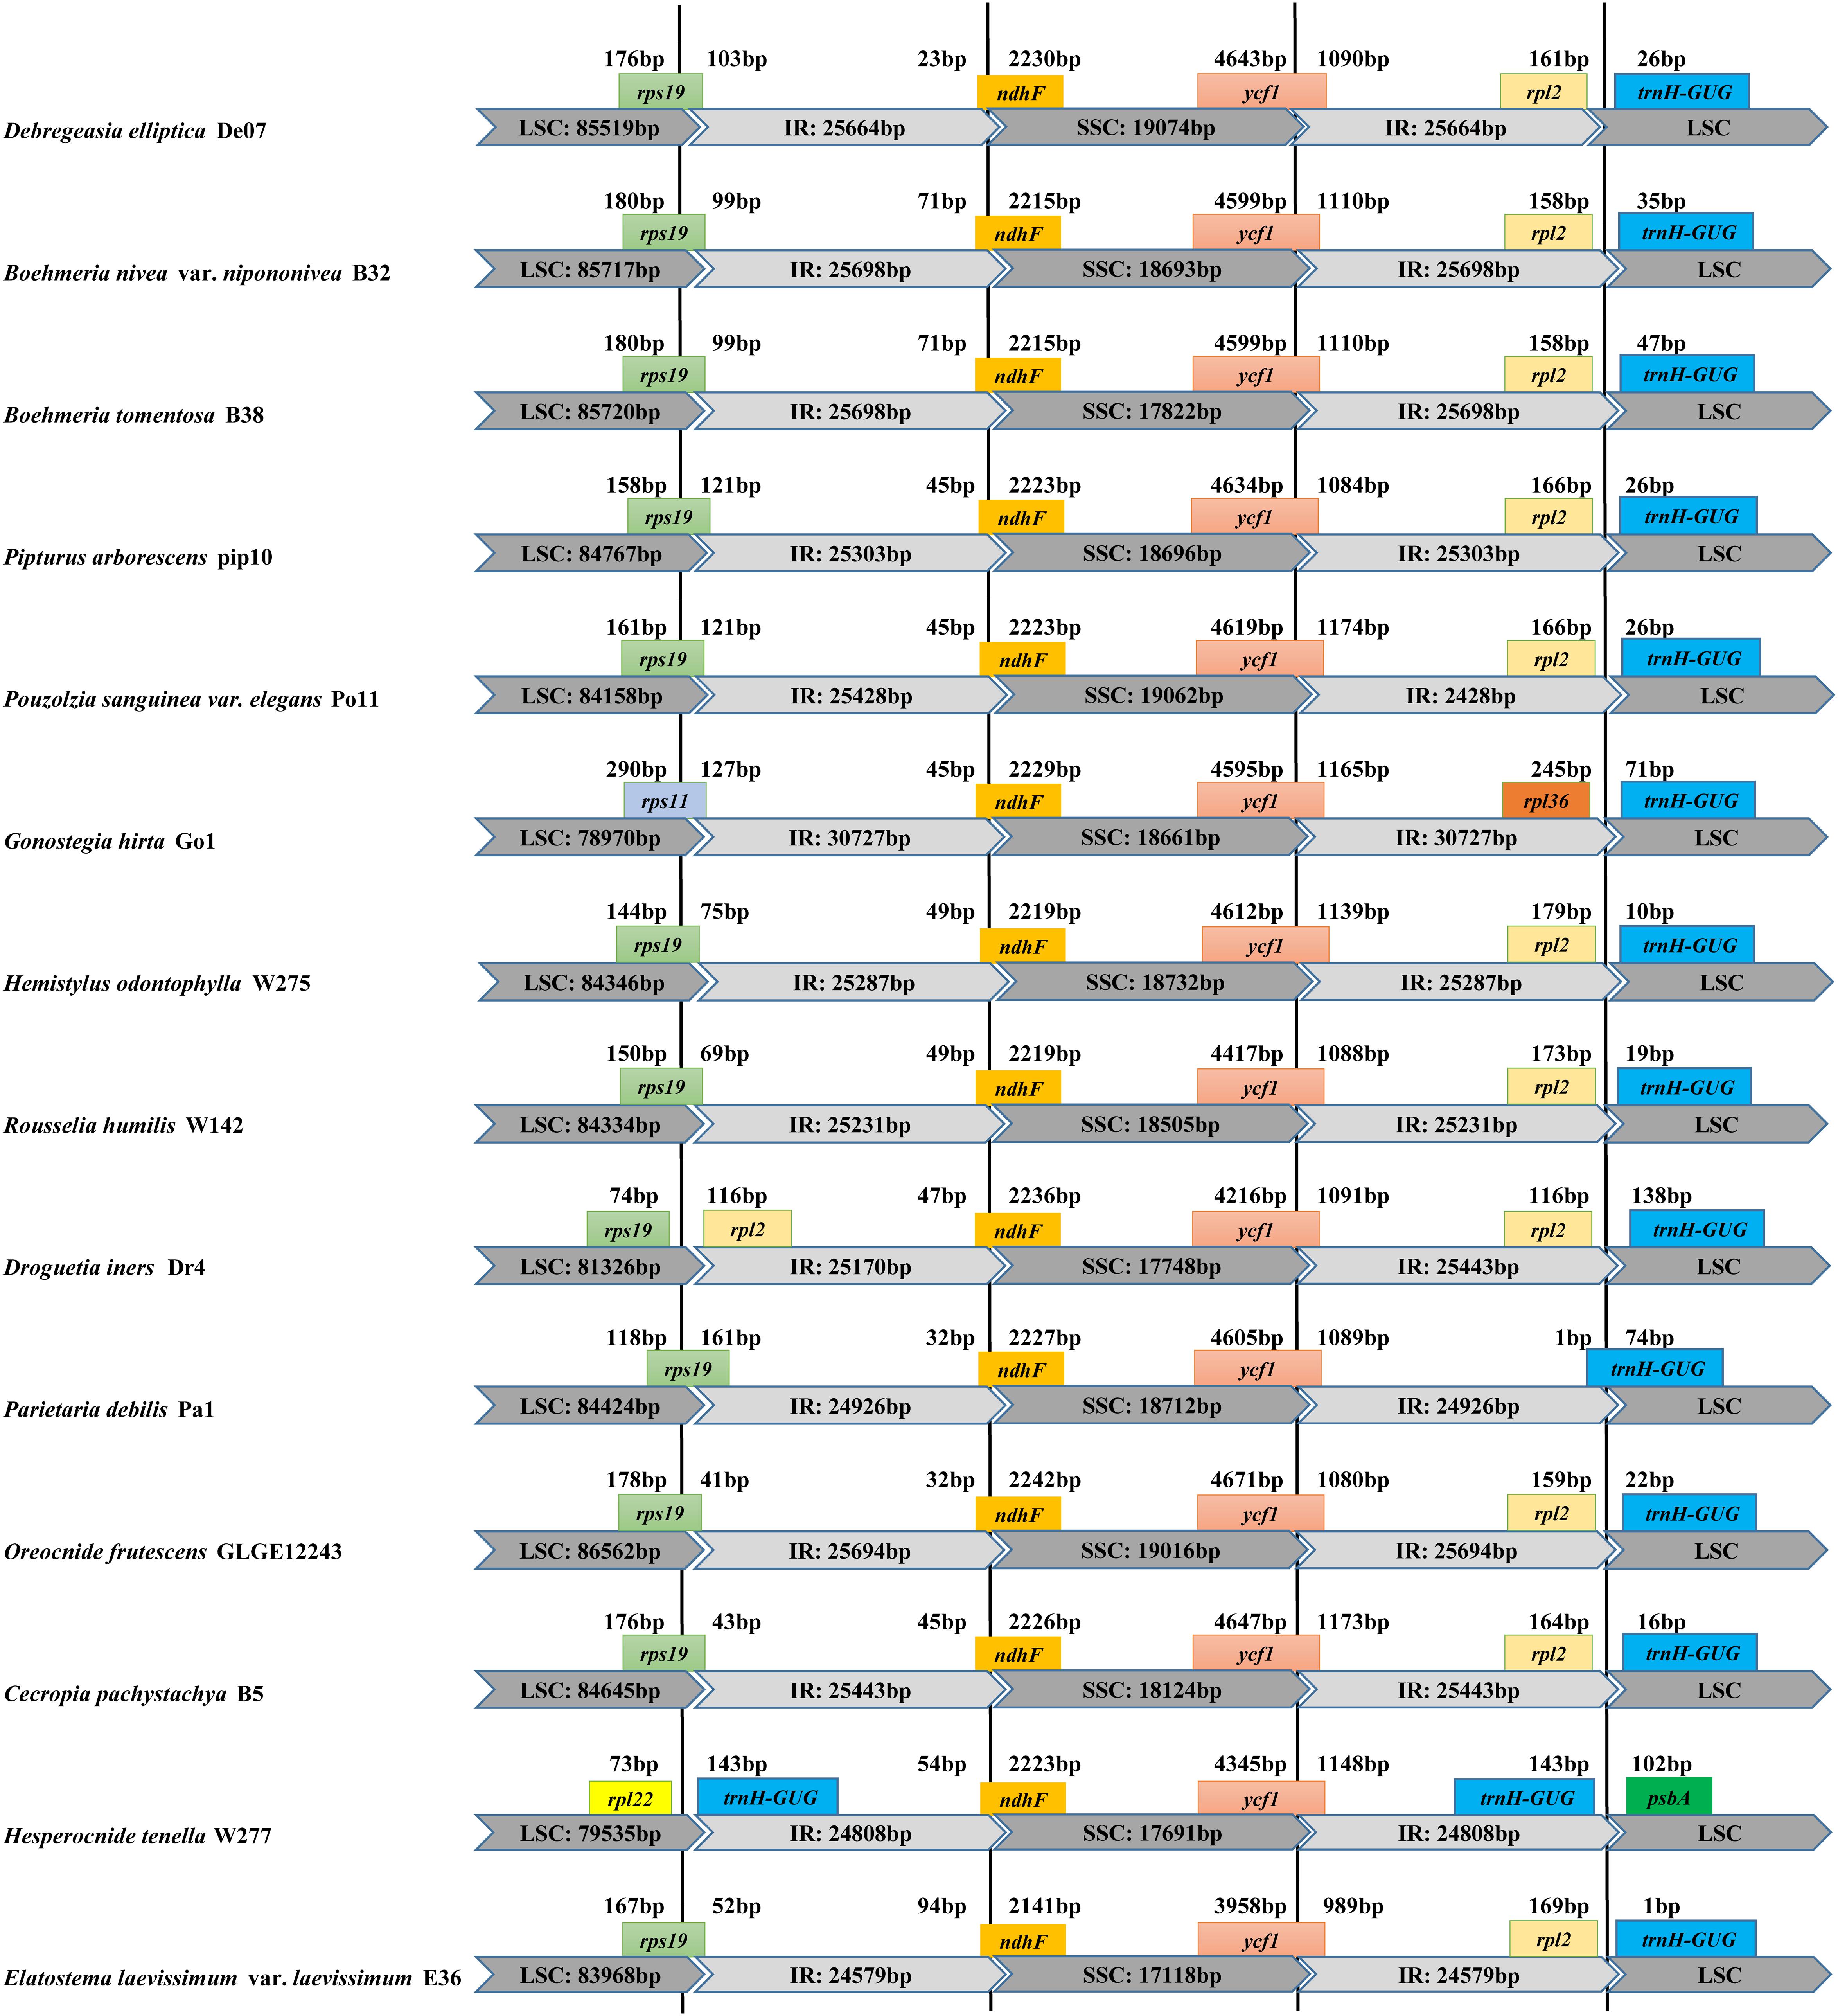
Figure 2. Comparison of the borders of LSC, SSC, and IR regions between the complete plastomes of D. elliptica_De07 and 13 other Urticaceae species.
A total of 932 repeats were identified in Debregeasia, falling into three categories (Table 3). Of these, the most frequent were palindromic repeats, which occurred 363 times (38.95%), followed by tandem repeats (337 instances, 36.16%), and dispersed repeats (forward, reverse, or complement), of which there were 232 (24.89%). The individual accession with the greatest number of repeats was D. squamata_Q05 with 87, comprising 22 dispersed repeats, 31 palindromic repeats, and 34 tandem repeats. The greatest numbers of dispersed, palindromic and tandem repeats were found in D. elliptica_De19 (22), D. elliptica_De07 (31) and D. squamata_Q05 (34), respectively (Figure 3).
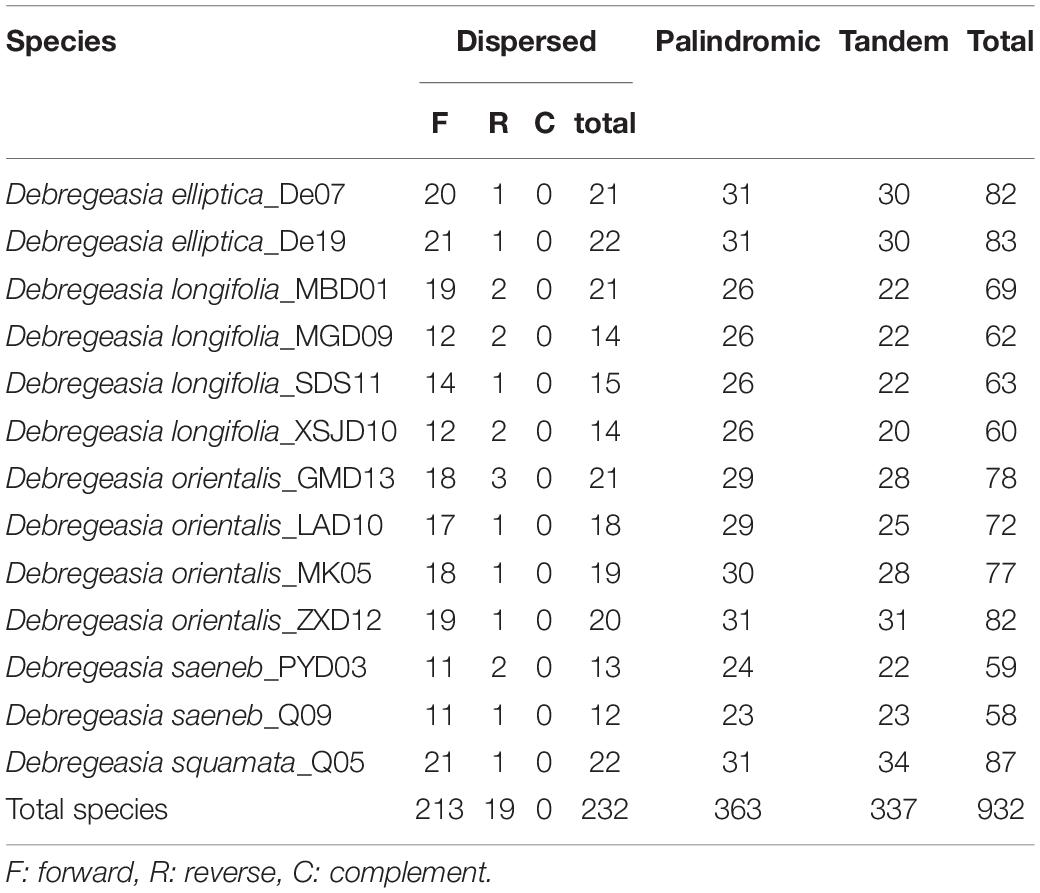
Table 3. The distribution of repeats across the plastomes of Debregeasia.
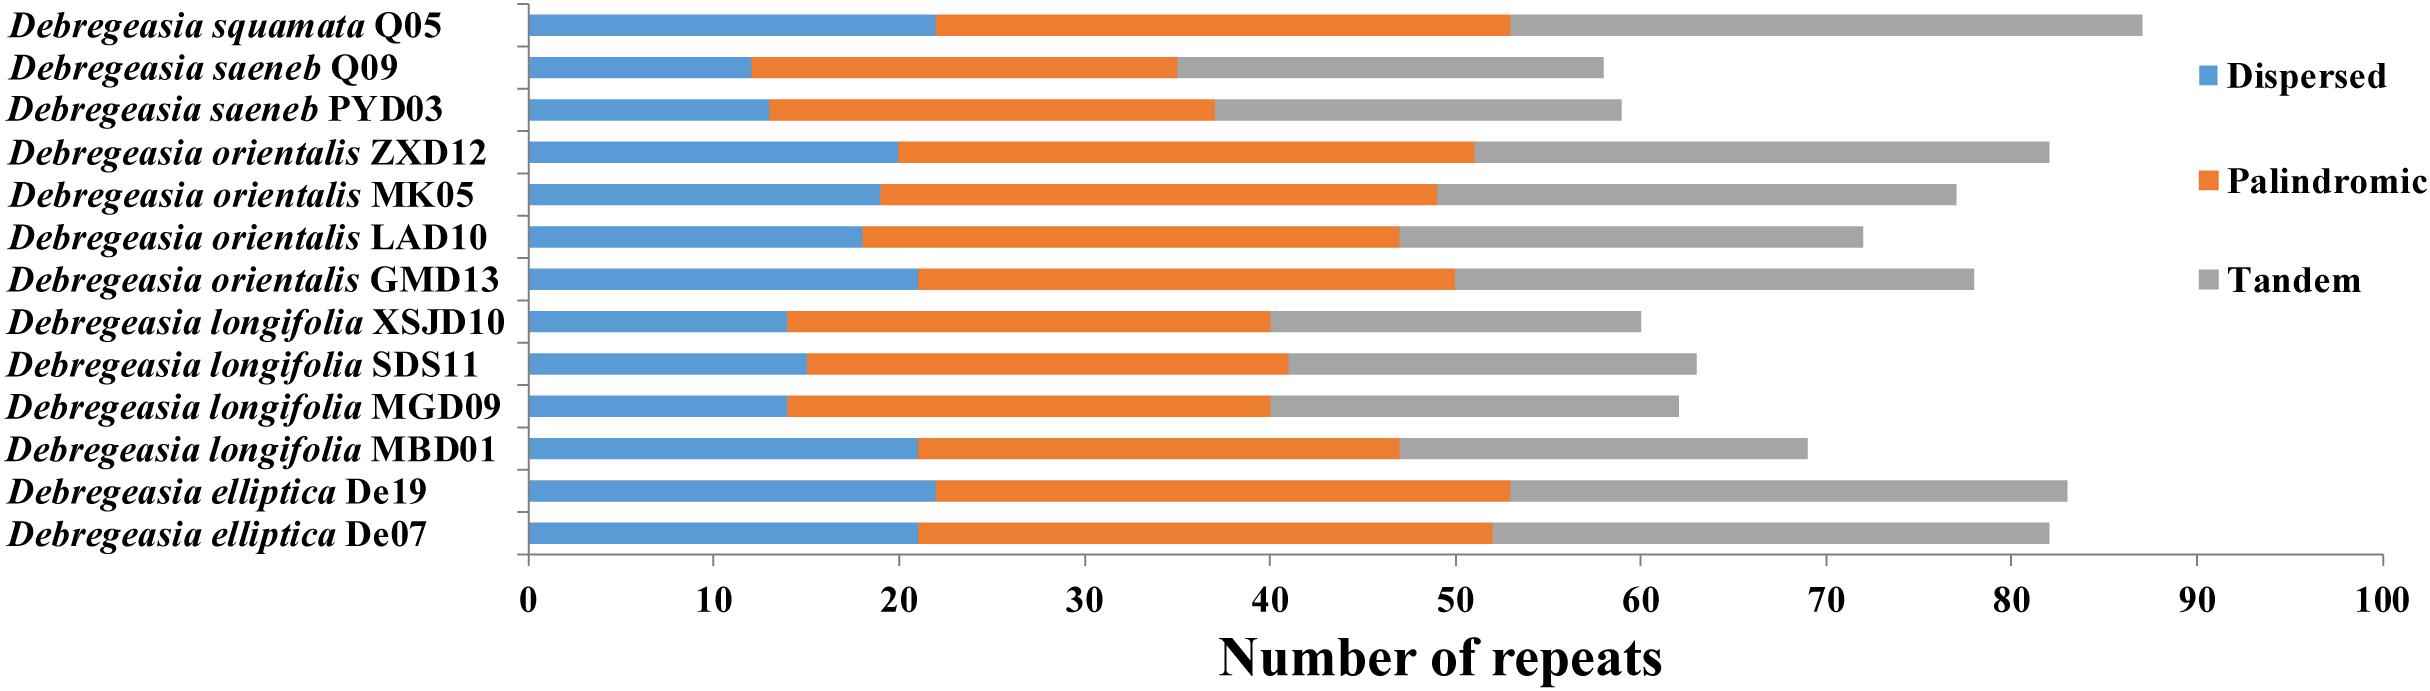
Figure 3. The numbers of three types of repeats in 13 individuals of five Debregeasia species.
Six kinds of SSRs (mono-, di-, tri-, tetra-, penta- and hexa-nucleotide) were identified in the plastomes of Debregeasia, with 1,091 SSRs detected in total (Supplementary Table S2 and Figure 4). The most frequent SSRs were mononucleotides, making up 72.41% of the total, of which T, A, C and G mononucleotides comprised 41.61%, 29.51%, 1.28%, and none, respectively (Supplementary Table S3 and Figure 4). The frequency of SSRs was inversely proportional to their length, except that tetranucleotide SSRs were more common than trinucleotide SSRs. Within D. longifolia, the total number of SSRs varied from 79 (D. longifolia_MGD09) to 86 (D. longifolia_MBD01 and D. longifolia_SDS11), with D. longifolia_XSJD10 intermediate with 83. Within other Debregeasia species, number of SSRs varied by no more than two between accessions examined, so the variation in SSR number in D. longifolia is unusual in the genus (Figure 4).
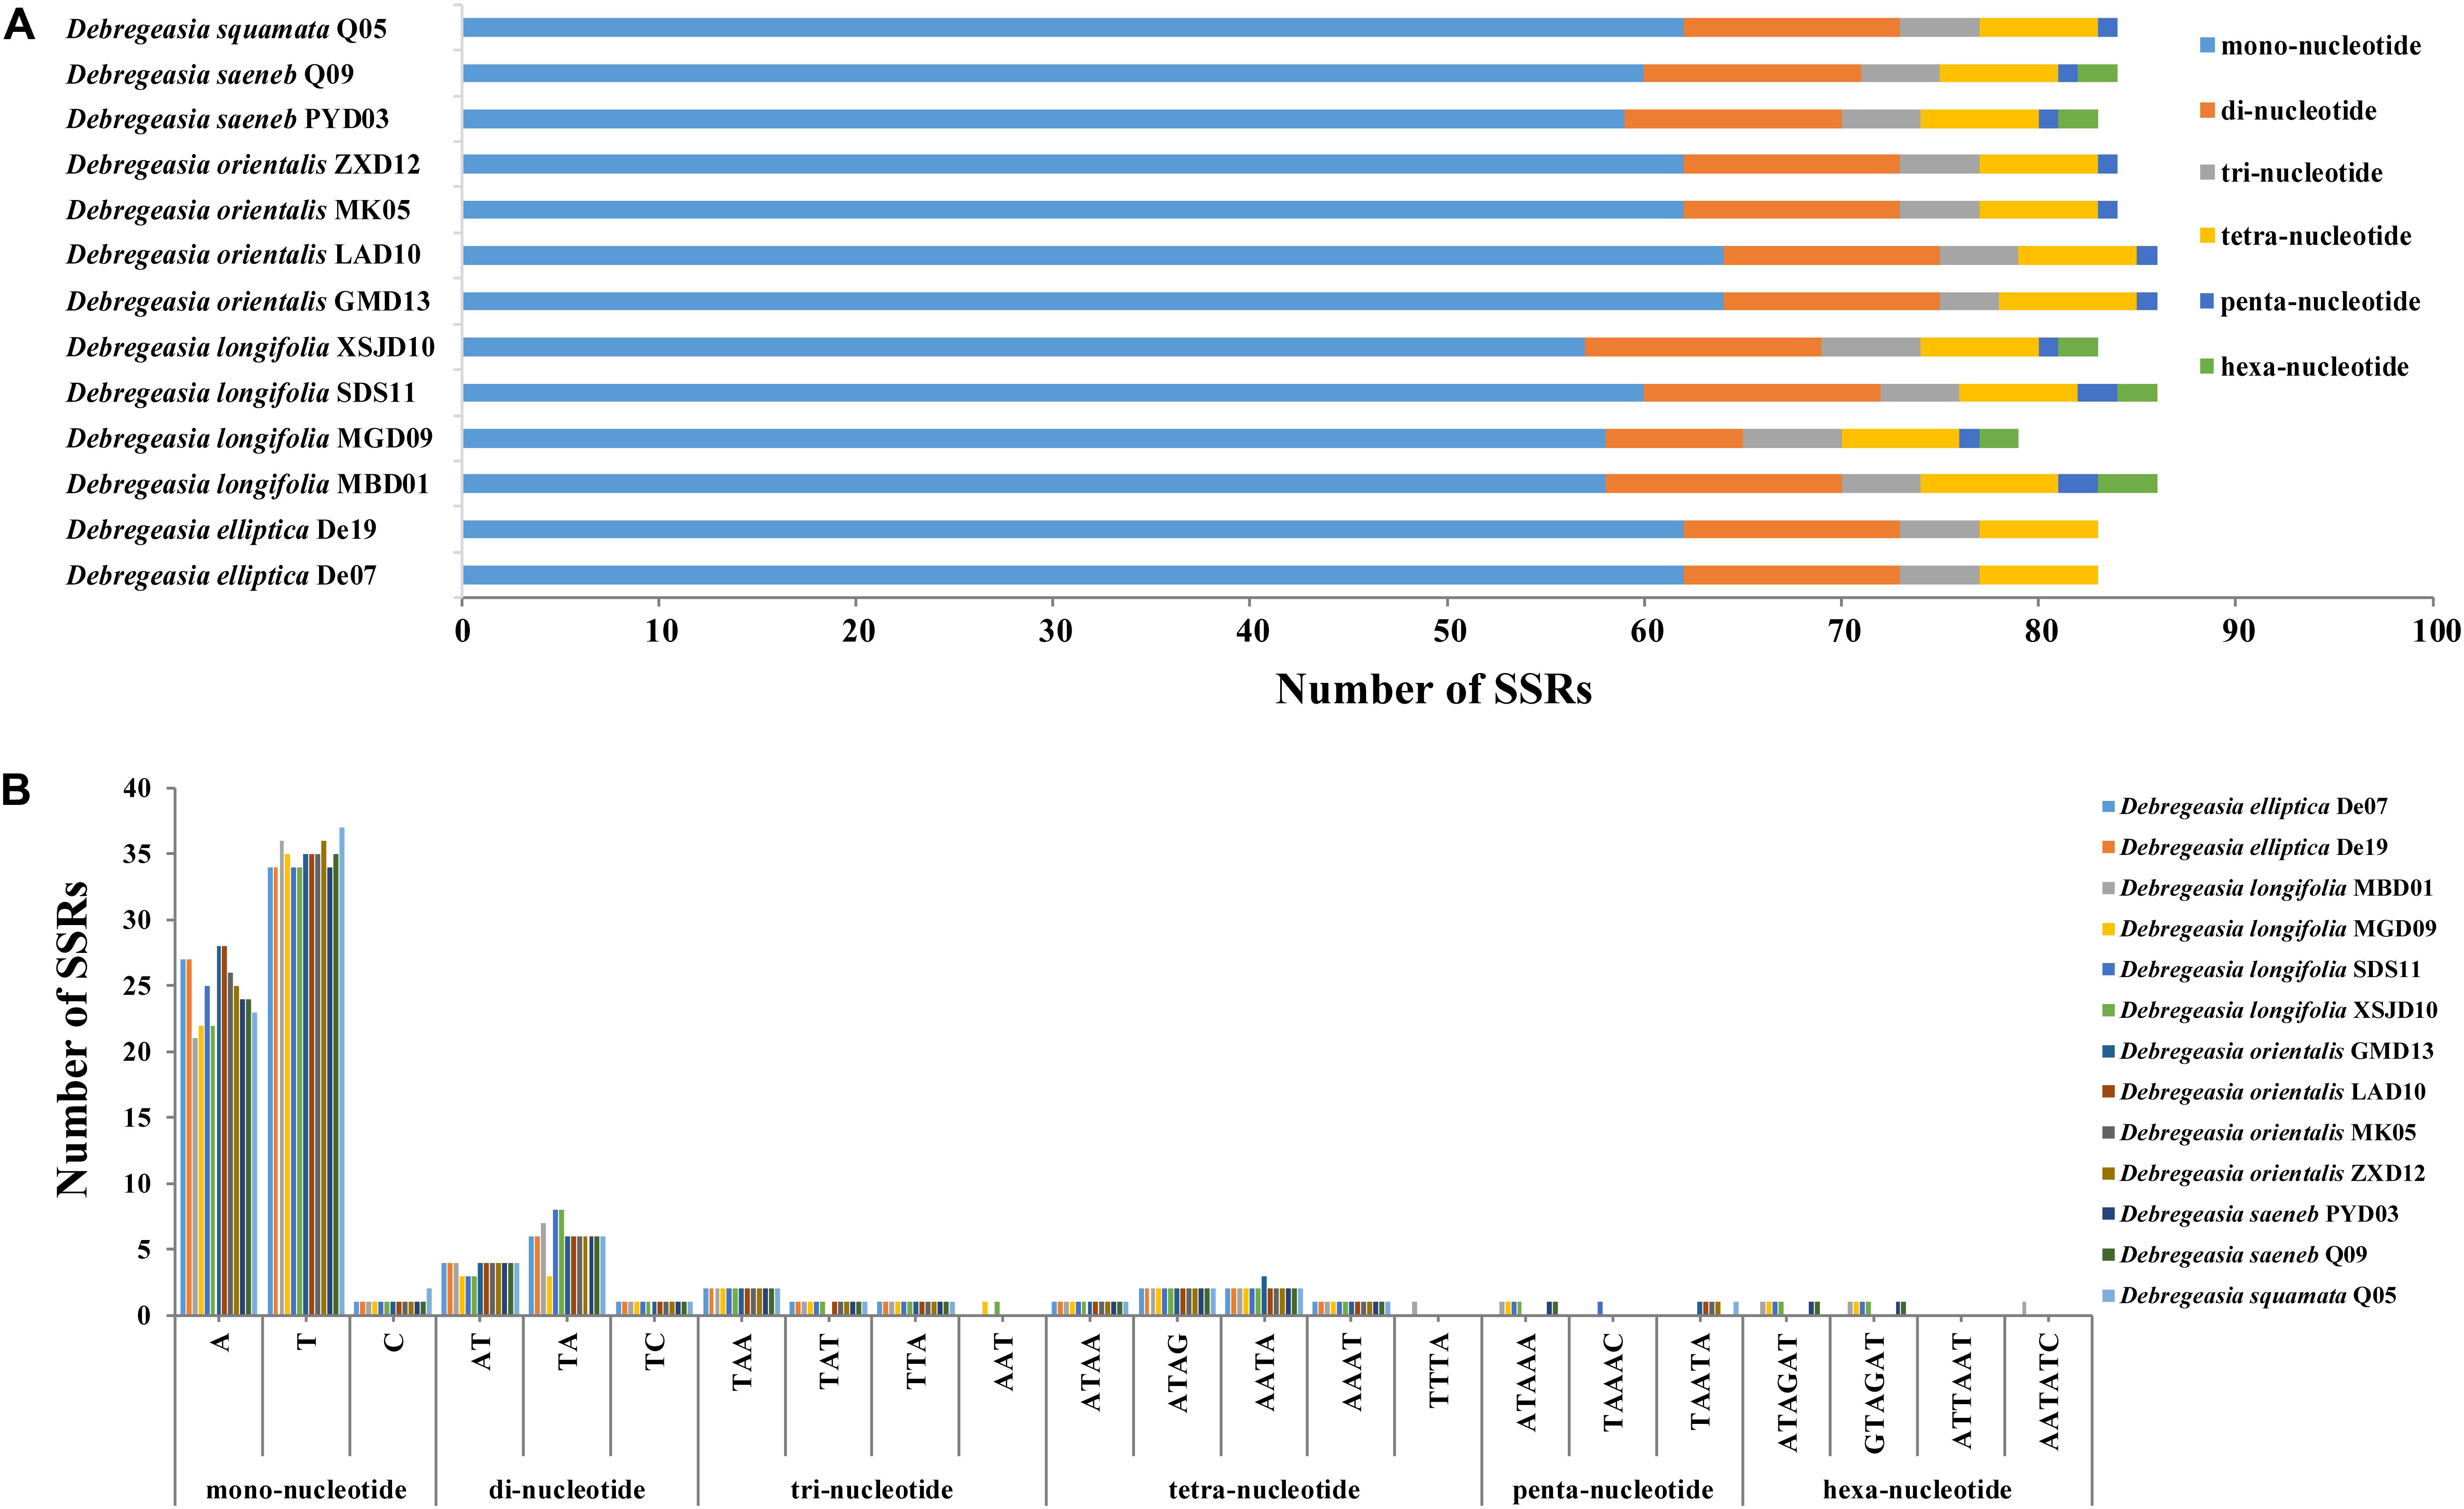
Figure 4. The maps of simple sequence repeats in Debregeasia, based on 13 individuals of five species. (A) The number of SSRs of each of six repeat types, categorized by number of nucleotides. (B) The number of SSRs by specific repeat type.
In general, our results showed that the plastome of Debregeasia is comparatively conserved, and that all genes were always present in the same order (Supplementary Figures S2, S3); this also applies across all 13 outgroup taxa (Supplementary Figure S4). Moreover, the non-coding regions had more variation, and higher levels of divergence, than the coding regions. The seven regions with the highest levels of variation were psbK-psbI, rpoB-trnC-GCA, trnT-GGU-psbD, trnT-UGU-trnL-UAA, ycf4-cemA, trnP-UGG-psaJ, and ycf1. Of these regions, ycf1 straddled the SSC/IR boundary, whereas all of the others were located in the LSC region (Figure 5A). All had >0.5% variation across Debregeasia species examined. These seven regions could be considered as mutational hotspots and utilized as potential DNA barcodes for future population genetic analysis, phylogeny reconstruction and species identification studies in Debregeasia.
Figure 5. Percentages of variable sites in homologous regions of complete plastomes. (A) Based on 13 individuals of five Debregeasia species. (B) Based on 26 individuals of nineteen species of Urticaceae.
Comparing Debregeasia with 13 outgroup taxa, further plastome variation is notable, mainly in non-coding regions but also in the genes of ndhF, ycf1 and ycf2 (Supplementary Figure S5). The plastome sequence of Debregeasia is close to that of Boehmeria, but quite distinct from other outgroups (Supplementary Figure S5). The seven regions with highest levels of variation among genera were identified, each having >6% variation across Urticaceae genera examined. Of these regions, three (rpoB-trnC-GCA, trnT-GGU-psbD, and ycf1) were also among the seven most variable within Debregeasia, whereas four (matK, trnK-UUU-rps16-trnQ-UUG, rpl36-rps8, ndhF) were not (Figure 5B). Hence a total of eleven mutation hotspots, (i.e., psbK-psbI, rpl36-rps8, rpoB-trnC-GCA, trnK-UUU-rps16-trnQ-UUG, trnP-UGG-psaJ, trnT-GGU-psbD, trnT-UGU-trnL-UAA, ycf4-cemA, matK, ndhF, and ycf1), were identified that were highly variable within Debregeasia and/or across Urticaceae genera.
We investigated the rate of non-synonymous (dN) and synonymous (dS) substitutions to evaluate the selective pressure for 72 common protein-coding genes among the 13 Debregeasia individuals examined (Supplementary Tables S4, S5), using codon substitution models to identify possible sites under positive selection. Eighteen genes with positive selection sites were identified, and these were as follows: one subunit of the Acetyl-Co A-carboxylase gene (accD), one C-type cytochrome synthesis gene (ccsA), one gene for envelope membrane protein (cemA), one subunit of the rubisco gene (rbcL), one gene for a component of the trans locus of an envelope protein (ycf1), one gene for photosystem I subunit (psaB), two subunits of ATP synthase genes (atpA and atpB), two genes for subunits of NADH-dehydrogenase (ndhD and ndhF), four genes for the synthesis of small and large ribosomal subunit proteins (rps3, rps4, rps15, and rpl20), and four DNA-dependent RNA polymerase genes (rpoA, rpoB, rpoC1, and rpoC2).
Phylogenetic analysis based on five Debregeasia species plus 13 outgroup species, using Maximum likelihood, Maximum parsimony, and Bayesian Inference, showed that all Debregeasia species examined formed a single clade with high bootstrap and posterior probability support (Figure 6 and Supplementary Figure S6). The genus comprised two well-supported subclades, including D. longifolia plus D. saeneb, and D. elliptica plus D. orientalis plus D. squamata. The four species with multiple accessions examined were each monophyletic. Additionally, species from Boehmeria were resolved as the sister group to Debregeasia.
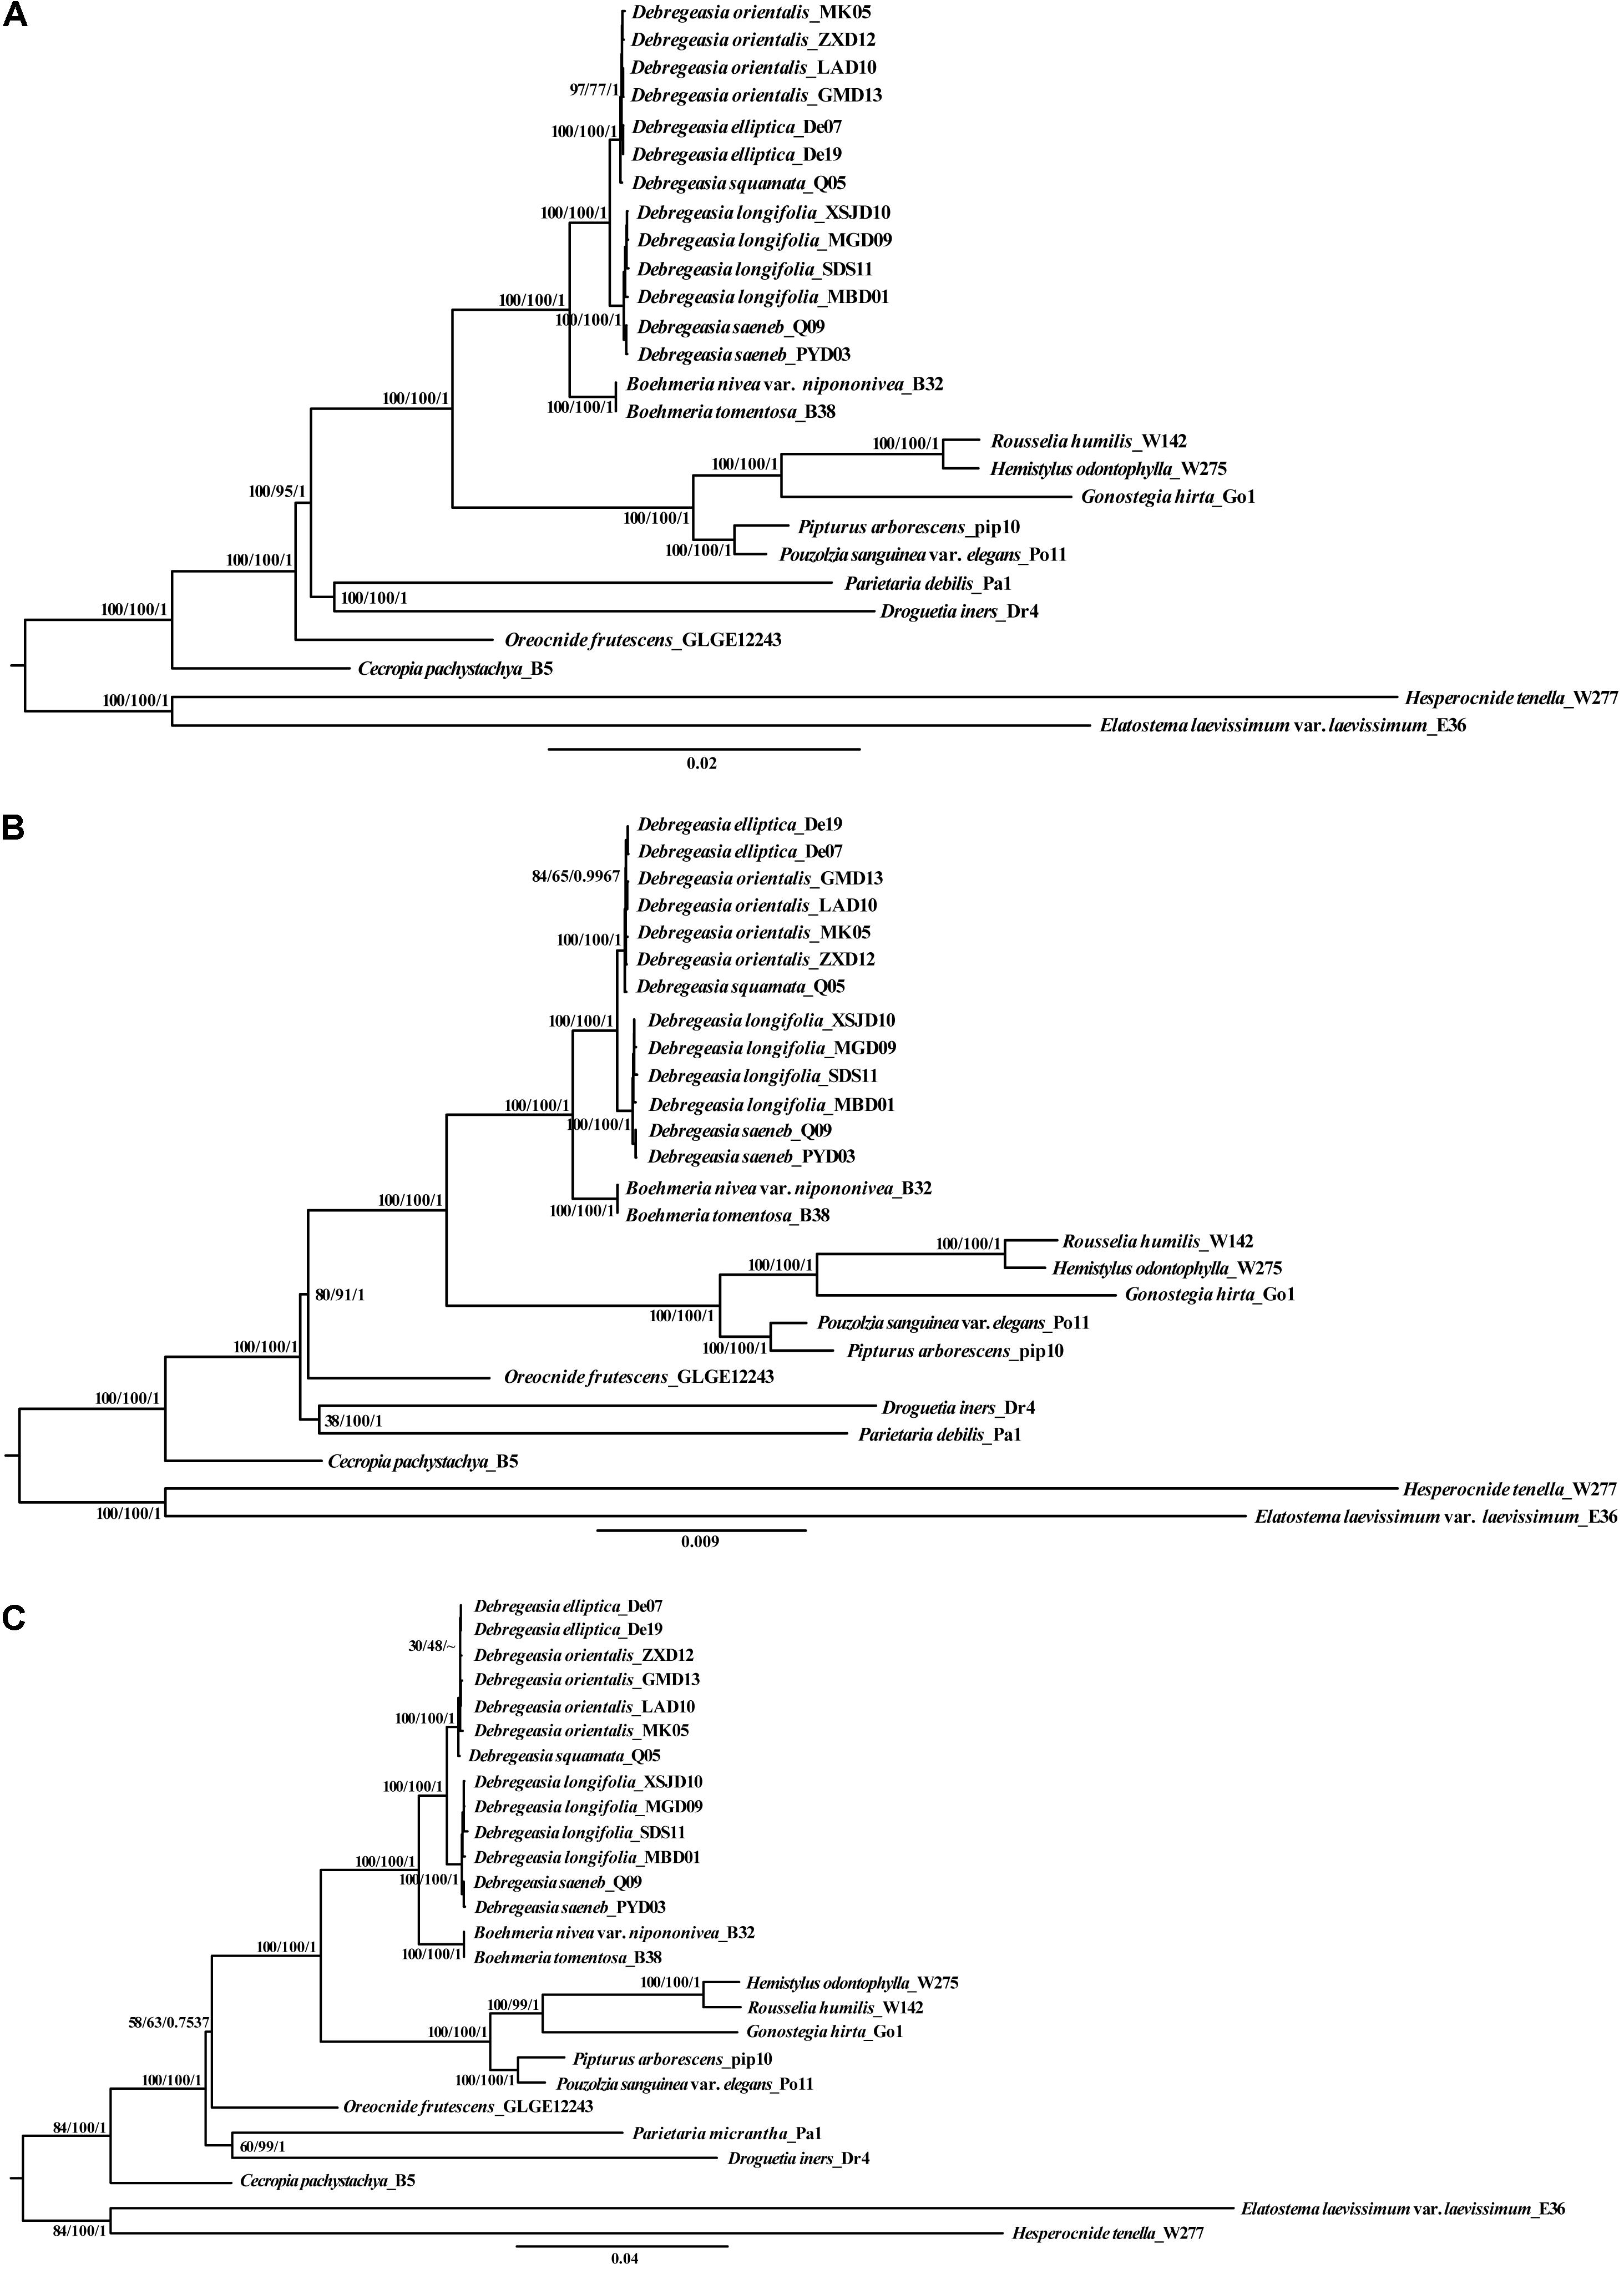
Figure 6. The phylogenetic relationships of five Debregeasia species (based on 13 individuals) plus 13 Urticaceae outgroup species, with support values shown from Maximum likelihood (ML), Maximum parsimony (MP), and Bayesian Inference (BI). Phylogenetic trees based on three datasets. (A) Whole plastomes; (B) Plastome protein-coding genes; (C) Three mutation hotspots at genus and family level.
Among the five Debregeasia species examined here, the plastomes appeared highly conserved, with no changes to gene order or overall structure (e.g. gene duplication, deletion and reverse transcription) observed in the genomes of Debregeasia. This might be because the species diverged fairly recently (Wu et al., 2015), or possibly due to the relatively conservative ecological niches of the genus.
The GC content of the LSC and SSC regions in all the Debregeasia species were much lower than those of the IR regions. A possible explanation for this is that the IR contains four rRNA genes, and the 16S rRNA has a very high GC content in Archaea (65–66.5%) (Yamane et al., 2011), with similar results in other terrestrial plants (Zeb et al., 2020).
Repeating sequences in plastomes can cause structural changes, and their variability across lineages makes these an appropriate source of for developing genomic markers for population genetics (Powell et al., 1996), especially when they are abundant and polymorphic. This clearly applies in Debregeasia and Urticaceae, wherein varying abundances of dispersed, palindromic and tandem repeats among the plastomes, both within and between species (Supplementary Table S2) may provide additional phylogenetic signals and evolutionary information. Additionally, large numbers of SSRs (Microsatellites) were detected in all plastomes of Debregeasia, with mononucleotide SSRs the most frequent, providing ample markers for further population and phylogenetic analysis. The number of SSRs was considerably more variable within D. longifolia than in D. orientalis, although four individuals of each were examined (Figures 3, 4 and Supplementary Table S2). Our data does not show an obvious reason for this, as D. orientalis shows more variation in both latitude and altitude than D. longifolia (Supplementary Table S2), but D. longifolia might exhibit greater variation in habitats occupied.
Complete plastome sequences are increasingly being used to solve taxonomic problems among closely related groups, providing valuable information for phylogenetic reconstruction (e.g., Ma et al., 2014; Dong et al., 2018; Li H. T. et al., 2019). In Debregeasia, phylogenetic relationships within have so far remained insufficiently resolved, probably because previous studies (Wu et al., 2015, 2018) have employed a limited number of DNA loci, providing insufficient information for full resolution. Here, the monophyly of Debregeasia received maximum bootstrap and Bayesian support, improving on previous studies using less data (Wu et al., 2013, 2018). Support for groupings within the genus also increased, and tree topology generally did not vary across methods or datasets, except for a few less well-supported groups at the tree tips, for example: D. elliptica appears nested within D. orientalis for some analyses and data sets, but not others (Figure 6), however, these relationships are not strongly supported. This may reflect recent divergence of these species, and hence it is possible that more intensive sampling of populations within both species, together with nuclear genomic data will provide a clearer picture in the future.
DNA super barcodes (whole genome) and mini barcodes (a proportion of a barcode) are extensions to the practice of routine DNA barcoding (Little, 2014; Hollingsworth et al., 2016). Theoretically, whole plastomes or nuclear genomes will provide the final solution for species identification. However, from both an economic and a practical perspective, a barcode or mini barcode is often sufficient, e.g., for Taxus (Liu et al., 2018) and macrophyte (Ortega et al., 2020) identification. In our study, the whole plastome can clearly distinguish all five Debregeasia species examined (Figure 6A). Meanwhile, three regions (rpoB-trnC-GCA, trnT-GGU-psbD and ycf1) showed high levels of variation at both within Debregeasia and between genus (Urticaceae) levels (percentage of variability >0.5% and >6.0%, respectively), and can distinguish all five Debregeasia species (Figure 6C). Indeed ycf1, recently proposed as the most promising plastid DNA barcode across all land plants (Dong et al., 2015), could separate all five Debregeasia species on its own (data not shown). These mutational hotspots have the potential to resolve taxonomic issues in the family, and for future use as barcodes and for species identification. Therefore, plastome data shows great potential for the study of evolution, taxonomy and phylogenetic relationships in the genus Debregeasia and elsewhere in the Urticaceae.
Variation in both synonymous and non-synonymous nucleotide sites is also very useful in evolutionary studies (Ogawa et al., 1999). In this study, eighteen genes with sites under positive selection were identified (Supplementary Tables S4, S5), which is comparable to the sixteen detected in Orchidaceae (Dong et al., 2018), rather fewer than the 51 detected across 97 Pinus species (Zeb et al., 2020), but more than the seven detected among 22 Lythraceae species (Gu et al., 2019). Notably, the gene ycf1 was both under positive selection, and a mutational hotspot, in Debregeasia. This gene is one of the largest genes in the plastome, encoding a component of the trans locus of the envelope protein in vivo (Drescher et al., 2000). The ycf1 gene has been useful for phylogenetic analysis in other groups, and contains a site that is under positive selection in other plant lineages (e.g., Greiner et al., 2008; Hu et al., 2015). Our results could indicate a role for ycf1 in speciation and habitat adaptation within Debregeasia. The roles of all genes under selection in the genus merit further investigation, with regard to the range of habitats occupied by Debregeasia, which include moist places by streams, thickets, forests in mountain valleys, and slopes of limestone mountains (Chen et al., 2003).
All datasets generated for this study are included in the Table 1.
JL and Z-YW conceived the work, and carried out the field work. R-NW, Z-YW, X-YD, and JL analyzed the data. R-NW drafted the manuscript. RM, JL, and Z-YW revised the manuscript. All authors approved the final manuscript.
This study was supported by the Key Research Program of Frontier Sciences, CAS (Grant No. ZDBS-LY-7001), by the National Natural Science Foundation of China (41971071, 31970356, 41571059, and 31600180), Z-YW was supported by CAS, Youth Innovation Promotion Association (Grant No. 2019385), the Biological Resources Programme, Chinese Academy of Sciences (KFJ-BRP-017-XX), and the open research project of “Cross-Cooperative Team” of the Germplasm Bank of Wild Species, Kunming Institute of Botany, Chinese Academy of Sciences.
The authors declare that the research was conducted in the absence of any commercial or financial relationships that could be construed as a potential conflict of interest.
We are deeply indebted to Profs. De-Zhu Li and Lian-Ming Gao, for their invaluable advice on the study. We also want to thank Mr. Xue-Wen Liu and Tao Liu for their help for the field sampling. Special thanks are due to Miss Wan-Lin Dong for assistance with data analysis. We would like to thank the Laboratory of Molecular Biology at the Germplasm Bank of Wild Species, Kunming Institute of Botany, Chinese Academy of Sciences, to provide platform for molecular lab work.
The Supplementary Material for this article can be found online at: https://www.frontiersin.org/articles/10.3389/fgene.2020.00729/full#supplementary-material
FIGURE S1 | Comparison of the borders of LSC, SSC, and IR regions in Debregeasia, based on 13 individuals of five species.
FIGURE S2 | Sequence identity plot comparing the plastomes based on 13 individuals of five Debregeasia species using mVISTA with D. elliptica_De07 as a reference. Genome regions are color coded as protein coding, rRNA coding, tRNA coding or conserved non-coding sequences.
FIGURE S3 | MAUVE alignment of plastomes, based on 13 individuals of five Debregeasia species with D. elliptica_De07 as a reference.
FIGURE S4 | MAUVE alignment of plastomes, based on 13 Urticaceae outgroup species, aligned with D. elliptica_De07 as a reference.
FIGURE S5 | Sequence identity plot comparing the plastomes of 13 Urticaceae outgroup species using mVISTA with D. elliptica_De07 as a reference. Genome regions are color coded as protein coding, rRNA coding, tRNA coding or conserved non-coding sequences.
FIGURE S6 | Phylogenetic relationships based on eleven mutational hotspots in five Debregeasia species (based on 13 individuals) and 13 Urticaceae outgroup species, with support values shown from Maximum likelihood (ML), Maximum parsimony (MP), to Bayesian Inference (BI).
TABLE S1 | Sampled species and their voucher specimens used in this study.
TABLE S2 | The number of simple sequence repeats (SSRs) in each Debregeasia plastome examined.
TABLE S3 | The subtypes of each of the six SSRs categories detected in Debregeasia plastomes.
TABLE S4 | Maximum likelihood parameter estimates for 78 genes of the Debregeasia species examined.
TABLE S5 | Likelihood ratio test (LRT) of the variable ω ratio under different models.
TABLE S6 | The studied Debregeasia species are indicated in Figure 1A.
TABLE S7 | The studied Urticaceae species are indicated in Figure 1B.
Akbar, E., and Malik, A. (2002). Antimicrobial triterpenes from Debregeasia salicifolia. Nat. Prod. Lett. 16, 339–344. doi: 10.1080/10575630290033088
Almubayedh, H., and Ahmad, R. (2019). Ethnopharmacological uses, phytochemistry, biological activities of Debregeasia salicifolia: a review. J. Ethnopharmacol. 231, 179–186. doi: 10.1016/j.jep.2018.11.023
Bankevich, A., Nurk, S., Antipov, D., Gurevich, A. A., Dvorkin, M., Kulikov, A. S., et al. (2012). SPAdes: a new genome assembly algorithm and its applications to single-cell sequencing. J. Comput. Biol. 19, 455–477. doi: 10.1089/cmb.2012.0021
Benson, G. (1999). Tandem repeats finder: a program to analyze DNA sequences. Nucleic Acids Res. 27, 573–580. doi: 10.1093/nar/27.2.573
Bi, Y., Zhang, M. F., Xue, J., Dong, R., Du, Y. P., and Zhang, X. H. (2018). Chloroplast genomic resources for phylogeny and DNA barcoding: a case study on Fritillaria. Sci. Rep. 8:1184.
Borsch, T., and Quandt, D. (2009). Mutational dynamics and phylogenetic utility of noncoding chloroplast DNA. Plant Syst. Evol. 282, 169–199. doi: 10.1007/s00606-009-0210-8
Chen, C. J., Lin, Q., Friis, I., Wilmot-Dear, C. M., and Monro, A. K. (2003). “Urticaceae,” in Flora of China, eds Z. Y. Wu and P. H. Raven (Beijing: Science Press), 76–189.
Daniell, H., Lin, C. S., Yu, M., and Chang, W. J. (2016). Chloroplast genomes: diversity, evolution, and applications in genetic engineering. Genome Biol. 17:134.
Darriba, D., Taboada, G. L., Doallo, R., and Posada, D. (2012). jModelTest 2: more models, new heuristics and parallel computing. Nat. Methods 9, 772–772. doi: 10.1038/nmeth.2109
Dong, W., Liu, J., Yu, J., Wang, L., and Zhou, S. (2012). Highly variable chloroplast markers for evaluating plant phylogeny at low taxonomic levels and for DNA barcoding. PloS One 7:e35071. doi: 10.1371/journal.pone.0035071
Dong, W., Xu, C., Li, C., Sun, J., Zuo, Y., Shi, S., et al. (2015). ycf1, the most promising plastid DNA barcode of land plants. Sci. Rep. 5:8348.
Dong, W. L., Wang, R. N., Zhang, N. Y., Fan, W. B., Fang, M. F., and Li, Z. H. (2018). Molecular evolution of chloroplast genomes of orchid species: insights into phylogenetic relationship and adaptive evolution. Int. J. Mol. Sci. 19:716. doi: 10.3390/ijms19030716
Doyle, J. J., and Doyle, J. L. (1987). A rapid DNA isolation procedure for small quantities of fresh leaf tissue. Phytochem. Bull. 19, 11–15.
Drescher, A., Ruf, S., Calsa, T., Carrer, H., and Bock, R. (2000). The two largest chloroplast genome-encoded open reading frames of higher plants are essential genes. Plant J. 22, 97–104. doi: 10.1046/j.1365-313x.2000.00722.x
Du, Y. P., Bi, Y., Yang, F. P., Zhang, M. F., Chen, X. Q., Xue, J., et al. (2017). Complete chloroplast genome sequences of Lilium: insights into evolutionary dynamics and phylogenetic analyses. Sci. Rep. 7:5751.
Frazer, K. A., Pachter, L., Poliakov, A., Rubin, E. M., and Dubchak, I. (2004). VISTA: computational tools for comparative genomics. Nucleic Acids Res. 32, W273–W279.
Fu, C. N., Wu, C. S., Ye, L. J., Mo, Z. Q., Liu, J., Chang, Y. W., et al. (2019). Prevalence of isomeric plastomes and effectiveness of plastome super-barcodes in yews (Taxus) worldwide. Sci. Rep. 9:2773.
Greiner, S., Lehwark, P., and Bock, R. (2019). OrganellarGenomeDRAW (OGDRAW) version 1.3.1: expanded toolkit for the graphical visualization of organellar genomes. Nucleic Acids Res. 47, 59–64.
Greiner, S., Wang, X., Rauwolf, U., Silber, M. V., Mayer, K., Meurer, J., et al. (2008). The complete nucleotide sequences of the five genetically distinct plastid genomes of Oenothera, subsection Oenothera: I. sequence evaluation and plastome evolution. Nucleic Acids Res. 36, 2366–2378. doi: 10.1093/nar/gkn081
Gu, C., Ma, L., Wu, Z., Chen, K., and Wang, Y. (2019). Comparative analyses of chloroplast genomes from 22 Lythraceae species: inferences for phylogenetic relationships and genome evolution within Myrtales. BMC Plant Biol. 19:281. doi: 10.1186/s12870-019-1870-3
Hollingsworth, P. M., Li, D. Z., van der Bank, M., and Twyford, A. D. (2016). Telling plant species apart with DNA: from barcodes to genomes. Philos. T. R. Soc. B. 371:20150338. doi: 10.1098/rstb.2015.0338
Hu, S., Sablok, G., Wang, B., Qu, D., Barbaro, E., Viola, R., et al. (2015). Plastome organization and evolution of chloroplast genes in Cardamine species adapted to contrasting habitats. BMC Genomics 16:306. doi: 10.1186/s12864-015-1498-0
Jin, J. J., Yu, W. B., Yang, J. B., Song, Y., Yi, T. S., and Li, D. Z. (2018). GetOrganelle: a simple and fast pipeline for de novo assembly of a complete circular chloroplast genome using genome skimming data. bioRxiv [Preprint]. doi: 10.1101/256479
Katoh, K., Misawa, K., Kuma, K., and Miyata, T. (2002). MAFFT: a novel method for rapid multiple sequence alignment based on fast Fourier transform. Nucleic Acids Res. 30, 3059–3066. doi: 10.1093/nar/gkf436
Kearse, M., Moir, R., Wilson, A., Stones-Havas, S., Cheung, M., Sturrock, S., et al. (2012). Geneious basic: an integrated and extendable desktop software platform for the organization and analysis of sequence data. Bioinformatics 28, 1647–1649. doi: 10.1093/bioinformatics/bts199
Krzywinski, M., Schein, J., Birol, I., Connors, J., Gascoyne, R., Horsman, D., et al. (2009). Circos: an information aesthetic for comparative genomics. Genome Res. 19, 1639–1645. doi: 10.1101/gr.092759.109
Kumar, S., Stecher, G., and Tamura, K. (2016). MEGA7: molecular evolutionary genetics analysis version 7.0 for bigger datasets. Mol. Biol. Evol. 33, 1870–1874. doi: 10.1093/molbev/msw054
Kurtz, S., Choudhuri, J. V., Ohlebusch, E., Schleiermacher, C., Stoye, J., and Giegerich, R. (2001). REPuter: the manifold applications of repeat analysis on a genomic scale. Nucleic Acids Res. 29, 4633–4642. doi: 10.1093/nar/29.22.4633
Li, H. T., Yi, T. S., Gao, L. M., Ma, P. F., Zhang, T., Yang, J. B., et al. (2019). Origin of angiosperms and the puzzle of the Jurassic gap. Nat. Plants 5, 461–470. doi: 10.1038/s41477-019-0421-0
Li, X., Zuo, Y., Zhu, X., Liao, S., and Ma, J. (2019). Complete chloroplast genomes and comparative analysis of sequences evolution among seven Aristolochia (Aristolochiaceae) medicinal species. Int. J. Mol. Sci. 20:1045. doi: 10.3390/ijms20051045
Little, D. P. (2014). A DNA mini-barcode for land plants. Mol. Ecol. Resour. 14, 437–446. doi: 10.1111/1755-0998.12194
Liu, J., Milne, R. I., Möller, M., Zhu, G. F., Ye, L. J., Luo, Y. H., et al. (2018). Integrating a comprehensive DNA barcode reference library with a global map of yews (Taxus L.) for forensic identification. Mol. Ecol. Resour. 18, 1115–1131. doi: 10.1111/1755-0998.12903
Ma, P. F., Zhang, Y. X., Zeng, C. X., Guo, Z. H., and Li, D. Z. (2014). Chloroplast phylogenomic analyses resolve deep-level relationships of an intractable bamboo tribe Arundinarieae (Poaceae). Syst. Biol. 63, 933–950. doi: 10.1093/sysbio/syu054
Miller, M. A., Pfeiffer, W., and Schwartz, T. (2010). “Creating the CIPRES science gateway for inference of large phylogenetic trees,” in Proceedings of the Gateway Computing Environments Workshop (GCE), New Orleans, LA, 1–8.
Ogawa, T., Ishii, C., Kagawa, D., Muramoto, K., and Kamiya, H. (1999). Accelerated evolution in the protein-coding region of galectin cDNAs, congerin I and congerin II, from skin mucus of conger eel (Conger myriaster). Biosci. Biotechnol. Biochem. 63, 1203–1208. doi: 10.1271/bbb.63.1203
Ortega, A., Geraldi, N. R., Díaz-Rúa, R., Ørberg, S. B., Wesselmann, M., Krause-Jensen, D., et al. (2020). A DNA mini-barcode for marine macrophytes. Mol. Ecol. Resour. doi: 10.1111/1755-0998.13164
Powell, W., Machray, G. C., and Provan, J. (1996). Polymorphism revealed by simple sequence repeats. Trends Plant Sci. 1, 215–222. doi: 10.1016/s1360-1385(96)86898-0
Qu, X. J., Moore, M. J., Li, D. Z., and Yi, T. S. (2019). PGA: a software package for rapid, accurate, and flexible batch annotation of plastomes. Plant Methods 15:50.
Rambaut, A. (2012). FigTree v1. 4. Molecular Evolution, Phylogenetics and Epidemiology. Edinburgh: Institute of Evolutionary Biology, University of Edinburgh. Available online at: http://tree.bio.ed.ac.uk/software/figtree
Raubeson, L., and Jansen, R. (2005). “Chloroplast genomes of plants,” in Plant Diversity and Evolution: Genotypic and Phenotypic Variation in Higher Plants, ed. R. J. Henry (Wallingford: CABI Publishing), 45–68. doi: 10.1079/9780851999043.0045
Ronquist, F., Teslenko, M., Van Der Mark, P., Ayres, D. L., Darling, A., Hohna, S., et al. (2012). MrBayes 3.2: efficient bayesian phylogenetic inference and model choice across a large model space. Syst. Biol. 61, 539–542. doi: 10.1093/sysbio/sys029
Ruhfel, B. R., Gitzendanner, M. A., Soltis, P. S., Soltis, D. E., and Burleigh, J. G. (2014). From algae to angiosperms-inferring the phylogeny of green plants (Viridiplantae) from 360 plastid genomes. BMC Evol. Biol. 14:23. doi: 10.1186/1471-2148-14-23
Stamatakis, A. (2006). RAxML-VI-HPC: maximum likelihood-based phylogenetic analyses with thousands of taxa and mixed models. Bioinformatics 22, 2688–2690. doi: 10.1093/bioinformatics/btl446
Thiel, T., Michalek, W., Varshney, R. K., and Graner, A. (2003). Exploiting EST databases for the development and characterization of gene-derived SSR-markers in barley (Hordeum vulgare L.). Theor. Appl. Genet. 106, 411–422. doi: 10.1007/s00122-002-1031-0
Timme, R. E., Kuehl, J. V., Boore, J. L., and Jansen, R. K. (2007). A comparative analysis of the Lactuca and Helianthus (Asteraceae) plastid genomes: Identification of divergent regions and categorization of shared repeats. Am. J. Bot. 94, 302–312. doi: 10.3732/ajb.94.3.302
Wang, R. N., Liu, J., Li, Z. H., and Wu, Z. Y. (2019). Complete chloroplast genome sequences of Debregeasia orientalis (Urticaceae). Mitochondrial DNA B 4, 1830–1831. doi: 10.1080/23802359.2019.1604186
Weglöhner, W., and Subramanian, A. R. (1992). Nucleotide sequence of a region of maize chloroplast DNA containing the 3’ end of clpP, exon 1 of rps12 and rpl20 and their cotranscription. Plant Mol. Biol. 18, 415–418. doi: 10.1007/bf00034970
Wick, R. R., Schultz, M. B., Zobel, J., and Holt, K. E. (2015). Bandage: interactive visualization of de novo genome assemblies. Bioinformatics 31, 3350–3352.
Wicke, S., Schneeweiss, G. M., Depamphilis, C. W., Muller, K. F., and Quandt, D. (2011). The evolution of the plastid chromosome in land plants: gene content, gene order, gene function. Plant Mol. Biol. 76, 273–297. doi: 10.1007/s11103-011-9762-4
Wilmot-Dear, C. M., and Friis, I. (2012). Debregeasia australis sp. nov. (Urticaceae), with a new synopsis of and a new key to the genus. Edinburgh J. Bot. 69, 301–311. doi: 10.1017/s096042861200011x
Wu, Z. Y., Liu, J., Provan, J., Wang, H., Chen, C. J., Cadotte, M. W., et al. (2018). Testing Darwin’s transoceanic dispersal hypothesis for the inland nettle family (Urticaceae). Ecol. Lett. 21, 1515–1529. doi: 10.1111/ele.13132
Wu, Z. Y., Milne, R. I., Chen, C. J., Liu, J., Wang, H., and Li, D. Z. (2015). Ancestral state reconstruction reveals rampant homoplasy of diagnostic morphological characters in Urticaceae, conflicting with current classification schemes. PLoS One 10:e0141821. doi: 10.1371/journal.pone.0141821
Wu, Z. Y., Monro, A. K., Milne, R. I., Wang, H., Yi, T. S., Liu, J., et al. (2013). Molecular phylogeny of the nettle family (Urticaceae) inferred from multiple loci of three genomes and extensive generic sampling. Mol. Phylogenet. Evol. 69, 814–827. doi: 10.1016/j.ympev.2013.06.022
Yamane, K., Hattori, Y., Ohtagaki, H., and Fujiwara, K. (2011). Microbial diversity with dominance of 16S rRNA gene sequences with high GC contents at 74 and 98 C subsurface crude oil deposits in Japan. FEMS Microbiol. Ecol. 76, 220–235. doi: 10.1111/j.1574-6941.2011.01044.x
Yang, Z. (2007). PAML 4: phylogenetic analysis by maximum likelihood. Mol. Biol. Evol. 24, 1586–1591. doi: 10.1093/molbev/msm088
Yang, Z. H., and Nielsen, R. (2002). Codon-substitution models for detecting molecular adaptation at individual sites along specific lineages. Mol. Biol. Evol. 19, 908–917. doi: 10.1093/oxfordjournals.molbev.a004148
Keywords: Debregeasia, DNA barcode, plastome phylogenomics, phylogenetic relationship, mutational hotspots, Urticaceae
Citation: Wang R-N, Milne RI, Du X-Y, Liu J and Wu Z-Y (2020) Characteristics and Mutational Hotspots of Plastomes in Debregeasia (Urticaceae). Front. Genet. 11:729. doi: 10.3389/fgene.2020.00729
Received: 10 March 2020; Accepted: 15 June 2020;
Published: 08 July 2020.
Edited by:
Lifeng Zhu, Nanjing Normal University, ChinaReviewed by:
Yingjuan Su, Sun Yat-sen University, ChinaCopyright © 2020 Wang, Milne, Du, Liu and Wu. This is an open-access article distributed under the terms of the Creative Commons Attribution License (CC BY). The use, distribution or reproduction in other forums is permitted, provided the original author(s) and the copyright owner(s) are credited and that the original publication in this journal is cited, in accordance with accepted academic practice. No use, distribution or reproduction is permitted which does not comply with these terms.
*Correspondence: Jie Liu, bGl1amllQG1haWwua2liLmFjLmNu; Zeng-Yuan Wu, d3V6ZW5neXVhbkBtYWlsLmtpYi5hYy5jbg==
Disclaimer: All claims expressed in this article are solely those of the authors and do not necessarily represent those of their affiliated organizations, or those of the publisher, the editors and the reviewers. Any product that may be evaluated in this article or claim that may be made by its manufacturer is not guaranteed or endorsed by the publisher.
Research integrity at Frontiers
Learn more about the work of our research integrity team to safeguard the quality of each article we publish.