 Yi Liao
 Hua Xiao†
95% of researchers rate our articles as excellent or good
Learn more about the work of our research integrity team to safeguard the quality of each article we publish.
Find out more
ORIGINAL RESEARCH article
Front. Genet. , 13 May 2020
Sec. Computational Genomics
Volume 11 - 2020 | https://doi.org/10.3389/fgene.2020.00427
This article is part of the Research Topic Computational Epigenetics in Human Diseases, Cell Differentiation, and Cell Reprogramming, Volume I View all 42 articles
Background: Tumor stem cells play important roles in the survival, proliferation, metastasis and recurrence of tumors. We aimed to identify new prognostic biomarkers for lung squamous cell carcinoma (LUSC) based on the cancer stem cell theory.
Methods: RNA-seq data and relevant clinical information were downloaded from The Cancer Genome Atlas (TCGA) database. Weighted gene coexpression network analysis (WGCNA) was applied to identify significant modules and hub genes, and prognostic signatures were constructed with the prognostic hub genes.
Results: LUSC patients in the TCGA database have higher mRNA expression-based stemness index (mRNAsi) in tumor tissue than in adjacent normal tissue. In addition, some clinical features and outcomes were highly correlated with the mRNAsi. WGCNA revealed that the pink and yellow modules were the most significant modules related to the mRNAsi; the top 10 hub genes in the pink module were enriched mostly in epidermal development, the secretory granule membrane, receptor regulator activity and the cytokine-cytokine receptor interaction. The protein–protein interaction (PPI) network revealed that the top 10 hub genes were significantly correlated with each other at the transcriptional level. In addition, the top 10 hub genes were all highly expressed in LUSC, and some were differentially expressed in different TNM stages. Regarding the survival analysis, the nomogram of a prognostic signature with three hub genes showed high predictive value.
Conclusion: mRNAsi-related hub genes could be a potential biomarker of LUSC.
Lung cancer ranks first in morbidity (11.6%) and mortality (18.4%) according to the latest worldwide survey of 20 regions from five continents and is the leading male cancer in both developed and developing countries (Bray et al., 2018) among all cancers. In February 2018, the latest national cancer statistics released by China’s National Cancer Center revealed the same grim situation: lung cancer is still the most common malignant tumor in China in terms of morbidity and mortality. Lung cancer is also the leading cause of death from malignant tumors in all regions of China (Chen et al., 2018). According to different histopathological characteristics, lung cancer is divided into non-small cell lung cancer (NSCLC) and small cell lung cancer (SCLC), and lung squamous cell carcinoma (LUSC) is one of most common subtypes of NSCLC (Barlesi et al., 2016).
Research on the pathogenesis and pathological mechanism of NSCLC is still controversial; some studies (Friedmann-Morvinski and Verma, 2014; Leon et al., 2016; Shibue and Weinberg, 2017) have shown that tumor stem cells play important roles in tumor survival, proliferation, metastasis and recurrence. For example, a recent study used bioinformatics methods found that FOXM1 and MYBL2, which are involved in the process of cell proliferation, can be used as potential biomarkers and therapeutic targets of NSCLC (Ahmed, 2019). This theory provides a new direction and idea for us to understand the origin and nature of the tumor and clinical treatment. In essence, tumor stem cells maintain the viability of tumor cell populations through self-renewal and infinite proliferation. The movement and migration capacities of tumor stem cells make the metastasis of tumor cells possible. Tumor stem cells can remain dormant for a long time and express a variety of resistant molecules but are not sensitive to the external physical and chemical factors that kill tumor cells. Therefore, tumor stem cells provide a new direction and visual perspective for us to re-understand the origin and nature of tumors, as well as clinical tumor therapy.
In addition, based on the theory of tumor stem cells, some scholars have introduced a new concept — stemness indices (Malta et al., 2018). The expression profile and methylation data of different tumor samples were collected from The Cancer Genome Atlas (TCGA) and other public databases. An innovative one-class logistic regression machine learning algorithm (OCLR) (Sokolov et al., 2016) was used to extract transcriptomic and epigenetic feature sets derived from non-transformed pluripotent stem cells and their differentiated progeny. Two independent stemness indices, the mRNA expression-based stemness index (mRNAsi) and the epigenetically regulated-mRNAsi (EREG-mRNAsi), were calculated. Among them, the index range was 0–1; the closer the value was to 1, the stronger the stem cell characteristics of tumor cells.
With the continuous development of high-throughput sequencing technology, it is convenient to explore the occurrence and development of tumors at the genetic level and to identify possible therapeutic targets (Goldfeder et al., 2017). Traditional methods use differential expression detection to identify potential biomarkers but may miss useful genes. Therefore, weighted gene coexpression network analysis (WGCNA) (Langfelder and Horvath, 2008) was adopted in the current study. The WGCNA was based on two hypotheses: (1) genes with similar expression patterns may share common regulatory networks and/or functional correlations or be involved in the same pathway; and (2) the gene network conforms to scale-free distribution. Based on these two hypotheses, the gene network can be divided into different modules according to expression similarity, and hub genes can be identified.
The purpose of this study was to obtain modules that are closely related to stem cell characteristics and to further identify the hub genes located in the regulatory center with the help of high-throughput sequencing data from a public database and the WGCNA method. We also determined whether these genes have a clear effect on prognosis.
The flow diagram of our study was shown in Supplementary Figure S1. Level 3 RNA-seq data (HTSEQ-FPKM-UQ) and clinical information were downloaded from the TCGA website1. Ensembl IDs were converted to gene names via the Ensembl database2, and log2 processing of the data was performed. If a gene had multiple expression values, they were averaged. Each sample from the TCGA and its corresponding mRNAsi and EREG-mRNAsi data were downloaded from https://www.ncbi.nlm.nih.gov/pmc/articles/PMC5902191/. Any samples that were missing the stemness index or clinical information were excluded.
Differences in the mRNAsi between normal and LUSC tissues were compared using the unpaired t-test. Relapsed and non-relapsed patients who did not receive adjuvant therapy were also compared based on their mRNAsi. One-way ANOVA was used to compare significant differences in the mRNAsi between groups of variables. GraphPad Prism version 7 (64 bit) was used to perform the above analysis. To compare differences in prognosis, two indicators were evaluated: overall survival (OS) and progression-free survival (PFS). OS was defined as the time between the diagnosis of a tumor and death from any cause. PFS was defined as the time between the diagnosis of a tumor and the time to progression (in any form) or death from any cause. X-tile software (version 3.6.1) (Camp et al., 2004) was used to determine the best cut-off value in the survival data. The working principle of this software is to group different values as truncation values for the statistical test, and the result with the smallest p value is considered the best truncation value. Kaplan–Meier analysis was performed, and the p-value for two groups was calculated by the log-rank test with the survminer package in R software (v 3.6.0). P < 0.05 was considered a significant difference.
The limma package (Ritchie et al., 2015) was used to identify DEGs between LUSC and normal tissues. The inclusion criteria for DEGs were log2-fold change (FC) > 1 and adjusted P < 0.05.
We used the DEGs obtained in the previous step to construct coexpression networks with the WGCNA package (Langfelder and Horvath, 2008) in R software (v3.6.0). The goodSamplesGenes function was used to determine whether the sample data were complete. It was also used to perform sample clustering to identify and remove outliers. Pearson correlation coefficients between each group of genes were also calculated, and their absolute values were used to construct the gene expression similarity matrix according to the following formula: aij = |cor (xi, xj)|β, where xi and xj represent nodes i and j of the network, respectively. A β value was selected to build the proximity matrix so that gene distribution conformed to a scale-free network based on connectivity. The adjacency matrix and topological overlap matrix (TOM) were constructed after obtaining the β value. The TOM obtained was then clustered by dissimilarity between genes, and the trees were then cut into different modules by the dynamic shear method (the minimum number of genes in the module was 50). Some modules were combined according to the correlation coefficient.
We selected the hierarchical clustering module that was the most closely related to the mRNAsi and EREG-mRNAsi for further analysis. Genetic significance (GS), module significance (MS) and the module eigengene (ME) were also calculated. GS was defined as the level of correlation between gene expression and the mRNAsi and EREG-mRNAsi. The calculation method used was the log10 transformation of the p value in linear regression. It represents the relevance of each gene in the module to characteristics. MS was defined as the average of significance of all genes in the module. We merged similar modules using a cut-off value 0.55, and then the modules that had the largest MS were considered the most sample trait-related modules. ME was defined as the first principal component obtained by principal component analysis of the gene expression matrix of each module. Among all the modules, the module with the highest MS was considered to be related to the mRNAsi and EREG-mRNAsi and was selected for further research.
The GS and module membership (MM, correlation between the module’s own genes and gene expression profiles) of each gene were calculated after defining significant modules. The stronger the correlation was between the genes and significant modules, the stronger their relation to the stemness indices. Therefore, the inclusion criteria for a hub gene were set as follows: MM > 0.6 and cor. gene GS > 0.4.
The clusterProfiler package (Yu et al., 2012) was used to perform functional enrichment for Gene Ontology (GO) and Kyoto Encyclopedia of Genes and Genomes (KEGG) analyses of the selected module. GO analysis consists of three terms: biological process (BP), cellular component (CC), and molecular function (MF). An adjusted P < 0.05 was used as the threshold.
STRING (version 11.0)3 is an online database that can be used to study and visualize the network of interactions among proteins. Coexpression relationships among the hub genes were calculated based on gene expression levels to determine their strength at the transcriptional level. The Pearson correlation between genes was calculated using the R corrplot package4, and the correlation matrix was visualized.
GEPIA5 is an online site that allows differential expression profiling, pathological staging, and patient survival analysis of tumors and normal tissues in the TCGA database. GEPIA data are derived not only from the TCGA database but also from the sequencing data of normal tissues in the Genotype-Tissue Expression (GTEx) project6 (Tang et al., 2017), which compensates for the shortage of normal tissue samples in the TCGA database. Therefore, this database was used to verify whether the expression of the hub gene was higher in tumor tissue than in normal tissue and whether the hub gene was differentially expressed in different TNM stages.
The relationship between each hub gene’s expression level and OS was assessed by univariate Cox regression analysis, and hub genes with P < 0.05 were entered into the multivariate Cox regression process using the Akaike information criterion (AIC) (Yamaoka et al., 1978). A risk score formula was created using the corresponding data obtained through multivariate Cox proportional hazards regression analyses with the hub genes whose p-value was <0.05. In Equation 1, n denotes the number of prognostic hub genes, Gi represents the expression value of the ith hub genes, and weight i denotes the coefficient of each significant hub gene. Patients were divided into high-risk (>median risk score) and low-risk (<median risk score) groups according to the median risk score. The Kaplan–Meier method was used to estimate the survival outcomes of the high- and low-risk patients, and differences in OS were evaluated with the log-rank test. We generated a time-dependent receiver operating characteristic (ROC) curve to verify the accuracy of this signature. The classic ROC curve analysis method assumes that individual events and outcomes are fixed over time, but in practice, both disease status and outcomes change over time. Moreover, the traditional ROC curve cannot be used to analyze survival data; therefore, we adopted a time-dependent ROC curve (Kamarudin et al., 2017). P < 0.05 was considered statistically significant.
To lessen the influence of confounding factors on the relationship between gene expression and prognosis as much as possible, univariate and multivariate Cox regression analyses were performed to assess differences in clinical characteristics and risk scores. P < 0.05 was considered statistically significant. The nomograms of the 1-, 3-, and 5-year survival rates were constructed using the rms package in R software to visualize the prediction results7. The predictive ability of the nomogram was evaluated by the AUC of the ROC curve and the calibration curves for 1, 3, and 5 years.
Ninety-two samples without enough clinical information and 12 samples without mRNAsi information from the TCGA database were excluded. As shown in Figure 1A, there was a significant difference between the mRNAsi of LUSC and normal tissues. The mRNAsi of tumor tissues was higher than that of normal tissues. Significant differences in T stage (Figure 1D) and N stage (Figure 1E) were also observed in addition to AJCC stage (Figure 1F). However, there was no significant difference in the mRNAsi based on the treatment effect (Figure 1B) or whether the patient had relapsed (Figure 1C). LUSC patients with a high mRNAsi had significantly worse OS and PFS rates than those with a low mRNAsi (Figures 1G,I).
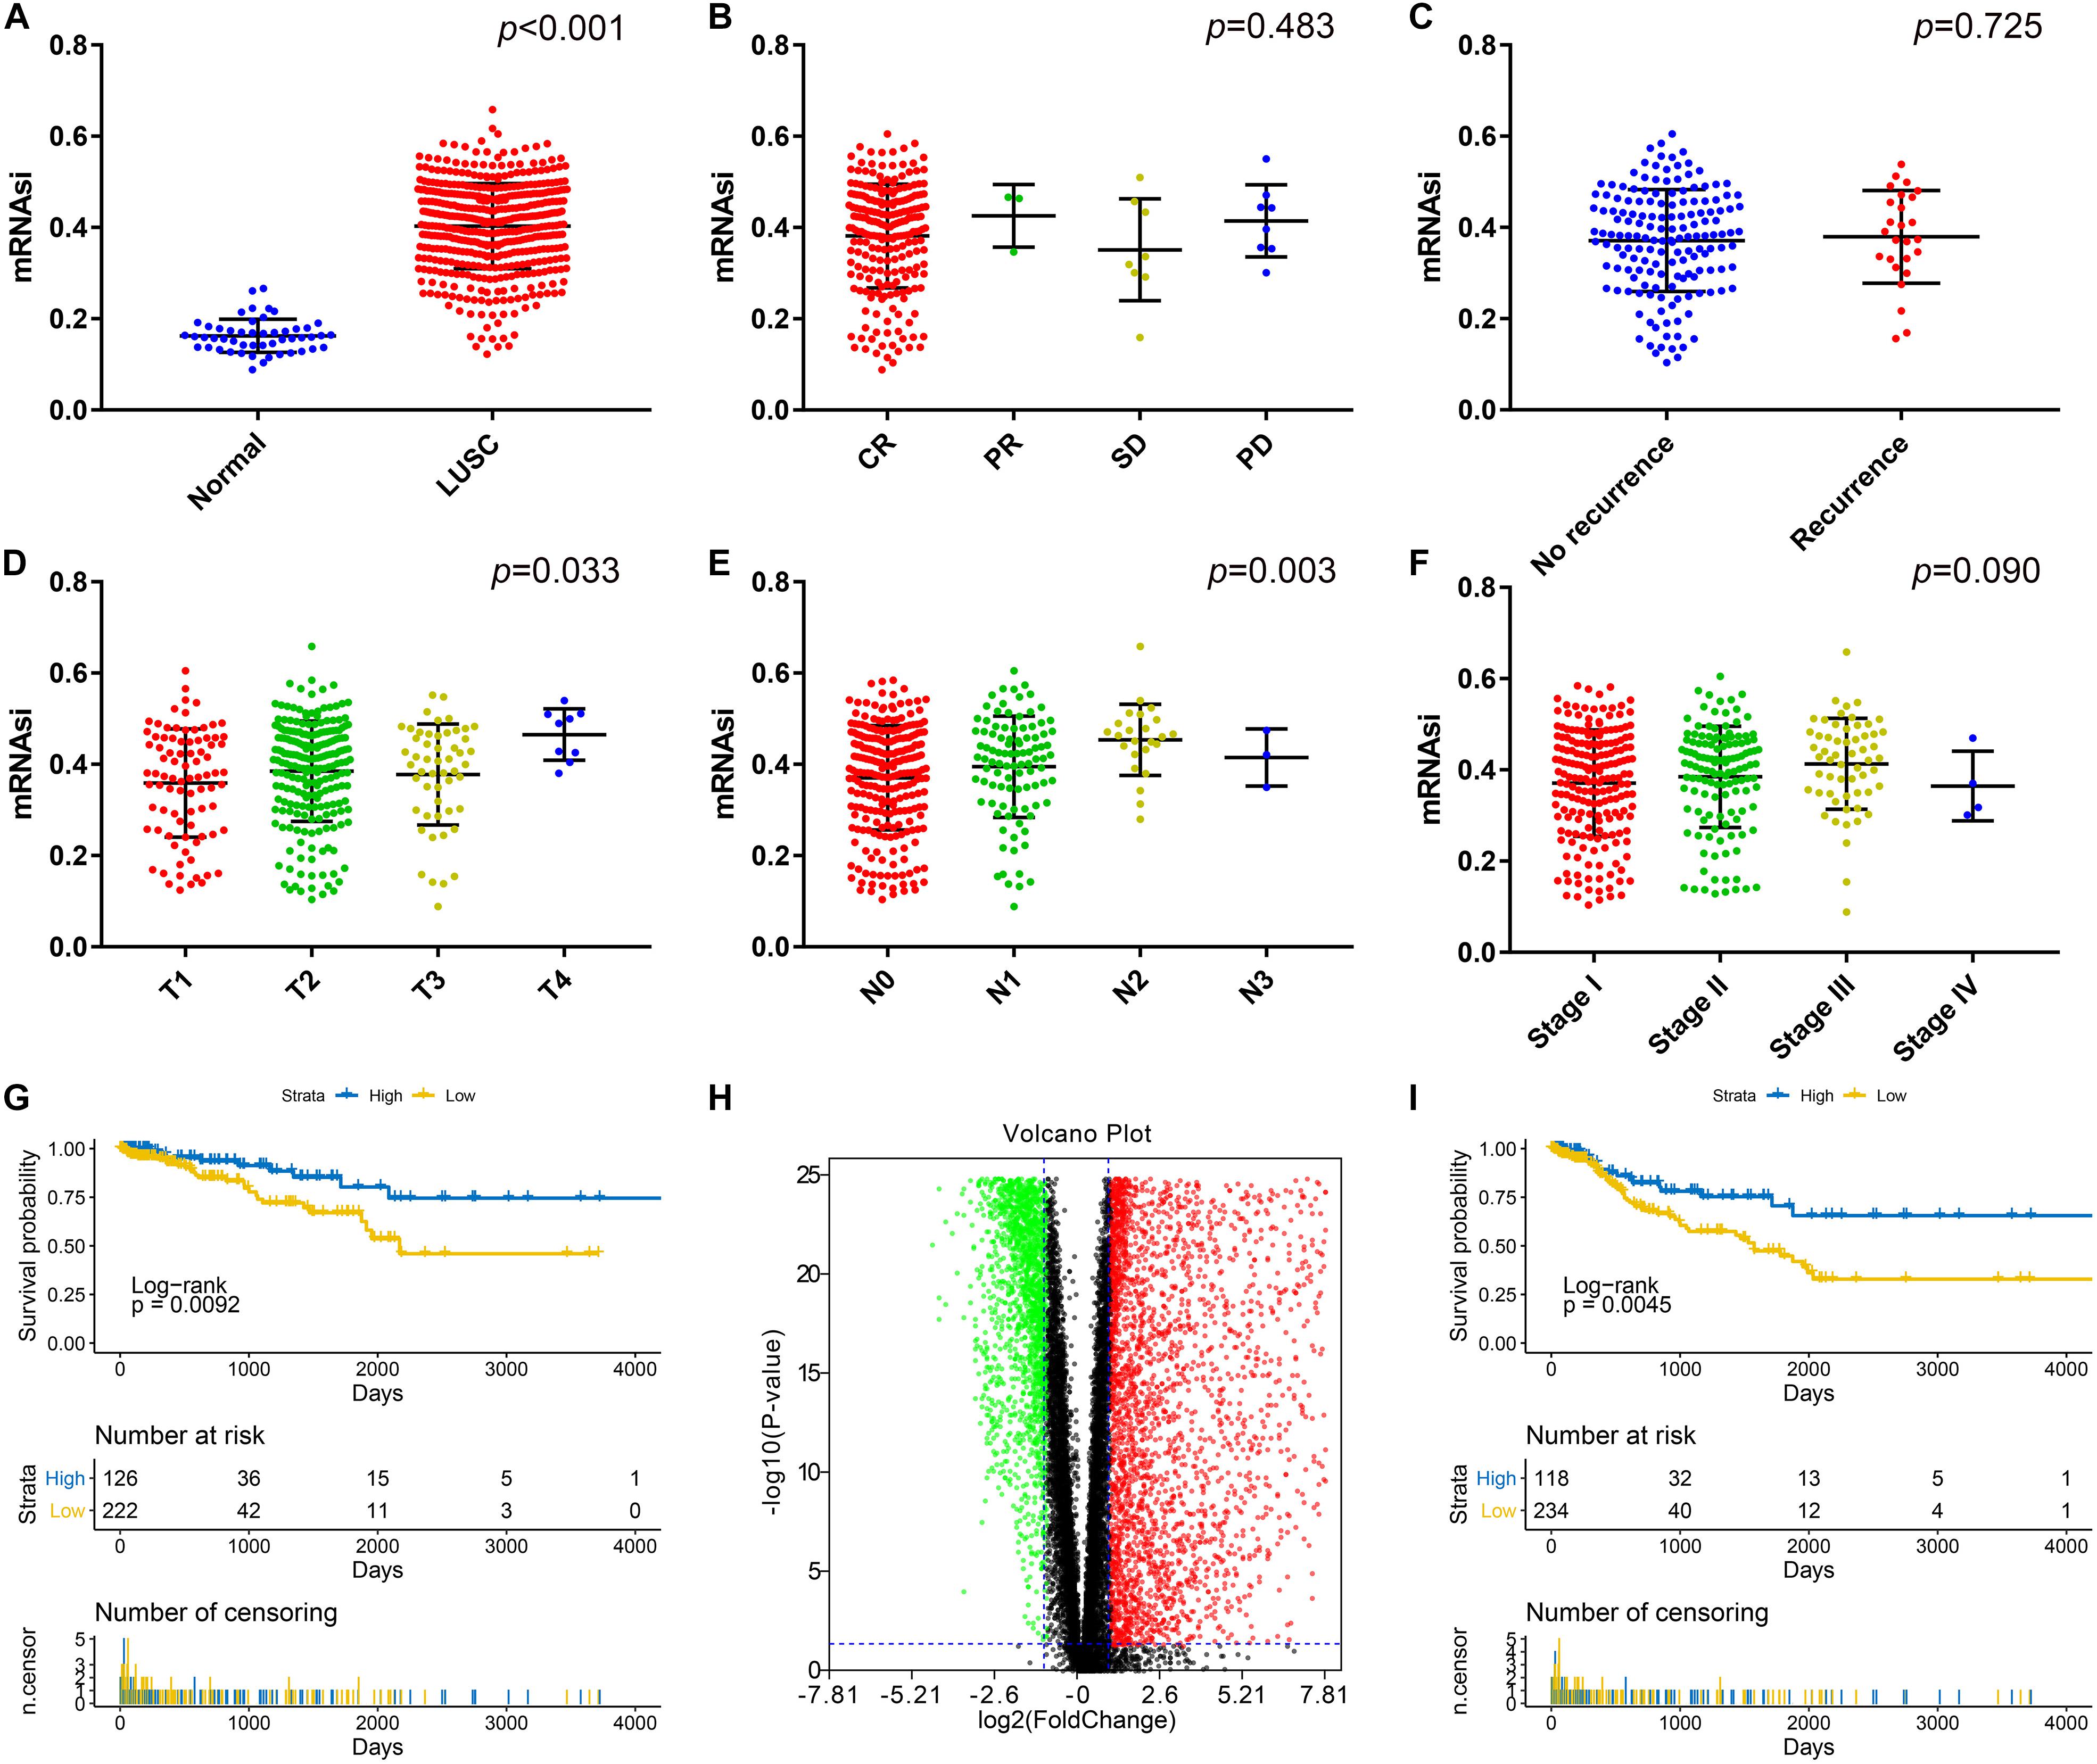
Figure 1. (A) Differences in the mRNAsi between normal (50 samples) and LUSC (487 samples) tissues. (B) Differences in the mRNAsi based on the treatment effect: CR (234 samples), PR (3 samples), SD (8 samples), and PD (8 samples). (C) Differences in the mRNAsi between LUAD patients without (159 samples) and with (26 samples) recurrence after primary treatment without adjuvant therapy. (D) Comparison of the mRNAsi between four different T stages (T1, 86 samples; T2, 221 samples; T3, 52 samples; and T4, 9 samples). (E) Comparison of the mRNAsi between four different N stages (N0, 254 samples; N1, 99 samples; N2, 24 samples; and N3, 3 samples). (F) Comparison of the mRNAsi between four different AJCC stages (stage I; 201 samples, stage II; 132 samples, stage III; 58 samples, and stage IV; 4 samples). (G) Kaplan–Meier survival curves show that the low mRNAsi group had a better OS rate than the high mRNAsi group. (H) Volcano map of DEGs: green indicates downregulated genes, and red indicates upregulated genes. (I) Kaplan–Meier curves show that the low mRNAsi group had a better PFS rate than the high mRNAsi group. LUSC, lung squamous cell carcinoma; mRNAsi, mRNA expression-based stemness index; AJCC, American Joint Committee on Cancer; OS, overall survival; PFS, progression-free survival. CR, complete response, PR, partial response, SD, stable disease, PD, progressive disease.
There was a significant difference between the mRNAsi in normal tissues and LUSC tissues; therefore, we aimed to identify DEGs based on the comparison between the two. After log2 processing of the data, we found a total of 6122 DEGs, including 3427 upregulated genes and 2695 downregulated genes. The volcano map is shown in Figure 1H.
The results of WGCNA was shown in Supplementary Table S1. All DEGs were included in the coexpression network after excluding 48 outlier samples (Figure 2A). β = 3 met the soft-threshold parameter of the construction requirements for scale-free distribution, and the curve reached R2 = 0.925. MEDissThres was set as 0.55 to merge the similar modules, and 13 modules were ultimately obtained (Figure 2B). After the modules were evaluated for their associations with the traits of LUSC and the patient’s mRNAsi and EREG-mRNAsi, the pink (R2 = 0.68, P = 6e−60) module was found to be positively correlated with the mRNAsi of LUSC patients (Figure 2C), while the yellow module (R2 = −0.76, P = 5e−58) was found to be negatively correlated with the mRNAsi of LUSC patients (Figure 2C). In addition, the genes in the pink (cor = 0.71, P < 1e−200) and yellow (cor = 0.74, P < 1e−200) modules were characterized by high GS and MM based on an intramodular analysis (Figures 2D,E). Therefore, we chose the pink module as the most significant module for subsequent research because it showed the highest positive correlation. Based on the threshold for key genes (MM > 0.6 and cor GS > 0.4), we ultimately obtained 10 hub genes.
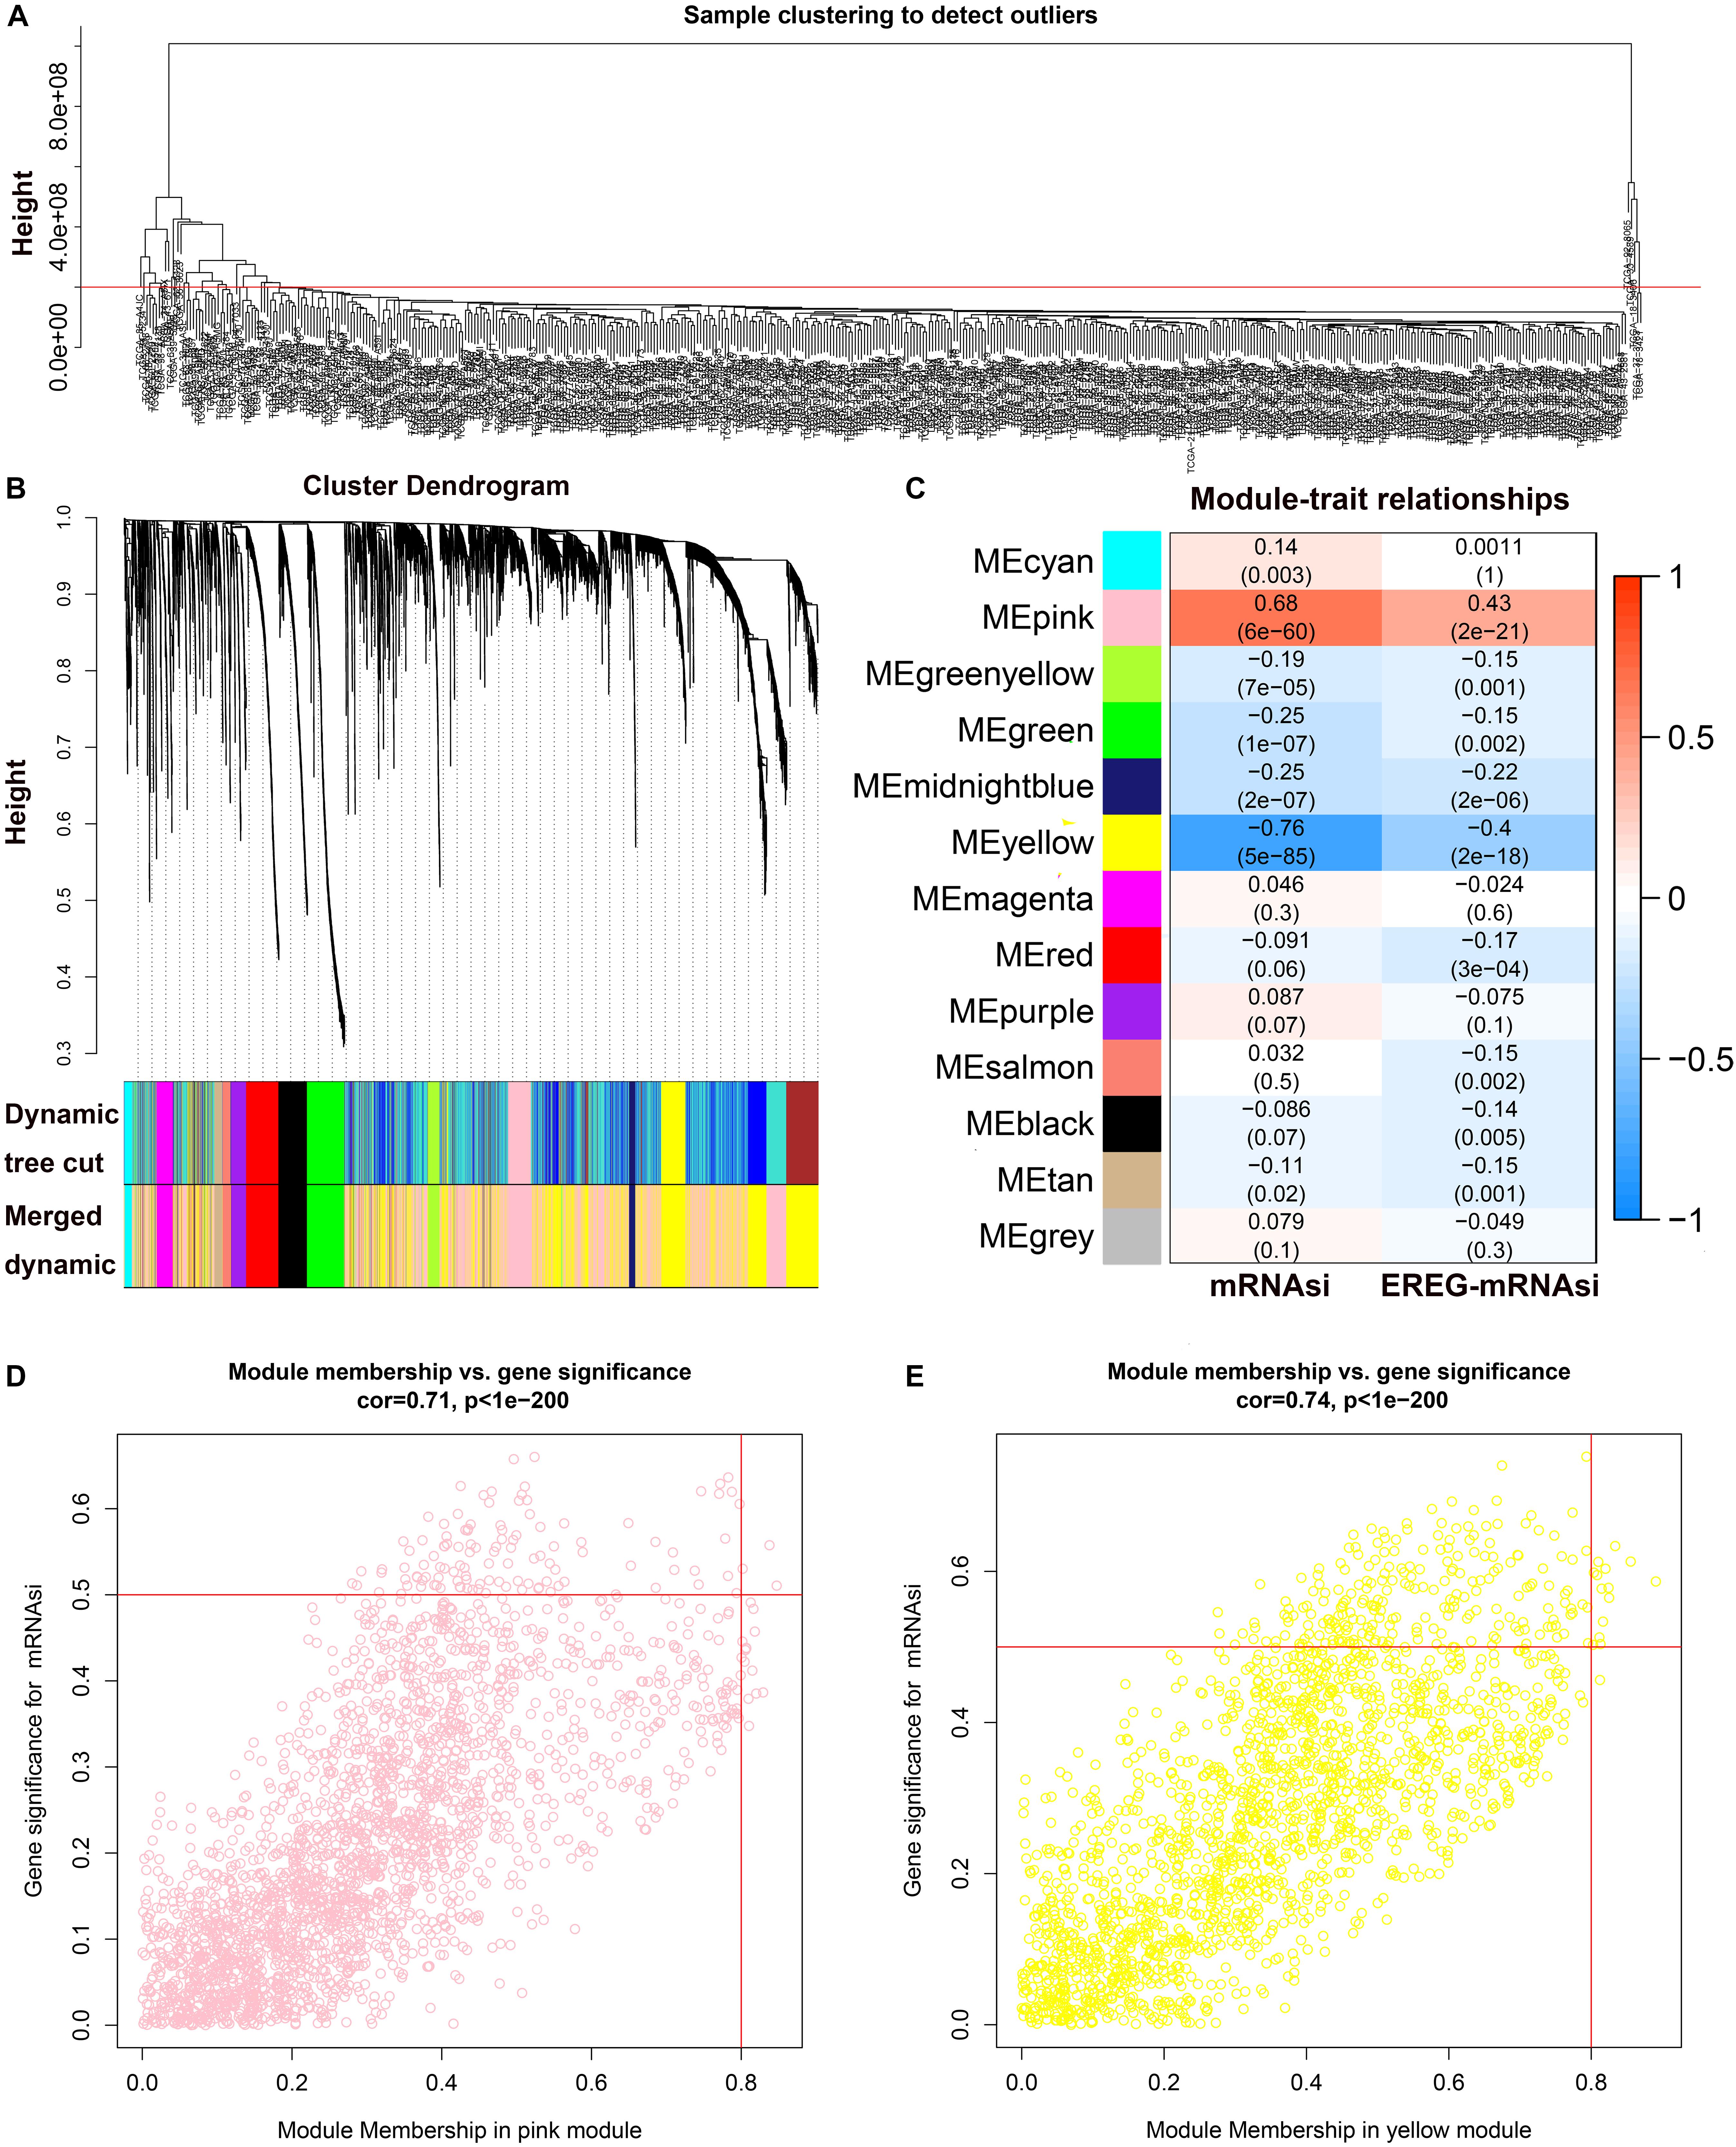
Figure 2. WGCNA of LUSC. (A) Clustering of samples and removal of outliers. (B) Cluster dendrogram of genes in LUSC patients. Each branch in the figure represents one gene, and each color represents one coexpression module. (C) Correlation between the gene module and clinical characteristics, including the mRNAsi and EREG-mRNAsi. The correlation coefficient in each cell represents the correlation between the gene module and clinical characteristics and decreases in size, from red to blue. (D) Scatter diagram for MM vs. GS for the mRNAsi in the pink module. (E) Scatter diagram for MM vs. GS for the mRNAsi in the yellow module. LUSC, lung squamous cell carcinoma; mRNAsi, mRNA expression-based stemness index; EREG, epigenetically regulated.
For the two modules that were most closely related to the mRNAsi, GO and KEGG pathway enrichment analyses were performed, and the top 5 enriched results are presented in Figure 3. The pink module, which exhibited the strongest positive correlation with the mRNAsi, is highly enriched in epidermal development, the secretory granule membrane, receptor regulator activity and the cytokine–cytokine receptor interaction, while the yellow module, which exhibited the strongest negative correlation with the mRNAsi, is highly enriched in organelle fission, the chromosomal region, ion-gated channel activity and the cell cycle.
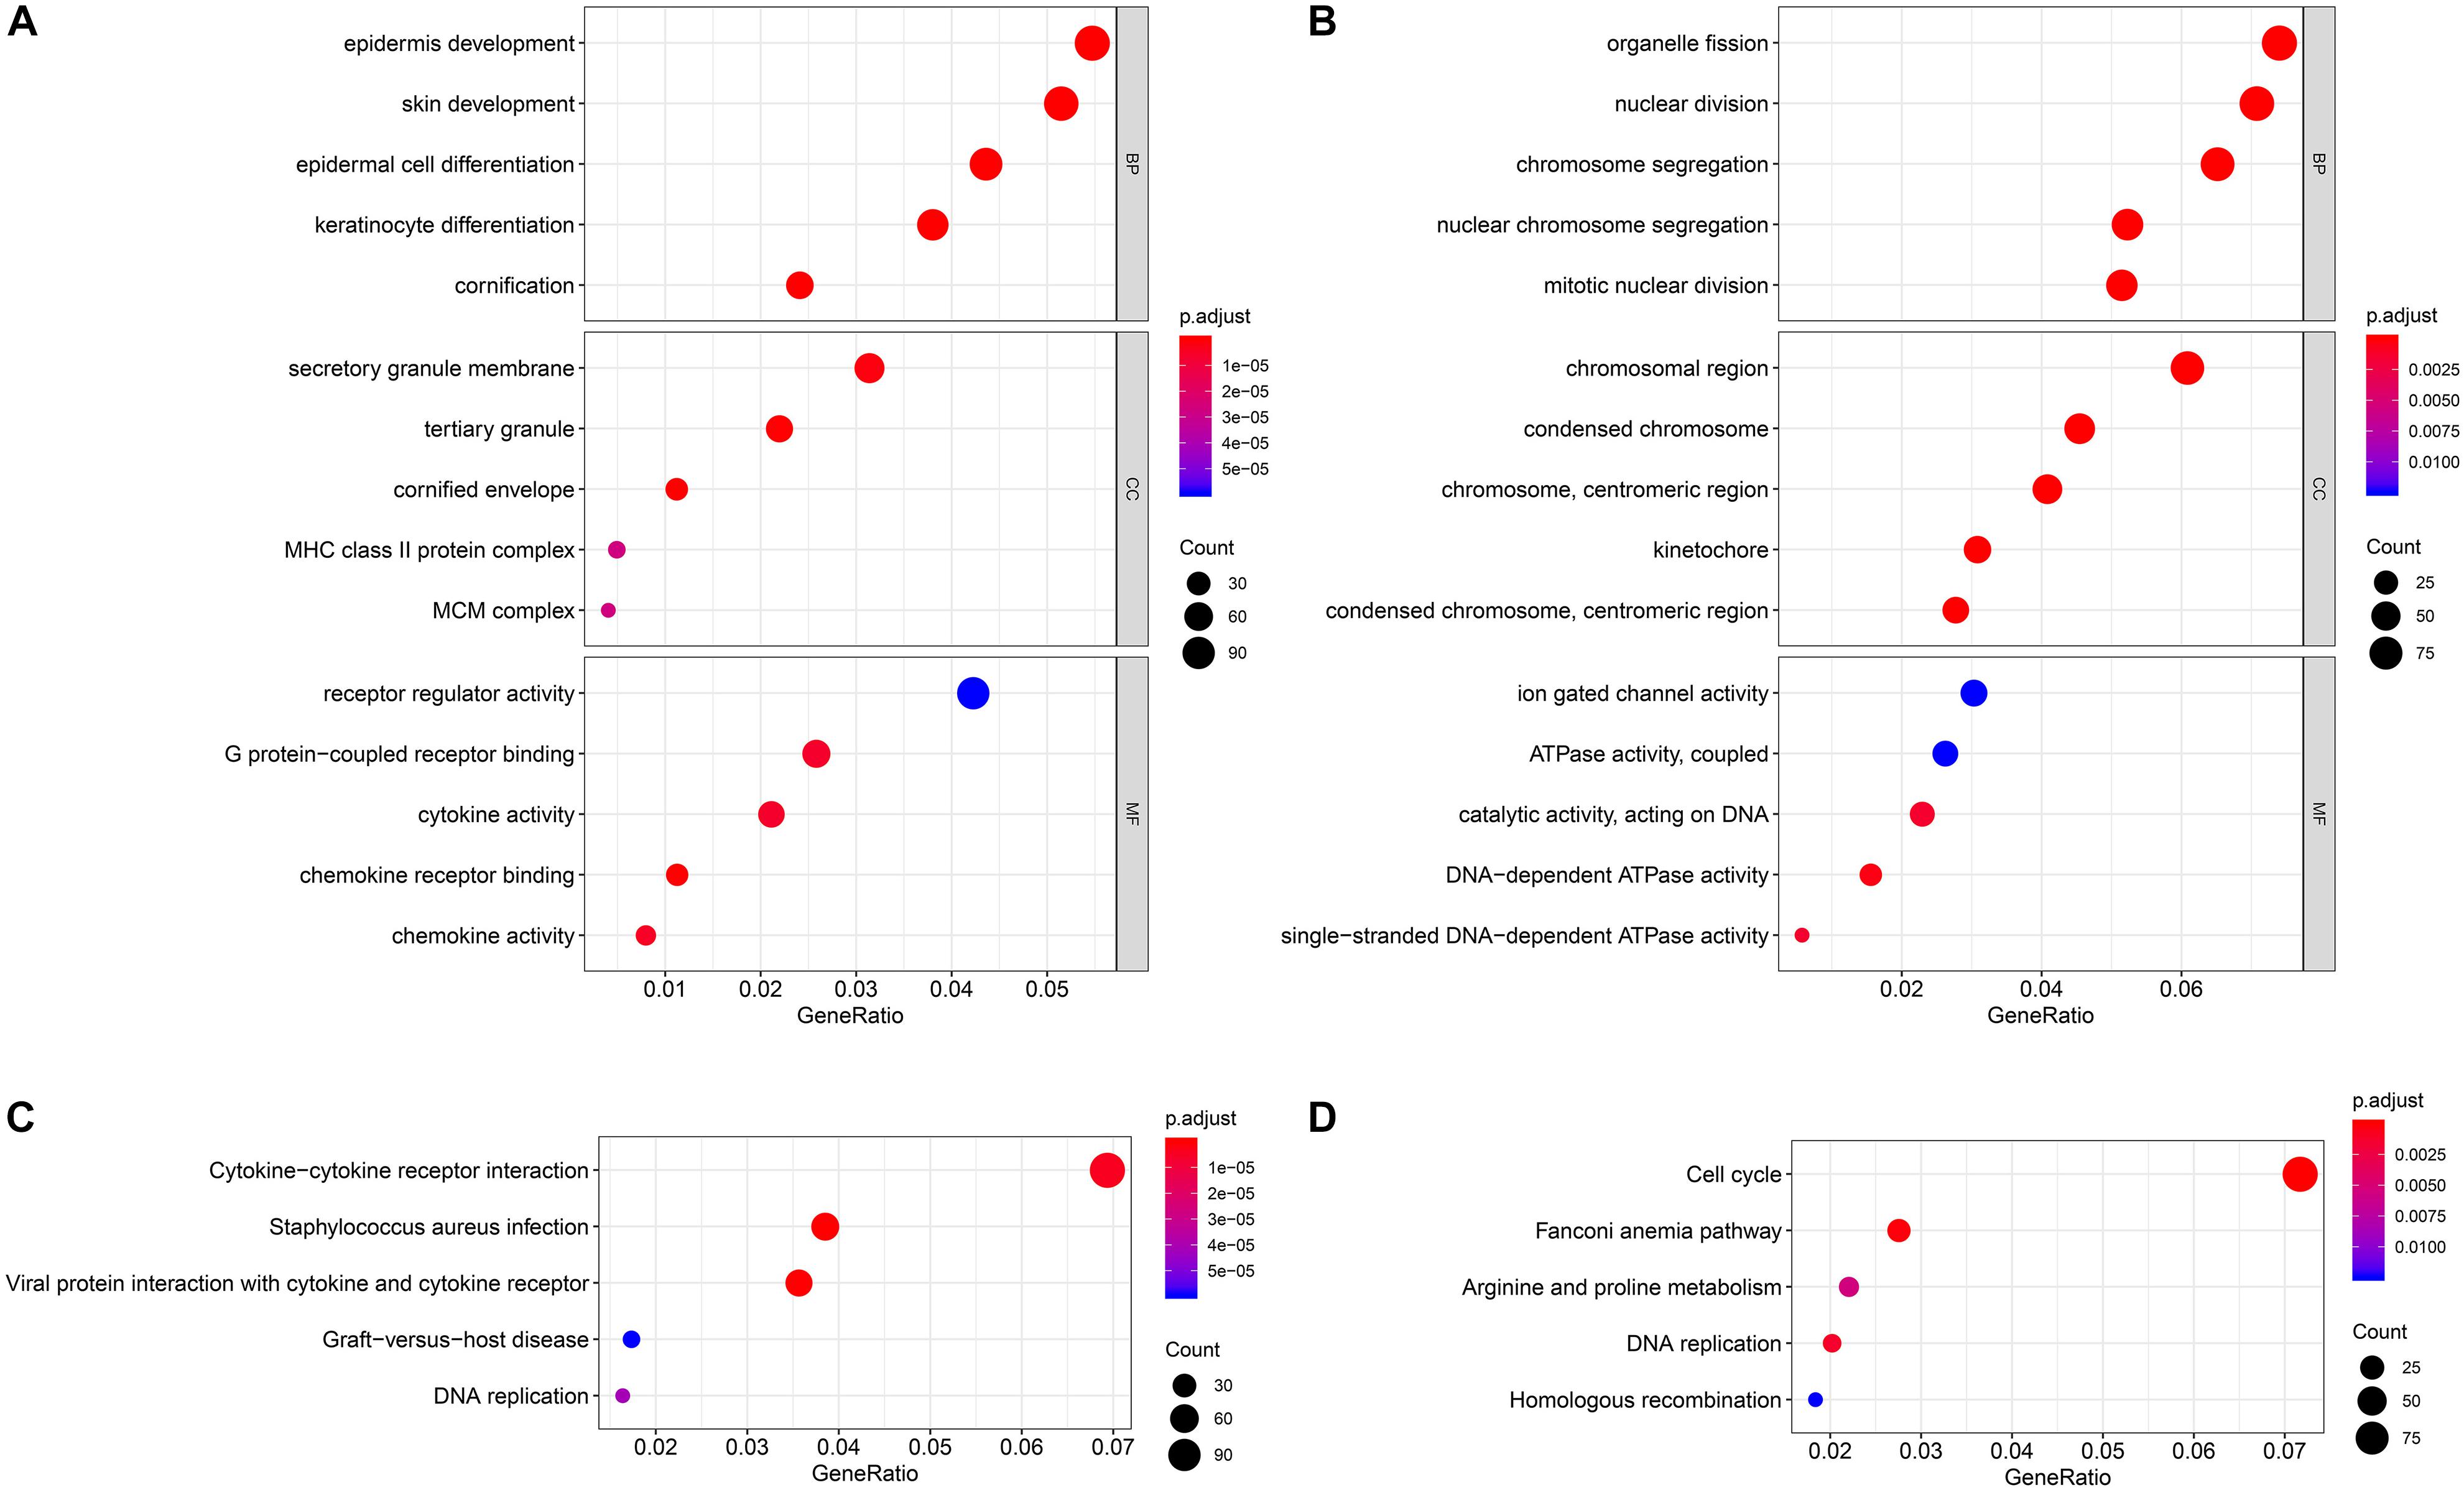
Figure 3. Enrichment analyses of the significant module. (A) GO enrichment analysis of the pink module. (B) GO enrichment analysis of the yellow module. (C) KEGG pathway enrichment analysis of the pink module. (D) KEGG pathway enrichment analysis of the yellow module. GO, Gene Ontology; KEGG, Kyoto Encyclopedia of Genes and Genomes.
The PPI network, consisting of the top 10 hub genes, was constructed using the STRING database. In total, 10 nodes and 33 edges were included in this PPI network (Figure 4A), with an average node degree of 6.6 and strong correlations. The 10 hub genes were also significantly correlated with each other at the transcriptional level (Figure 4B). The expression levels of the top 10 hub genes were higher in tumor tissue than in normal tissue (Figure 5). However, only 5 hub genes were differentially expressed in different TNM stages (Figure 6): CDCA5, CENPA, NCAPH, SPAG5, and TIMELESS.
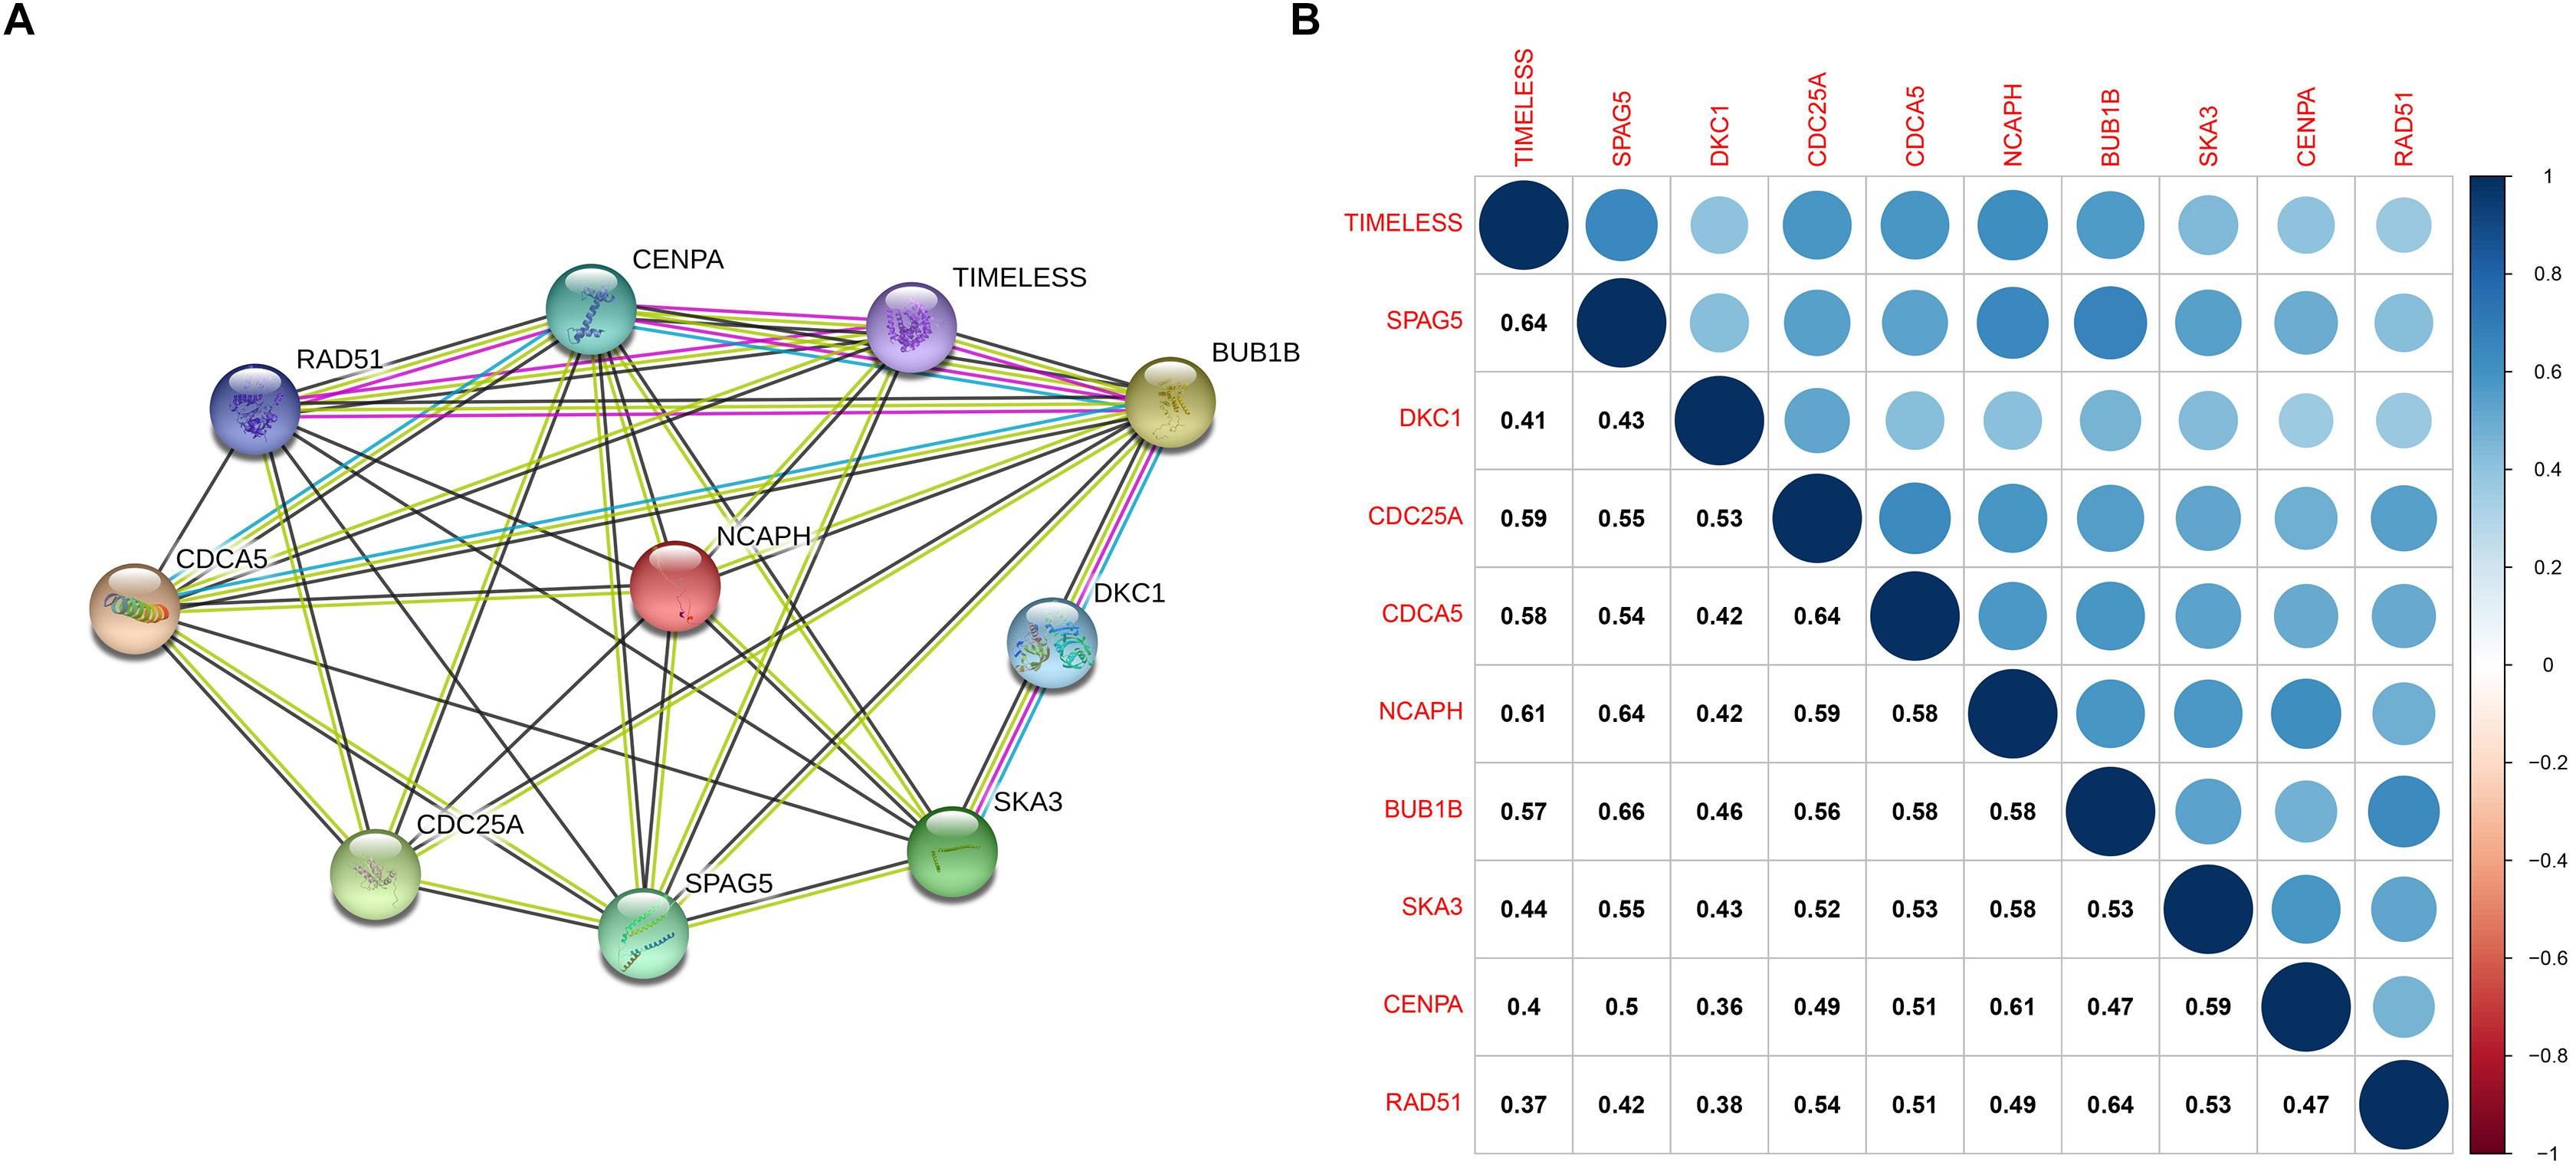
Figure 4. (A) Protein–protein interactions between hub genes. The thickness of the solid line represents the strength of the relationship. (B) Correlation between the hub genes.
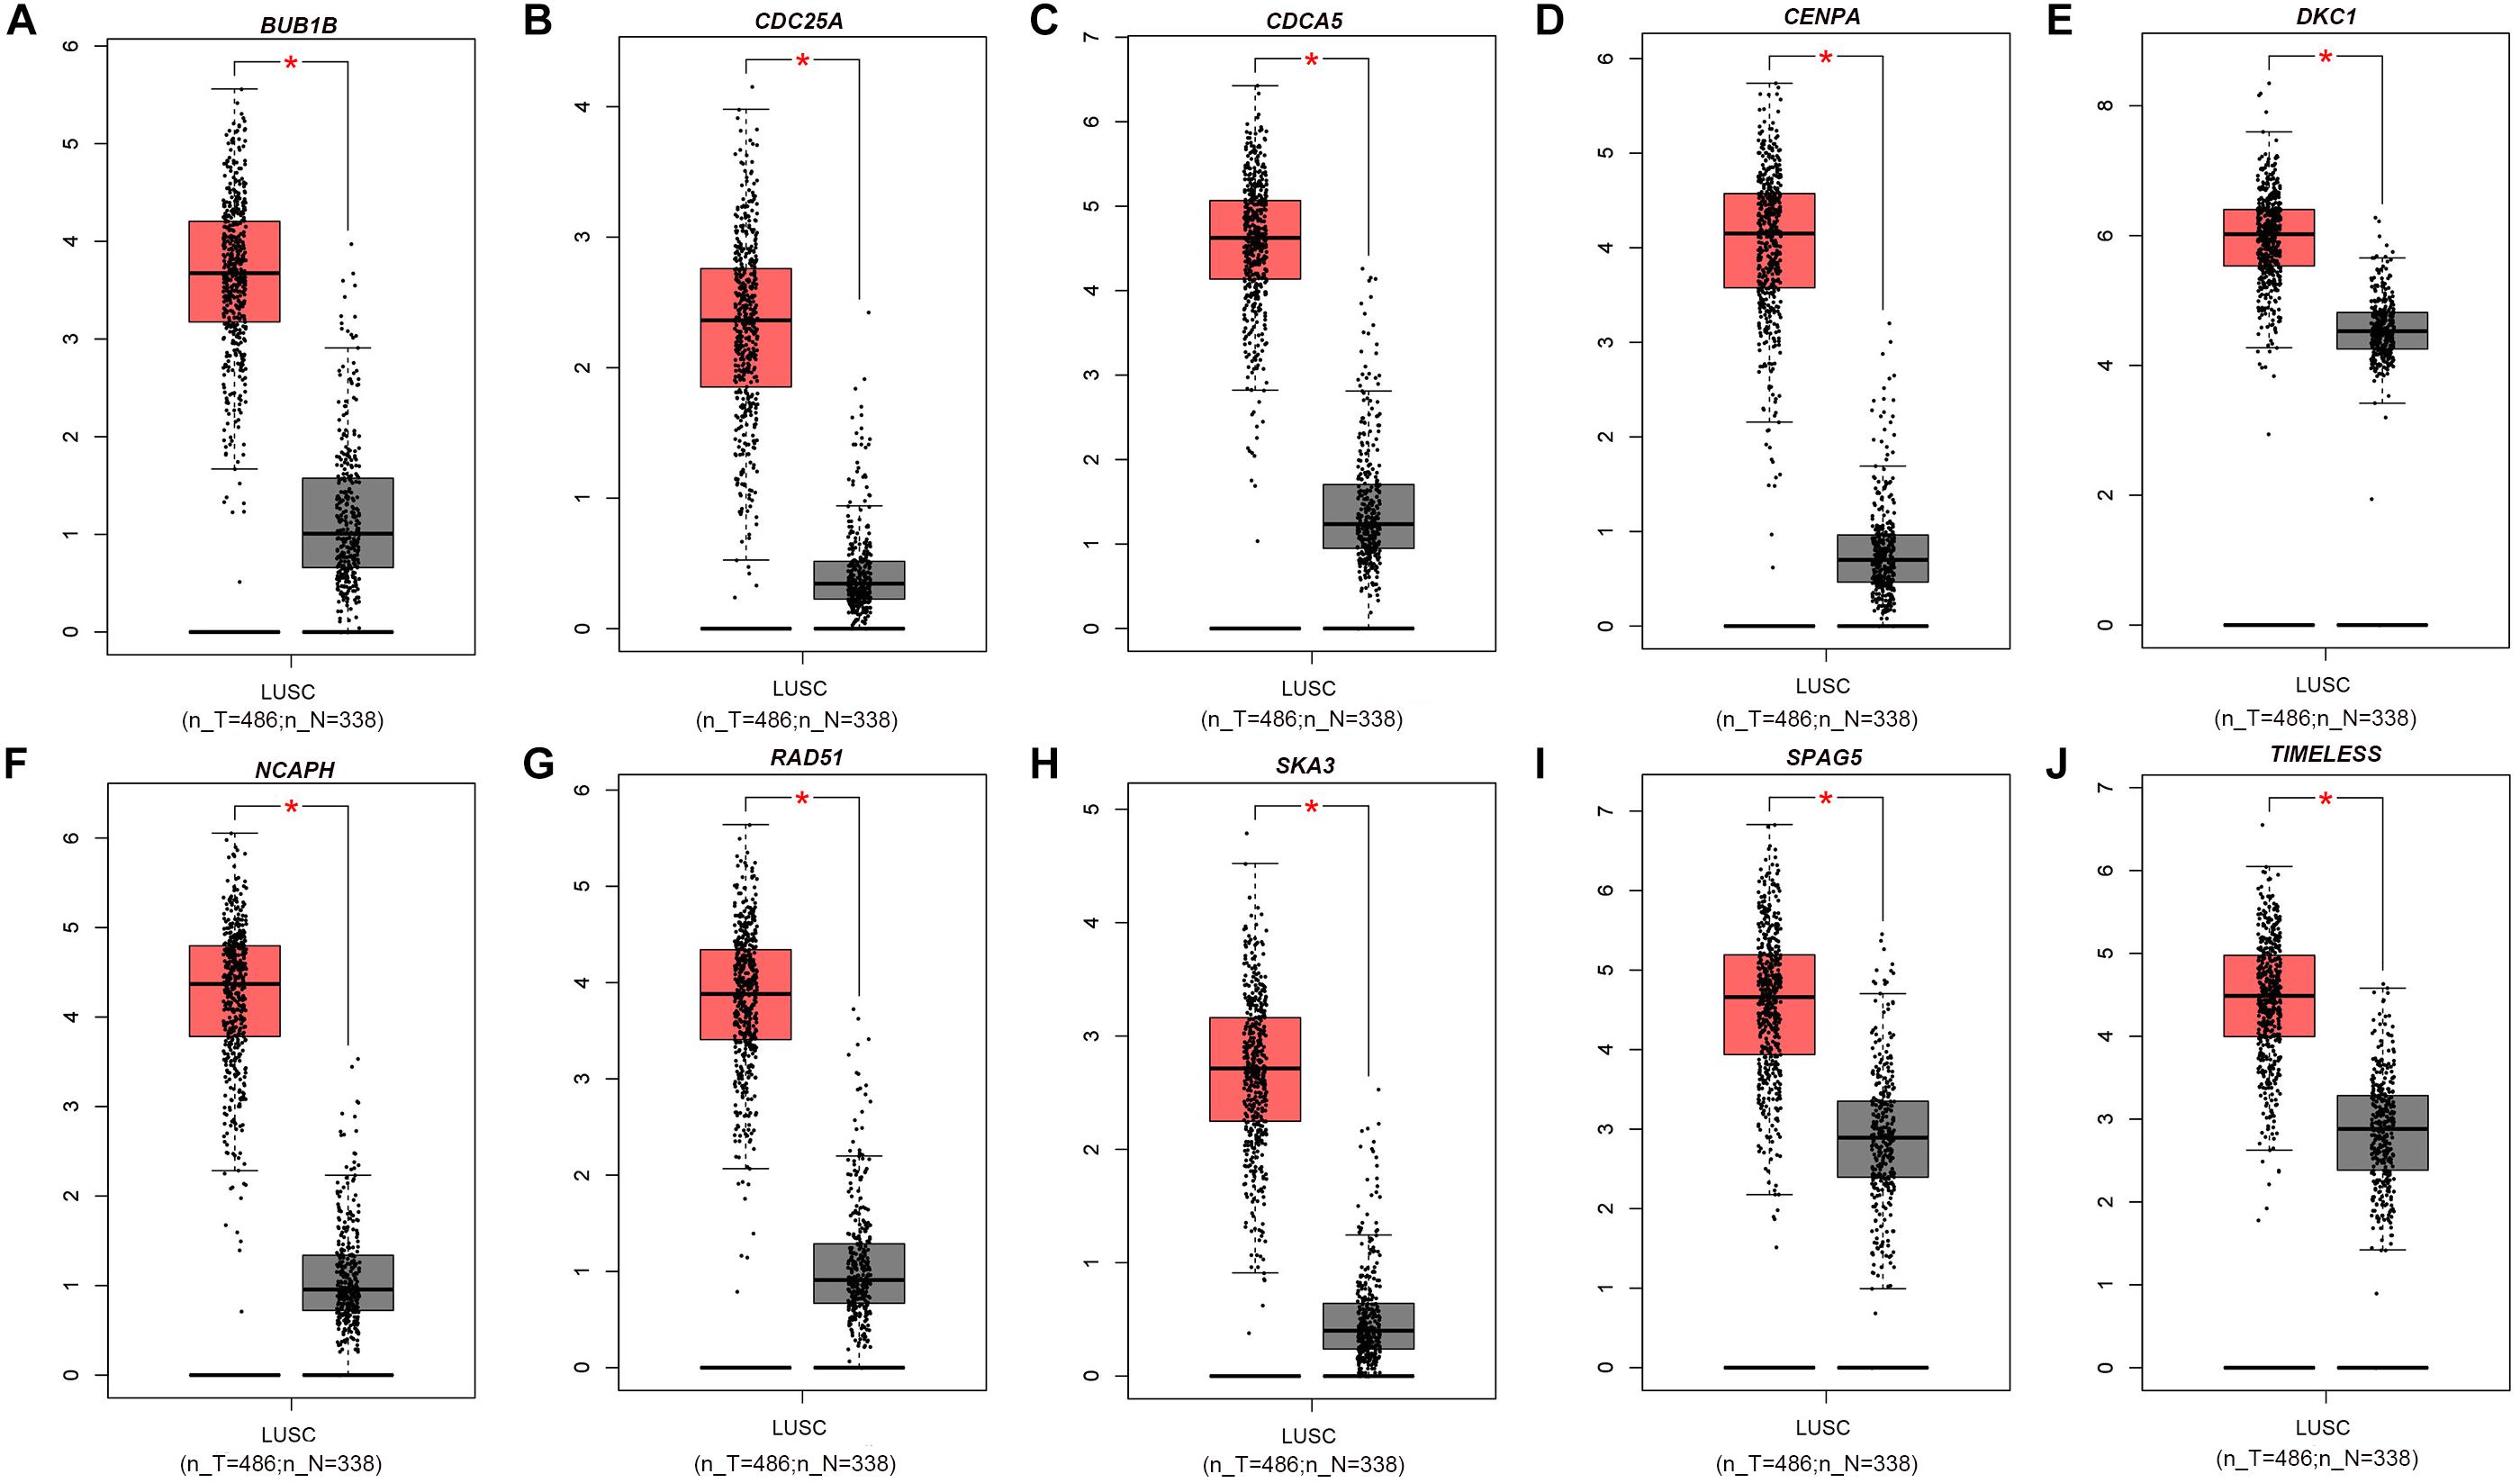
Figure 5. Box plot of the top 10 hub genes whose expression levels were verified with data from the GEPIA database: (A) BUB1B, (B) CDC25A, (C) CDCA5, (D) CENPA, (E) DKC1, (F) NCAPH, (G) RAD51, (H) SKA3, (I) SPAG5, and (J) TIMELESS. Red * indicates P < 0.05.
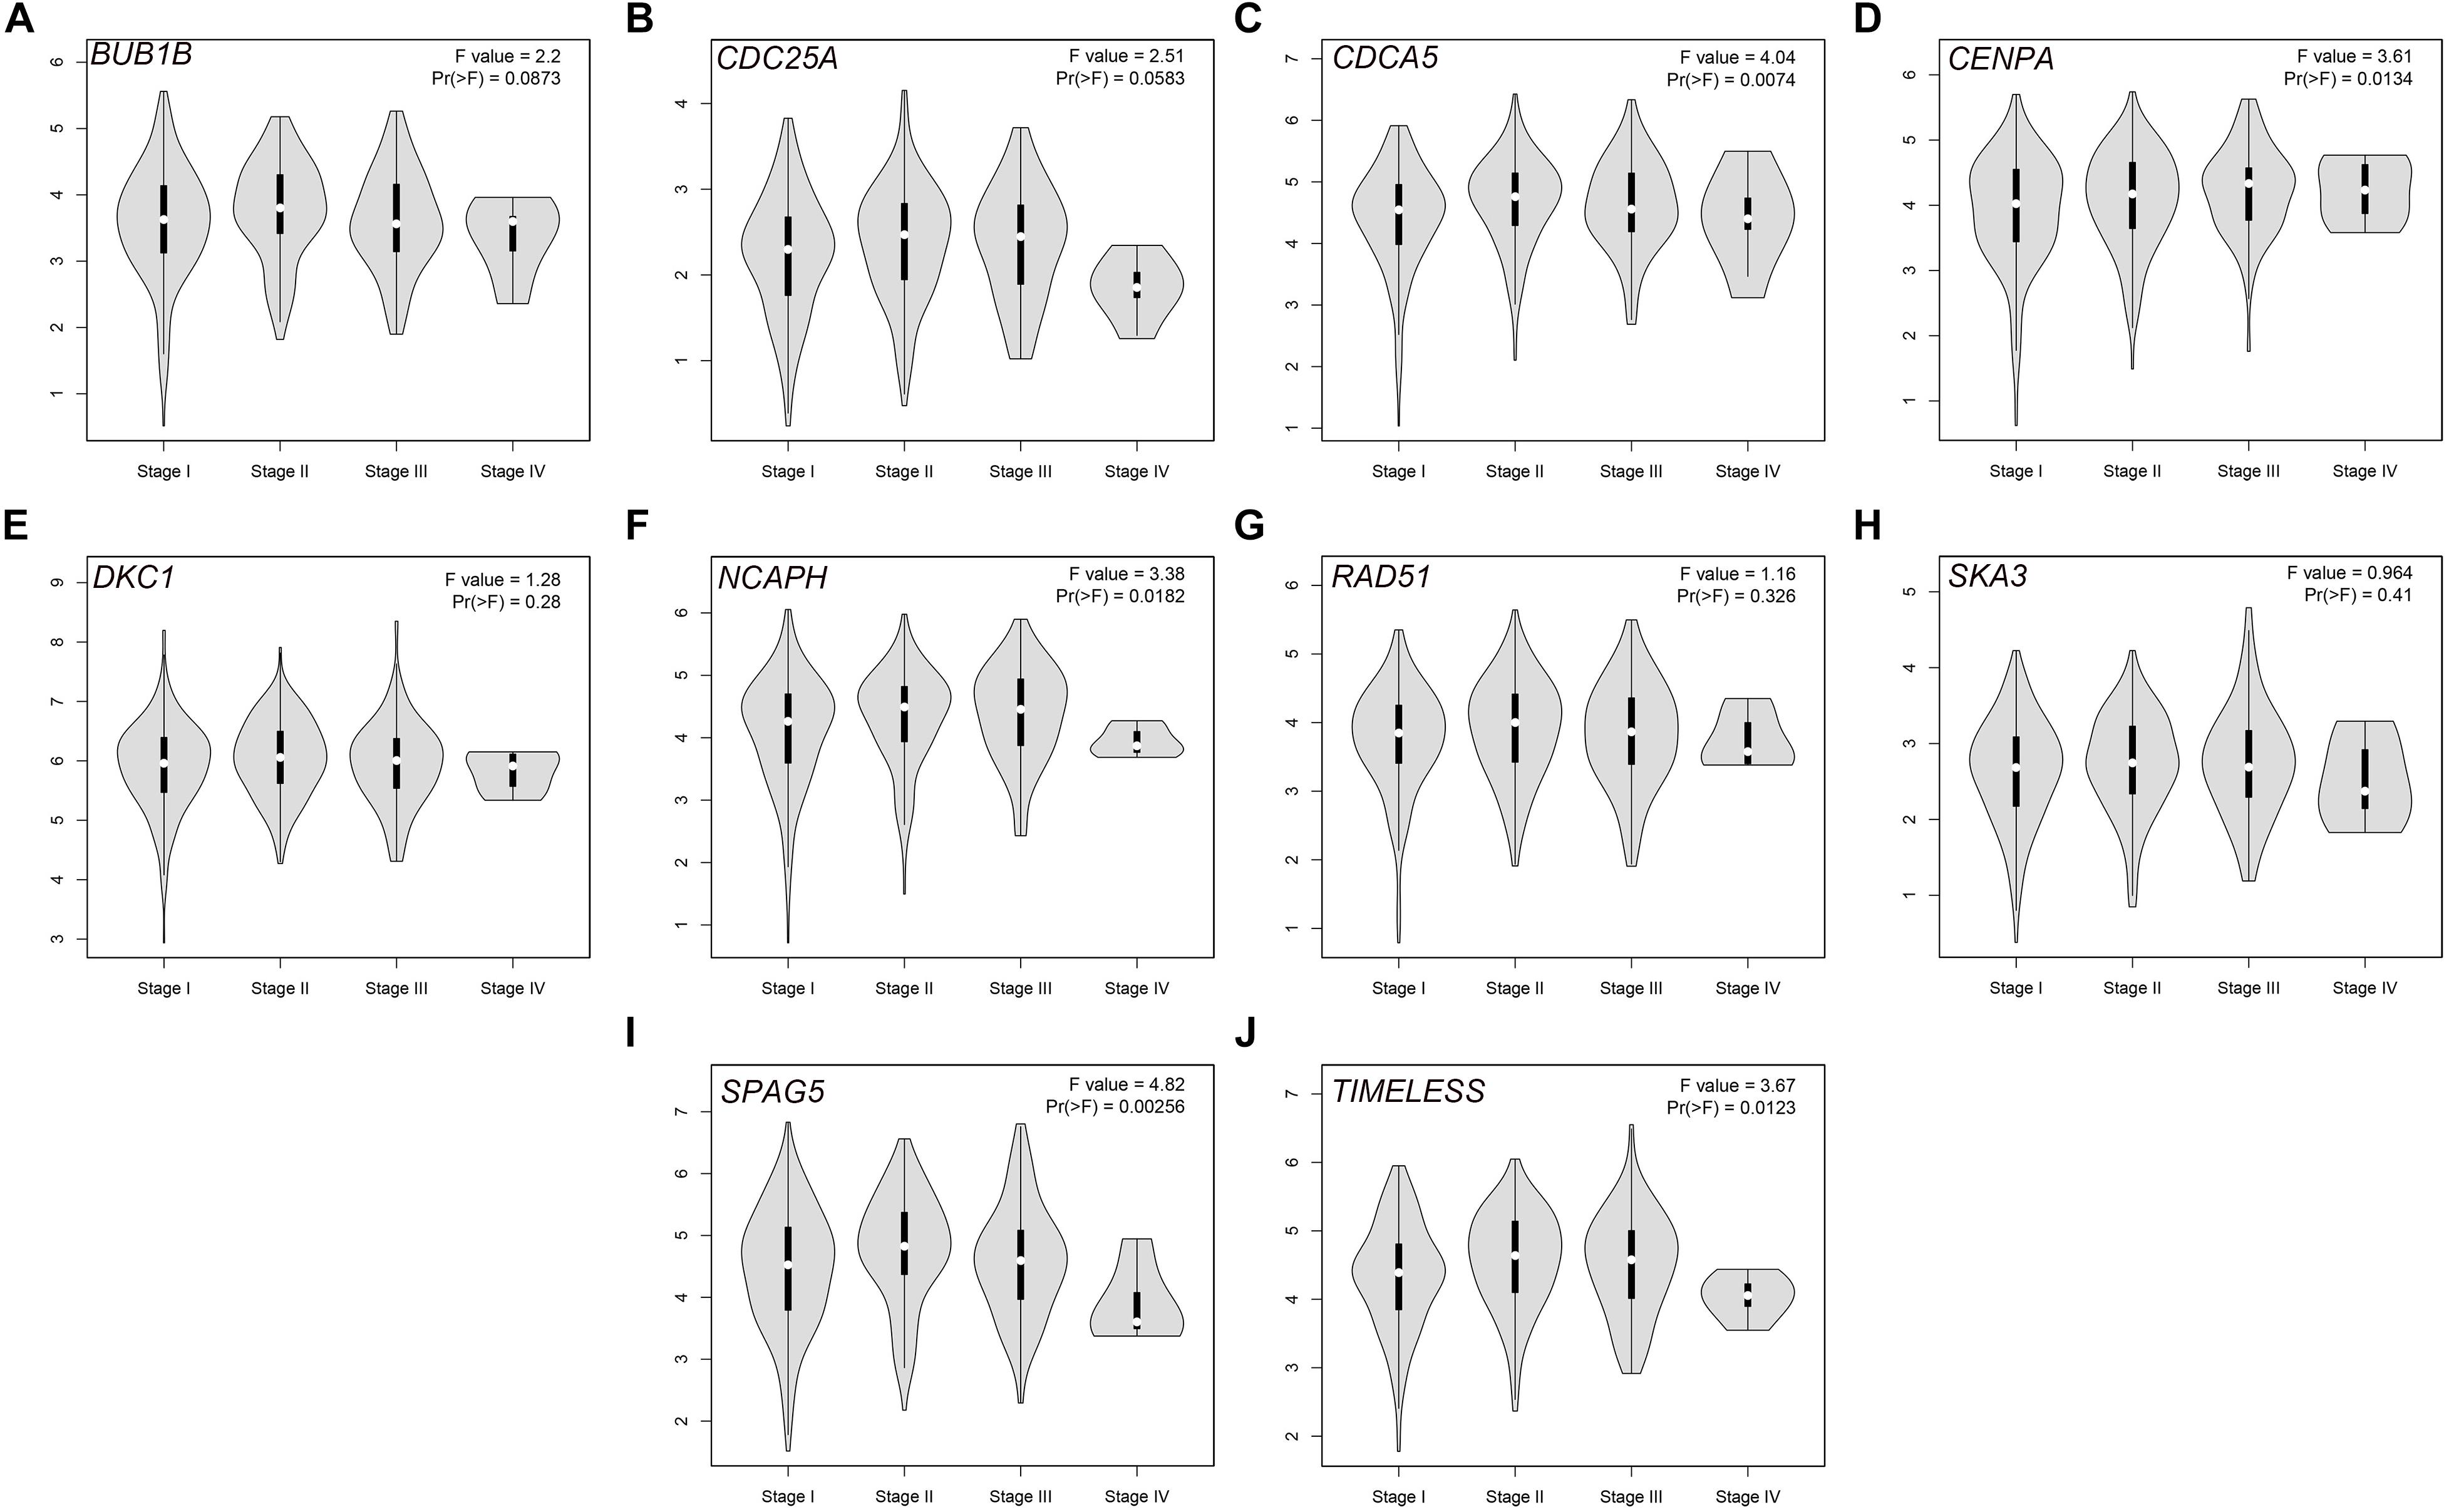
Figure 6. Violin plots of the expression levels of the selected hub genes in different stages via the GEPIA database: (A) BUB1B, (B) CDC25A, (C) CDCA5, (D) CENPA, (E) DKC1, (F) NCAPH, (G) RAD51, (H) SKA3, (I) SPAG5, and (J) TIMELESS.
The prognostic signature consists of three hub genes (Figure 7A) that were incorporated into the multivariate Cox proportional hazards regression analysis to obtain the coefficients of the three hub genes that were used in Equation 1 to calculate the risk scores (Table 1). The risk score was calculated as follows: (−0.630∗ expression level of BUB1B) + (−0.652∗ expression level of CENPA) + (2.163∗ expression level of NCAPH) (Table 1). The prognosis of high-risk patients was significantly worse than that of low-risk patients (Figure 7B). The AUC values of 1-, 3-, and 5-year OS were 0.680, 0.704, and 0.674, respectively (Figure 7C).
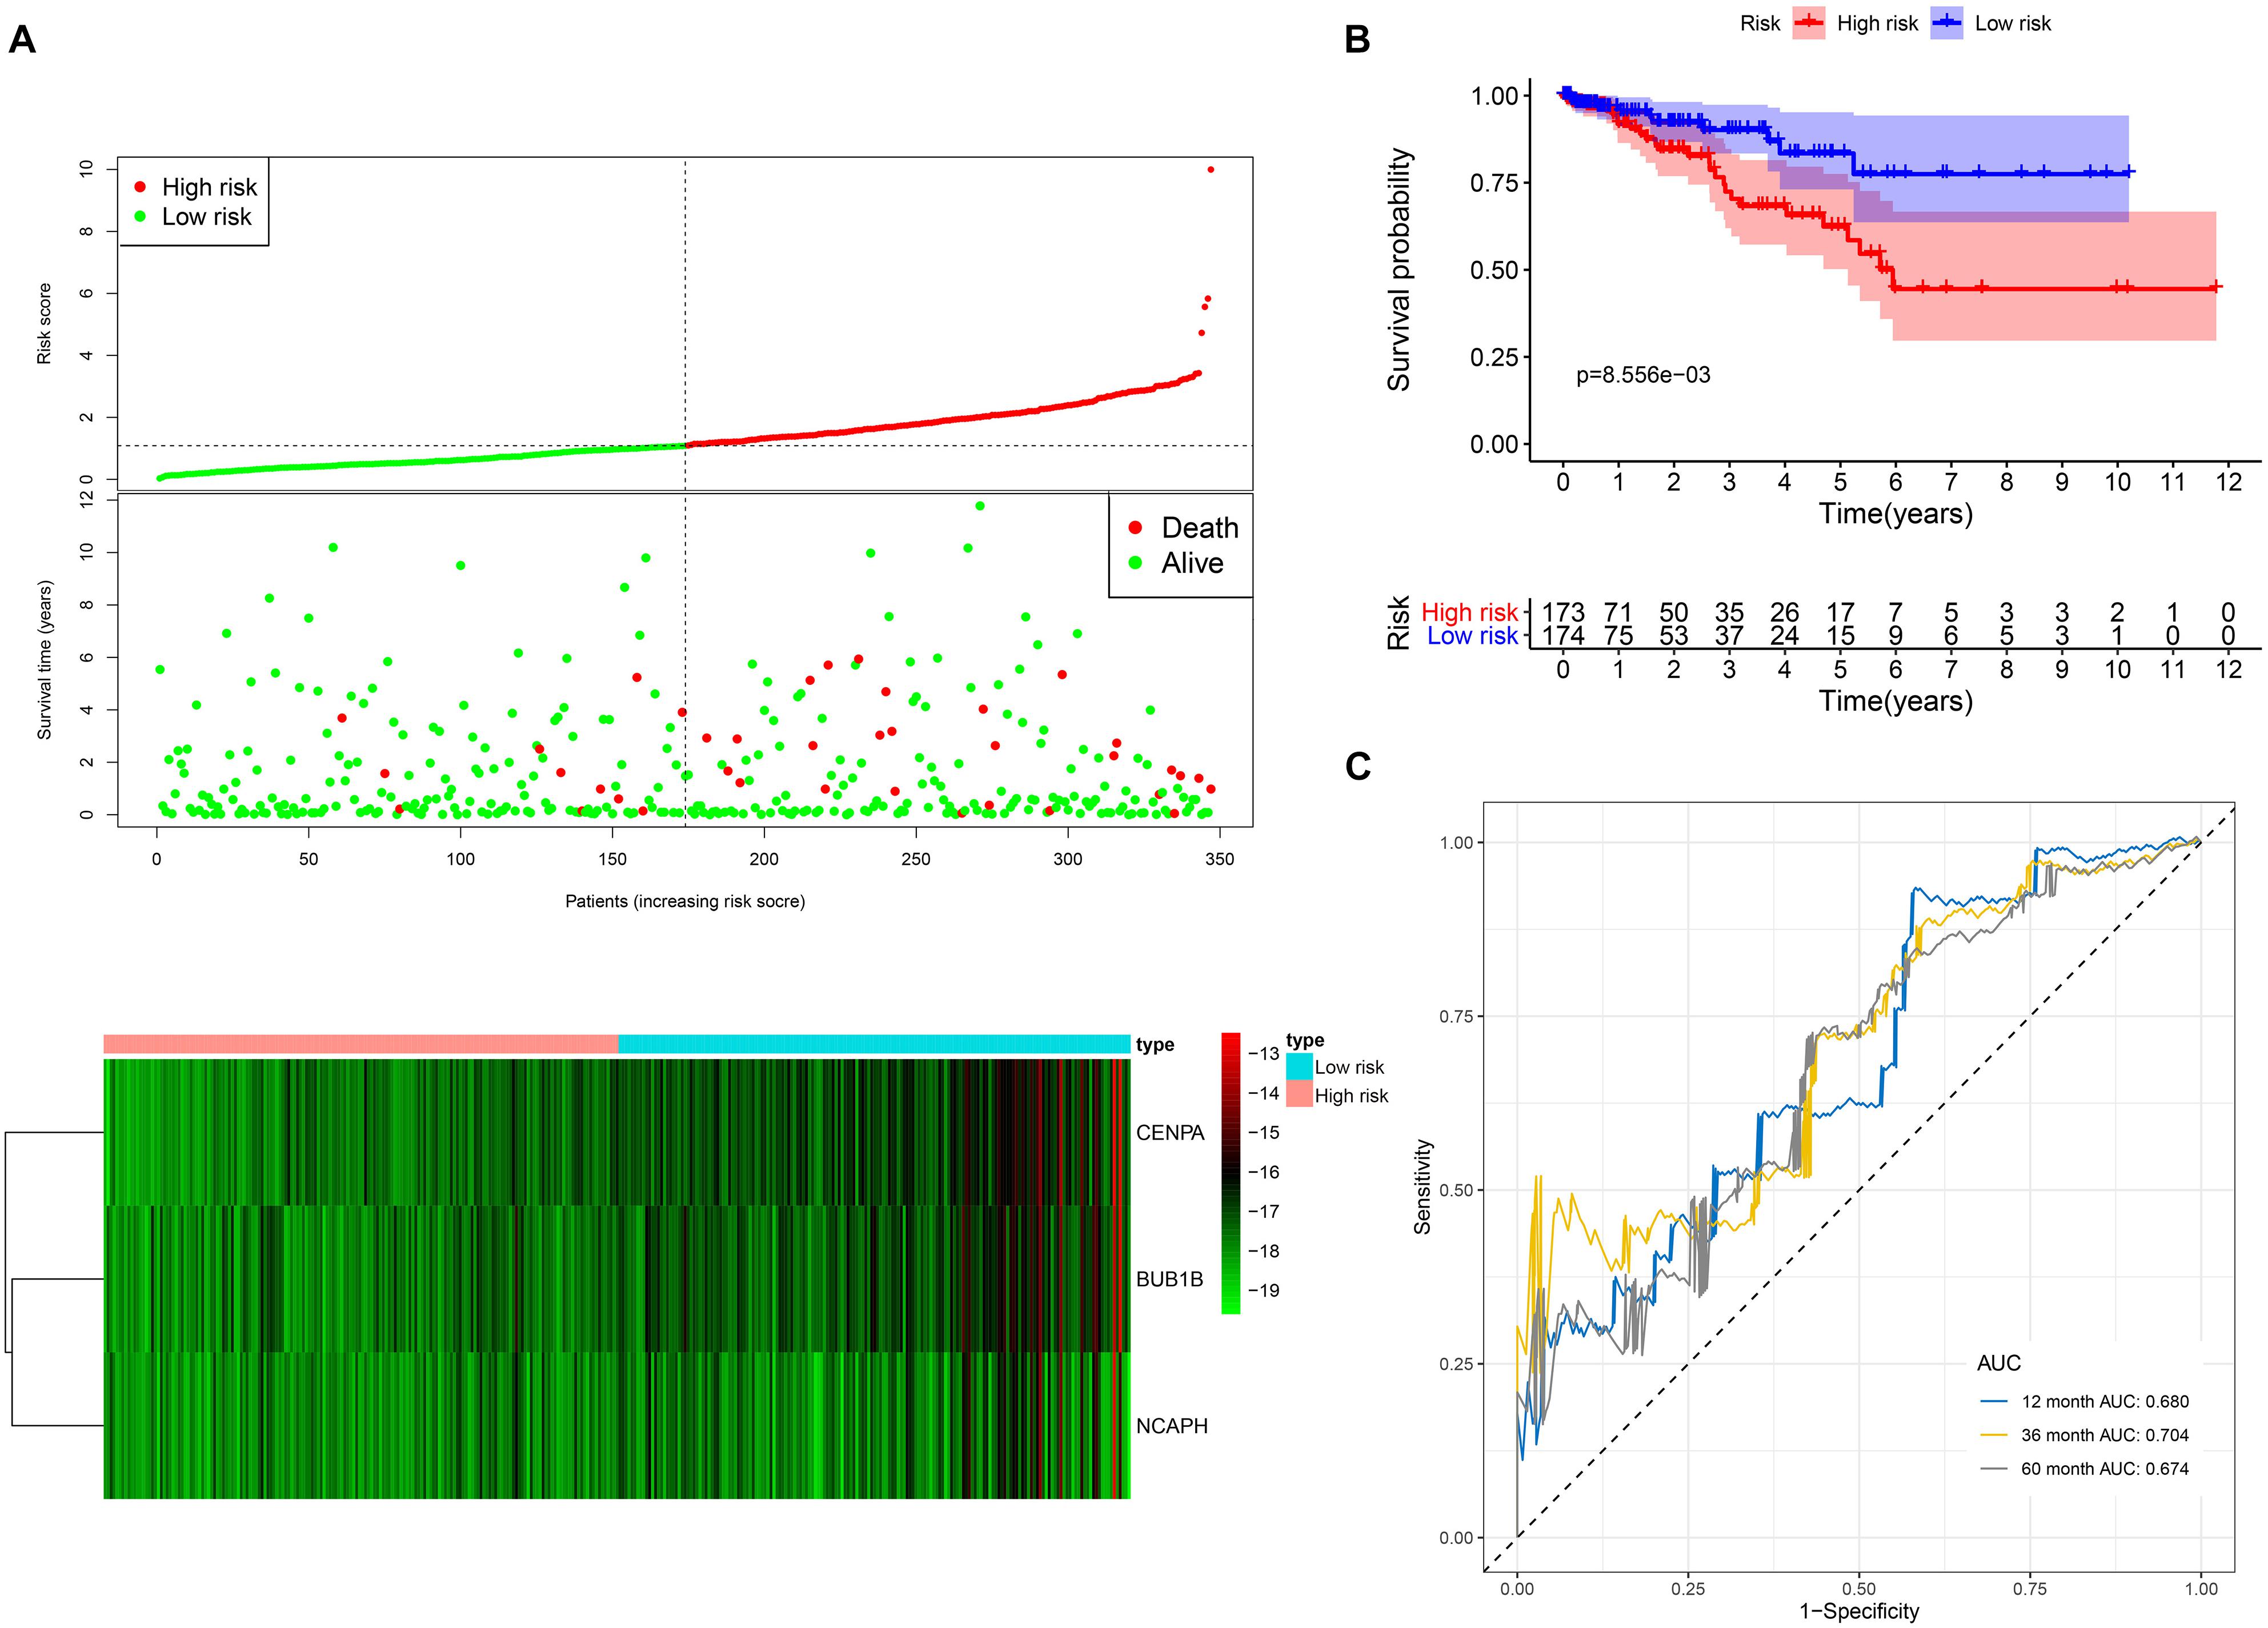
Figure 7. The three-hub mRNA signature used to predict OS in LUSC patients. (A) Distribution, patient survival status and heatmap of the three-hub mRNA expression profiles. (B) Kaplan–Meier survival estimates of OS in LUSC patients according to the three-hub mRNA signature. (C) ROC analysis for the prediction of 1-, 3-, and 5-year OS as the defining point of the three-hub mRNA signature. LUSC, lung squamous cell carcinoma; ROC, receiver operating characteristic; OS, overall survival.
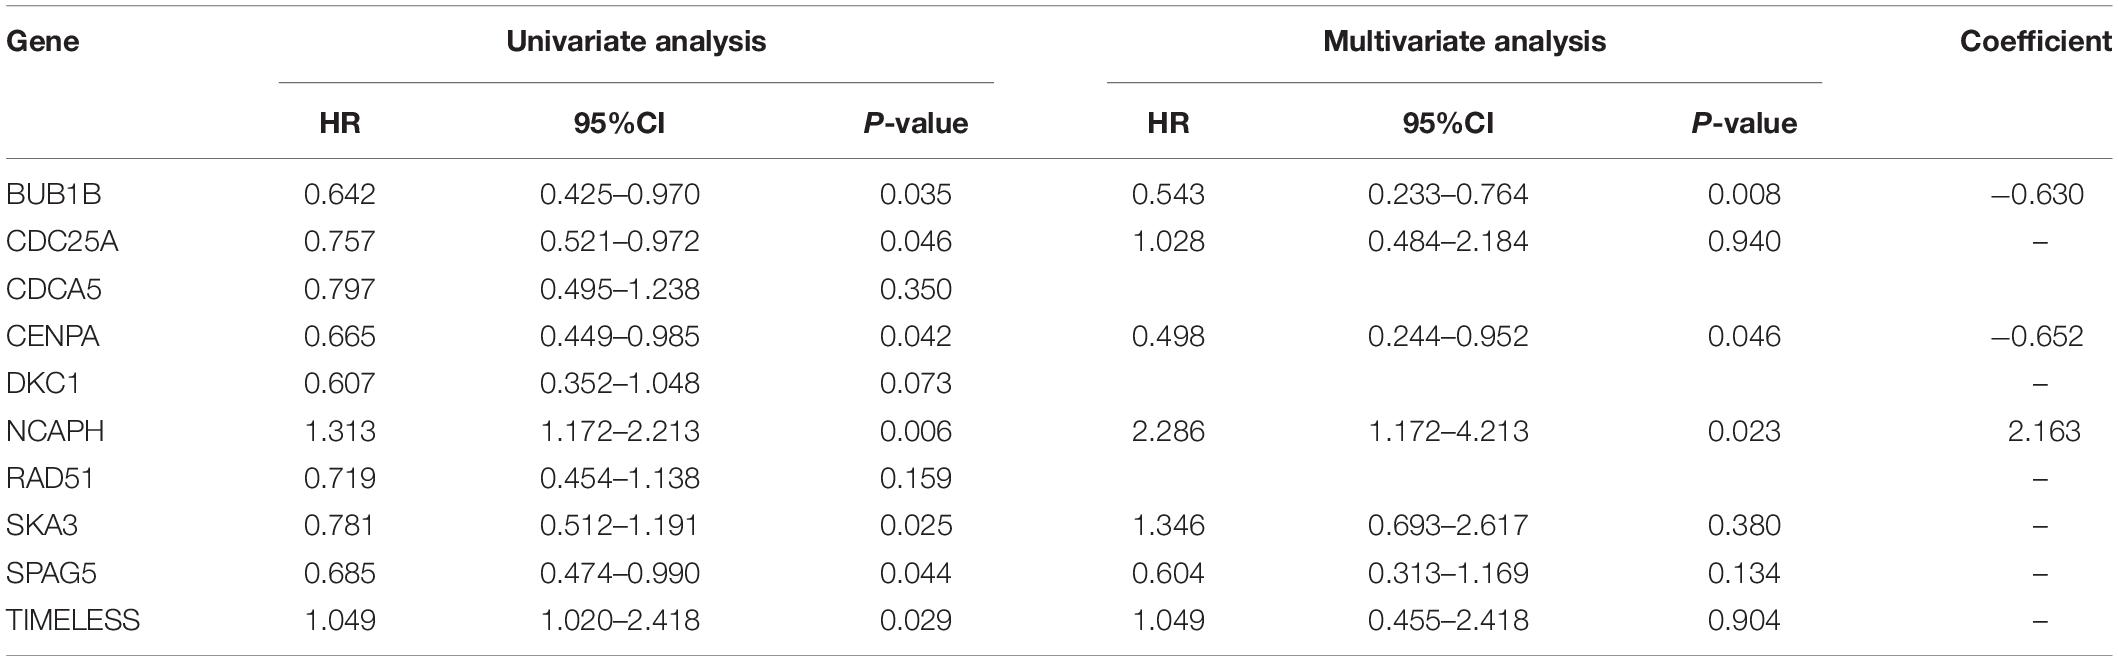
Table 1. Multivariable Cox regression analysis of the three-hub gene signature.
The nomogram included the independent risk factors identified by the univariate and multivariate Cox regression analyses (Table 2): race (Caucasian vs. non-Caucasian), AJCC stage (stages I-II vs. stages III-IV), pharmacotherapy (no vs. yes) and risk score (low vs. high). The nomogram was constructed with these risk factors (Figure 8A). The AUC values for 1-, 3-, and 5-year OS were 0.754, 0.876 and 0.836 (Figure 8B), respectively. The calibration curve also demonstrated good capacity for the nomogram to predict 1- (Figure 8C), 3- (Figure 8D), and 5- (Figure 8E) year OS. The code for R software in this study can be obtained from Supplementary Data Sheet S1.
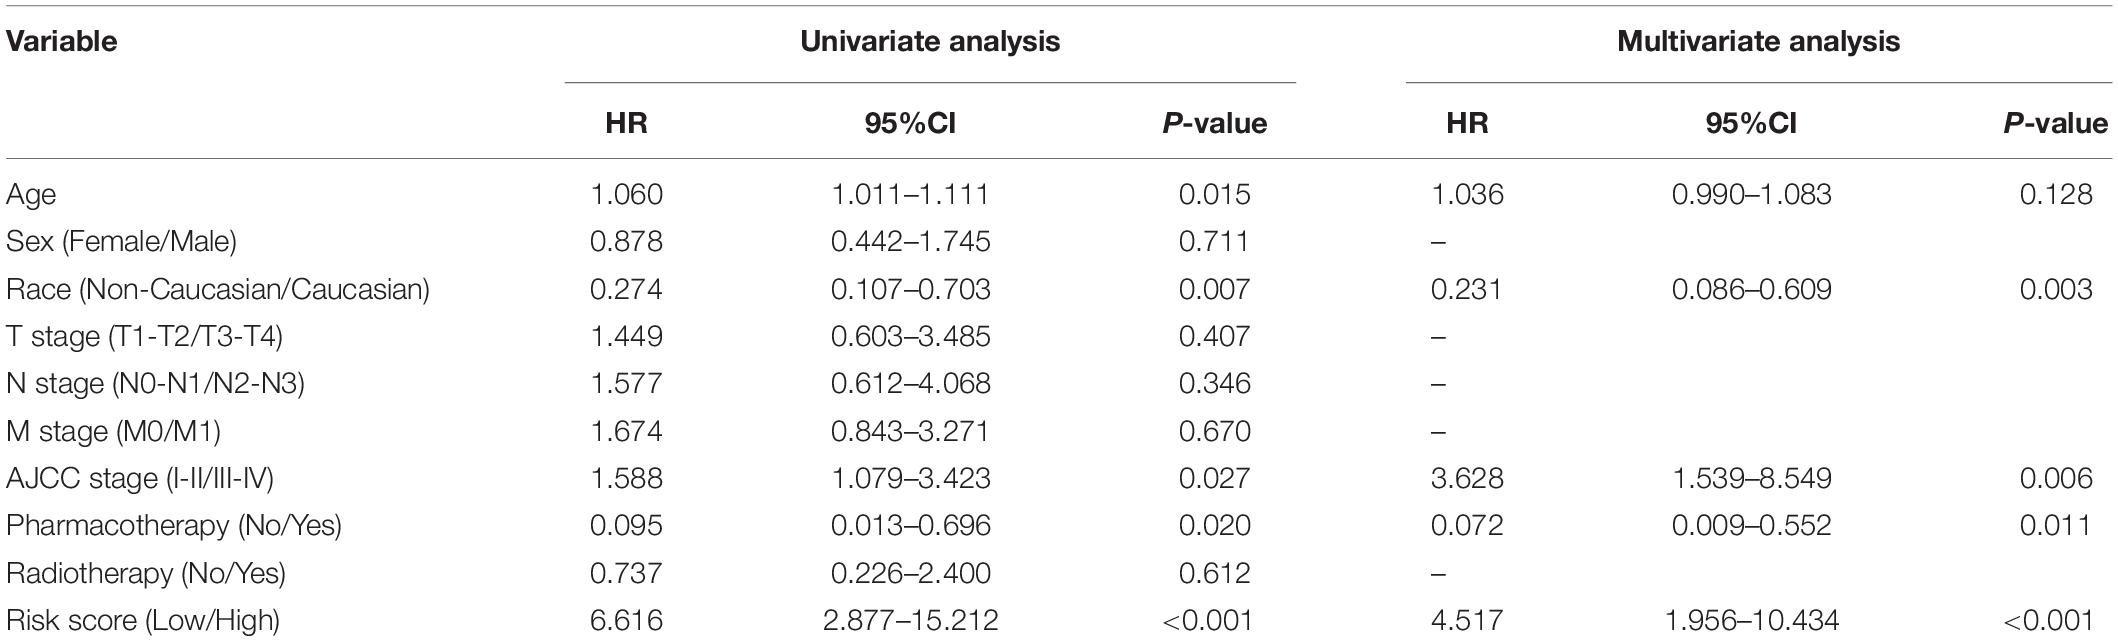
Table 2. Univariable and multivariable Cox regression analyses of clinical characteristics.
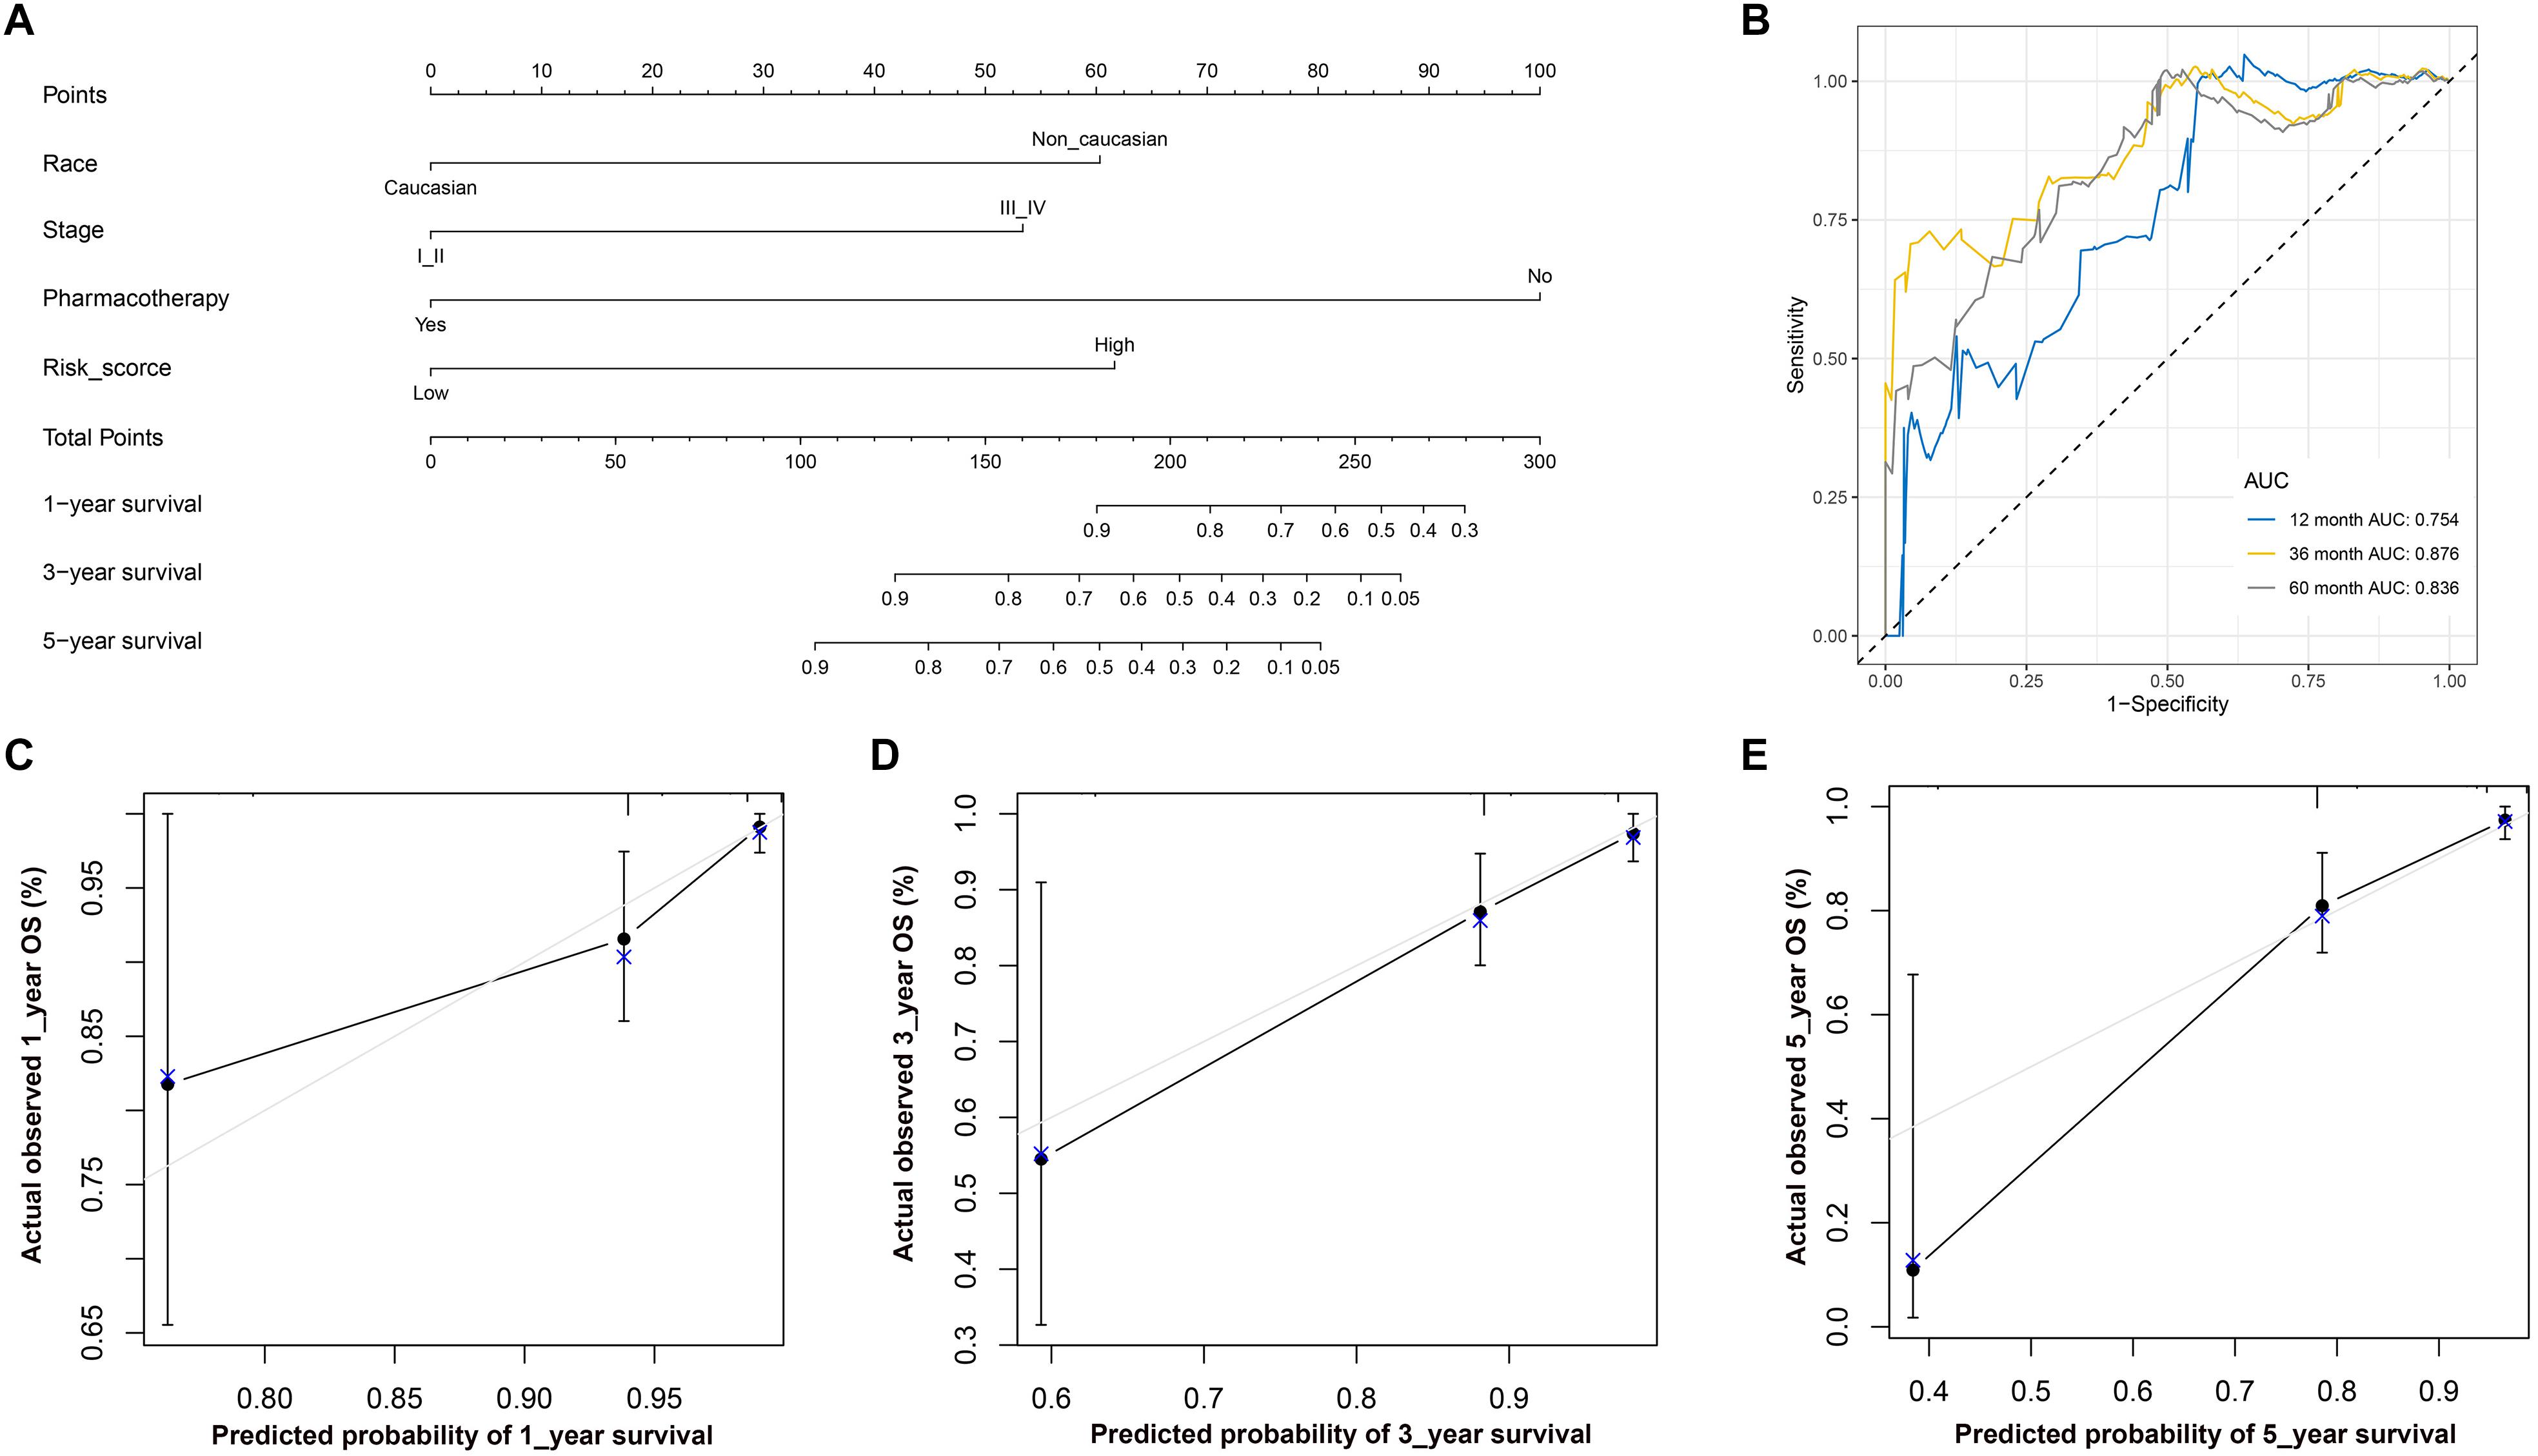
Figure 8. (A) Nomogram used to predict 1-, 3-, and 5-year OS. (B) ROC curve based on the nomogram for 1-, 3-, and 5-year OS probability. (B) ROC analysis of 1-, 3-, and 5-year OS as the defining points of the nomogram. (C) Calibration curves for predicting 1–year OS. The nomogram–predicted probability of survival is plotted on the x–axis; actual survival is plotted on the y–axis. (D) Calibration curves for predicting 3–year OS. (E) Calibration curves for predicting 5–year OS. According to the scores of the corresponding variables in the nomogram, namely, the points at the top of the chart, the 1-, 3-, and 5-year survival rates of patients can be predicted according to the total scores of all corresponding individual scores. Theoretically, the standard curve is a straight line with a slope of 1 through the origin of the coordinate axis. If the predicted calibration curve is closer to the standard curve, the better the prediction capacity of the nomogram is. LUSC, lung squamous cell carcinoma; ROC, receiver operating characteristic; OS, overall survival.
LUSC is associated with extremely high mortality and morbidity, but its pathogenesis is still unclear. However, an increasing number of studies have found that cancer stem cells (CSCs) play an important role in the development and drug resistance of NSCLC (Herreros-Pomares et al., 2019; Huang et al., 2019; Tahmasebi et al., 2019). In this study, we identified the significance of the mRNAsi in the clinical characteristics of patients with LUSC with the help of data from the TCGA database and the mRNAsi corresponding to each sample. Moreover, hub genes related to the mRNAsi were obtained by the WGCNA method, and the association between the change in hub gene expression and clinical features was verified by external data from the GEPIA database. The results also indicated that all hub genes are highly expressed in tumor tissues, and some hub genes are of great significance as the disease progresses. Finally, after adjusting for the effects of confounding factors, we obtained a prognostic signature containing three prognostic genes with great predictive capacity. Two hub genes were not only highly expressed in LUSC but also associated with TNM stage and prognosis: CENPA and NCAPH.
CENPA (centromere protein A) is the key determinant of centromere identity (Fujita et al., 2015). The centromere is the basis of centromere formation and the key to chromosome separation during mitosis. CENPA controls the epigenetic identity of the centromere, which is essential for recruiting centromere elements to connect chromosomes to the mitotic spindle during mitosis (Rošic and Erhardt, 2016). Behnan et al. (2016) showed that the inhibition of CENPA expression in glioblastoma cells can reduce sphere-forming capacity, proliferation, and cell viability. In vitro experiments by Cheng et al. (2019) in mice confirmed that elevated FOXM1 expression enhanced CENPA and CENPB expression, which promoted cell cycle progression and cell proliferation, thereby promoting LUSC cell growth. Regarding prognosis, lung adenocarcinoma (LUAD) patients with high CENPA expression experience poor OS based on data integrated from six different GEO chips by Liu et al. (2018).
NCAPH (non-SMC condensin I complex subunit H), whose expression is significantly high in both LUAD and LUSC (Ma et al., 2019), belongs to the protein superfamily defined as kleisins (Neuwald and Hirano, 2000). NCAPH plays an important role in the separation of the cell’s sister chromatids and the maintenance of the mitotic chromosomal structure, and studies have demonstrated that its biallelic mutation can lead to a significant reduction in brain size in mice (Martin et al., 2016). Gene knockout experiments in mice by Sun et al. (2019) confirmed that NCAPH promotes the proliferation, migration and invasion of liver cancer in vivo and in vitro. The same experimental method also indicated that NCAPH is a potential candidate for radiation tolerance (Wang X.C. et al., 2019). High NCAPH expression also suggests a poor prognosis in prostate (Cui et al., 2019) and rectal (Yin et al., 2017) cancer patients.
BUB1B (BUB1 mitotic checkpoint serine/threonine kinase B) encodes a kinase involved in spindle checkpoint function and mitosis and plays an important role in the development of many types of cancer (Baker et al., 2013). Interestingly, BUB1B is also highly expressed in SCLC. For patients with SCLC, the higher the expression level of BUB1B is, the worse the prognosis (Liao et al., 2019). BUB1B has also been found to regulate the development of stem cells; for example, in experiments with embryonic stem cells, Su et al. (2019) found that knocking down BUB1B can lead to DNA damage and other forms of genomic instability, activate p53 and eventually lead to embryonic stem cell differentiation and possibly cancer.
CDC25A (cell division cycle 25A) and CDCA5 (cell division cycle-associated 5) are important regulators of cell mitosis. CDC25A is a “switch” protein that controls G1/S and G2/M checkpoints and plays an important role in maintaining the stability of DNA replication and the integrity of the cell division cycle (Russell and Nurse, 1986). CDCA5 is located on human chromosome 11q13.1, and its function is to ensure accurate separation of the sister chromosome during anaphase mitosis (Schmitz et al., 2007). CDC25A is overexpressed in many tumor cells and is associated with the malignancy and prognosis of several cancers, such as human glioma (Yamashita et al., 2010), retinoblastoma (Singh et al., 2015), breast cancer (Brunetto et al., 2013), and liver cancer (Lu et al., 2016). CDCA5 is highly expressed in NSCLC (Chang et al., 2015) and liver cancer (Shen et al., 2018) and is associated with a poor prognosis. The genes in the CDC family are key in driving the cell cycle, as well as promoting the formation of centrosomes and mitotic spindles. CDCA5 is also a biomarker of malignant glioma of neural stem cell origin (Hembram et al., 2019).
DKC1 (dyskerin pseudouridine synthase 1) is highly conserved and widely expressed and may play additional roles in nucleocytoplasmic shuttling, the DNA damage response, and cell adhesion. The DKC1 gene encodes a protein responsible for the stability of the telomerase whole enzyme complex. The mutation of DKC1 has a strong influence on telomere repair and hematopoietic development. Induced pluripotent stem cells extracted from the fibroblasts of patients with X-linked keratosis disorder demonstrated that defective DKC1 count not extend telomeres (Donaires et al., 2019). A study by Nersisyan et al. (2019) found that DKC1 may also be involved in the activation of telomere maintenance mechanisms that lead to cancer. DKC1 downregulation can also inhibit the growth of glioma cells by altering the expression of cell cycle-related molecules, causing cells to arrest in G1 phase. In vitro experiments also confirmed that glioma cells with DKC1 knockout showed low activity (Miao et al., 2019). DKC1 is highly expressed in clear cell renal cell carcinoma. DKC1 knockout inhibits tumor proliferation, migration, and invasion by regulating the NF-κB/MMP-2 signaling pathway in vitro (Zhang M. et al., 2018).
RAD51 (RAD51 recombinase) is a key player in homologous recombination because it is closely related to and binds to DNA and exhibits ATPase activity following stimulation (Zhang et al., 2009). Chiu et al. (2019) found that the overexpression of RAD51 promotes the viability of esophageal cancer cells, while its inhibition weakens the viability of esophageal cancer cells through cell cycle entry, migration/invasion and epithelial-mesenchymal transformation. Another study also found a mutation in the stem cell marker RAD51 upon exon sequencing in patients with esophageal squamous cell carcinoma (ESCC) and revealed that RAD51 is related to the drug sensitivity of ESCC (Golyan et al., 2020). High RAD51 expression enhances cancer progression through the p38/Akt/Snail signaling pathway (Chiu et al., 2019). RAD51 may lead to increased drug resistance in triple-negative breast cancer patients (Zhao et al., 2019) and is also associated with the radiosensitivity of some tumors, such as nasopharyngeal cancer (Zhang Z. et al., 2018) and prostate cancer (Maranto et al., 2018).
Three other genes also merit further study. SKA3 (spindle and kinetochore-associated complex subunit 3) is an important subunit of the spindle and centromere-related protein complex and plays a regulatory role in cell proliferation and apoptosis (Zhang et al., 2017). A previous study showed that the incidence of age-related neurodegenerative diseases is consistent with a dramatic decline in the number and function of adult neural stem cells, while SKA3 is closely associated with age-related central nervous system diseases. SKA3 overexpression promotes the growth and migration of cervical cancer cells by activating the PI3K-AKT signaling pathway and promoting cell cycle progression (Hu et al., 2018). SPAG5 (sperm-associated antigen 5) binds to microtubules and centromeres of the spindle during mitosis or meiosis as a spindle-binding protein (Cheng et al., 2007). A previous study showed that SPAG5 inhibits apoptosis by activating mammalian target of rapamycin 1 (mTORC1) (Thedieck et al., 2013). SPAG5 has also been linked to the development and metastasis of LUAD (Wang T. et al., 2019), stomach cancer (Liu et al., 2019), and breast cancer (Jiang et al., 2019).
TIMELESS (timeless circadian regulator) is one of the core genes involved in the biological rhythm and is abnormally expressed in liver cancer, breast cancer and lung cancer (Truong et al., 2016; Shostak, 2017). In recent years, it has been found that the expression of TIMELESS in tumors is not completely uniform: it is weakly expressed in renal cell carcinoma, ductal cell carcinoma of the pancreas and other malignant tumors and is closely related to poor patient survival. However, it is highly expressed in colon cancer and significantly correlated with lymphatic metastasis, satellite metastasis and TNM stage (Top et al., 2016; Ozturk et al., 2017). TIMELESS plays a crucial role in the self-renewal process of breast CSCs and interacts with Sp1/c-jun to induce miR-5188 expression by promoting c-jun-mediated transcription, thus promoting breast cancer progression (Zou et al., 2020).
Our research also has the following limitations. First, we used data from a public database to confirm our findings and did not perform further experiments to confirm the expression of related genes or the molecular mechanisms and pathways involved. Second, since our study examined data from a public database and online tools, the quality of these data may not be guaranteed. Finally, the data we studied were obtained almost entirely from the United States and are not representative of patients worldwide. Therefore, further well-designed biological studies with large sample sizes are needed to confirm our findings.
CDC25A, DKC1, CDCA5, BUB1B, SKA3, TIMELESS, NCAPH, SPAG5, CENPA, and RAD51 may have a strong influence on LUSC stem cell maintenance. These hub genes may serve as control targets for LUSC CSCs, and further study of these genes may lead to new anticancer therapies.
RNA-seq and clinical information for each sample were downloaded from the TCGA website (https://cancergenome. nih.gov/).
YL conceived and designed the study, acquired and analyzed the data, and wrote the manuscript. HX and MC contributed to data analysis and manuscript drafting. XF designed the study and revised the manuscript.
The authors declare that the research was conducted in the absence of any commercial or financial relationships that could be construed as a potential conflict of interest.
We would like to thank American Journal Experts for their assistance with language editing.
The Supplementary Material for this article can be found online at: https://www.frontiersin.org/articles/10.3389/fgene.2020.00427/full#supplementary-material
FIGURE S1 | A flow chart of the research conducted.
TABLE S1 | The results of WGCNA.
DATA SHEET S1 | The code of R software.
Ahmed, F. (2019). Integrated network analysis reveals FOXM1 and MYBL2 as key regulators of cell proliferation in non-small cell lung cancer. Front. Oncol. 9:1011. doi: 10.3389/fonc.2019.01011
Baker, D. J., Dawlaty, M. M., Wijshake, T., Jeganathan, K. B., Malureanu, L., Van Ree, J. H., et al. (2013). Increased expression of BubR1 protects against aneuploidy and cancer and extends healthy lifespan. Nat. Cell Biol. 15, 96–102. doi: 10.1038/ncb2643
Barlesi, F., Mazieres, J., Merlio, J. P., Debieuvre, D., Mosser, J., Lena, H., et al. (2016). Routine molecular profiling of patients with advanced non-small-cell lung cancer: results of a 1-year nationwide programme of the French cooperative thoracic intergroup (IFCT). Lancet 387, 1415–1426. doi: 10.1016/S0140-6736(16)00004-0
Behnan, J., Grieg, Z., Joel, M., Ramsness, I., and Stangeland, B. (2016). Gene knockdown of CENPA reduces sphere forming ability and stemness of glioblastoma initiating cells. Neuroepigenetics 7, 6–18. doi: 10.1016/j.nepig.2016.08.002
Bray, F., Ferlay, J., Soerjomataram, I., Siegel, R. L., Torre, L. A., and Jemal, A. (2018). Global cancer statistics 2018: GLOBOCAN estimates of incidence and mortality worldwide for 36 cancers in 185 countries. CA Cancer J. Clin. 68, 394–424. doi: 10.3322/caac.21492
Brunetto, E., Ferrara, A. M., Rampoldi, F., Talarico, A., Cin, E. D., Grassini, G., et al. (2013). CDC25A protein stability represents a previously unrecognized target of HER2 signaling in human breast cancer: implication for a potential clinical relevance in trastuzumab treatment. Neoplasia 15, 579–590. doi: 10.1593/neo.122054
Camp, R. L., Dolled-Filhart, M., and Rimm, D. L. (2004). X-tile: a new bio-informatics tool for biomarker assessment and outcome-based cut-point optimization. Clin. Cancer Res. 10, 7252–7259. doi: 10.1158/1078-0432.ccr-04-0713
Chang, I. W., Lin, V. C., He, H. L., Hsu, C. T., Li, C. C., Wu, W. J., et al. (2015). CDCA5 overexpression is an indicator of poor prognosis in patients with urothelial carcinomas of the upper urinary tract and urinary bladder. Am. J. Transl. Res. 7, 710–722.
Chen, W., Sun, K., Zheng, R., Zeng, H., Zhang, S., Xia, C., et al. (2018). Cancer incidence and mortality in China, 2014. Chin. J. Cancer Res. 30, 1–12.
Cheng, T. S., Hsiao, Y. L., Lin, C. C., Hsu, C. M., Chang, M. S., Lee, C. I., et al. (2007). hNinein is required for targeting spindle-associated protein astrin to the centrosome during the S and G2 phases. Exp. Cell Res. 313, 1710–1721. doi: 10.1016/j.yexcr.2007.02.023
Cheng, Z., Yu, C., Cui, S., Wang, H., Jin, H., Wang, C., et al. (2019). circTP63 functions as a ceRNA to promote lung squamous cell carcinoma progression by upregulating FOXM1. Nat. Commun. 10:3200. doi: 10.1038/s41467-019-11162-4
Chiu, W. C., Fang, P. T., Lee, Y. C., Wang, Y. Y., Su, Y. H., Hu, S. C., et al. (2019). DNA repair protein Rad51 induces tumor growth and metastasis in esophageal squamous cell carcinoma via a p38/Akt-dependent pathway. Ann. Surg. Oncol. doi: 10.1245/s10434-019-08043-x [Epub ahead of print]
Cui, F., Hu, J., Xu, Z., Tan, J., and Tang, H. (2019). Overexpression of NCAPH is upregulated and predicts a poor prognosis in prostate cancer. Oncol. Lett. 17, 5768–5776. doi: 10.3892/ol.2019.10260
Donaires, F. S., Alves-Paiva, R. M., Gutierrez-Rodrigues, F., da Silva, F. B., Tellechea, M. F., Moreira, L. F., et al. (2019). Telomere dynamics and hematopoietic differentiation of human DKC1-mutant induced pluripotent stem cells. Stem Cell Res. 40:101540. doi: 10.1016/j.scr.2019.101540
Friedmann-Morvinski, D., and Verma, I. M. (2014). Dedifferentiation and reprogramming: origins of cancer stem cells. EMBO Rep. 15, 244–253. doi: 10.1002/embr.201338254
Fujita, R., Otake, K., Arimura, Y., Horikoshi, N., Miya, Y., Shiga, T., et al. (2015). Stable complex formation of CENP-B with the CENP-A nucleosome. Nucleic Acids Res. 43, 4909–4922. doi: 10.1093/nar/gkv405
Goldfeder, R. L., Wall, D. P., Khoury, M. J., Ioannidis, J. P. A., and Ashley, E. A. (2017). Human genome sequencing at the population scale: a primer on high-throughput DNA sequencing and analysis. Am. J. Epidemiol. 186, 1000–1009. doi: 10.1093/aje/kww224
Golyan, F. F., Moghaddassian, M., Forghanifard, M. M., Talebi, S., Farshchian, M., Mahmoudian, R. A., et al. (2020). Whole exome sequencing reveals a novel damaging mutation in human fibroblast activation protein in a family with esophageal squamous cell carcinoma. J Gastrointest Cancer 51, 179–188. doi: 10.1007/s12029-019-00224-x
Hembram, K. C., Chatterjee, S., Sethy, C., Nayak, D., Pradhan, R., Molla, S., et al. (2019). Comparative and mechanistic study on the anticancer activity of quinacrine-based silver and gold hybrid nanoparticles in head and neck cancer. Mol. Pharm. 16, 3011–3023. doi: 10.1021/acs.molpharmaceut.9b00242
Herreros-Pomares, A., De-Maya-Girones, J. D., Calabuig-Fariñas, S., Lucas, R., Martínez, A., Pardo-Sánchez, J. M., et al. (2019). Lung tumorspheres reveal cancer stem cell-like properties and a score with prognostic impact in resected non-small-cell lung cancer. Cell Death Dis. 10:660. doi: 10.1038/s41419-019-1898-1
Hu, R., Wang, M. Q., Niu, W. B., Wang, Y. J., Liu, Y. Y., Liu, L. Y., et al. (2018). SKA3 promotes cell proliferation and migration in cervical cancer by activating the PI3K/Akt signaling pathway. Cancer Cell Int. 18, 183. doi: 10.1186/s12935-018-0670-4
Huang, T. H., Wu, A. T. H., Cheng, T. S., Lin, K. T., Lai, C. J., Hsieh, H. W., et al. (2019). In silico identification of thiostrepton as an inhibitor of cancer stem cell growth and an enhancer for chemotherapy in non-small-cell lung cancer. J. Cell. Mol. Med. 23, 8184–8195. doi: 10.1111/jcmm.14689
Jiang, J., Wang, J., He, X., Ma, W., Sun, L., Zhou, Q., et al. (2019). High expression of SPAG5 sustains the malignant growth and invasion of breast cancer cells through the activation of Wnt/beta-catenin signalling. Clin. Exp. Pharmacol. Physiol. 46, 597–606. doi: 10.1111/1440-1681.13082
Kamarudin, A. N., Cox, T., and Kolamunnage-Dona, R. (2017). Time-dependent ROC curve analysis in medical research: current methods and applications. BMC Med. Res. Methodol. 17:53. doi: 10.1186/s12874-017-0332-6
Langfelder, P., and Horvath, S. (2008). WGCNA: an R package for weighted correlation network analysis. BMC Bioinform. 9:559. doi: 10.1186/1471-2105-9-559
Leon, G., MacDonagh, L., Finn, S. P., Cuffe, S., and Barr, M. P. (2016). Cancer stem cells in drug resistant lung cancer: targeting cell surface markers and signaling pathways. Pharmacol. Ther. 158, 71–90. doi: 10.1016/j.pharmthera.2015.12.001
Liao, Y., Yin, G., Wang, X., Zhong, P., Fan, X., and Huang, C. (2019). Identification of candidate genes associated with the pathogenesis of small cell lung cancer via integrated bioinformatics analysis. Oncol. Lett. 18, 3723–3733. doi: 10.3892/ol.2019.10685
Liu, G., Liu, S., Cao, G., Luo, W., Li, P., Wang, S., et al. (2019). SPAG5 contributes to the progression of gastric cancer by upregulation of survivin depend on activating the wnt/beta-catenin pathway. Exp. Cell Res. 379, 83–91. doi: 10.1016/j.yexcr.2019.03.024
Liu, W. T., Wang, Y., Zhang, J., Ye, F., Huang, X. H., Li, B., et al. (2018). A novel strategy of integrated microarray analysis identifies CENPA, CDK1 and CDC20 as a cluster of diagnostic biomarkers in lung adenocarcinoma. Cancer Lett. 425, 43–53. doi: 10.1016/j.canlet.2018.03.043
Lu, X., Sun, W., Tang, Y., Zhu, L., Li, Y., Ou, C., et al. (2016). Identification of key genes in hepatocellular carcinoma and validation of the candidate gene, cdc25a, using gene set enrichment analysis, meta-analysis and cross-species comparison. Mol. Med. Rep. 13, 1172–1178. doi: 10.3892/mmr.2015.4646
Ma, Q., Xu, Y., Liao, H., Cai, Y., Xu, L., Xiao, D., et al. (2019). Identification and validation of key genes associated with non-small-cell lung cancer. J. Cell. Physiol. 234, 22742–22752. doi: 10.1002/jcp.28839
Malta, T. M., Sokolov, A., Gentles, A. J., Burzykowski, T., Poisson, L., Weinstein, J. N., et al. (2018). Machine learning identifies stemness features associated with oncogenic dedifferentiation. Cell 173:338-354.e315. doi: 10.1016/j.cell.2018.03.034
Maranto, C., Udhane, V., Hoang, D. T., Gu, L., Alexeev, V., Malas, K., et al. (2018). STAT5A/B blockade sensitizes prostate cancer to radiation through inhibition of RAD51 and DNA repair. Clin. Cancer Res. 24, 1917–1931. doi: 10.1158/1078-0432.CCR-17-2768
Martin, C. A., Murray, J. E., Carroll, P., Leitch, A., Mackenzie, K. J., Halachev, M., et al. (2016). Mutations in genes encoding condensin complex proteins cause microcephaly through decatenation failure at mitosis. Genes Dev. 30, 2158–2172. doi: 10.1101/gad.286351.116
Miao, F. A., Chu, K., Chen, H. R., Zhang, M., Shi, P. C., Bai, J., et al. (2019). Increased DKC1 expression in glioma and its significance in tumor cell proliferation, migration and invasion. Invest. New Drugs 37, 1177–1186. doi: 10.1007/s10637-019-00748-w
Nersisyan, L., Hopp, L., Loeffler-Wirth, H., Galle, J., Loeffler, M., Arakelyan, A., et al. (2019). Telomere length maintenance and its transcriptional regulation in lynch syndrome and sporadic colorectal carcinoma. Front. Oncol. 9:1172. doi: 10.3389/fonc.2019.01172
Neuwald, A. F., and Hirano, T. (2000). HEAT repeats associated with condensins, cohesins, and other complexes involved in chromosome-related functions. Genome Res. 10, 1445–1452. doi: 10.1101/gr.147400
Ozturk, N., Ozturk, D., Kavakli, I. H., and Okyar, A. (2017). Molecular aspects of circadian pharmacology and relevance for cancer chronotherapy. Int. J. Mol. Sci. 18:E2168. doi: 10.3390/ijms18102168
Ritchie, M. E., Phipson, B., Wu, D., Hu, Y., Law, C. W., Shi, W., et al. (2015). limma powers differential expression analyses for RNA-sequencing and microarray studies. Nucleic Acids Res. 43:e47. doi: 10.1093/nar/gkv007
Rošic, S., and Erhardt, S. (2016). No longer a nuisance: long non-coding RNAs join CENP-A in epigenetic centromere regulation. Cell Mol. Life. Sci. 73, 1387–1398. doi: 10.1007/s00018-015-2124-7
Russell, P., and Nurse, P. (1986). cdc25+ functions as an inducer in the mitotic control of fission yeast. Cell 45, 145–153. doi: 10.1016/0092-8674(86)90546-5
Schmitz, J., Watrin, E., Lenart, P., Mechtler, K., and Peters, J. M. (2007). Sororin is required for stable binding of cohesin to chromatin and for sister chromatid cohesion in interphase. Curr. Biol. 17, 630–636. doi: 10.1016/j.cub.2007.02.029
Shen, Z., Yu, X., Zheng, Y., Lai, X., Li, J., Hong, Y., et al. (2018). CDCA5 regulates proliferation in hepatocellular carcinoma and has potential as a negative prognostic marker. OncoTargets Ther. 11, 891–901. doi: 10.2147/OTT.S154754
Shibue, T., and Weinberg, R. A. (2017). EMT, CSCs, and drug resistance: the mechanistic link and clinical implications. Nat. Rev. Clin. Oncol. 14, 611–629. doi: 10.1038/nrclinonc.2017.44
Shostak, A. (2017). Circadian clock, cell division, and cancer: from molecules to organism. Int. J. Mol. Sci. 18:E873. doi: 10.3390/ijms18040873
Singh, L., Pushker, N., Sen, S., Singh, M. K., Bakhshi, S., Chawla, B., et al. (2015). Expression of CDC25A and CDC25B phosphatase proteins in human retinoblastoma and its correlation with clinicopathological parameters. Br. J. Ophthalmol. 99, 457–463. doi: 10.1136/bjophthalmol-2014-305830
Sokolov, A., Paull, E. O., and Stuart, J. M. (2016). One-class detection of cell states in tumor subtypes. Pac. Symp. Biocomput. 21, 405–416.
Su, J., Zhu, D., Huo, Z., Gingold, J. A., Ang, Y. S., Tu, J., et al. (2019). Genomic integrity safeguards self-renewal in embryonic stem cells. Cell Rep. 28:1400-1409.e1404. doi: 10.1016/j.celrep.2019.07.011
Sun, C., Huang, S., Wang, H., Xie, R., Zhang, L., Zhou, Q., et al. (2019). Non-SMC condensin I complex subunit H enhances proliferation, migration, and invasion of hepatocellular carcinoma. Mol. Carcinog. 58, 2266–2275. doi: 10.1002/mc.23114
Tahmasebi, S., Amiri, M., and Sonenberg, N. (2019). Translational control in stem cells. Front. Genet. 9:709. doi: 10.3389/fgene.2018.00709
Tang, Z., Li, C., Kang, B., Gao, G., Li, C., and Zhang, Z. (2017). GEPIA: a web server for cancer and normal gene expression profiling and interactive analyses. Nucleic Acids Res. 45, W98–W102. doi: 10.1093/nar/gkx247
Thedieck, K., Holzwarth, B., Prentzell, M. T., Boehlke, C., Klasener, K., Ruf, S., et al. (2013). Inhibition of mTORC1 by astrin and stress granules prevents apoptosis in cancer cells. Cell 154, 859–874. doi: 10.1016/j.cell.2013.07.031
Top, D., Harms, E., Syed, S., Adams, E. L., and Saez, L. (2016). GSK-3 and CK2 kinases converge on timeless to regulate the master clock. Cell Rep. 16, 357–367. doi: 10.1016/j.celrep.2016.06.005
Truong, K. K., Lam, M. T., Grandner, M. A., Sassoon, C. S., and Malhotra, A. (2016). Timing matters: circadian rhythm in sepsis, obstructive lung disease, obstructive sleep apnea, and cancer. Ann. Am. Thorac. Soc. 13, 1144–1154. doi: 10.1513/AnnalsATS.201602-125FR
Wang, T., Li, K., Song, H., Xu, D., Liao, Y., Jing, B., et al. (2019). p53 suppression is essential for oncogenic SPAG5 upregulation in lung adenocarcinoma. Biochem. Biophys. Res. Commun. 513, 319–325. doi: 10.1016/j.bbrc.2019.03.198
Wang, X. C., Yue, X., Zhang, R. X., Liu, T. Y., Pan, Z. Z., Yang, M. J., et al. (2019). Genome-wide RNAi screening identifies RFC4 as a factor that mediates radioresistance in colorectal cancer by facilitating nonhomologous end joining repair. Clin. Cancer Res. 25, 4567–4579. doi: 10.1158/1078-0432.CCR-18-3735
Yamaoka, K., Nakagawa, T., and Uno, T. (1978). Application of akaike’s information criterion (AIC) in the evaluation of linear pharmacokinetic equations. J. Pharmacokinet. Biopharm. 6, 165–175. doi: 10.1007/bf01117450
Yamashita, Y., Kasugai, I., Sato, M., Tanuma, N., Sato, I., Nomura, M., et al. (2010). CDC25A mRNA levels significantly correlate with Ki-67 expression in human glioma samples. J. Neurooncol. 100, 43–49. doi: 10.1007/s11060-010-0147-3
Yin, L., Jiang, L. P., Shen, Q. S., Xiong, Q. X., Zhuo, X., Zhang, L. L., et al. (2017). NCAPH plays important roles in human colon cancer. Cell Death Dis. 8:e2680. doi: 10.1038/cddis.2017.88
Yu, G., Wang, L. G., Han, Y., and He, Q. Y. (2012). clusterProfiler: an R package for comparing biological themes among gene clusters. OMICS 16, 284–287. doi: 10.1089/omi.2011.0118
Zhang, M., Pan, Y., Jiang, R., Hou, P., Shan, H., Chen, F., et al. (2018). DKC1 serves as a potential prognostic biomarker for human clear cell renal cell carcinoma and promotes its proliferation, migration and invasion via the NFkappaB pathway. Oncol. Rep. 40, 968–978. doi: 10.3892/or.2018.6484
Zhang, Z., Huo, H., Liao, K., Wang, Z., Gong, Z., Li, Y., et al. (2018). RPA1 downregulation enhances nasopharyngeal cancer radiosensitivity via blocking RAD51 to the DNA damage site. Exp. Cell Res. 371, 330–341. doi: 10.1016/j.yexcr.2018.08.025
Zhang, Q., Sivakumar, S., Chen, Y., Gao, H., Yang, L., Yuan, Z., et al. (2017). Ska3 phosphorylated by Cdk1 binds Ndc80 and recruits Ska to kinetochores to promote mitotic progression. Curr. Biol. 27:1477-1484.e1474. doi: 10.1016/j.cub.2017.03.060
Zhang, X. P., Galkin, V. E., Yu, X., Egelman, E. H., and Heyer, W. D. (2009). Loop 2 in saccharomyces cerevisiae Rad51 protein regulates filament formation and ATPase activity. Nucleic Acids Res. 37, 158–171. doi: 10.1093/nar/gkn914
Zhao, L., Si, C. S., Yu, Y., Lu, J. W., and Zhuang, Y. (2019). Depletion of DNA damage binding protein 2 sensitizes triple-negative breast cancer cells to poly ADP-ribose polymerase inhibition by destabilizing Rad51. Cancer Sci. 110, 3543–3552. doi: 10.1111/cas.14201
Keywords: lung squamous cell carcinoma, cancer cell stemness, prognosis, WGCNA, TCGA
Citation: Liao Y, Xiao H, Cheng M and Fan X (2020) Bioinformatics Analysis Reveals Biomarkers With Cancer Stem Cell Characteristics in Lung Squamous Cell Carcinoma. Front. Genet. 11:427. doi: 10.3389/fgene.2020.00427
Received: 17 January 2020; Accepted: 06 April 2020;
Published: 13 May 2020.
Edited by:
Meng Zhou, Wenzhou Medical University, ChinaReviewed by:
Firoz Ahmed, Jeddah University, Saudi ArabiaCopyright © 2020 Liao, Xiao, Cheng and Fan. This is an open-access article distributed under the terms of the Creative Commons Attribution License (CC BY). The use, distribution or reproduction in other forums is permitted, provided the original author(s) and the copyright owner(s) are credited and that the original publication in this journal is cited, in accordance with accepted academic practice. No use, distribution or reproduction is permitted which does not comply with these terms.
*Correspondence: Xianming Fan, ZnhtMTI5MTIwQHNpbmEuY29t
†These authors have contributed equally to this work
Disclaimer: All claims expressed in this article are solely those of the authors and do not necessarily represent those of their affiliated organizations, or those of the publisher, the editors and the reviewers. Any product that may be evaluated in this article or claim that may be made by its manufacturer is not guaranteed or endorsed by the publisher.
Research integrity at Frontiers
Learn more about the work of our research integrity team to safeguard the quality of each article we publish.