
95% of researchers rate our articles as excellent or good
Learn more about the work of our research integrity team to safeguard the quality of each article we publish.
Find out more
ORIGINAL RESEARCH article
Front. Genet. , 28 April 2020
Sec. RNA
Volume 11 - 2020 | https://doi.org/10.3389/fgene.2020.00413
Studies have shown that long non-coding RNA (lncRNA) may act as the carcinogenic factor or tumor suppressor of laryngeal squamous cell carcinoma (LSCC). This study aims to identify the prognostic value and potential target protein-coding genes (PCGs) of lncRNAs in LSCC. The LSCC datasets were collected from The Cancer Genome Atlas (TCGA). Statistical and bioinformatic methods were used to establish and evaluate the prognostic model, identify the correlation between lncRNAs and clinical characteristics, and screen for PCGs co-expressed with lncRNAs. Weighted gene co-expression network analysis (WGCNA) identified PCG modules associated with clinical characteristics. The expression of lncRNAs and PCGs was analyzed using our LSCC patients by RT-qPCR. LINC02154, LINC00528, SPRY4-AS1, TTTY14, LNCSRLR, and KLHL7-DT were selected to establish the prognostic model. The overall survival (OS) of low-risk patients forecasted by the model was significantly better than high-risk patients. Receiver operating characteristic (ROC) curve and concordance index (C-index) validated the accuracy of the prognostic model. Chi-square test showed that six lncRNAs were associated with one of the clinical characteristics, i.e., gender, clinical stage, T and N stage, respectively. WGCNA identified PCG modules associated with gender, clinical stage, T and N stage. We took the intersection of the PCG modules of WGCNA, the differentially expressed PCGs between LSCC and normal samples, and the PCGs co-expressed with six lncRNAs. The intersection PCGs survival analysis showed that four PCGs, i.e., STC2, TSPAN9, SMS, and TCEA3 affected the OS of LSCC. More importantly, the differential expression of six lncRNAs and four PCGs between LSCC and normal samples was verified by our LSCC patients. In conclusion, we successfully established a prognostic model based on six-lncRNA RiskScore and initially screened the potential target PCGs of six lncRNAs for further basic and clinical research.
Laryngeal squamous cell carcinoma (LSCC) is one of the most common head and neck squamous cell carcinomas (Solomon et al., 2018), originating from the larynx epithelium, with high metastatic rate and poor prognosis (Bingol et al., 2016). Most LSCC patients are locally advanced when they are first diagnosed, with a 5-year survival rate of approximately 50% (Chan et al., 2018). Although surgery, radiotherapy, and chemotherapy have improved significantly over the past 20 years, the 5-year overall survival (OS) rate of LSCC has not improved significantly, especially for advanced patients (Gyawali et al., 2016). Therefore, there is an urgent need to establish new biomarkers or models for LSCC survival risk prediction to provide patients with more effective and personalized treatments.
Long non-coding RNA (lncRNA) has more than 200 nucleotides and no protein coding ability (Jiang et al., 2016). There is evidence that lncRNAs play a key role in a range of biological processes through transcriptional, post-transcriptional and epigenetic mechanisms (Quan et al., 2015). Studies have shown that lncRNA regulates mRNA through multiple patterns. First, lncRNA can directly bind to mRNA leading to the recruitment of the RNA-binding proteins (RBPs) that promote decay, the RBPs that suppress translation, or factors that initiate translation. LncRNA may also prevent miRNA from binding to target mRNA through the lncRNA-mRNA complex. Second, lncRNA can be used as miRNA sponge. By sequestering miRNAs, they reduce the availability of AGO2/RISC and relieve numerous instances of miRNA-mediated translational repression. Third, lncRNA can also serve as ‘decoys’ for RBPs, dissociating RBPs from target mRNAs, and thereby influencing the abundance and translation of such mRNAs (Noh et al., 2018). Abnormally expressed lncRNAs have been observed in various cancers including lung cancer (Seiler et al., 2017), gastric cancer (Zhuo et al., 2019), liver cancer (Noh and Gorospe, 2018), breast cancer (Wang et al., 2017), and LSCC (Wang et al., 2016; Xie et al., 2018) and so on. It has been reported that abnormally expressed lncRNAs are involved in the pathogenesis of cancer and act as a carcinogenic factor or tumor suppressor regulator in the occurrence and progression of cancer (Zhang et al., 2013; Lin and Yang, 2018). Studies have shown that lncRNAs are associated with OS in patients with LSCC (Shen et al., 2014), but the prognostic value of a single candidate lncRNA biomarker is limited. In view of this, combining a series of lncRNAs is more significant in predicting the prognosis of LSCC.
Weighted gene co-expression network analysis (WGCNA) is widely used to analyze large-scale data sets and to find modules for highly related genes (Tang et al., 2018), and it is successfully used to explore the association between gene expression information and clinical characteristics, and to identify candidate biomarkers (Langfelder and Horvath, 2008).
In this study, we identified for the first time the six-lncRNA signature as predictors of LSCC patient survival risk, using a cohort of LSCC cases from The Cancer Genome Atlas (TCGA) database. Meantime, we screened the potential target protein-coding genes (PCGs) of six lncRNAs. More importantly, we verified that six lncRNAs and four PCGs were differentially expressed in tumor tissues and adjacent normal tissues using our own 25 LSCC patients and The Human Protein Atlas database. We successfully established a prognostic model based on six-lncRNA RiskScore and initially screened the potential target PCGs of six lncRNAs for further basic and clinical research.
The LSCC datasets were obtained from TCGA1. The database contained a total of 123 laryngeal samples, including 12 normal samples and 111 LSCC samples with clinical and gene expression data, from which the lncRNAs and PCGs were isolated. The clinical characteristics of 111 LSCC samples were shown in Supplementary Table 1.
We also collected 25 cases of LSCC patients’ tumor tissues and adjacent normal tissues from the Ruijin Hospital, School of Medicine, Shanghai Jiao Tong University. Our LSCC patients (or their parents or guardians) have signed the written informed consent form. The use of human tissue samples has been approved by the Ruijin Hospital Ethics Committee.
All analyses were performed using R software2 (version 3.5.3). The edgeR package was used to identify differentially expressed lncRNAs and PCGs between LSCC and normal samples. | log 2 fold change (FC) | > 1 and false discovery rate (FDR) < 0.05 were set as a threshold.
RNA-seq expression values were converted by log 2 to normalize the data. The association between lncRNA expression and patient’s OS was determined by univariate Cox analysis using the Survival R package. We selected lncRNAs with P < 0.005 in univariate Cox analysis for multivariate Cox analysis to establish a model for predicting LSCC patient’s OS. Multivariate Cox analysis was also used to test whether RiskScore was independent of clinical parameters such as age, gender, pathological grade, clinical stage, and history of exposure to tobacco and alcohol.
The RiskScore of each LSCC patient was calculated and the patient was divided into low-risk and high-risk groups using the median of RiskScore as a threshold. Kaplan–Meier survival curve was drawn for the low-risk and high-risk LSCC, and a log-rank test was used to determine the difference in OS between the two groups. The sensitivity and specificity of the six-lncRNA prognostic model were assessed by calculating the area under curve (AUC) of receiver operating characteristic (ROC) curve using the survivalROC R package, and the concordance index (C-index) using the survcomp R package.
The composite nomogram for predicting OS of LSCC was established using the rms R package based on the independent risk factors from multivariate Cox analysis. The C-index was calculated using the survcomp R package to evaluate the discriminative ability of the nomogram. A calibration curve was drawn using the rms R package to compare the predicted and actual OS.
The gene expression data was obtained from TCGA. A total of 16899 PCGs were identified for each sample. The variance analysis was performed, and it was ranked from large to small. The top 25% of PCGs (4225 PCGs) with larger variance were selected for WGCNA analysis.
The expression profile of 4225 PCGs was used to construct a gene co-expression network using the WGCNA package in R software (Langfelder and Horvath, 2008). An adjacency matrix was constructed using the WGCNA function adjacency by calculating the Pearson correlation between all pairs of genes in all selected samples. In this study, the power of β = 5 (scale-free R2 = 0.98) was used as a soft threshold parameter to ensure a scale-free network. To further identify functional modules in the co-expression network with 4225 PCGs, the adjacency matrix was used to calculate the topological overlap measurement (TOM) representing the overlap in the shared neighbors.
The module eigengenes (MEs) were considered to be a representation of the gene expression profile in the module. Correlation and P-values between the module and clinical characteristics were evaluated by calculating the MEs. In the correlation between the module and clinical characteristics, red represented positive correlation with clinical characteristics, and green represented negative correlation with clinical characteristics (Gong et al., 2019).
We tested the correlation between the expression levels of six lncRNAs and each PCGs using a two-sided Pearson correlation analysis. Identification of PCGs associated with six lncRNAs according to P < 0.05. Gene Ontology (GO) and Kyoto Encyclopedia of Genes and Genomes (KEGG) enrichment analysis were performed on six lncRNAs related PCGs according to P < 0.05 using Database for Annotation, Visualization and Integrated Discovery (DAVID, version 6.83) (Huang da et al., 2009). GO analysis includes three categories: biological processes (BP), cellular components (CC), and molecular functions (MF).
Venn diagrams were used to take the intersection of clinical significant modules of WGCNA, differentially expressed PCGs between LSCC and normal samples, and PCGs co-expressed with six lncRNAs. The intersection PCGs were divided into low expression and high expression using the median as the cut-off value. Kaplan–Meier survival curve (log-rank method) was used to evaluate the effects of PCGs on OS in LSCC patients. The Human Protein Atlas4 was used to validate the immunohistochemistry (IHC) of PCGs that affected OS in LSCC patients. The links to IHC images were shown in Supplementary Table 2.
Total RNA was isolated from LSCC patients’ tumor tissues and adjacent normal tissues using TRIzol reagent (Invitrogen, Carlsbad, CA, United States). The cDNA was synthesized using HiScript III RT SuperMix for qPCR Kit (Vazyme Biotech, Nanjing, China). The cDNA was subsequently analyzed using ChamQ Universal SYBR qPCR Master Mix (Vazyme Biotech, Nanjing, China) and the ABI7500 system (Applied Biosystems, Foster City, CA, United States). The amplification program was as follows: initial denaturation step at 95°C for 30 s, followed by 40 cycles at 95°C for 5 s, and 60°C for 30 s. The expression of LINC02154, LINC00528, SPRY4-AS1, TTTY14, LNCSRLR, KLHL7-DT, STC2, TSPAN9, SMS, and TCEA3 were calculated relative to the internal reference gene, GAPDH, using the 2–ΔΔCt method (Livak and Schmittgen, 2001). Primer sequences were shown in Supplementary Table 3.
Chi-square test was performed with SPSS (version 24.0) to identify the correlation between six lncRNAs and clinical characteristics. The results of RT-qPCR were analyzed by Graphpad Prism software (version 7.0a), and differences between groups were assessed using paired t-test. P < 0.05 was considered statistically significant.
According to | log 2 FC | > 1 and FDR < 0.05, a total of 612 differentially expressed lncRNAs (Supplementary Table 4) and 4435 differentially expressed PCGs (Supplementary Table 5) were identified (LSCC compared with normal samples). Among them, 482 lncRNAs and 2516 PCGs were upregulated and 130 lncRNAs and 1919 PCGs were downregulated.
To identify lncRNA associated with prognosis, we first used a univariate Cox regression analysis to assess the association between the expression levels of each differentially expressed lncRNA and patient OS, and found that nine lncRNAs were significantly associated with OS (P < 0.005). Then stepwise multivariate Cox regression analysis was performed, and finally, six lncRNAs were emerged, i.e., LINC02154, LINC00528, SPRY4-AS1, TTTY14, LNCSRLR, and KLHL7-DT (Table 1). The predictive model was defined as a linear combination of expression levels of six lncRNAs whose relative coefficient weights in the multivariate Cox regression are as follows: RiskScore = (0.1779 × expression value of LINC02154) − (0.2598 × expression value of LINC00528) + (0.2075 × expression value of SPRY4-AS1) – (0.2056 × expression value of TTTY14) + (0.3098 × expression value of LNCSRLR) + (0.2924 × expression value of KLHL7-DT). Among them, LINC02154, SPRY4-AS1, LNCSRLR, and KLHL7-DT showed high-risk characteristics, and high expression means that the OS of patients was shortened. LINC00528 and TTTY14 showed low-risk characteristics, suggesting that these lncRNAs could be considered protective lncRNAs, as patients with high expression levels of these lncRNAs had longer OS than those with low expression levels.

Table 1. Multivariate Cox regression analysis to establish a prognostic model based on 6-lncRNA RiskScore.
For each of the 111 LSCC patients in our study, we were able to calculate the RiskScore based on six-lncRNA expression and classify patients into low-risk (n = 56) and high-risk (n = 55) groups according to the median RiskScore of 0.964 as the cut-off value (Figure 1). Kaplan–Meier OS curve in low-risk and high-risk groups was significantly different (Figure 2A, P = 4.087e-08). In high-risk LSCC patients, the 3-year OS was 31.42% (95% CI: 20.38–48.40%), and the 5-year OS was 28.56% (95% CI: 17.83–45.80%). In low-risk LSCC patients, the 3-year OS was 88.40% (95% CI: 79.40–98.60%), and the 5-year OS was 79.00% (95% CI: 65.20–95.70%). The 3- and 5-year OS of low-risk LSCC were significantly higher than those of high-risk LSCC.
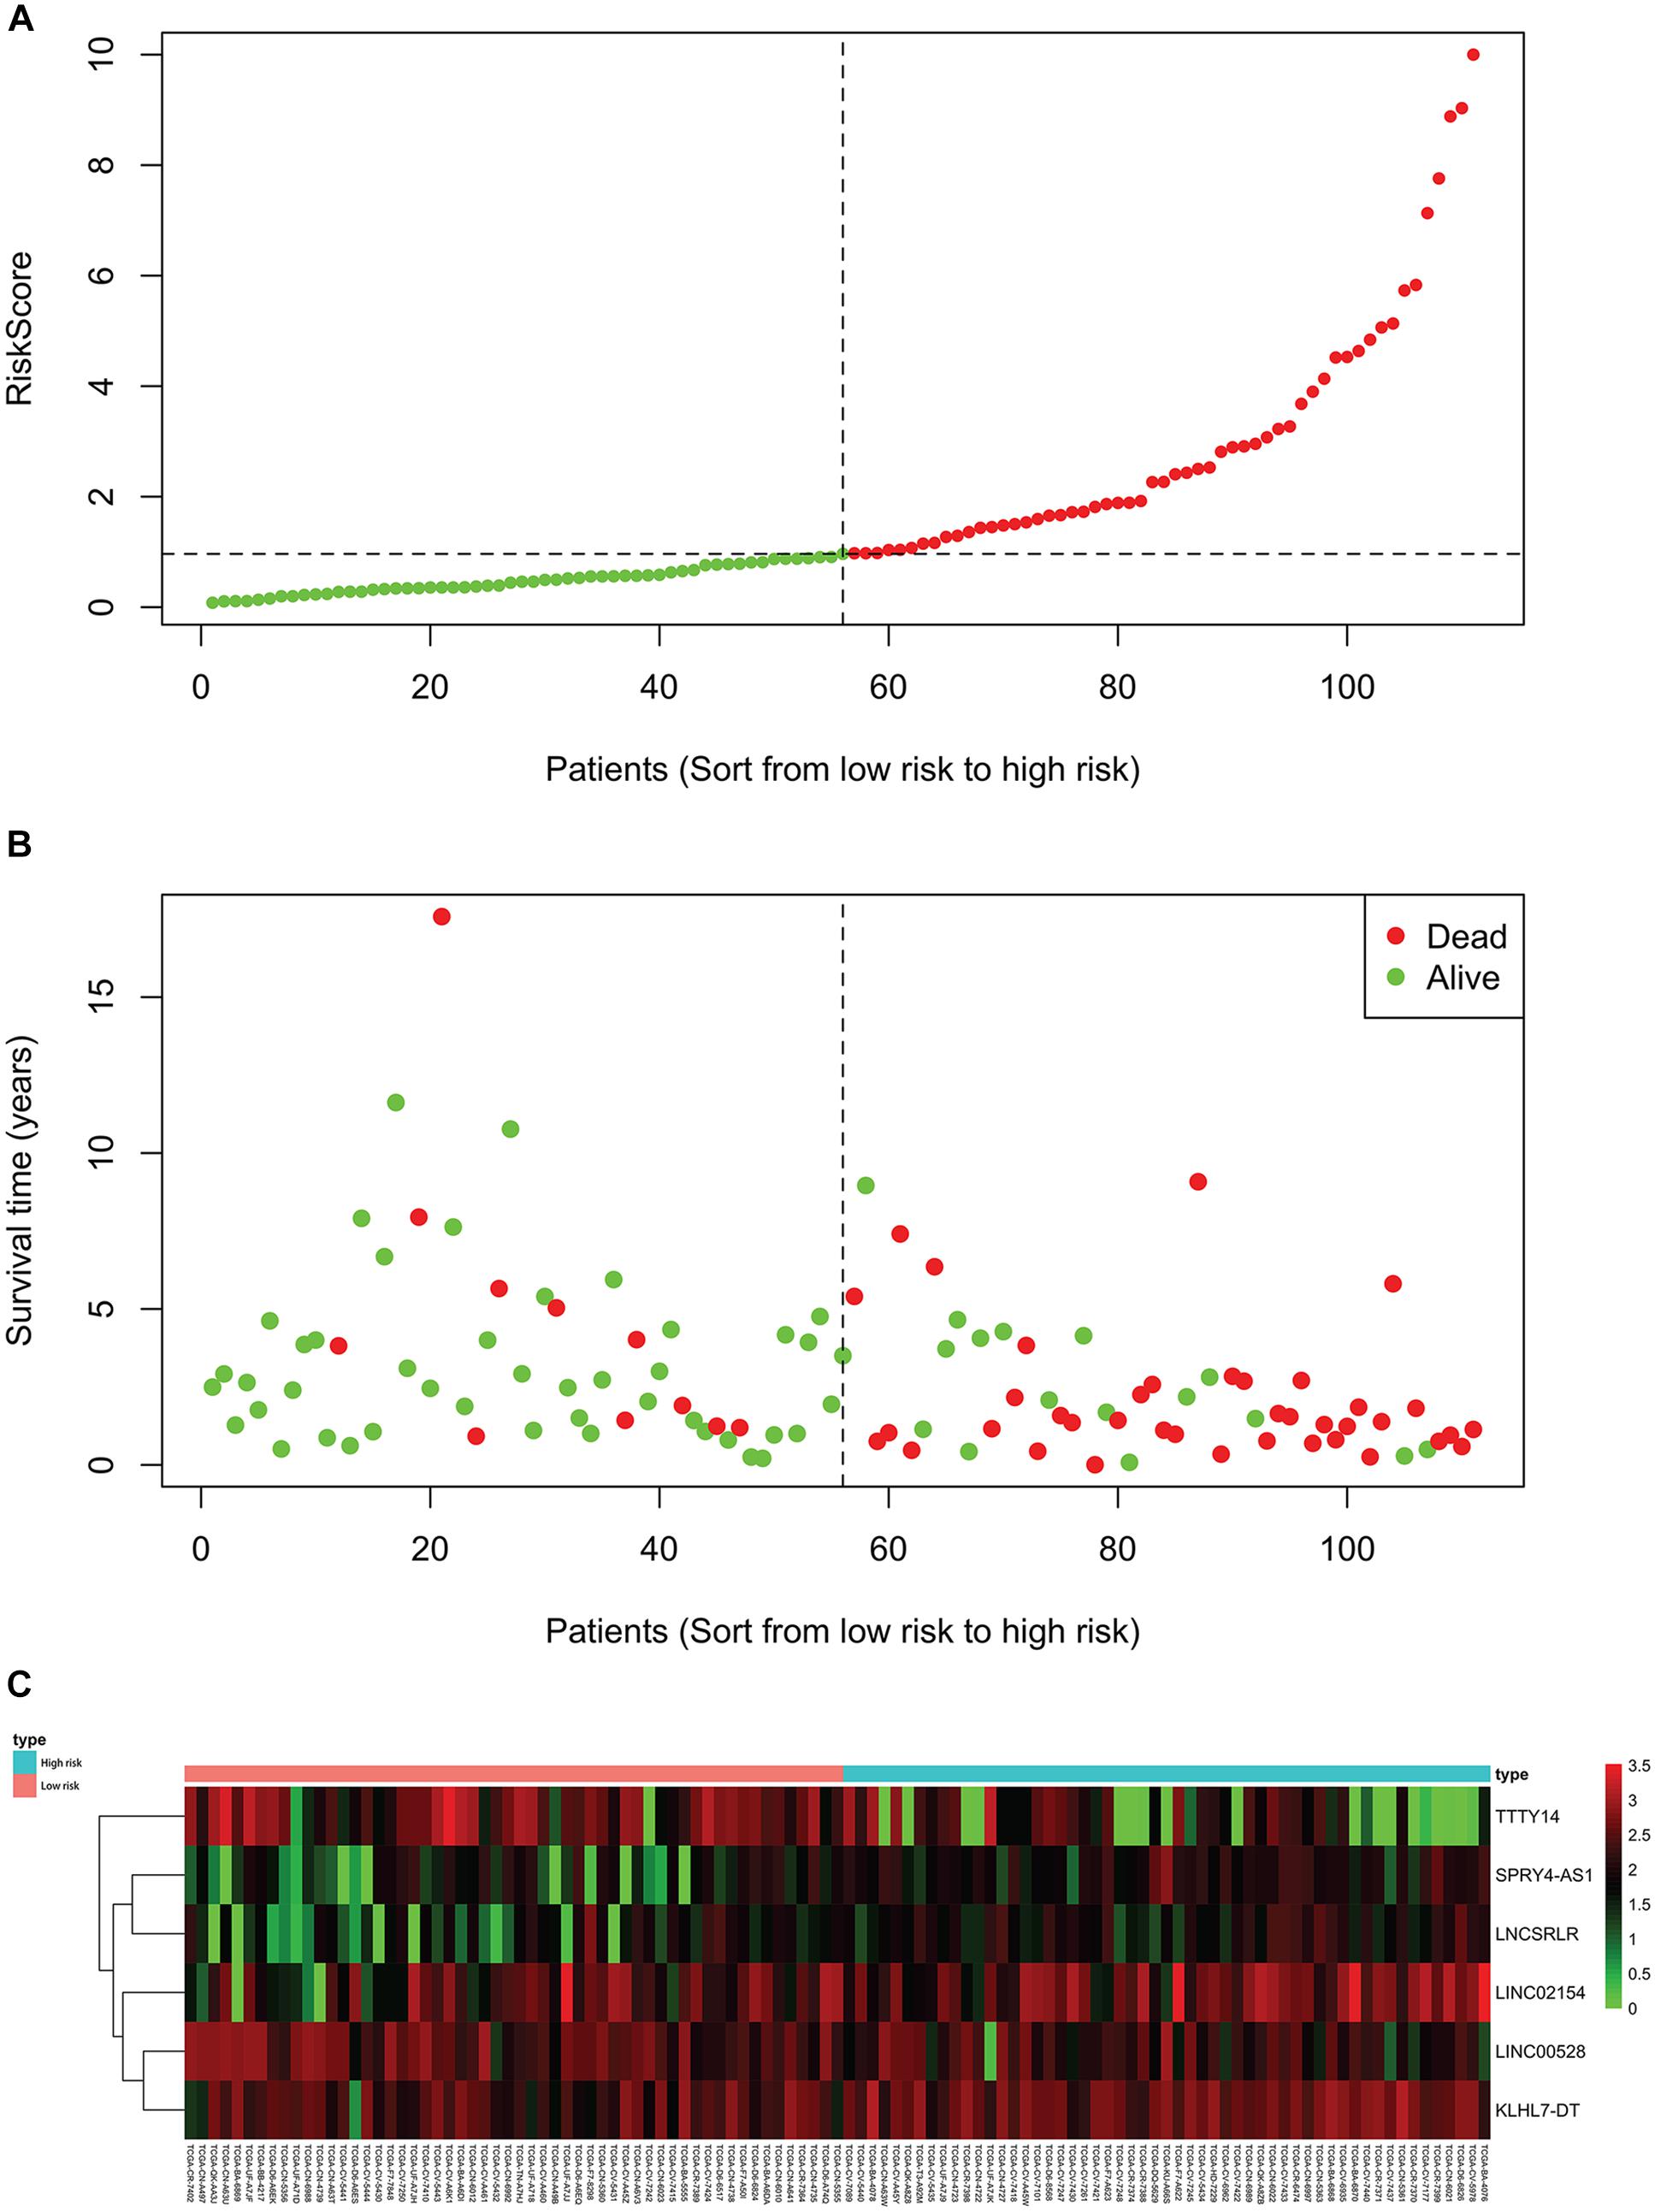
Figure 1. Each patient’s RiskScore, survival time and status, and the expression of six lncRNAs. The horizontal axis is based on the six-lncRNA RiskScore of patient from low to high. (A) RiskScore of each LSCC patient, green for low risk and red for high risk. (B) Survival time and status of each LSCC patient, low-risk patients to the left of the dotted line and high-risk patients to the right. (C) The heatmap shows the expression of six lncRNAs in each LSCC patient. The green to red indicates the expression of lncRNAs from low to high.
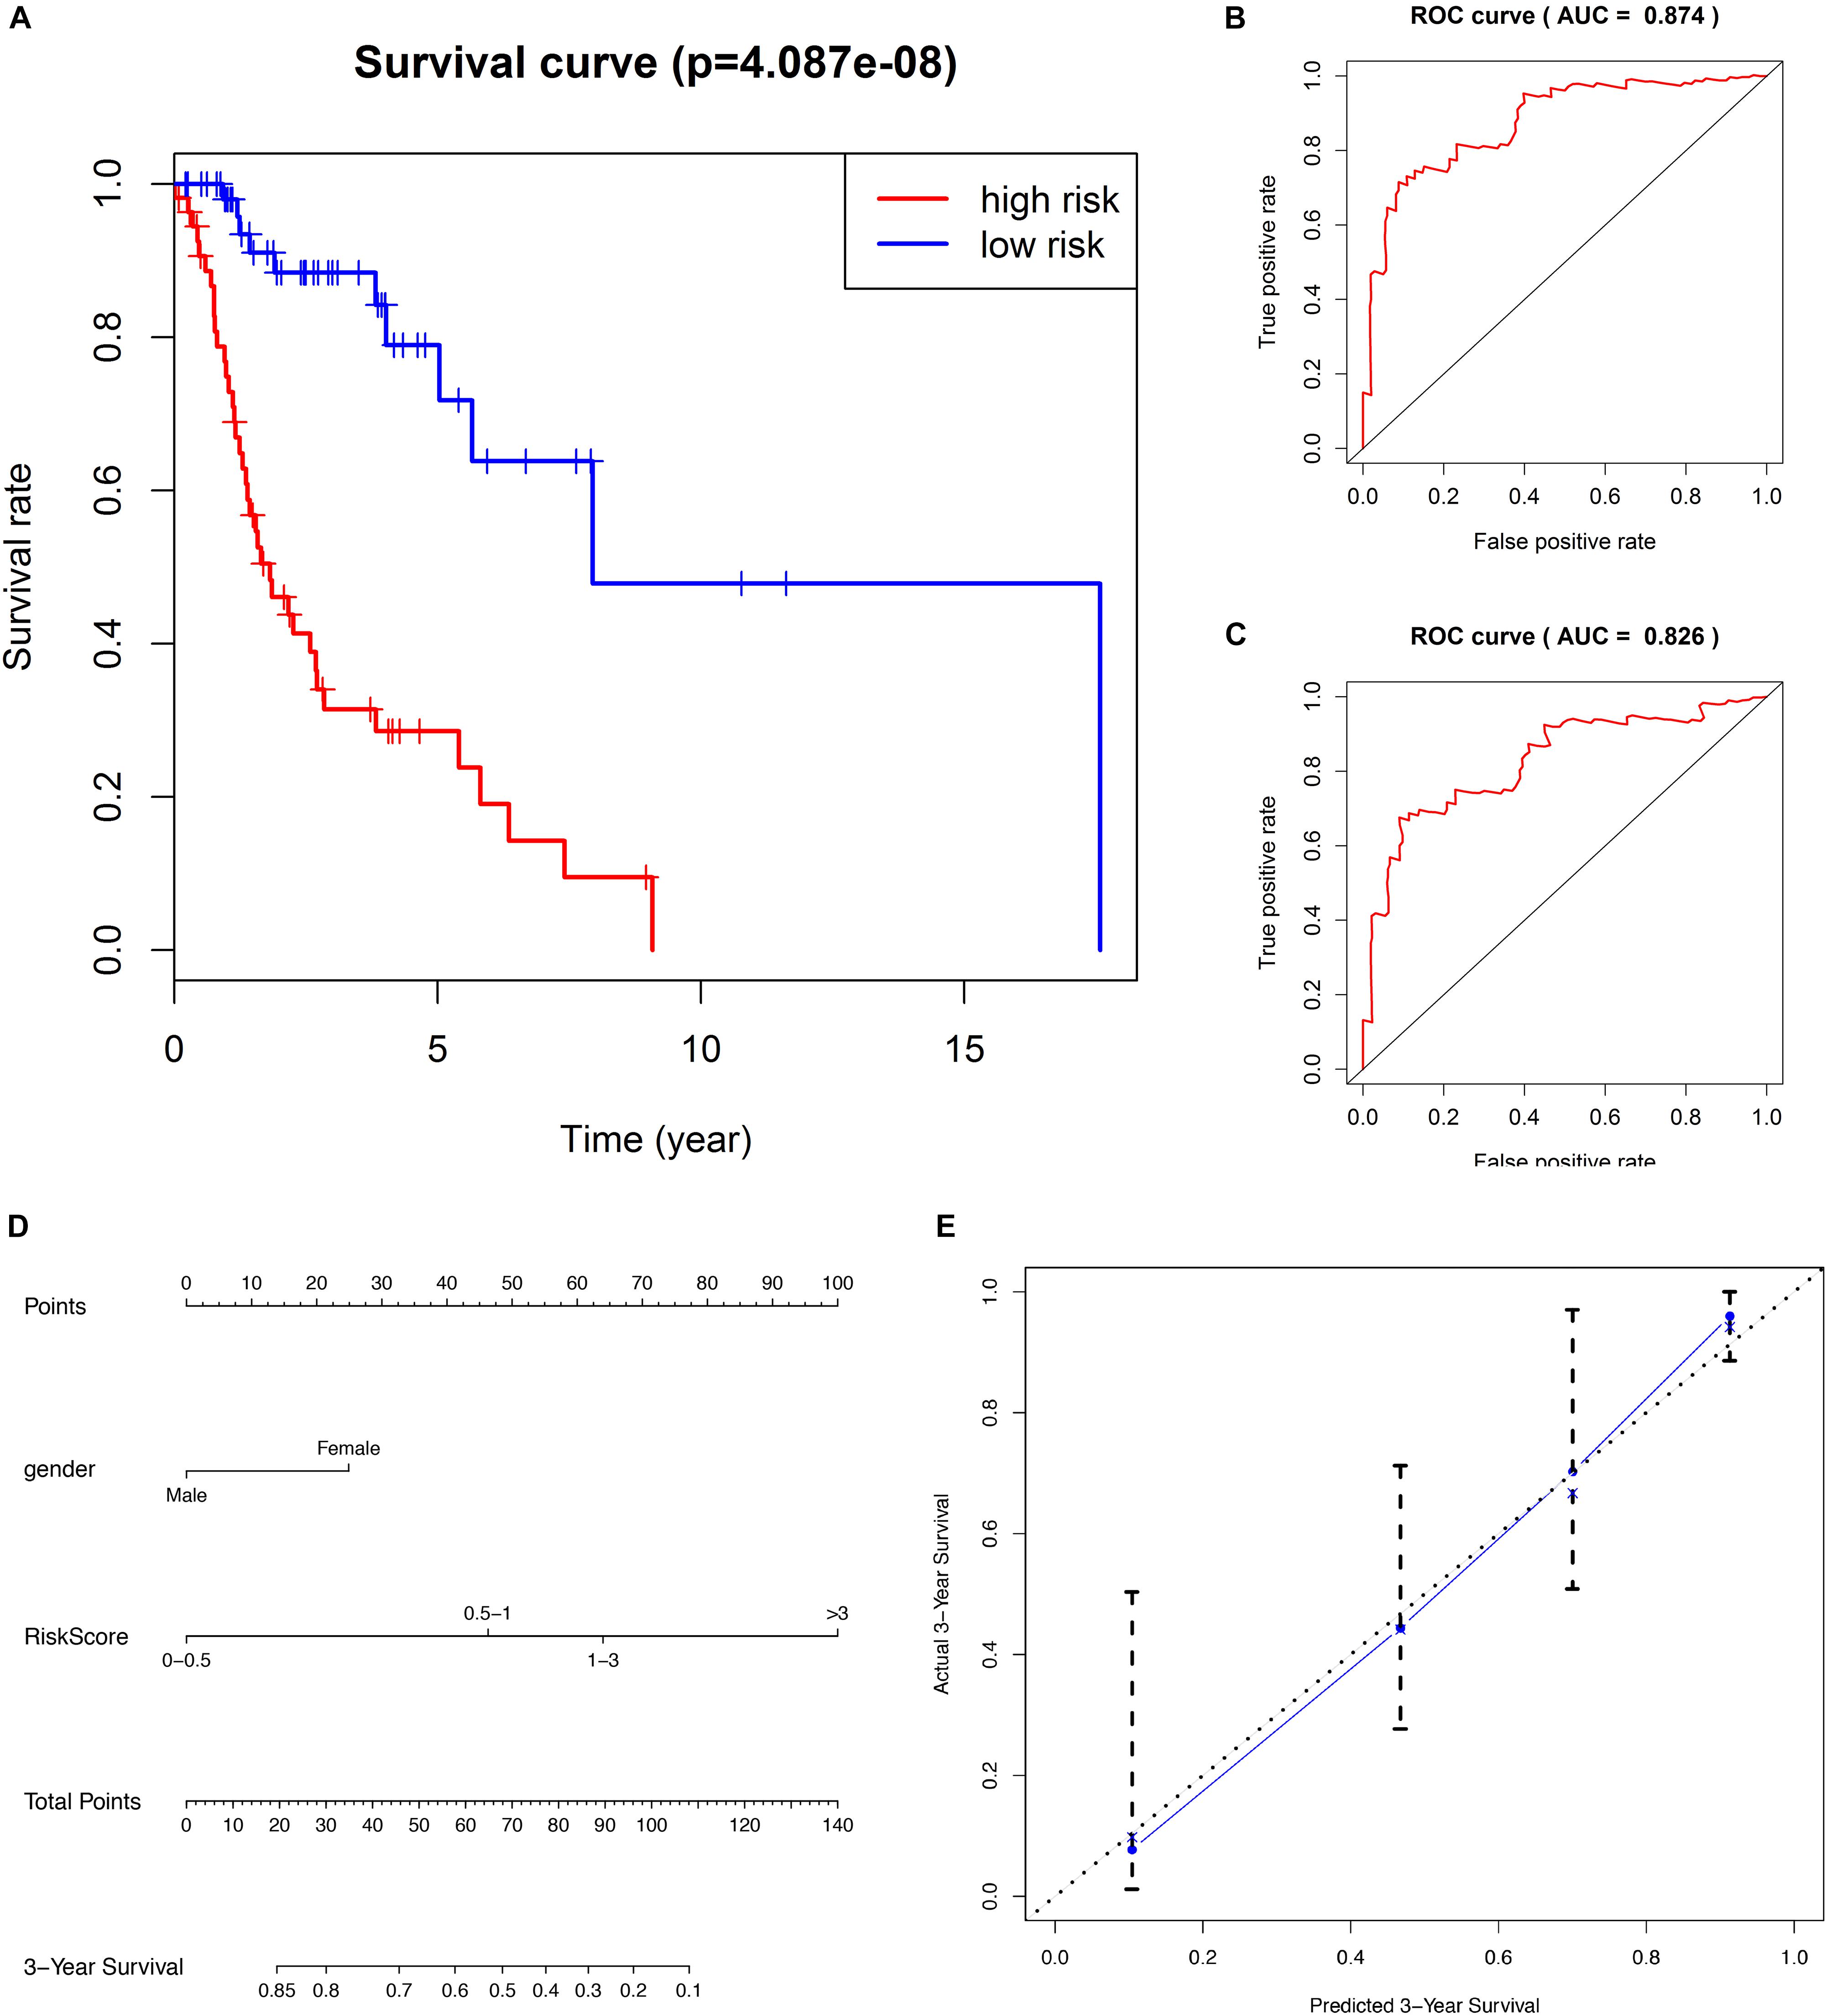
Figure 2. (A) Kaplan–Meier survival analysis indicates that the survival rate of low-risk patients was significantly higher than high-risk patients. (B) ROC curve of predicting 3-year survival with the AUC of 0.874. (C) ROC curve of predicting 5-year survival with the AUC of 0.826. (D) The nomogram combines patient gender with RiskScore to predict 3-year OS in patients with LSCC. (E) The calibration curve is used to evaluate the accuracy of the nomogram and shows good consistency between predicted survival and actual survival.
The predicting ability of the 6-lncRNA signature model was evaluated by calculating the AUC of the ROC curve, and the AUC of more than 0.80 was considered to be a good performance. In our study, the ROC curve of predicting 3-year survival obtained the AUC of 0.874 (Figure 2B), and the ROC curve of predicting 5-year survival obtained the AUC of 0.826 (Figure 2C), showing good sensitivity and specificity of the six-lncRNA signature model in predicting the prognosis of LSCC patients. The C-index of the model was 0.777 (95% CI: 0.71–0.835), further indicating that the model predicting the prognosis of LSCC patients has good performance.
We evaluated the prognostic value of the clinicopathological characteristics and six-lncRNA RiskScore by univariate and multivariate Cox regression analysis. We found that female (HR, 3.428), histological grade G1+G2 (HR, 2.225) and high RiskScore (HR, 5.144) were risk factors for OS of LSCC patients. Furthermore, female (HR, 2.487) and high RiskScore (HR, 3.999) were found to be independent risk factors for OS of LSCC patients (Table 2). To facilitate the utilization of six-lncRNA RiskScore, a 3-year survival nomogram were plotted considering RiskScore and gender (Figure 2D). The C-index of the nomogram was 0.770 (95% CI: 0.704–0.836). The calibration curve for the nomogram showed good consistency between the predict and actual OS (Figure 2E).
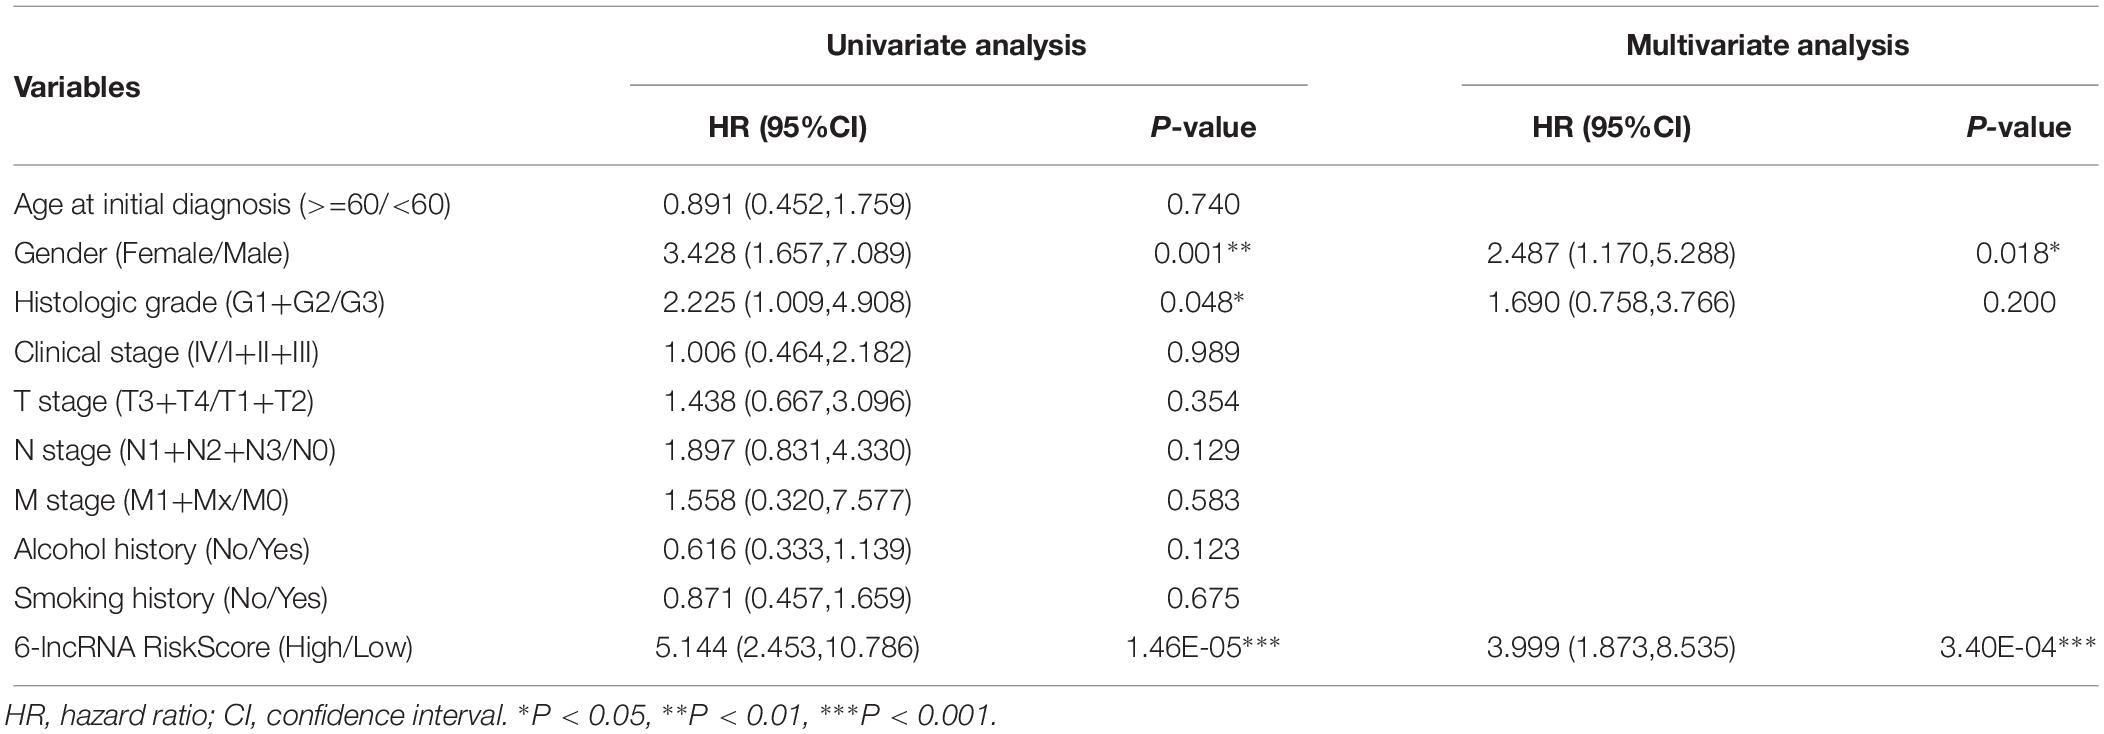
Table 2. The prognostic value of six-lncRNA RiskScore and clinicopathologic characteristics in patients with LSCC.
To explore the clinical significance of the six lncRNAs, we assessed the association between the expression levels of the six lncRNAs and the clinical characteristics of LSCC patients using chi-square test (Supplementary Table 6). We found that LINC02154 was associated with patient N stage (P = 0.040), LINC00528 was associated with patient T stage (P = 0.007), SPRY4-AS1 was associated with patient clinical stage (P = 0.002), TTTY14 was associated with patient gender (P < 0.001), LNCSRLR was associated with patient clinical stage (P = 0.019), and KLHL7-DT was associated with patient T stage (P = 0.016). These results suggested that six lncRNAs might jointly regulate the clinicopathological characteristics of LSCC. We did not find six lncRNAs associated with age at initial diagnosis, histologic grade, M stage, smoking, or drinking history.
To further explore the association between PCGs and clinical characteristics (gender, clinical stage, T stage, and N stage) of LSCC patient, we performed a WGCNA analysis. 15 LSCC samples were excluded due to lack of one or more of gender, clinical stage, T stage or N stage, and 96 LSCC samples were used for WGCNA analysis. The samples of LSCC (n = 96) were clustered using average linkage method and Pearson correlation method. We excluded three outlier sample and finally included 93 samples for subsequent analysis (Figures 3A,B).
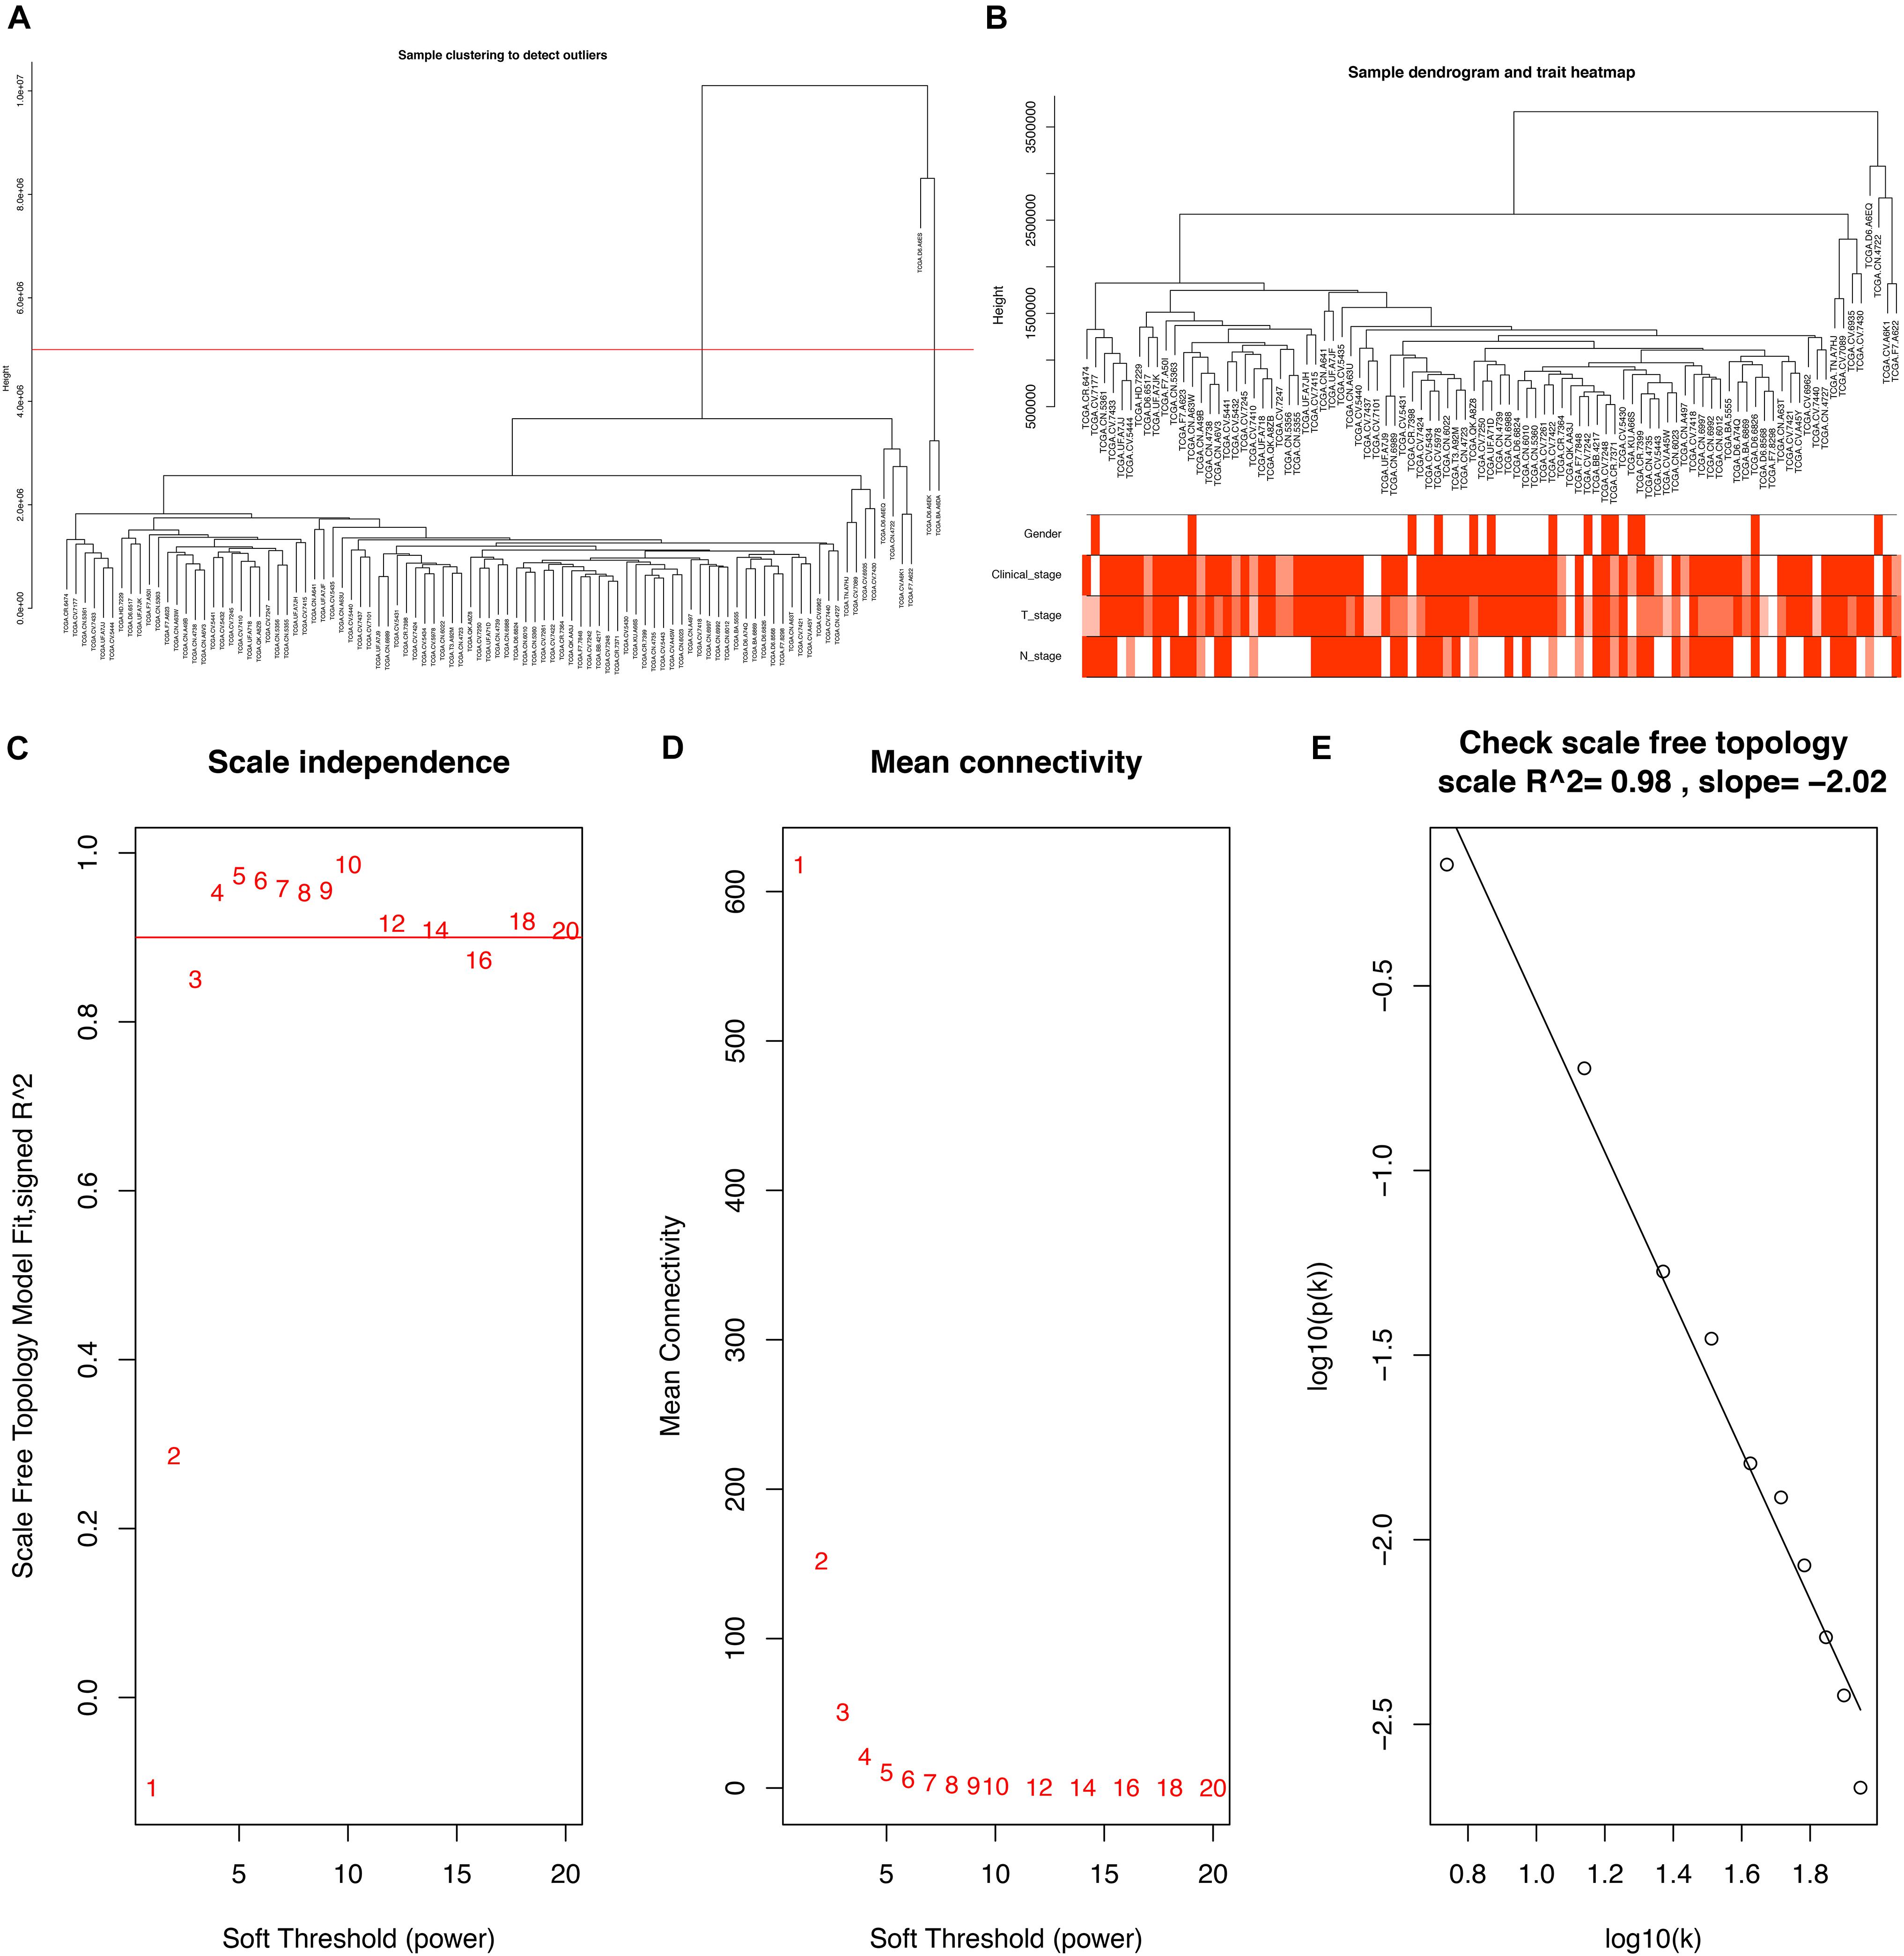
Figure 3. (A) Clustering dendrogram of 96 samples, and excluding three outlier sample. (B) Clustering dendrogram of 93 samples corresponding to clinical characteristics. (C) Analysis of the scale-free fit index for various soft-thresholding powers (β). (D) Analysis of the mean connectivity for various soft-thresholding powers. (E) Checking the scale free topology when β = 5.
Constructing a WGCNA needed the best soft-thresholding power to which co-expression similarity was raised to calculate adjacency. Therefore, we performed a network topology analysis of various soft-thresholding powers to have relatively balanced scale independence and average connectivity of WGCNA. In this study, the power of β = 5 (scale-free R2 = 0.98) was selected as the soft-thresholding parameter to ensure a scale-free network (Figures 3C–E).
Through dynamic tree cut and merged dynamics, 24 different gene modules were generated in a hierarchical clustering tree from 93 samples, and each module marked by a different color was displayed through a tree diagram, wherein each tree branch constituted a module and each leaf in the branch was one gene. As shown in Figure 4A, the horizontal line defined the threshold, by merging similar modules, 23 distinct gene modules were identified (Figure 4B). According to the standard with minimum P-value, we found that gender was associated with the darkgreen module (P = 0.010), clinical stage was associated with the grey60 module (P = 0.009), T stage was associated with the greenyellow module (P = 0.007), N stage was associated with the green module (P = 0.002), and those modules were selected as the clinically significant modules for further analysis (Figure 4C). The list of PCGs for clinically significant modules was shown in Supplementary Table 7.
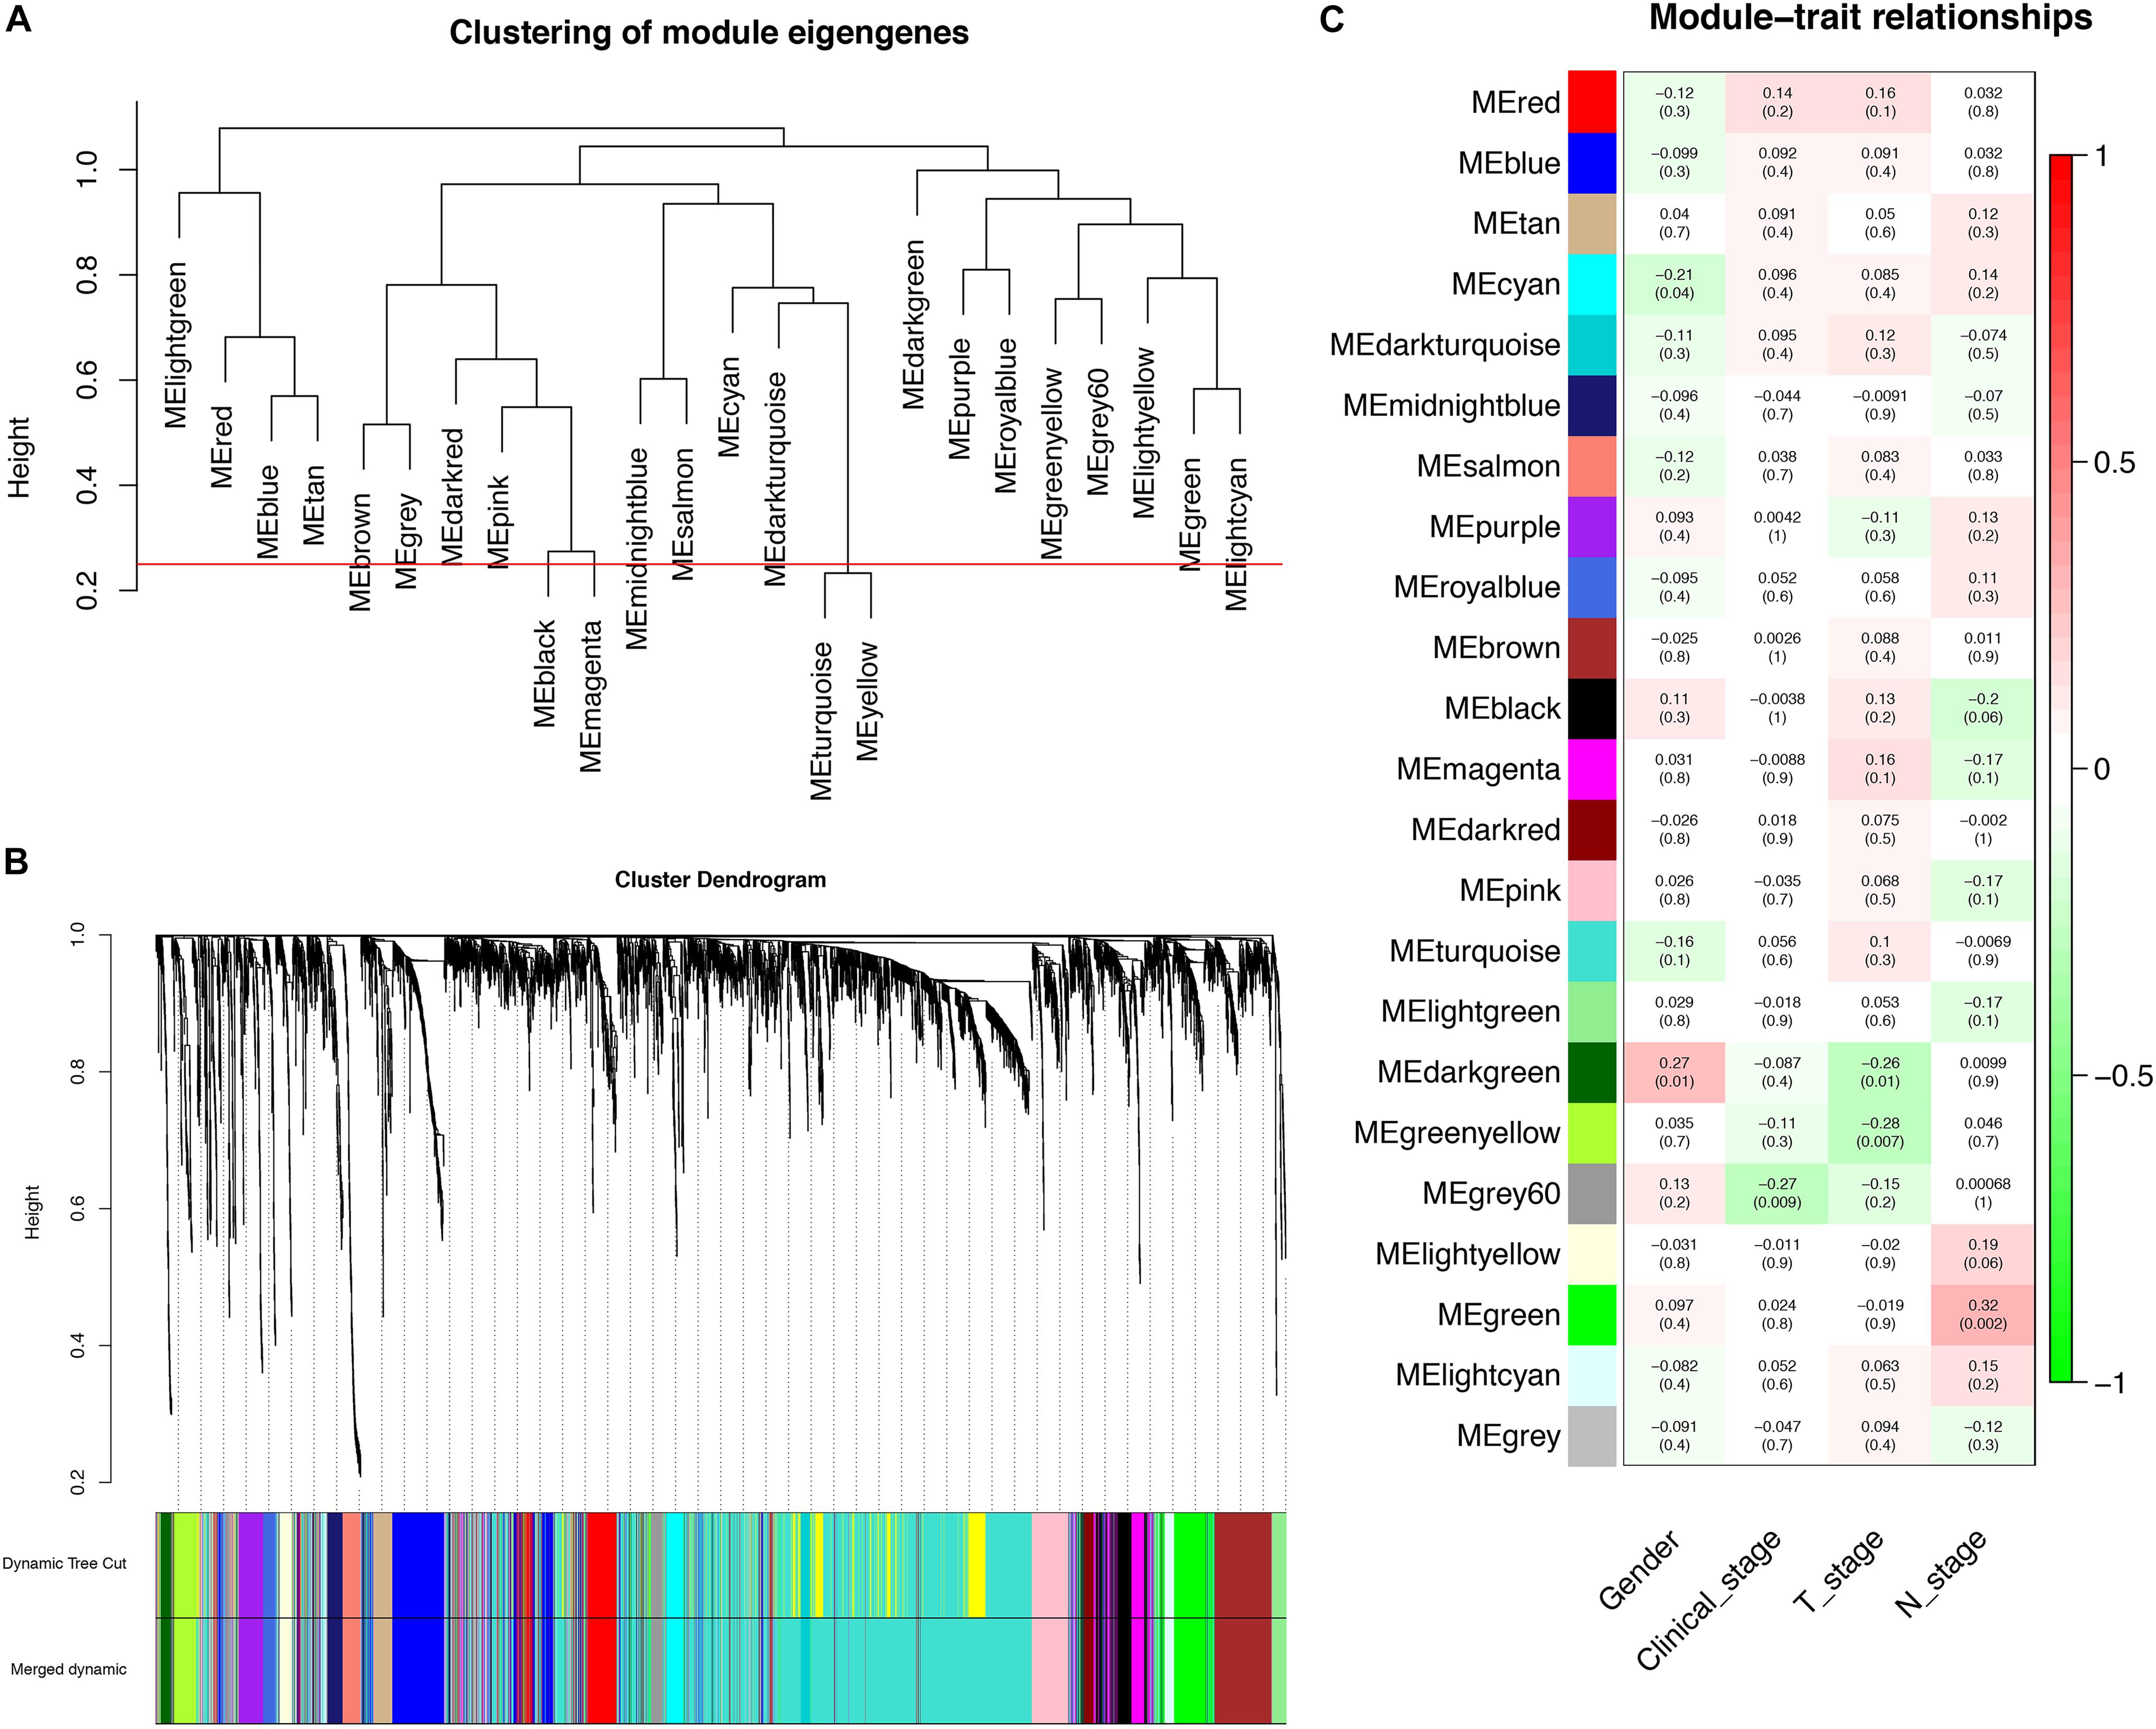
Figure 4. Identification of PCGs modules associated with the clinical characteristics of LSCC. (A) The horizontal line defined the threshold, so 23 distinct gene modules were identified. (B) Dendrogram of all genes were clustered based on a dissimilarity measure (1-TOM). (C) Heatmap of the correlation between module eigengenes (MEs) and clinical characteristics of LSCC.
We calculated the Pearson correlation coefficients between the PCGs and the six lncRNAs to determine the co-expression relationship, respectively. The PCGs with P < 0.05 were considered to be associated with six lncRNAs (Supplementary Table 8). To more accurately predict the potential function of the six lncRNAs, we selected 850 key PCGs with | Pearson correlation coefficient | > 0.40 and P < 0.001 for GO and KEGG pathway enrichment analysis. The key PCGs in the BP group were mainly enriched in extracellular matrix organization, cell adhesion, collagen catabolic process, and so on. The key PCGs in the CC group were significantly enriched in extracellular space, endoplasmic reticulum lumen, proteinaceous extracellular matrix and so on. The key PCGs in the MF group were mainly enriched in metalloendopeptidase activity, collagen binding, extracellular matrix structural constituent and so on. According to KEGG pathway analysis, the key PCGs were mainly involved in focal adhesion, pathways in cancer, proteoglycans in cancer and so on. These results indicated that the key PCGs co-expressed with six lncRNAs might be associated with the occurrence and progression of tumors (Figure 5).
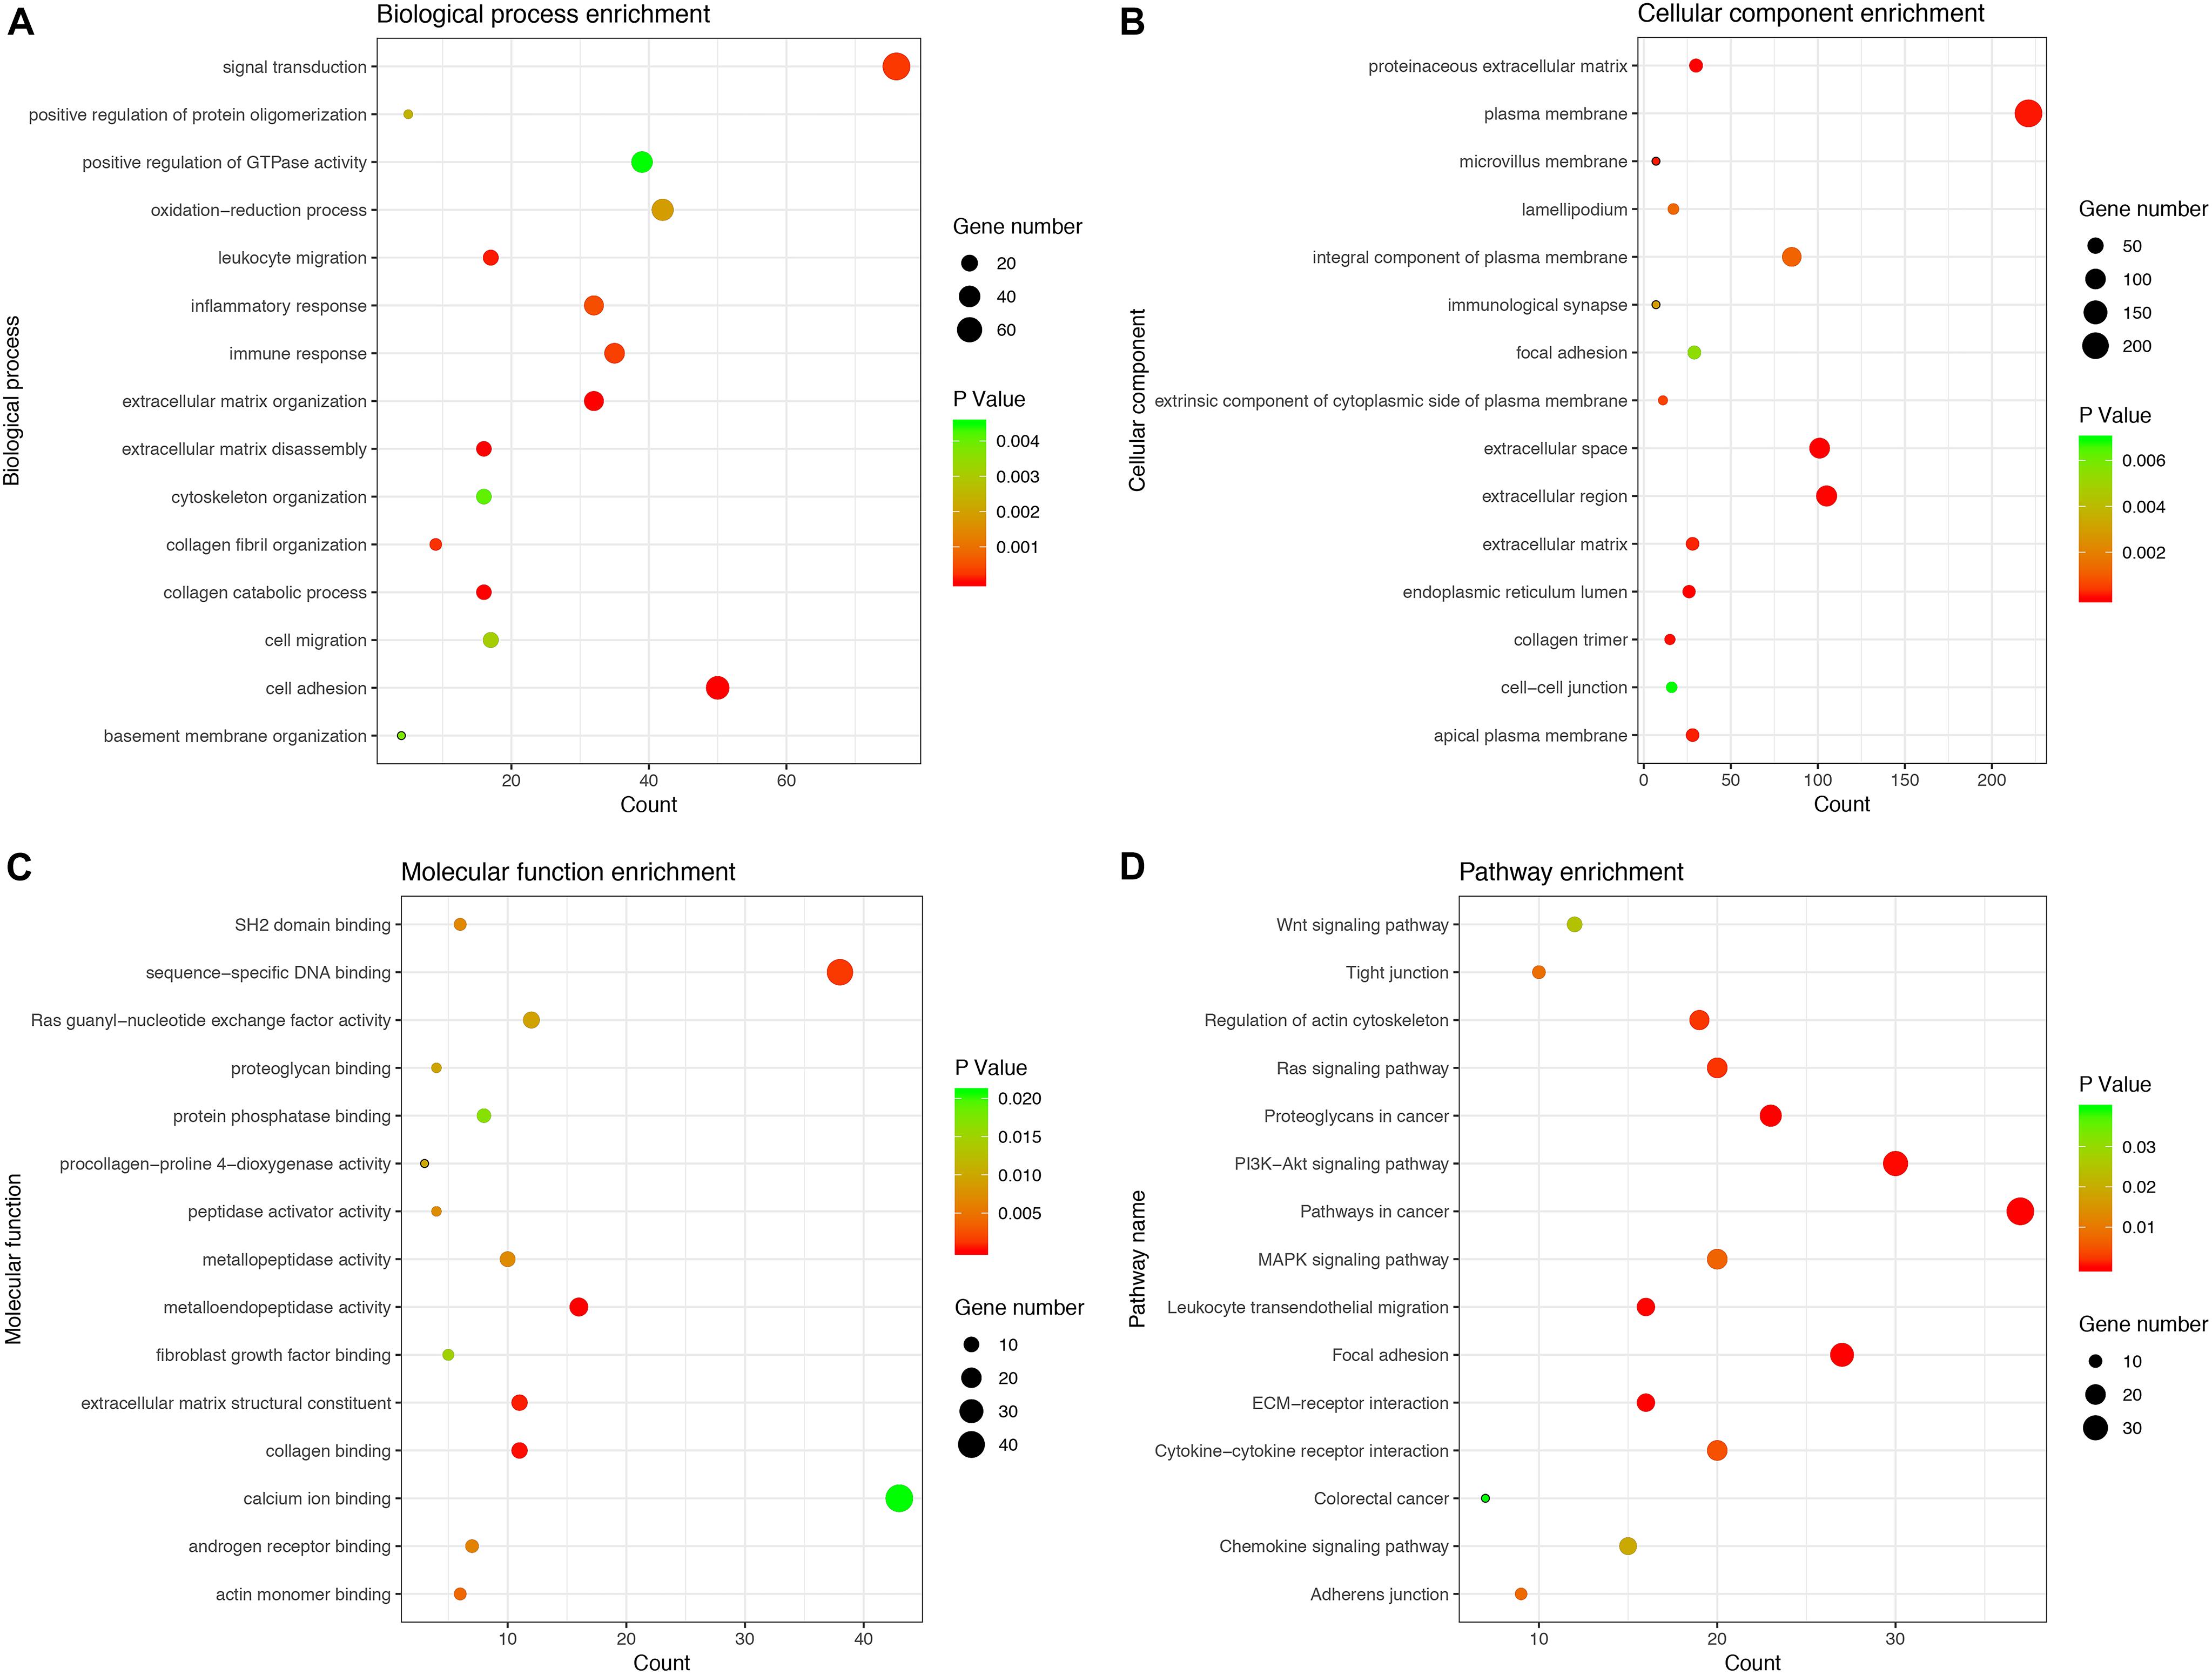
Figure 5. GO and KEGG enrichment analysis for PCGs co-expressed with six lncRNAs. (A) Biological process. (B) Cellular component. (C) Molecular function. (D) KEGG pathway.
We took the intersection of the green module of WGCNA, differentially expressed PCGs between normal samples and LSCC, and PCGs co-expressed with LINC02154. And 23 PCGs were screened as potential target PCGs for LINC02154. We took the intersection of the greenyellow module of WGCNA, differentially expressed PCGs between normal samples and LSCC, and PCGs co-expressed with LINC00528. And 15 PCGs were screened as potential target PCGs for LINC00528. We took the intersection of the grey60 module of WGCNA, differentially expressed PCGs between normal samples and LSCC, and PCGs co-expressed with SPRY4-AS1. And one PCG was screened as a potential target PCG for SPRY4-AS1. We took the intersection of the darkgreen module of WGCNA, differentially expressed PCGs between normal samples and LSCC, and PCGs co-expressed with TTTY14. And three PCGs were screened as potential target PCGs for TTTY14. We took the intersection of the grey60 module of WGCNA, differentially expressed PCGs between normal samples and LSCC, and PCGs co-expressed with LNCSRLR. And two PCGs were screened as potential target PCGs for LNCSRLR. We took the intersection of the greenyellow module of WGCNA, differentially expressed PCGs between normal samples and LSCC, and PCGs co-expressed with KLHL7-DT. And seven PCGs were screened as potential target PCGs for KLHL7-DT (Table 3). Survival analysis of potential target PCGs for six lncRNAs showed that STC2 (P = 0.021), TSPAN9 (P = 0.008), SMS (P = 0.006), and TCEA3 (P = 0.009) affected the OS of LSCC (Figure 6 and Table 3). High expression of STC2 and SMS, low expression of TSPAN9 and TCEA3 patients were shorter in OS compared to patients with low expression of STC2 and SMS, high expression of TSPAN9 and TCEA3. To further validate the differential expression of four potential target PCGs affecting OS of LSCC patients between normal samples and LSCC, we used The Human Protein Atlas database to find IHC images. We found that STC2, TSPAN9, SMS were high expression in LSCC, and TCEA3 was low expression in LSCC (Figure 7).
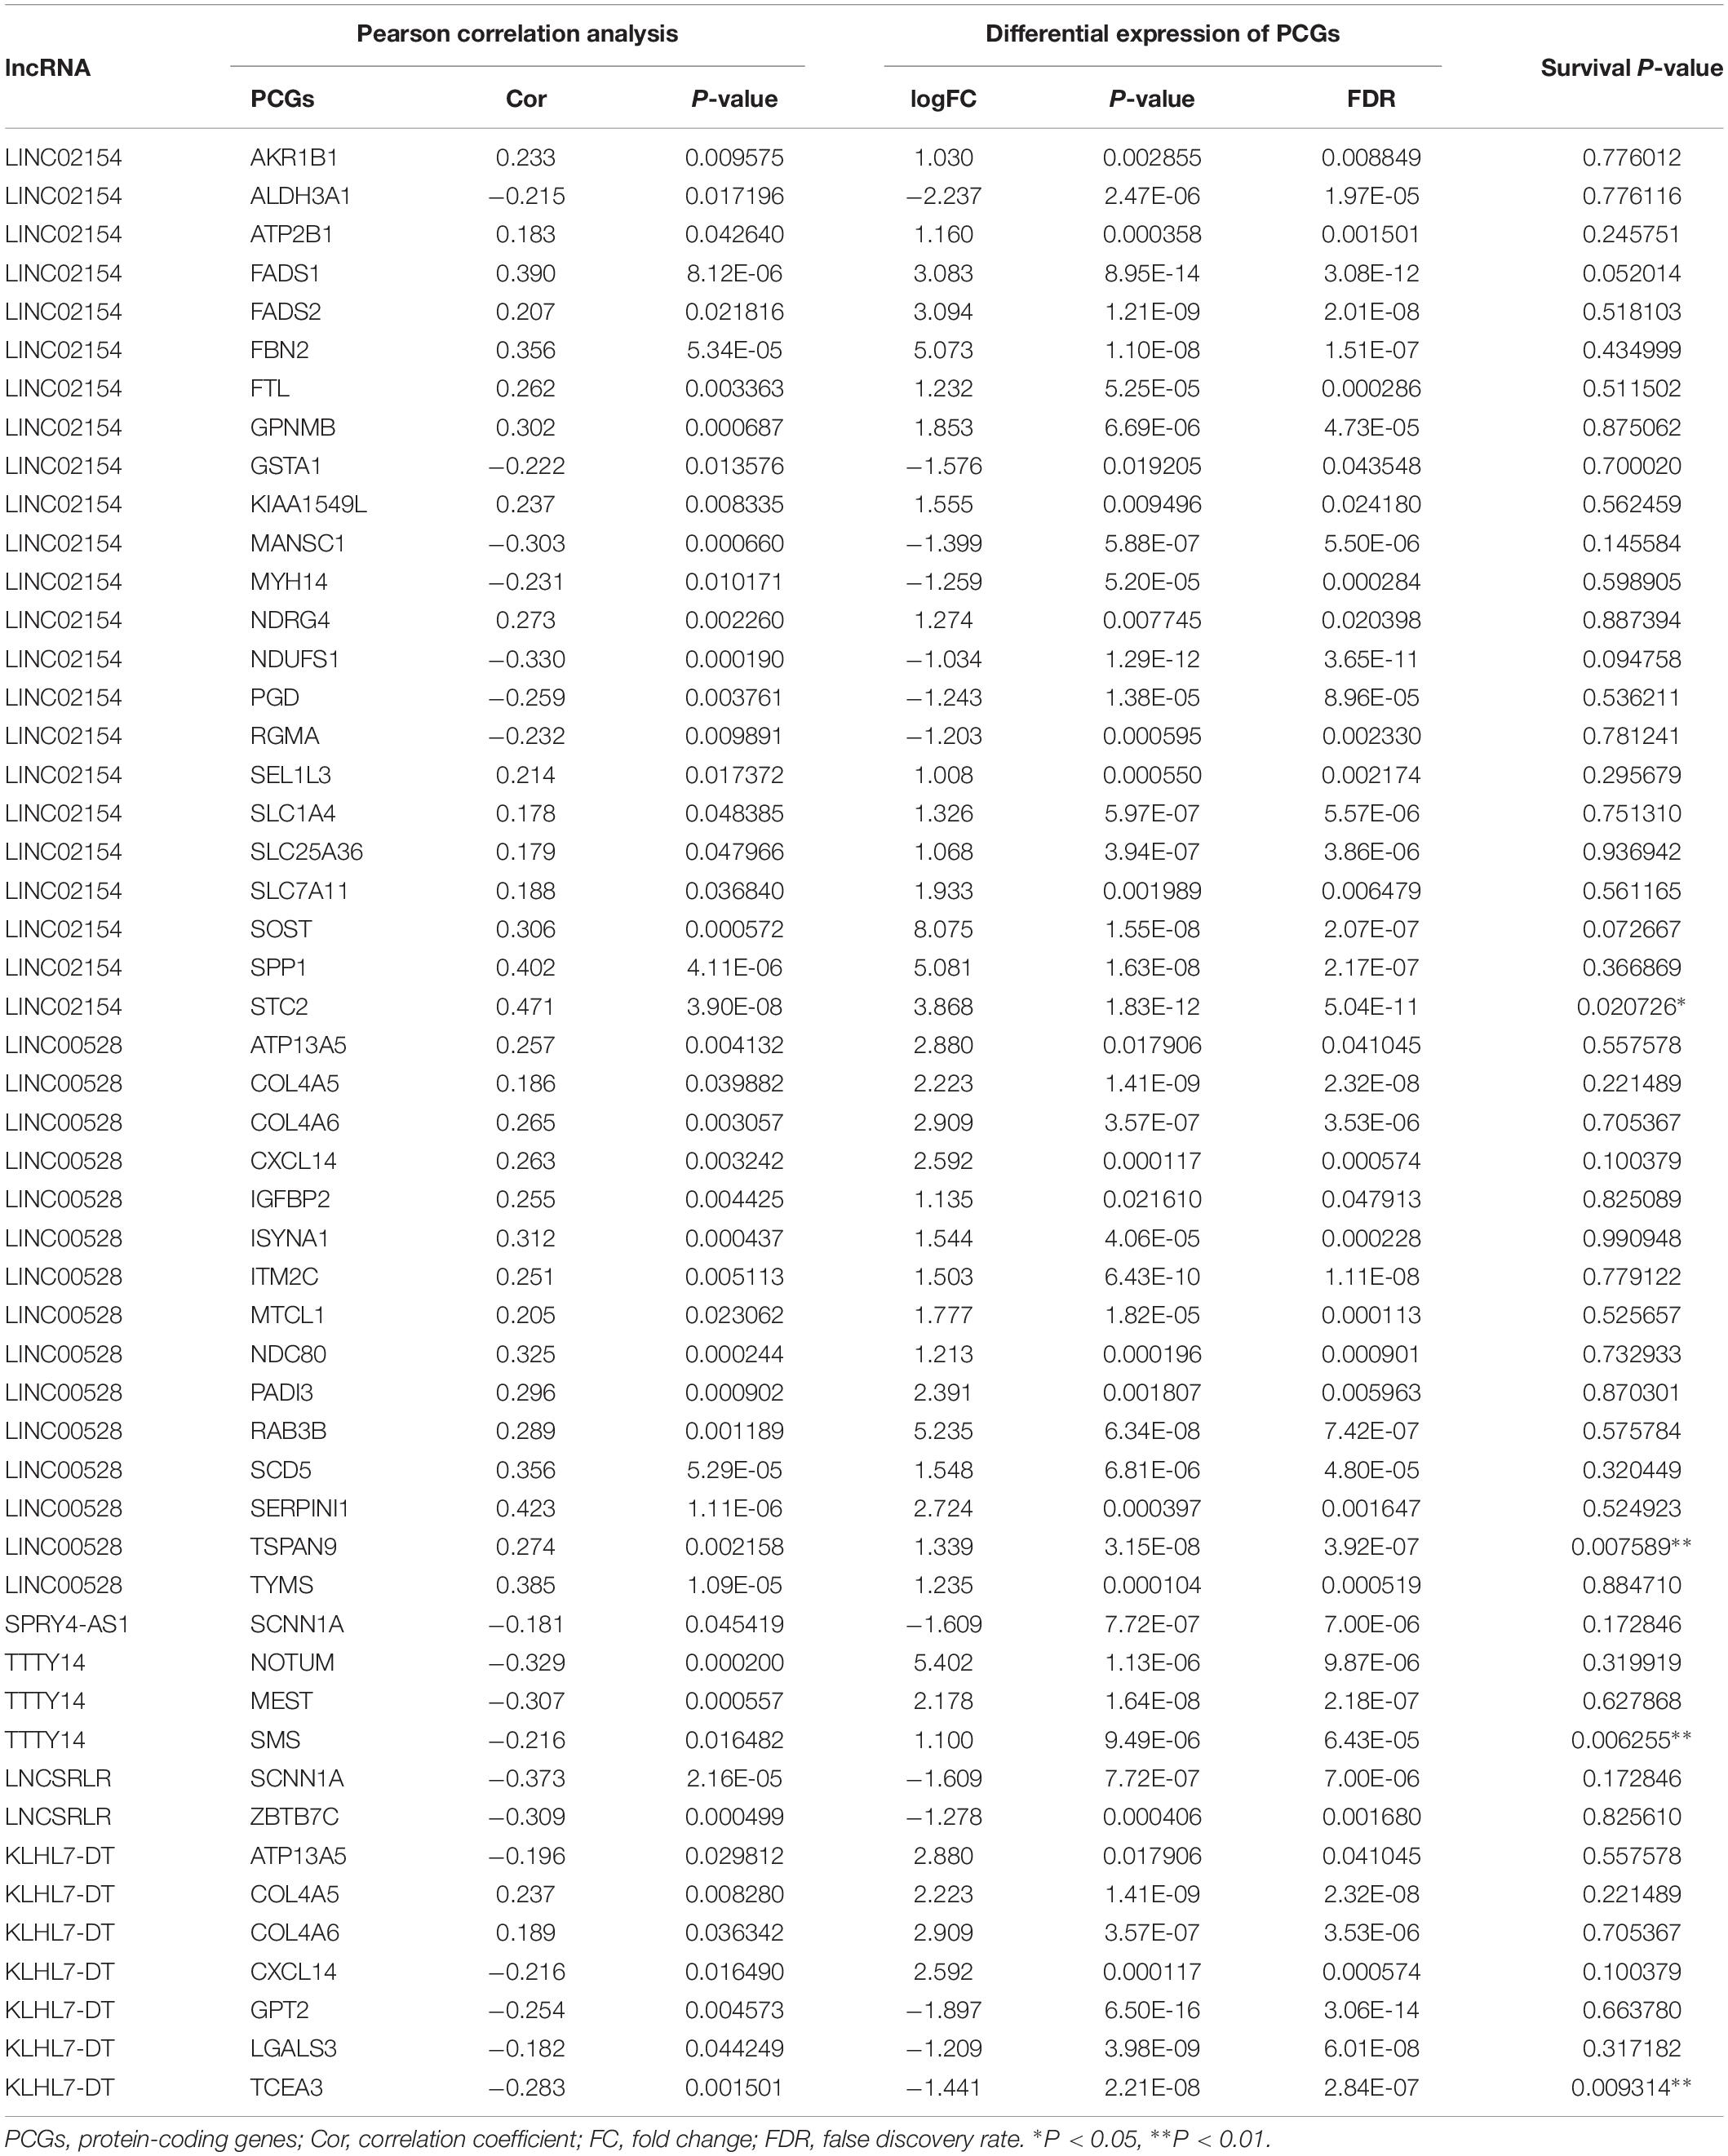
Table 3. The potential target PCGs of six lncRNAs, including Pearson correlation analysis between six lncRNAs and PCGs, differential expression of PCGs (LSCC compared with normal samples), and Kaplan–Meier survival analysis (log-rank method) of PCGs.
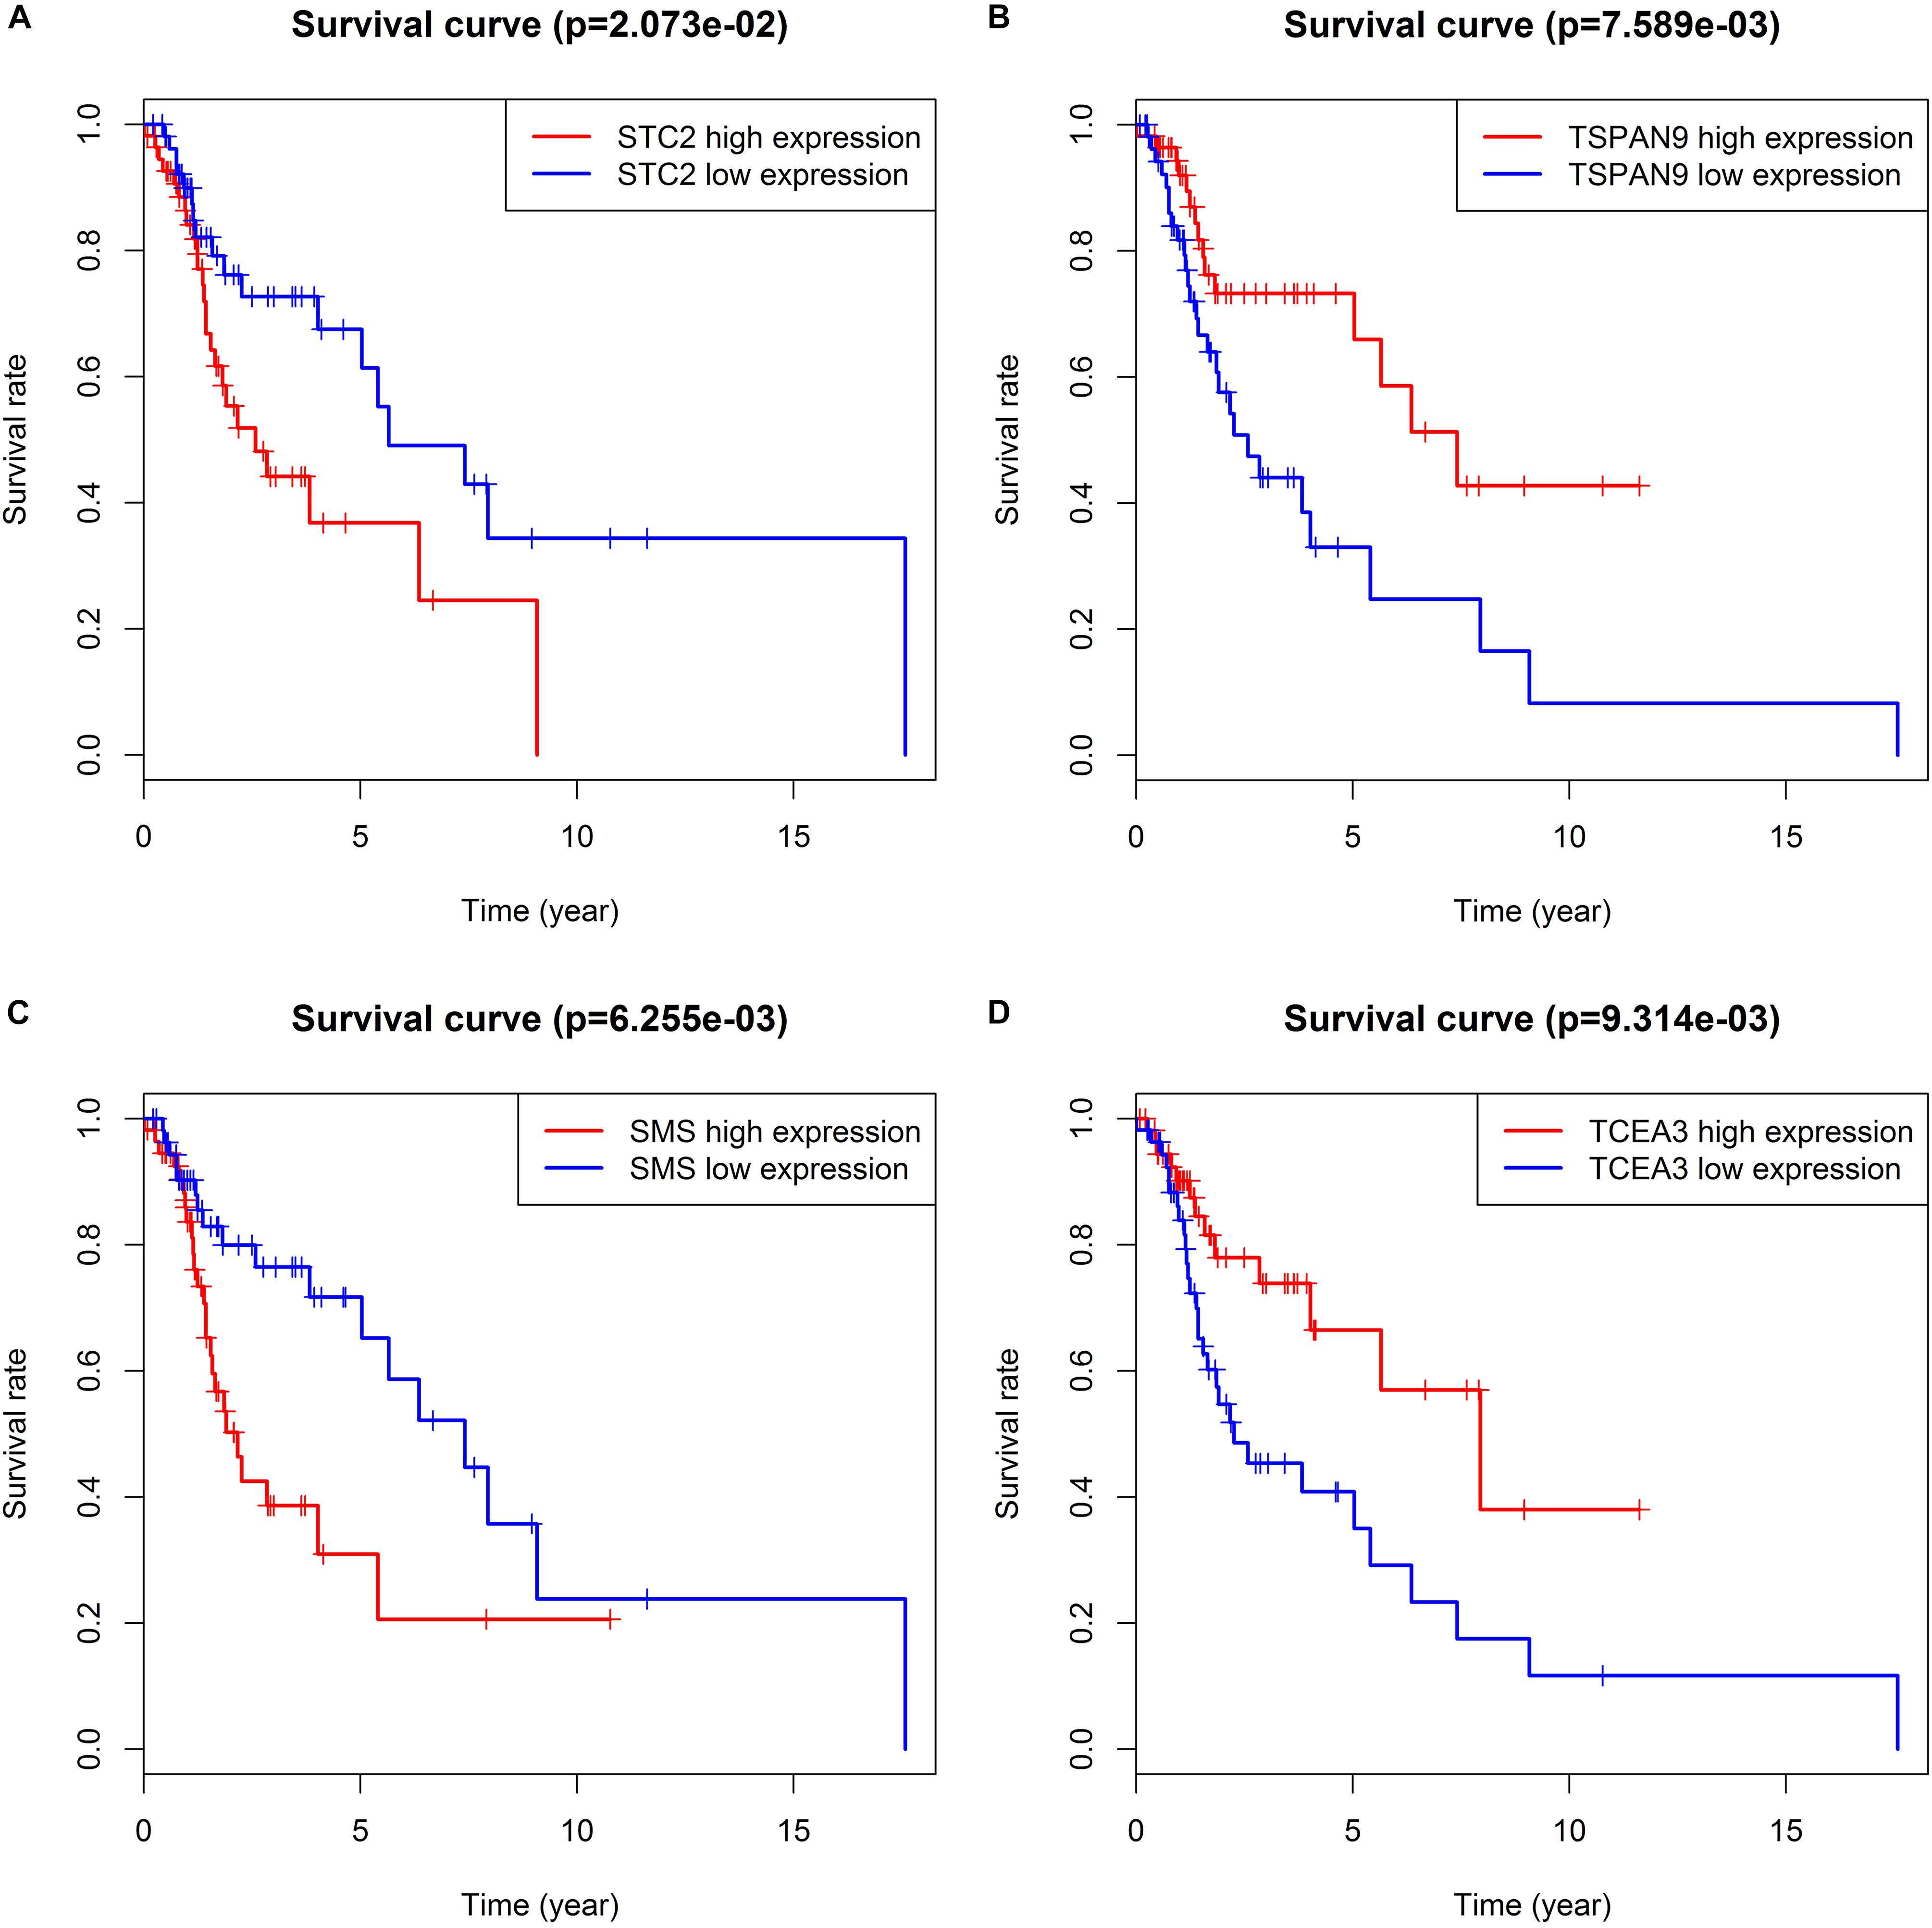
Figure 6. Kaplan–Meier survival analysis indicates that patients with high expression of STC2 (A) and SMS (C), low expression of TSPAN9 (B) and TCEA3 (D) were shorter in OS compared to patients with low expression of STC2 and SMS, high expression of TSPAN9 and TCEA3.
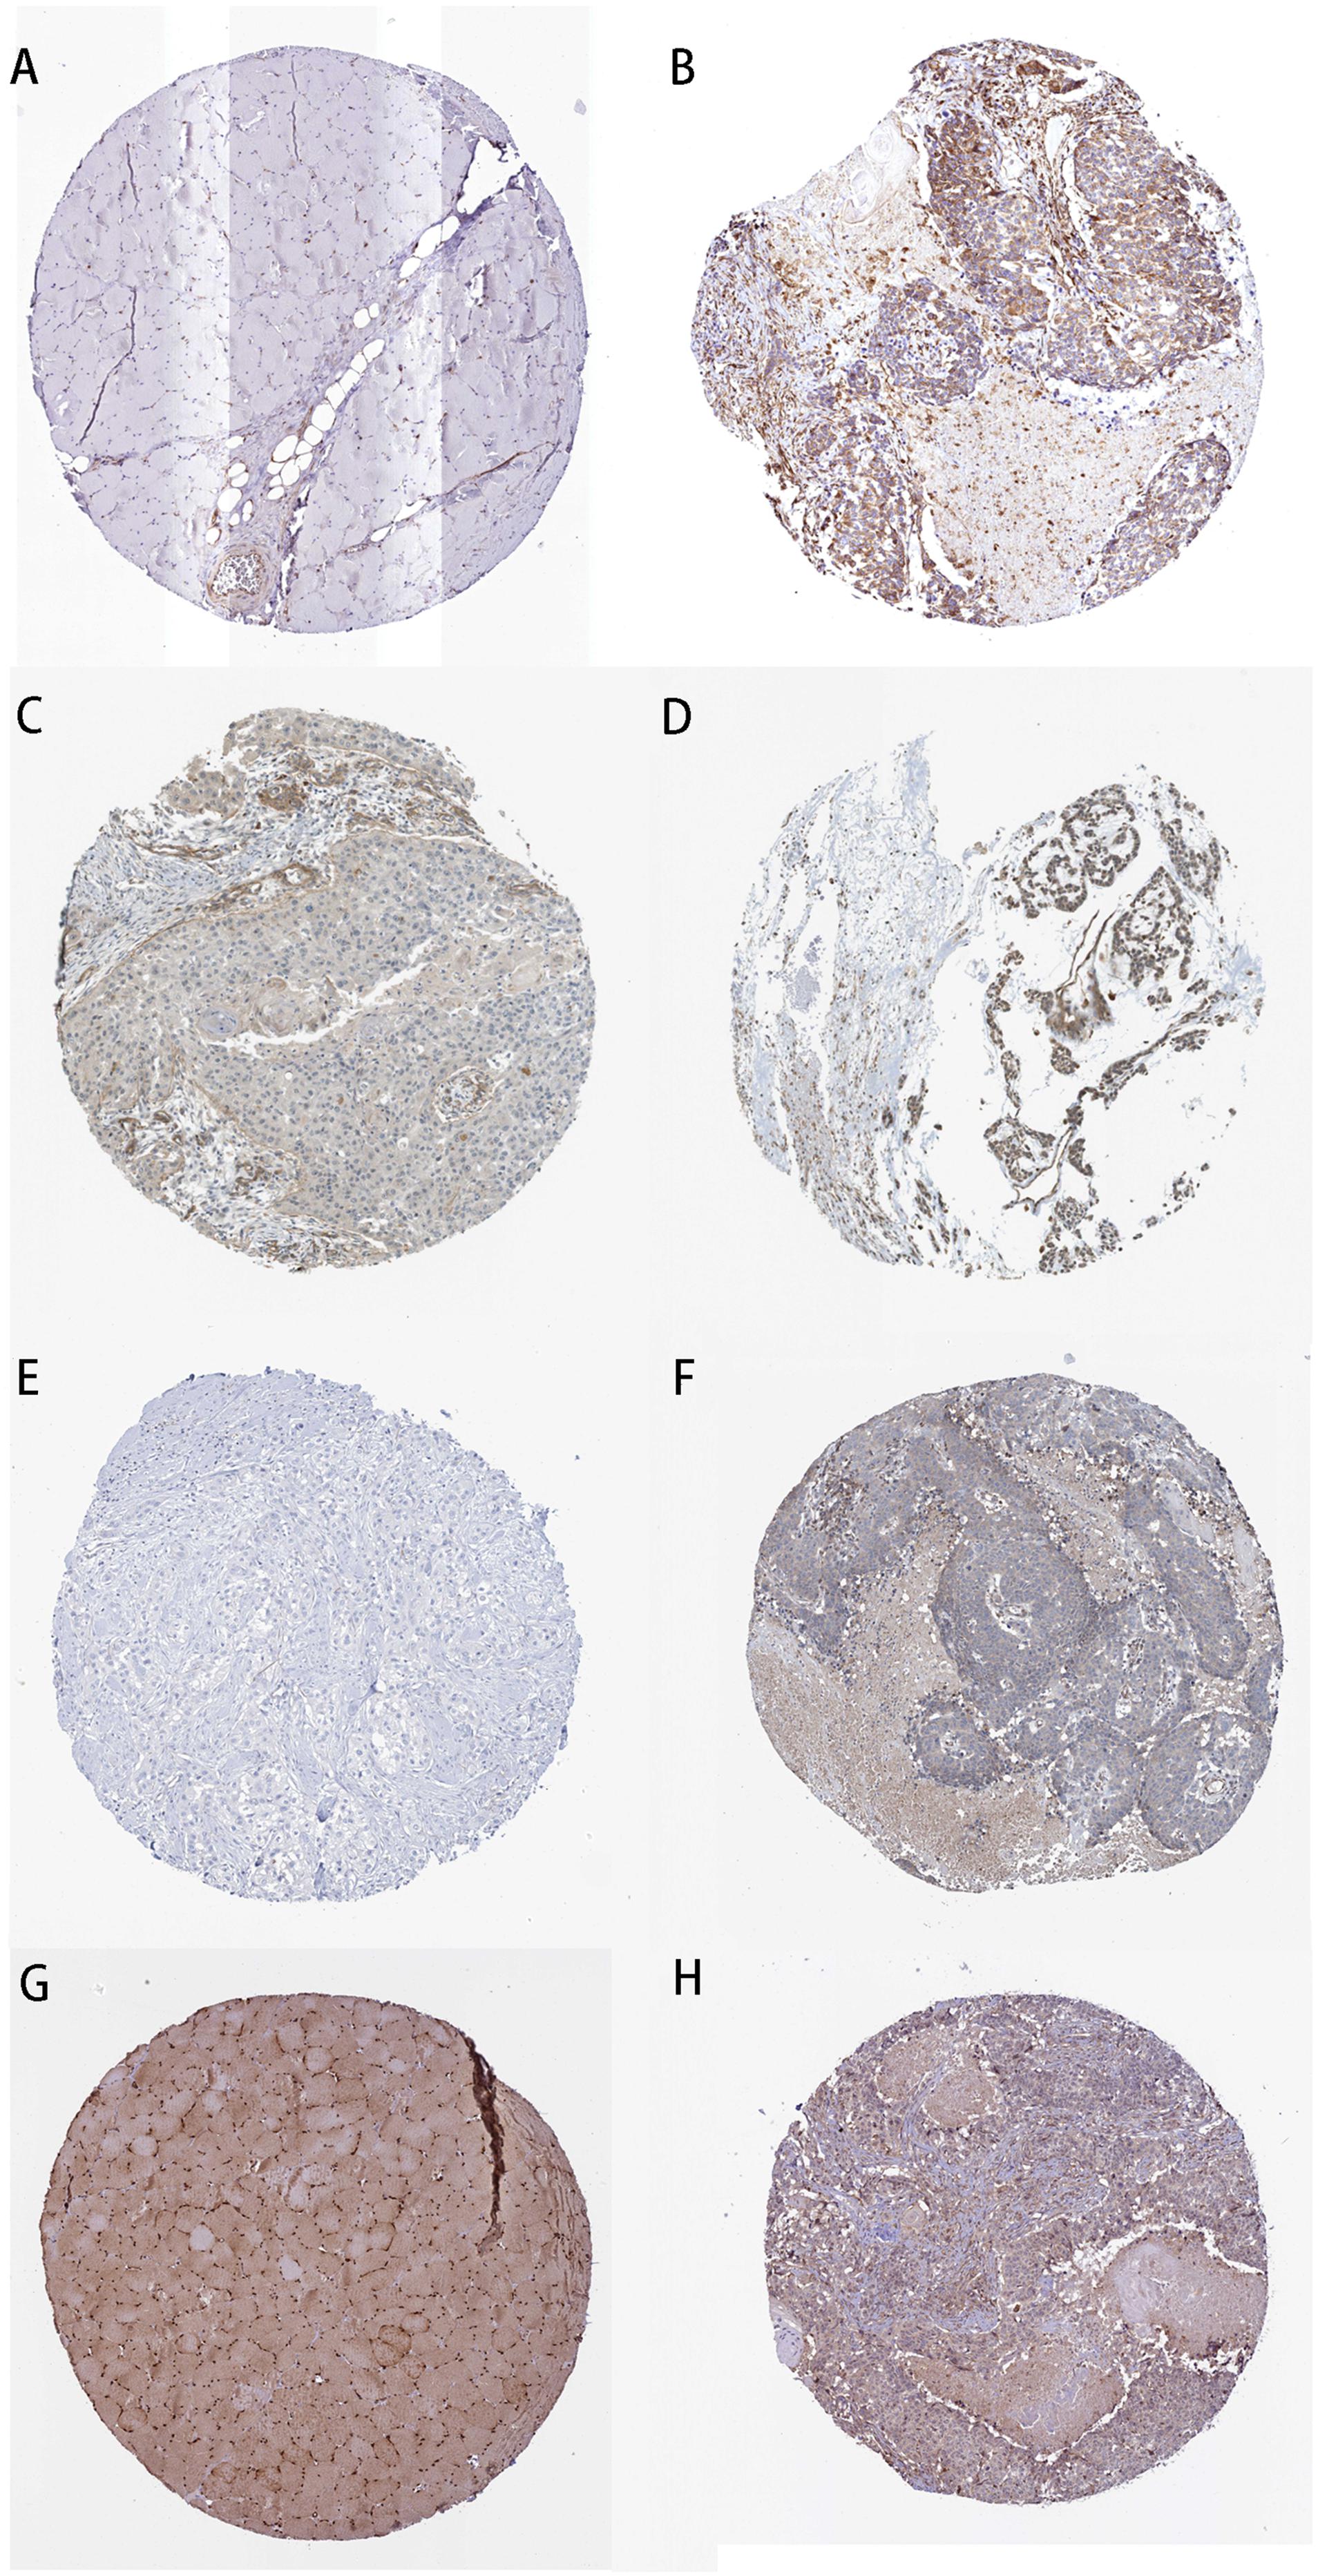
Figure 7. Immunohistochemistry of the four PCGs affecting OS of LSCC patients based on The Human Protein Atlas. (A) Protein levels of STC2 in normal tissue (staining: not detected; intensity: negative; quantity: negative). (B) Protein levels of STC2 in tumor tissue (staining: medium; intensity: moderate; quantity: > 75%). (C) Protein levels of TSPAN9 in normal tissue (staining: low; intensity: weak; quantity: 25–75%). (D) Protein levels of TSPAN9 in tumor tissue (staining: medium; intensity: moderate; quantity: > 75%). (E) Protein levels of SMS in normal tissue (staining: not detected; intensity: negative; quantity: negative). (F) Protein levels of SMS in tumor tissue (staining: low; intensity: weak; quantity: < 25%). (G) Proteins level of TCEA3 in normal tissue (staining: high; intensity: strong; quantity: > 75%). (H) Protein levels of TCEA3 in tumor tissue (staining: not detected; intensity: weak; quantity: < 25%).
To verify the differential expression of the six lncRNAs and four PCGs obtained from the analysis of TCGA datasets, we used RT-qPCR to analyze the expression levels of the six lncRNAs and four PCGs in tumor tissues and adjacent normal tissues of 25 LSCC patients in our hospital. The results showed that the expression levels of LINC02154, LINC00528, SPRY4-AS1, LNCSRLR, KLHL7-DT, STC2, TSPAN9, and SMS in tumor tissues were higher than those in adjacent normal tissues, and the expression level of TTTY14 and TCEA3 in tumor tissues was lower than that in adjacent normal tissues (P < 0.01, Figure 8). The experiment results validated the differential expression of the six lncRNAs and four PCGs we found in TCGA database.
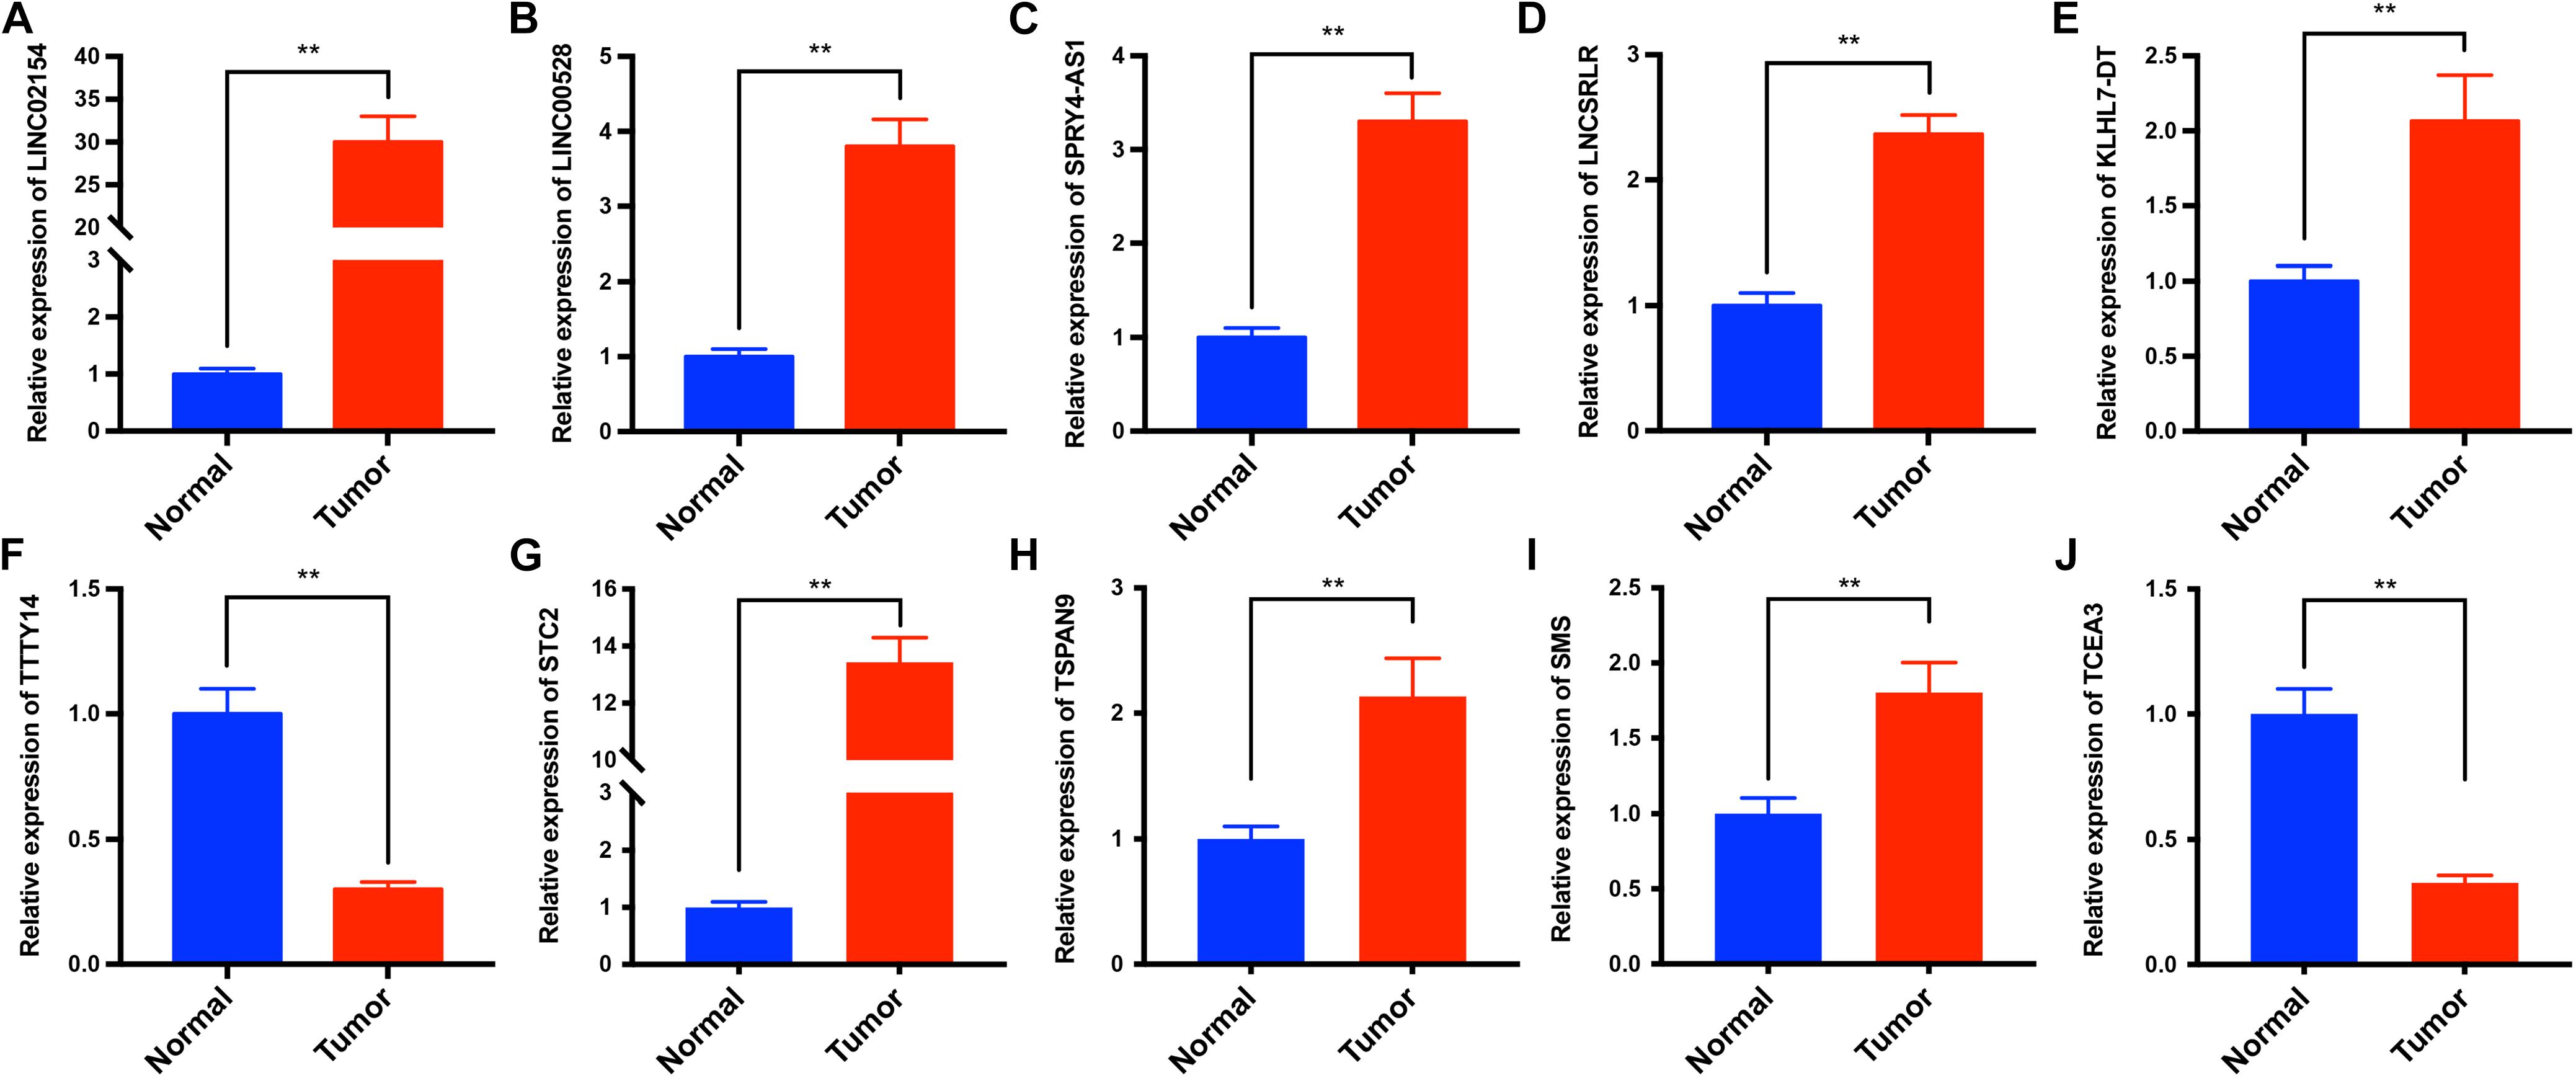
Figure 8. The expression levels of LINC02154, LINC00528, SPRY4-AS1, TTTY14, LNCSRLR, KLHL7-DT, STC2, TSPAN9, SMS, and TCEA3 in tumor tissues and adjacent normal tissues of 25 LSCC patients were analyzed by RT-qPCR. The results showed that the expression levels of LINC02154 (A), LINC00528 (B), SPRY4-AS1 (C), LNCSRLR (D), KLHL7-DT (E), STC2 (G), TSPAN9 (H), and SMS (I) in tumor tissues were higher than those in adjacent normal tissues, and the expression levels of TTTY14 (F) and TCEA3 (J) in tumor tissues were lower than that in adjacent normal tissues (**P < 0.01).
Currently, the predictive indicator of prognosis in patients with LSCC still needs further exploration. Clinical TNM stage and histopathological grade are commonly used indicators to predict the prognosis of patients with LSCC (Almadori et al., 2005). Studies have shown that exposure to tobacco and alcohol and human papillomavirus infection are risk factors for prognosis in LSCC patients (Stelow et al., 2010; Nogueira et al., 2015). Abnormal expression of various PCGs and miRNAs are associated with prognosis in patients with LSCC (Pich et al., 2004; Ayaz et al., 2013; Wong et al., 2016). LncRNA is widely involved in cancer pathways (Schmitt and Chang, 2016) and is an emerging biomarker and potential therapeutic target for tumors (Chandra Gupta and Nandan Tripathi, 2017), which is closely related to the progression of various tumors (Tsai et al., 2011) and the prognosis of cancer patients (Serghiou et al., 2016). However, there is little research on the correlation between lncRNAs and prognosis in patients with LSCC.
In this study, we used multivariate Cox regression to establish a model based on six-lncRNA (LINC02154, LINC00528, SPRY4-AS1, TTTY14, LNCSRLR, and KLHL7-DT) RiskScore to predict the prognosis of patients with LSCC. The OS of low-risk patients forecasted by the model was significantly better than high-risk patients. The AUC of the ROC curve showed the good performance of the model in predicting the 3- and 5-year OS of patients with LSCC. C-index further demonstrated the accuracy of the model. Multivariate Cox analysis showed that female and high RiskScore were independent risk factors for prognosis in LSCC patients. We constructed a nomogram that combined patient gender and RiskScore. The C-index and the calibration curve confirmed the accuracy of the nomogram. This makes it easier and more intuitive to predict the 3-year OS of patients with LSCC based on patient gender and RiskScore. Chi-square test showed that six lncRNAs were associated with one of the clinical characteristics, i.e., gender, clinical stage, T stage, and N stage, respectively, indicating that six lncRNAs were involved in the regulation of the clinical characteristics of LSCC.
Studies have shown that LINC02154 is significantly upregulated in renal cell carcinoma and its high expression is one of the risk factors for poor prognosis. It is involved in the construction of a model for predicting the prognosis of patients with renal cell carcinoma (Zuo et al., 2018). TTTY14 has been known to be downregulated in oral squamous cell carcinoma. Patients with high expression of TTTY14 have a longer survival time. Multivariate Cox analysis has shown that low expression of TTTY14 is an independent risk factor for prognosis in patients with oral squamous cells (Li et al., 2017). TTTY14 is also significantly downregulated in gastric cancer, and its low expression is one of the risk factors for poor prognosis. It participates in the construction of a model for predicting the prognosis of patients with gastric cancer (Miao et al., 2017). It has been found that LNCSRLR is upregulated in renal cell carcinoma patients with intrinsic sorafenib resistance. Highly expressed LNCSRLR directly binds to NF-κB and promotes IL-6 transcription, leading to activation of STAT3 and development of sorafenib resistance (Xu et al., 2017). LNCSRLR is involved in the construction of a model for predicting the prognosis of patients with cervical squamous cell carcinoma, and its high expression is one of the risk factors for poor prognosis (Mao et al., 2019). The results of these studies are consistent with our results, LINC02154 and LNCSRLR are risk factors for prognosis in patients with LSCC, and TTTY14 is a protective factor. No studies concerning the roles of other three lncRNAs in tumors were reported.
To further explore the association between clinical characteristics and PCGs, we performed a WGCNA, which identified PCGs modules associated with patient gender (darkgreen), clinical stage (grey60), T stage (greenyellow), and N stage (green). We took the intersection of clinically significant modules of WGCNA, differentially expressed PCGs between LSCC and normal samples, and PCGs co-expressed with six lncRNAs. The intersection PCGs survival analysis showed that STC2, TSPAN9, SMS, and TCEA3 affected the OS of LSCC. GO and KEGG enrichment indicated that PCGs co-expressed with six lncRNAs might be associated with the occurrence and progression of tumors. The images of IHC from The Human Protein Atlas database indicated that STC2, TSPAN9, SMS were high expression in LSCC, and TCEA3 was low expression in LSCC. More importantly, we analyzed the expression levels of the six lncRNAs and four PCGs in our own 25 LSCC patients between tumor tissues and adjacent normal tissues by RT-qPCR. The results showed that the six lncRNAs and four PCGs were differentially expressed between tumor tissues and adjacent normal tissues, supporting the analysis results from TCGA datasets.
Studies have shown that high expression of STC2 promotes hepatocellular carcinoma proliferation (Wu et al., 2017) and induces drug resistance, resulting in poor prognosis (Cheng et al., 2018). The expression of STC2 is closely related to the prognosis of tumor patients, and its high expression leads to poor prognosis in patients with breast cancer (Esseghir et al., 2007), nasopharyngeal carcinoma (Lin et al., 2014), colorectal cancer (Ieta et al., 2009), and renal cell carcinoma (Meyer et al., 2009). STC2 protein expression in LSCC tissues is associated with invasion into the thyroid cartilage, T stage, lymphatic metastasis, clinical stage, and pathological differentiation. Circulating STC2 mRNA is potentially useful blood markers, and STC2 protein may be a prognostic marker for poor outcome following surgery in LSCC (Zhou et al., 2014). These studies indicate that the high expression of STC2 is a risk factor for the prognosis of a variety of tumor including LSCC. TSPAN9 is lowly expressed in gastric cancer. Experimental studies have shown that TSPAN9 inhibits proliferation, migration, and invasion of gastric cancer cells through the ERK1/2 pathway (Li et al., 2016). This result indicates that TSPAN9 is a tumor suppressor. Polyamine metabolism abnormalities are often present in cancer cells. Multiple abnormalities in the control of polyamine metabolism and uptake may be responsible for increased levels of polyamines in cancer cells as compared to that of normal cells, and spermine synthase (SMS) is a member of the polyamine metabolic pathway. Treatment with an SMS inhibitor can be attempted in cancer (Thomas and Thomas, 2003). The SMS inhibitor showed a strong inhibitory effect on the growth of P388 leukemia cells (He et al., 1995). SMS inhibitors can significantly inhibit tumor cell growth, so SMS may be an oncogene. TCEA3 expression is significantly downregulated in gastric cancer tissues. Poor prognoses are observed in the low TCEA3 expression group compared to the high TCEA3 expression group. Functionally, upregulation of TCEA3 inhibits gastric cancer cell proliferation and colony formation, which may attenuate cell growth through apoptosis induction (Li et al., 2015). This result indicates that TCEA3 is a tumor suppressor. The above studies are consistent with our analysis. STC2 and SMS are risk factors, and TSPAN9 and TCEA3 are protective factors.
We successfully establish a prognostic model based on six-lncRNA RiskScore that effectively predicts the prognoses of patients with LSCC. This model helps risk stratification and provides more effective and personalized treatment for each patient. We initially analyzed the potential functions of six lncRNAs and screened the potential target PCGs of six lncRNAs. In the future, we will perform clinical studies to verify the predictive effects of the six-lncRNA prognostic model, and experimental studies to investigate the potential mechanisms of the six lncRNAs.
The datasets used for this study can be found in TCGA, https://portal.gdc.cancer.gov/.
The use of human tissue samples has been approved by the Ruijin Hospital Ethics Committee. The patients (or their parents or guardians) have signed the written informed consent form.
SG responsible for research design, data collection, bioinformatic analysis, RT-qPCR assay, and manuscript writing. MX responsible for research design, data collection, statistical analysis, and RT-qPCR assay. YZ responsible for data organization. YS guides research ideas, design and data interpretation. HZ guides research ideas, design, research methods, and manuscript revision.
This study was supported by Clinical Science and Technology Innovation Project of Shengkang Hospital Development Center, Grant/Award Number: SHDC12015144.
The authors declare that the research was conducted in the absence of any commercial or financial relationships that could be construed as a potential conflict of interest.
Thanks to Dr. Mingliang Xiang and other otolaryngologists in Ruijin Hospital for their kindly providing the LSCC specimens.
The Supplementary Material for this article can be found online at: https://www.frontiersin.org/articles/10.3389/fgene.2020.00413/full#supplementary-material
Almadori, G., Bussu, F., Cadoni, G., Galli, J., Paludetti, G., and Maurizi, M. (2005). Molecular markers in laryngeal squamous cell carcinoma: towards an integrated clinicobiological approach. Eur. J. Cancer 41, 683–693. doi: 10.1016/j.ejca.2004.10.031
Ayaz, L., Gorur, A., Yaroglu, H. Y., Ozcan, C., and Tamer, L. (2013). Differential expression of microRNAs in plasma of patients with laryngeal squamous cell carcinoma: potential early-detection markers for laryngeal squamous cell carcinoma. J. Cancer Res. Clin. Oncol. 139, 1499–1506. doi: 10.1007/s00432-013-1469-2
Bingol, F., Yoruk, O., Bingol, B. O., Erdemci, B., Ozkan, O., and Mazlumoglu, M. R. (2016). Estimation of the efficacy of chemo-radiotherapy on tumor regression in the patients with laryngeal cancer via computerized tomography using the Cavalieri method. Acta Otolaryngol. 136, 164–167. doi: 10.3109/00016489.2015.1096958
Chan, J. Y. K., Zhen, G., and Agrawal, N. (2018). The role of tumor DNA as a diagnostic tool for head and neck squamous cell carcinoma. Semin. Cancer Biol. 55, 1–7. doi: 10.1016/j.semcancer.2018.07.008
Chandra Gupta, S., and Nandan Tripathi, Y. (2017). Potential of long non-coding RNAs in cancer patients: from biomarkers to therapeutic targets. Int. J. Cancer 140, 1955–1967. doi: 10.1002/ijc.30546
Cheng, H., Wu, Z., Wu, C., Wang, X., Liow, S. S., Li, Z., et al. (2018). Overcoming STC2 mediated drug resistance through drug and gene co-delivery by PHB-PDMAEMA cationic polyester in liver cancer cells. Mater. Sci. Eng. C Mater. Biol. Appl. 83, 210–217. doi: 10.1016/j.msec.2017.08.075
Esseghir, S., Kennedy, A., Seedhar, P., Nerurkar, A., Poulsom, R., Reis-Filho, J. S., et al. (2007). Identification of NTN4, TRA1, and STC2 as prognostic markers in breast cancer in a screen for signal sequence encoding proteins. Clin. Cancer Res. 13, 3164–3173. doi: 10.1158/1078-0432.ccr-07-0224
Gong, S. Q., Xu, M., Xiang, M. L., Shan, Y. M., and Zhang, H. (2019). The expression and effection of MicroRNA-499a in high-tobacco exposed head and neck squamous cell carcinoma: a bioinformatic analysis. Front. Oncol. 9:678. doi: 10.3389/fonc.2019.00678
Gyawali, B., Shimokata, T., Honda, K., and Ando, Y. (2016). Chemotherapy in locally advanced head and neck squamous cell carcinoma. Cancer Treat. Rev. 44, 10–16. doi: 10.1016/j.ctrv.2016.01.002
He, Y., Shimogori, T., Kashiwagi, K., Shirahata, A., and Igarashi, K. (1995). Inhibition of cell growth by combination of alpha-difluoromethylornithine and an inhibitor of spermine synthase. J. Biochem. 117, 824–829. doi: 10.1093/oxfordjournals.jbchem.a124782
Huang da, W., Sherman, B. T., and Lempicki, R. A. (2009). Systematic and integrative analysis of large gene lists using DAVID bioinformatics resources. Nat. Protoc. 4, 44–57. doi: 10.1038/nprot.2008.211
Ieta, K., Tanaka, F., Yokobori, T., Kita, Y., Haraguchi, N., Mimori, K., et al. (2009). Clinicopathological significance of stanniocalcin 2 gene expression in colorectal cancer. Int. J. Cancer 125, 926–931. doi: 10.1002/ijc.24453
Jiang, C., Li, X., Zhao, H., and Liu, H. (2016). Long non-coding RNAs: potential new biomarkers for predicting tumor invasion and metastasis. Mol. Cancer 15:62.
Langfelder, P., and Horvath, S. (2008). WGCNA: an R package for weighted correlation network analysis. BMC Bioinformatics 9:559. doi: 10.1186/1471-2105-9-559
Li, J., Jin, Y., Pan, S., Chen, Y., Wang, K., Lin, C., et al. (2015). TCEA3 attenuates gastric cancer growth by apoptosis induction. Med. Sci. Monit. 21, 3241–3246. doi: 10.12659/msm.895860
Li, P. Y., Lv, J., Qi, W. W., Zhao, S. F., Sun, L. B., Liu, N., et al. (2016). Tspan9 inhibits the proliferation, migration and invasion of human gastric cancer SGC7901 cells via the ERK1/2 pathway. Oncol. Rep. 36, 448–454. doi: 10.3892/or.2016.4805
Li, S., Chen, X., Liu, X., Yu, Y., Pan, H., Haak, R., et al. (2017). Complex integrated analysis of lncRNAs-miRNAs-mRNAs in oral squamous cell carcinoma. Oral Oncol. 73, 1–9. doi: 10.1016/j.oraloncology.2017.07.026
Lin, C., and Yang, L. (2018). Long noncoding RNA in cancer: wiring signaling circuitry. Trends Cell Biol. 28, 287–301. doi: 10.1016/j.tcb.2017.11.008
Lin, S., Guo, Q., Wen, J., Li, C., Lin, J., Cui, X., et al. (2014). Survival analyses correlate stanniocalcin 2 overexpression to poor prognosis of nasopharyngeal carcinomas. J. Exp. Clin. Cancer Res. 33:26. doi: 10.1186/1756-9966-33-26
Livak, K. J., and Schmittgen, T. D. (2001). Analysis of relative gene expression data using real-time quantitative PCR and the 2(-Delta Delta C(T)) method. Methods 25, 402–408.
Mao, Y., Fu, Z., Dong, L., Zheng, Y., Dong, J., and Li, X. (2019). Identification of a 26-lncRNAs risk model for predicting overall survival of cervical squamous cell carcinoma based on integrated bioinformatics analysis. DNA Cell Biol. 38, 322–332. doi: 10.1089/dna.2018.4533
Meyer, H. A., Tolle, A., Jung, M., Fritzsche, F. R., Haendler, B., Kristiansen, I., et al. (2009). Identification of stanniocalcin 2 as prognostic marker in renal cell carcinoma. Eur. Urol. 55, 669–678. doi: 10.1016/j.eururo.2008.04.001
Miao, Y., Sui, J., Xu, S. Y., Liang, G. Y., Pu, Y. P., and Yin, L. H. (2017). Comprehensive analysis of a novel four-lncRNA signature as a prognostic biomarker for human gastric cancer. Oncotarget 8, 75007–75024. doi: 10.18632/oncotarget.20496
Nogueira, G. A., Lourenco, G. J., Oliveira, C. B., Marson, F. A., Lopes-Aguiar, L., Costa, E. F., et al. (2015). Association between genetic polymorphisms in DNA mismatch repair-related genes with risk and prognosis of head and neck squamous cell carcinoma. Int. J. Cancer 137, 810–818. doi: 10.1002/ijc.29435
Noh, J. H., and Gorospe, M. (2018). AKTions by cytoplasmic lncRNA CASC9 promote hepatocellular carcinoma survival. Hepatology 68, 1675–1677. doi: 10.1002/hep.30165
Noh, J. H., Kim, K. M., McClusky, W. G., Abdelmohsen, K., and Gorospe, M. (2018). Cytoplasmic functions of long noncoding RNAs. Wiley Interdiscip. Rev. RNA 9:e1471. doi: 10.1002/wrna.1471
Pich, A., Chiusa, L., and Navone, R. (2004). Prognostic relevance of cell proliferation in head and neck tumors. Annals Oncol. 15, 1319–1329. doi: 10.1093/annonc/mdh299
Quan, M., Chen, J., and Zhang, D. (2015). Exploring the secrets of long noncoding RNAs. Int. J. Mol. Sci. 16, 5467–5496. doi: 10.3390/ijms16035467
Schmitt, A. M., and Chang, H. Y. (2016). Long noncoding RNAs in cancer pathways. Cancer cell 29, 452–463. doi: 10.1016/j.ccell.2016.03.010
Seiler, J., Breinig, M., Caudron-Herger, M., Polycarpou-Schwarz, M., Boutros, M., and Diederichs, S. (2017). The lncRNA VELUCT strongly regulates viability of lung cancer cells despite its extremely low abundance. Nucleic Acids Res. 45, 5458–5469. doi: 10.1093/nar/gkx076
Serghiou, S., Kyriakopoulou, A., and Ioannidis, J. P. (2016). Long noncoding RNAs as novel predictors of survival in human cancer: a systematic review and meta-analysis. Mol. Cancer 15:50. doi: 10.1186/s12943-016-0535-1
Shen, Z., Li, Q., Deng, H., Lu, D., Song, H., and Guo, J. (2014). Long non-coding RNA profiling in laryngeal squamous cell carcinoma and its clinical significance: potential biomarkers for LSCC. PLoS One 9:e108237. doi: 10.1371/journal.pone.0108237
Solomon, B., Young, R. J., and Rischin, D. (2018). Head and neck squamous cell carcinoma: genomics and emerging biomarkers for immunomodulatory cancer treatments. Semin. Cancer Biol. 52(Pt 2), 228–240. doi: 10.1016/j.semcancer.2018.01.008
Stelow, E. B., Jo, V. Y., Stoler, M. H., and Mills, S. E. (2010). Human papillomavirus-associated squamous cell carcinoma of the upper aerodigestive tract. Am. J. Surg. Pathol. 34, e15–e24. doi: 10.1097/PAS.0b013e3181e21478
Tang, J., Kong, D., Cui, Q., Wang, K., Zhang, D., Gong, Y., et al. (2018). Prognostic genes of breast cancer identified by gene co-expression network analysis. Front. Oncol. 8:374. doi: 10.3389/fonc.2018.00374
Thomas, T., and Thomas, T. J. (2003). Polyamine metabolism and cancer. J. Cell. Mol. Med. 7, 113–126.
Tsai, M. C., Spitale, R. C., and Chang, H. Y. (2011). Long intergenic noncoding RNAs: new links in cancer progression. Cancer Res. 71, 3–7. doi: 10.1158/0008-5472.CAN-10-2483
Wang, P., Wu, T., Zhou, H., Jin, Q., He, G., Yu, H., et al. (2016). Long noncoding RNA NEAT1 promotes laryngeal squamous cell cancer through regulating miR-107/CDK6 pathway. J. Exp. Clin. Cancer Res. 35:22. doi: 10.1186/s13046-016-0297-z
Wang, S., Liang, K., Hu, Q., Li, P., Song, J., Yang, Y., et al. (2017). JAK2-binding long noncoding RNA promotes breast cancer brain metastasis. J. Clin. Investig. 127, 4498–4515. doi: 10.1172/JCI91553
Wong, N., Khwaja, S. S., Baker, C. M., Gay, H. A., Thorstad, W. L., Daly, M. D., et al. (2016). Prognostic microRNA signatures derived from the cancer genome Atlas for head and neck squamous cell carcinomas. Cancer Med. 5, 1619–1628. doi: 10.1002/cam4.718
Wu, F., Li, T. Y., Su, S. C., Yu, J. S., Zhang, H. L., Tan, G. Q., et al. (2017). STC2 as a novel mediator for Mus81-dependent proliferation and survival in hepatocellular carcinoma. Cancer Lett. 388, 177–186. doi: 10.1016/j.canlet.2016.11.039
Xie, J. J., Jiang, Y. Y., Jiang, Y., Li, C. Q., Lim, M. C., An, O., et al. (2018). Super-enhancer-driven long non-coding RNA LINC01503, regulated by TP63, is over-expressed and oncogenic in squamous cell Carcinoma. Gastroenterology 154, 2137.e1–2151.e1.
Xu, Z., Yang, F., Wei, D., Liu, B., Chen, C., Bao, Y., et al. (2017). Long noncoding RNA-SRLR elicits intrinsic sorafenib resistance via evoking IL-6/STAT3 axis in renal cell carcinoma. Oncogene 36, 1965–1977. doi: 10.1038/onc.2016.356
Zhang, H., Chen, Z., Wang, X., Huang, Z., He, Z., and Chen, Y. (2013). Long non-coding RNA: a new player in cancer. J. Hematol. Oncol. 6:37. doi: 10.1186/1756-8722-6-37
Zhou, H., Li, Y. Y., Zhang, W. Q., Lin, D., Zhang, W. M., and Dong, W. D. (2014). Expression of stanniocalcin-1 and stanniocalcin-2 in laryngeal squamous cell carcinoma and correlations with clinical and pathological parameters. PLoS One 9:e95466. doi: 10.1371/journal.pone.0095466
Zhuo, W., Liu, Y., Li, S., Guo, D., Sun, Q., Jin, J., et al. (2019). Long noncoding RNA GMAN, Up-regulated in gastric cancer tissues, is associated with metastasis in patients and promotes translation of Ephrin A1 by competitively binding GMAN-AS. Gastroenterology 156, 676.e11–691.e11.
Keywords: laryngeal squamous cell carcinoma, long non-coding RNA, prognostic signature, bioinformatic analysis, WGCNA
Citation: Gong S, Xu M, Zhang Y, Shan Y and Zhang H (2020) The Prognostic Signature and Potential Target Genes of Six Long Non-coding RNA in Laryngeal Squamous Cell Carcinoma. Front. Genet. 11:413. doi: 10.3389/fgene.2020.00413
Received: 29 January 2020; Accepted: 01 April 2020;
Published: 28 April 2020.
Edited by:
Graziano Pesole, National Research Council, ItalyReviewed by:
Anna Maria D’Erchia, University of Bari Aldo Moro, ItalyCopyright © 2020 Gong, Xu, Zhang, Shan and Zhang. This is an open-access article distributed under the terms of the Creative Commons Attribution License (CC BY). The use, distribution or reproduction in other forums is permitted, provided the original author(s) and the copyright owner(s) are credited and that the original publication in this journal is cited, in accordance with accepted academic practice. No use, distribution or reproduction is permitted which does not comply with these terms.
*Correspondence: Hao Zhang, emhhbmdoYW9lbnRAMTYzLmNvbQ==; Yamin Shan, bWljcm9lZ2dAMTYzLmNvbQ==
†These authors have contributed equally to this work
Disclaimer: All claims expressed in this article are solely those of the authors and do not necessarily represent those of their affiliated organizations, or those of the publisher, the editors and the reviewers. Any product that may be evaluated in this article or claim that may be made by its manufacturer is not guaranteed or endorsed by the publisher.
Research integrity at Frontiers

Learn more about the work of our research integrity team to safeguard the quality of each article we publish.