 Geert Callewaert1*
 Petra D’hooge1
 Tien-Yang Ma1,2
 Mara Del Vecchio2Vincent Van Eyck1
 Vanessa Franssens2
 Joris Winderickx2*
- 1The Yeast Hub Lab, KU Leuven, Kortrijk, Belgium
- 2Functional Biology, Department of Biology, KU Leuven, Heverlee, Belgium
The yeast Saccharomyces cerevisiae is a powerful model to study the molecular mechanisms underlying α-synuclein (α-syn) cytotoxicity. This is due to the high degree of conservation of cellular processes with higher eukaryotes and the fact that yeast does not endogenously express α-synuclein. In this work, we focused specifically on the interplay between α-syn and intracellular Ca2+ homeostasis. Using temperature-sensitive SEC4 mutants and deletion strains for the vacuolar Ca2+ transporters Pmc1 and Vcx1, together with aequorin-based Ca2+ recordings, we show that overexpression of α-syn shifts the predominant temporal pattern of organellar Ca2+ release from a biphasic to a quasi-monophasic response. Fragmentation and vesiculation of vacuolar membranes in α-syn expressing cells can account for the faster release of vacuolar Ca2+. α-Syn further significantly reduced Ca2+ storage resulting in increased resting cytosolic Ca2+ levels. Overexpression of the vacuolar Ca2+ ATPase Pmc1 in wild-type cells prevented the α-syn-induced increase in resting Ca2+ and was able to restore growth. We propose that α-syn-induced disruptions in Ca2+ signaling might be an important step in initiating cell death.
Introduction
α-Syn misfolding and aggregation are linked to Parkinson’s disease (PD) (Poewe et al., 2017). Duplication or triplication of the SNCA gene that encodes α-syn and several point mutations (E46K, A53T, A30P, G51D, and H50Q) are associated with the formation of cytoplasmic protein inclusions and cytotoxicity (Polymeropoulos et al., 1997; Krüger et al., 1998; Singleton et al., 2003; Chartier-Harlin et al., 2004; Zarranz et al., 2004; Tofaris and Spillantini, 2007; Auluck et al., 2010; Lashuel et al., 2012; Appel-Cresswell et al., 2013; Lesage et al., 2013; Ghiglieri et al., 2018). Based on the current knowledge, oligomers of α-syn play a central role in cytotoxicity by impairing a variety of cellular processes. However, the relative contribution of these processes in initiating cytotoxicity and the precise nature of toxic α-syn forms remain uncertain and studies often yield conflicting results (Peelaerts et al., 2015; Pinotsi et al., 2016).
The yeast Saccharomyces cerevisiae is a well-founded model system for studying fundamental cellular processes relevant to higher eukaryotes. The high degree of conservation of protein folding and degradation, Ca2+ homeostasis and vesicle trafficking between yeast and higher eukaryotes and the fact that yeast does not express homologs of the human synuclein family allow to exploit yeast as a platform to study the molecular mechanisms underlying α-syn cytotoxicity (Franssens et al., 2010). Analysis of various yeast models for α-syn has shown that overexpression of wild-type or mutant α-syn results in growth inhibition and the formation of cytotoxic intracellular inclusions. Several yeast targets for α-syn-induced toxicity have been identified including vesicular transport (Outeiro and Lindquist, 2003; Cooper et al., 2006) mitochondrial functions (Büttner et al., 2008) proteasomal function (Sharma et al., 2006) and Ca2+ homeostasis (Büttner et al., 2013; Rcom-H’cheo-Gauthier et al., 2014) each confirming or supporting data obtained in other eukaryotic models. Hence, the cytotoxicity induced by overexpression or mutations of α-syn appears to reflect a combination of different mechanisms acting together or consecutively. Dissecting out the relative significance of each mechanism remains challenging.
In this work, we focus specifically on the interplay between α-syn and intracellular Ca2+ homeostasis. The importance of cytosolic Ca2+ homeostasis in neurodegenerative diseases, including PD has been underlined in several studies (Chan et al., 2009; Hettiarachchi et al., 2009; Pasternak et al., 2012; Tosatto et al., 2012; Rcom-H’cheo-Gauthier et al., 2014; Angelova et al., 2016). In all eukaryotes, intracellular Ca2+ signaling is crucial for multiple biological processes involving channels, co-transporters and pumps. Dopaminergic neurons in PD are particularly vulnerable to disruptions in Ca2+ homeostasis due to their distinctive pacemaker activity, which is heavily reliant on Ca2+ entry (Pacelli et al., 2015). α-Syn probably interacts with components of the Ca2+ toolkit altering Ca2+ homeostasis and triggering downstream toxic effects. Previous studies in mammalian cells have mainly focused on the effects of externally applied α-syn oligomers on Ca2+ homeostasis. The results of these studies suggest that α-syn oligomers may alter ion (Ca2+) homeostasis by either forming membrane pores (leak channels) (Danzer et al., 2007; Angelova et al., 2016) or affecting ion transporters (Ca2+ channels and Na+/K+ pumps) (Adamczyk and Strosznajder, 2006; Shrivastava et al., 2015). Previously, we have shown that expression of α-syn in yeast affects Ca2+ homeostasis by increasing basal cytosolic Ca2+ levels and TECC responses (Transient Elevation of Cytosolic Calcium) (Büttner et al., 2013). It was demonstrated that chelating free Ca2+ with BAPTA or deletion of PMR1, encoding a Secretory Pathway Calcium ATPase (SPCA) that transports Ca2+ and Mn2+ into the Golgi complex, largely suppressed α-syn-induced Ca2+ changes. Since Ca2+ efflux across the plasma membrane in yeast may rely on vesicular exocytosis, we proposed that defects in vesicular trafficking may underlie α-syn-induced Ca2+ dysregulation.
Several studies have demonstrated that α-syn overexpression strongly inhibits vesicle trafficking, thereby disrupting normal processing and transport of proteins within the secretory pathway. At physiological concentrations, the function of α-syn is closely related to SNARE complex formation and/or stabilization (Burre et al., 2014). Whereas α-syn overexpression and the formation of oligomers may inhibit SNARE and RAB/Sec functions leading to reduced secretory activity (Choi et al., 2013). In yeast, it has been shown that several Sec proteins mislocalize to α-syn inclusions while their overexpression reduces α-syn-mediated cytotoxicity (Gitler et al., 2008).
To further unravel the plausible link between α-syn overexpression, Ca2+ homeostasis and vesicular transport, we analyzed the effects of α-syn overexpression on intracellular Ca2+ handling and storage in temperature-sensitive SEC4 mutants and deletion strains for the vacuolar Ca2+ transporters Pmc1 and Vcx1. We provide evidence that α-syn overexpression in yeast significantly affects basal Ca2+ levels and Ca2+ storage. Furthermore, we show that α-syn alters Ca2+ handling through two distinct mechanisms involving α-syn-mediated disruption of vesicle trafficking and vacuolar Ca2+ storage.
Materials and Methods
Yeast Strains, Plasmids and Media
Single and double deletion strains were derived from the BY4741 strain background (genotype MATa his3-1, leu20, met150, ura30, Euroscarf, Frankfurt, Germany). The sec4ts strain (strain LRB932, genotype MATa his3, leu2, ura3-52, sec4-2, doi: 10.1242/jcs.00203) was derived from the LRB906 strain background (Genotype Mata his3, leu2, ura3-52, doi: 10.1242/jcs.00203). PMC1 and VCX1 deletion strains in the BY4741 background were obtained from the yeast deletion collection (Giaever and Nislow, 2014). YPD medium containing 2% peptone, 1% yeast extract and 2% glucose was used for growth and maintenance of yeast cells. Synthetic complete medium containing 0.19% yeast nitrogen base without amino acids, 0.5% ammonium sulfate supplemented with synthetic drop out amino-acid/nucleotide mixture and 2% glucose was used for selection, growth, and maintenance of transformed yeast strains. Transformation of yeast cells was performed following the lithium/polyethylene glycol method (Gietz Daniel et al., 1995). To monitor cytosolic Ca2+ levels, strains were transformed with pYX212 vector encoding cytosolic apoaequorin (pYX212-cytAEQ) (a kind gift from E. Martegani, Department of Biotechnology and Biosciences, University of Milano-Bicocca, Milan, Italy) (Tisi et al., 2002). The expression of wild-type α-syn was under the control of the TPI promoter (Liu et al., 2012) in the pGGE181 vector (pGGE181-α-syn). Cells transfected with empty vector (EV) (pGGE181-EV) served as controls. To obtain SEC4 overexpression cells were transformed with pAG423GPD-Sec4 plasmid while the pAG423GPD-ccdB-HA plasmid served as EV control. PMC1 was expressed with the pYX222 plasmid under control of the TPI promoter. For confocal microscopy (Zeiss LSM 710 laser scanning microscope using a 100x high-NA objective) α-syn C-terminally tagged with yeast enhanced green fluorescent protein (α-syn-yeGFP) was expressed in the pYX212 vector (pYX212-α-syn-yeGFP) under control of the TPI promoter.
To visualize Pmc1 distribution in α-syn expressing cells, BY4741 cells were co-transformed with pPMC1-GFP fusion plasmid (a kind gift from P.A. Pedersen, Department of Biology, University of Copenhagen, Copenhagen, Denmark) (Scharff-Poulsen and Pedersen, 2013) and pGGE181-α-syn. Cells transformed with pGGE181-EV served as control. For FM4-64 staining of vacuoles, transformed cells were grown in synthetic medium until late exponential phase, incubated with 30 μM FM4-64 (Thermo Fisher) at 30°C for 60 min and washed twice with fresh synthetic medium. Fluorescence was visualized with a Leica DM4000B or DMi8 microscope. Images were deconvolved with Huygens Essential (v18.04, Scientific Volume Imaging) and further processed with Fiji (v1.52p) (Schindelin et al., 2012).
SDS-Page and Western Blotting
Total protein extracts were prepared from samples taken at 2 OD600 (optical density at 600 nm) units in sample buffer containing 50 mM Tris, pH 8, 2% SDS, 0.1% bromophenol blue, 10% glycerol. Antibodies used were: Anti-α-synuclein (Sigma, S3062, 1:1000), Anti-ADH2 (Chemicon, AB1202, 1:10000) and mouse Anti-rabbit complexed with HRP (Santa Cruz, 1:1000). Membranes were blocked in TBS-T (0.05% Tween-20) with 5% BSA. Antibodies were diluted in TBS-T (0.05% Tween-20) with 5% BSA. Primary antibodies were incubated overnight at 4°C. The secondary antibody was incubated for 1 h at room temperature.
RNA Extraction and qPCR
To determine gene expression, one OD600 unit of cells was harvested from overnight cultures grown at the permissive temperature (25°C). Harvested cells were incubated at 37°C for 1 h in growth medium and then switched to 100 μl Y1-buffer (EDTA 0.1 M, Sorbitol 1 M, Lyticase 50 U/ml, 0.1% β-mercaptoethanol, buffered at pH 7.4 with 1 M KOH) for 30 min at 30°C with gentle shaking in order to generate spheroplasts. Total RNA was extracted using the “RNeasy mini kit” (Qiagen). cDNA was generated using the “Transcriptor First Strand cDNA Synthesis Kit” (Roche) starting from 1 μg total RNA, using the Anchored-oligo(dT)18 Primers delivered with the kit. Unpurified cDNA was diluted 1/10 before use in quantitative-PCR using the “Lightcycler® 480 SYBR Green I Master” kit (Roche). Primer sets used with respective efficiencies and final concentrations were: (1) Pmc1 forward primer TCACCACGTTTTAGTCGG, Pmc1 reverse primer AGTTATCCACCGGAAATTTCTG, %E = 85, final concentration = 250 nM (2) Act1 forward primer AGGTTGCTGCTTTGGTTATTG, Act1 reverse primer TGACCCATACCGACCATG, %E = 91, final concentration = 250 nM. Program settings were as follows: pre-incubation at 95°C for 10 min; 40 amplification cycles 10 s at 95°C, 15 s at 53°C and 15 s at 72°C. The Pfaffl method was used to determine relative gene expression in order to compensate for varying primer efficiencies. ACT1 was used as reference gene.
Cytosolic Ca2+ Measurements Using Aequorin
Cytosolic Ca2+ levels ([Ca2+]in) were measured in populations of yeast cells expressing apoaequorin as previously described (Büttner et al., 2013). Briefly, yeast cells were transformed with the necessary vectors including pYX212 encoding the apoaequorin gene under the control of TPI promoter. Starting from pre-cultures (OD600 of ±2–3), two OD600 units were plated on Concanavalin A coated coverslips and incubated at 25°C for 1 h. For aequorin reconstitution, cells were washed with 0.1 M 2-(N-morpholino) ethanesulfonic acid (MES)/ Tris pH 6.5 and incubated with 0.1 M MES/Tris, pH 6.5 supplemented with 5 μM wild-type coelenterazine (Promega) at either 37°C (non-permissive or restrictive temperature), 30 or 25°C (permissive temperatures) for 1 h. After removing excess of coelenterazine, coverslips with adherent yeast cells were placed in the perfusion chamber of a single-tube luminometer (photomultiplier tube for photon detection (Type H3460-04, Hamamatsu Photonics, Japan) positioned about 2 cm above the coverslip surface) and perfused with the required solutions at either 37°C (non-permissive temperature), 30 or 25°C (permissive temperatures). Adherent cells were initially perfused with 0.1 M MES/Tris, pH 6.5, followed by 0.1 M MES/Tris, pH 6.5 supplemented with 10 mM CaCl2. To estimate intracellular Ca2+ storage (D’hooge et al., 2015), cells were exposed for 90 s to a Ca2+-free medium containing (in mM): 200 KCl, 100 NaCl, 3 EGTA, 20 Hepes/KOH at pH 6.8 and then permeabilized with 0.5% Triton X-100 in the same medium. At the end of all experiments, the residual reconstituted aequorin was completely discharged by perfusing the cells with a solution containing 10 mM CaCl2 and 0.5% Triton X-100. Light impulses originating from the entire yeast cell population were discriminated, pre-scaled and integrated (1 s time interval) with a PC-based 32-bit counter/timer board (PCI-6601, National Instruments Corporation, Austin, TX, United States). The emitted light was calibrated offline into cytosolic Ca2+ values using the following algorithm [Ca2+]in = ((L/Lmax)1/3+[KTR(L/Lmax)1/3-1)/(KR(L/Lmax)1/3]) with KTR and KR the constants for the Ca2+-unbound and Ca2+-bound state, respectively (Bonora et al., 2013), L the luminescence intensity at any time point and Lmax the integrated luminescence (Allen and Blinks, 1978; Bonora et al., 2013; D’hooge et al., 2015). Data presented for [Ca2+]in in this study are all averages of replicate traces (with n the number of coverslips tested) (Supplementary Figure S1).
Determination of Growth Profiles
Following Ca2+ measurements, the same cultures were used to inoculate new cultures at a starting OD600 of 0.01. Growth was quantified by measuring the OD600 over a 72 h period at 25°C (96-well plate reader Multiskan Go, Thermo Scientific). Absorbance data were averaged for each condition and plotted as a function of time. Based on the log-transformed growth profiles, we calculated the half-times for growth (t50) of each strain, i.e., the time necessary to reach half-maximal OD600.
Statistical Analysis
Results are expressed as mean ± standard deviation (SD) or standard error of mean (SEM) as indicated. One-way analysis of variance (ANOVA) with Bonferroni posttest and unpaired Student’s t-test were used to determine statistical significance between datasets.
Results
α-Syn Impairs Ca2+ Homeostasis and Inhibits Growth in WT Yeast
To evaluate the effects of α-syn expression on intracellular Ca2+ homeostasis, we monitored cytosolic [Ca2+] ([Ca2+]in) after removal of extracellular Ca2+ (Rest [Ca2+]) and estimated the Ca2+ storage by monitoring the release of Ca2+ from intracellular stores when cells were permeabilized in Ca2+-free medium (Peak [Ca2+]). Figure 1A shows the release of stored Ca2+ in wild-type LRB906 cells at 37°C (Figure 1A – black trace – see also Supplementary Figures S1A,B). Cells were initially perfused with a 10 mM Ca2+ external solution and after switching to Ca2+ free medium they were permeabilized using Triton X-100. In 10 mM Ca2+ external solution [Ca2+]in amounted to 530 nM and rapidly decayed in Ca2+-free medium to nearly zero. Subsequent permeabilization of the membrane evoked a biphasic Ca2+ release transient. The initial fast phase with a time-to-peak of about 50 s, referred to as the ‘fast Ca2+ release component’, may correspond to release of free Ca2+ stored in organelles, whilst the second larger and slower component with a time-to-peak value of about 2 min 20 s, referred to as the ‘slow Ca2+ release component’, may comprise release of Ca2+ bound to the organellar matrix and largely reflects vacuolar Ca2+ storage (D’hooge et al., 2015). For the LRB906 strains, the [Ca2+]in values determined at the end of the Ca2+-free period before permeabilization (Rest [Ca2+]) as well as the peak amplitude of the Ca2+ release transient taken as the maximum of the biphasic Ca2+ release transient (Peak [Ca2+]) are listed in Table 1.
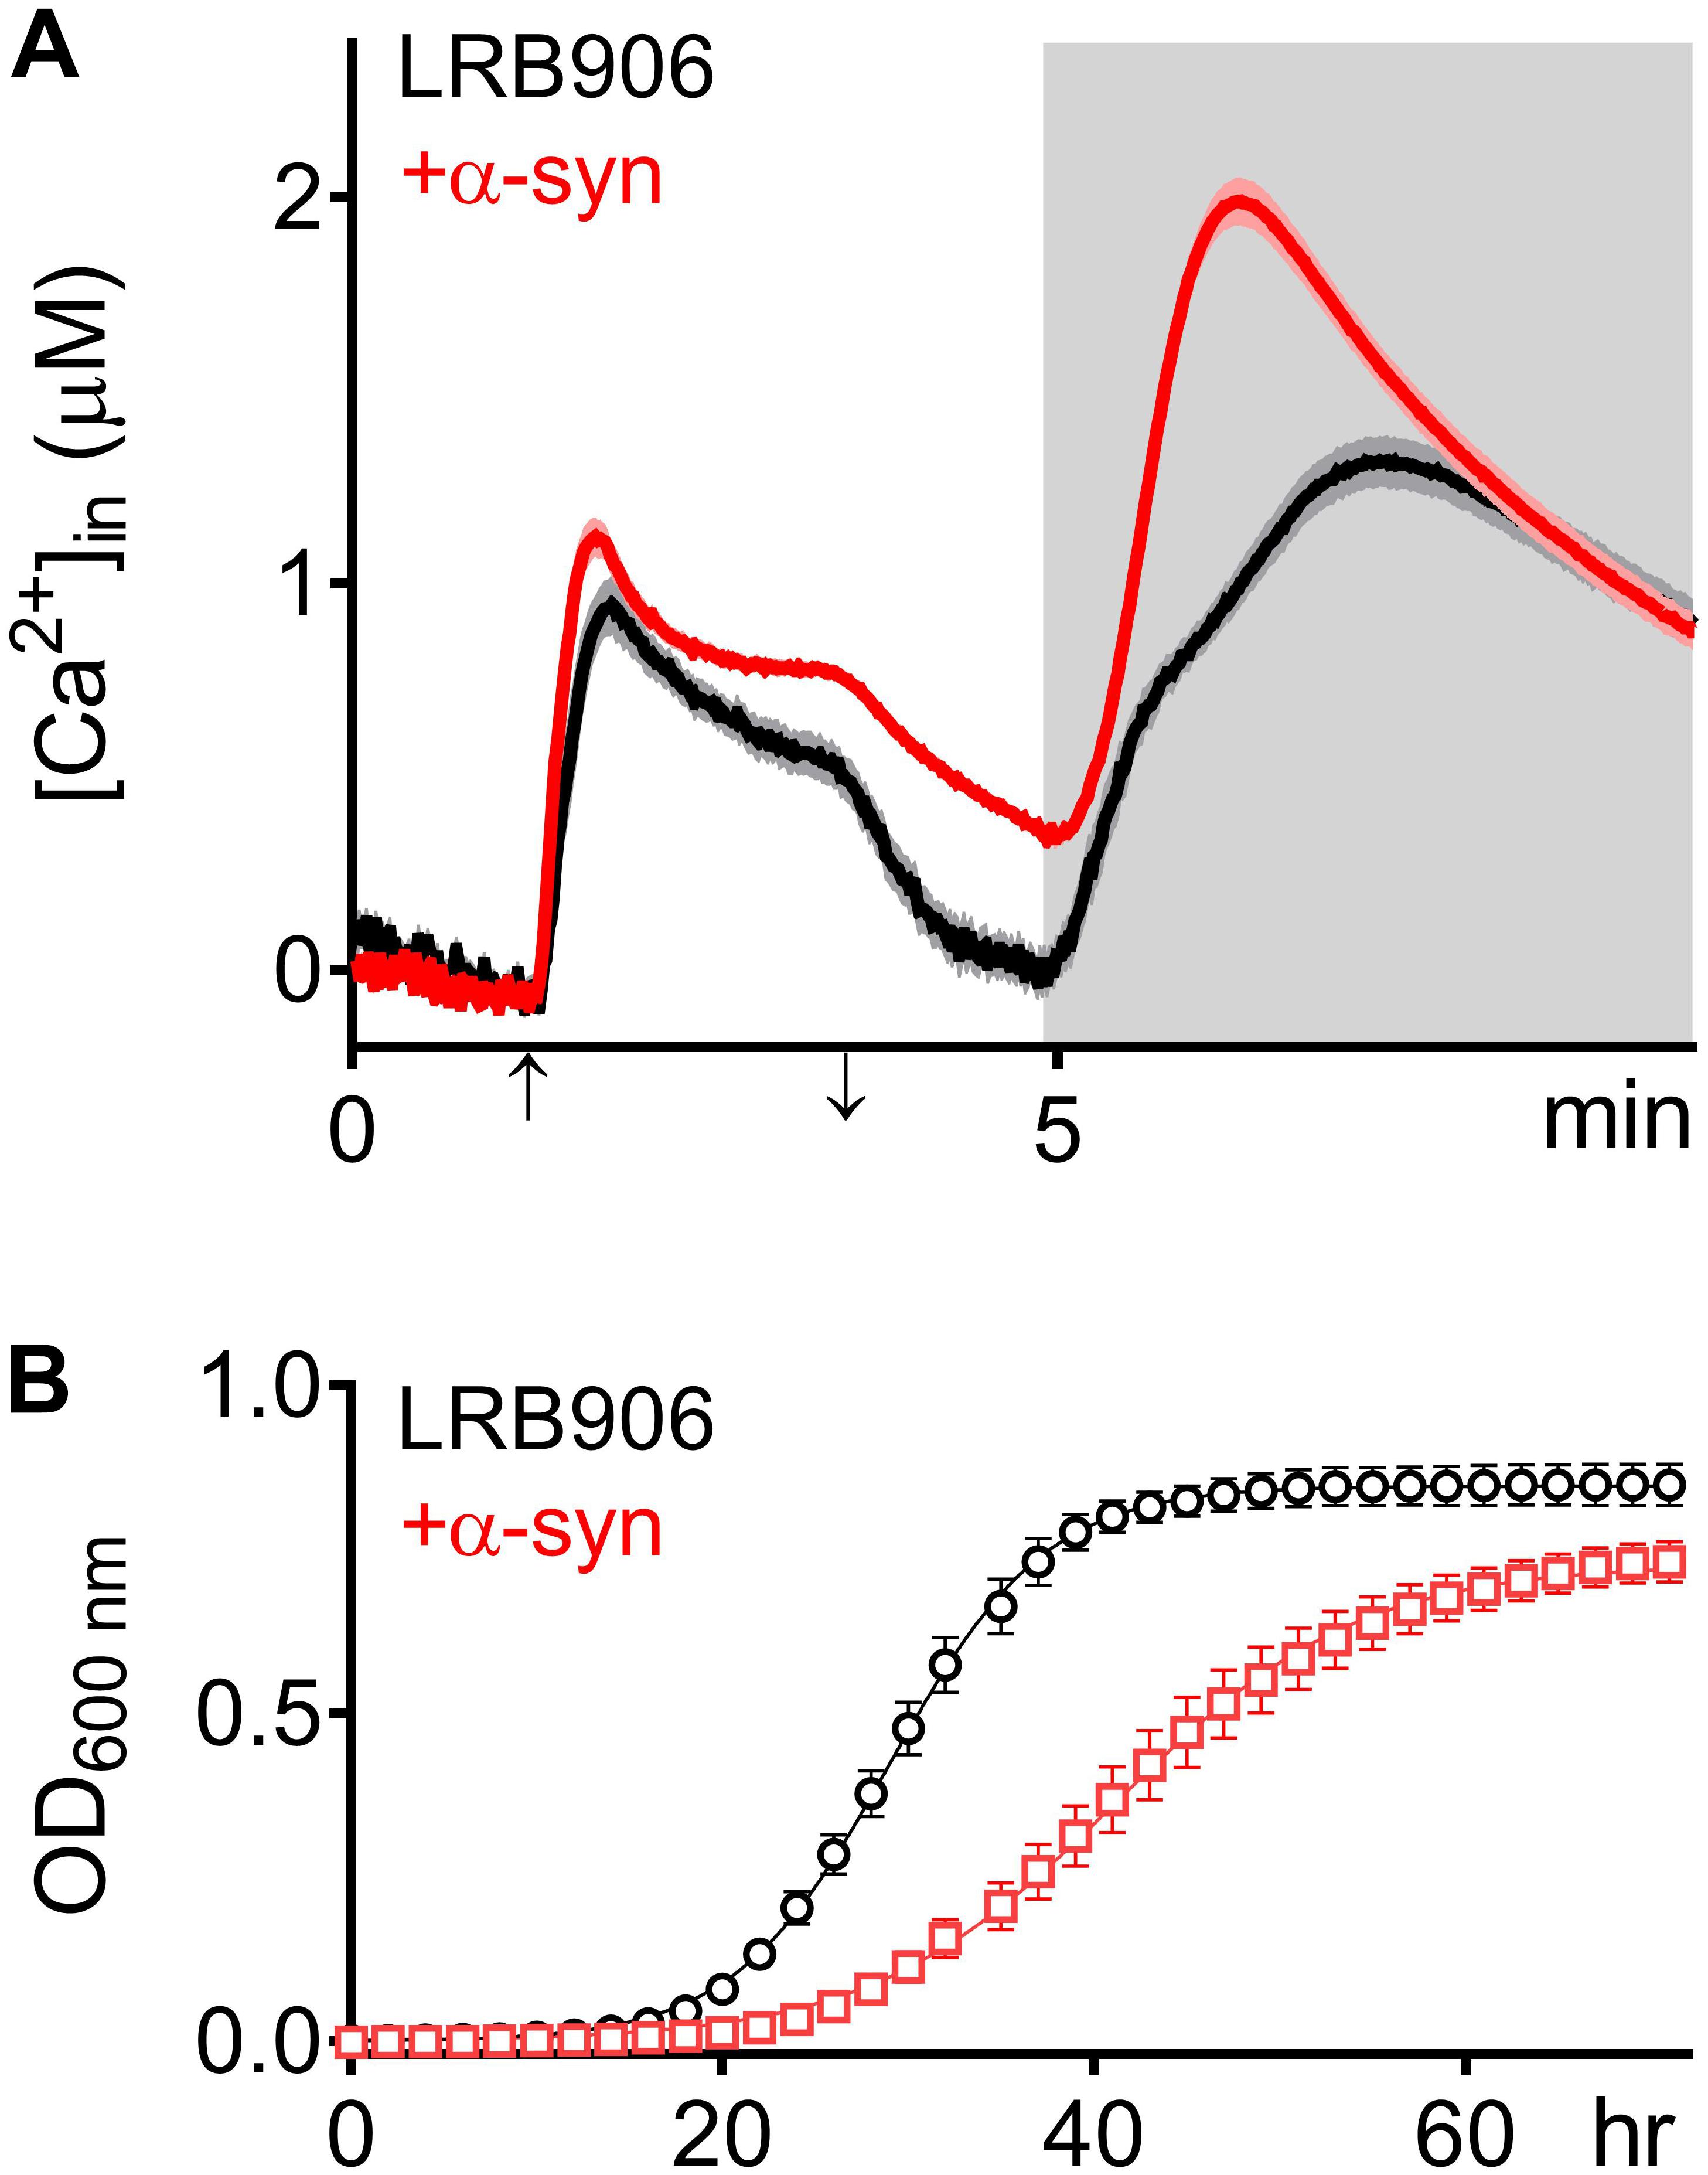
Figure 1. α -Syn overexpression in LRB906 cells. (A) Averaged Ca2+ transient ± SEM (thin lines either side of the Ca2+ transient trajectory) of LRB906 (black trace) and LRB906 cells overexpressing α-syn (+α-syn – red trace) at 37°C. Cells were initially perfused with Ca2+-free starvation medium and then transferred to a 10 mM external Ca2+ medium for 2 min (indicated by up and down arrow on X-axis). Thereafter, cells were briefly exposed to Ca2+-free intracellular medium prior to membrane permeabilization using Triton X-100 (indicated by light gray zone). (B) Growth curves based on OD600 density measurements at 25°C of LRB906 (black) and LRB906 cells overexpressing α-syn (+α-syn – red curve). Each time point represents the average ± SEM of triplicate cultures.
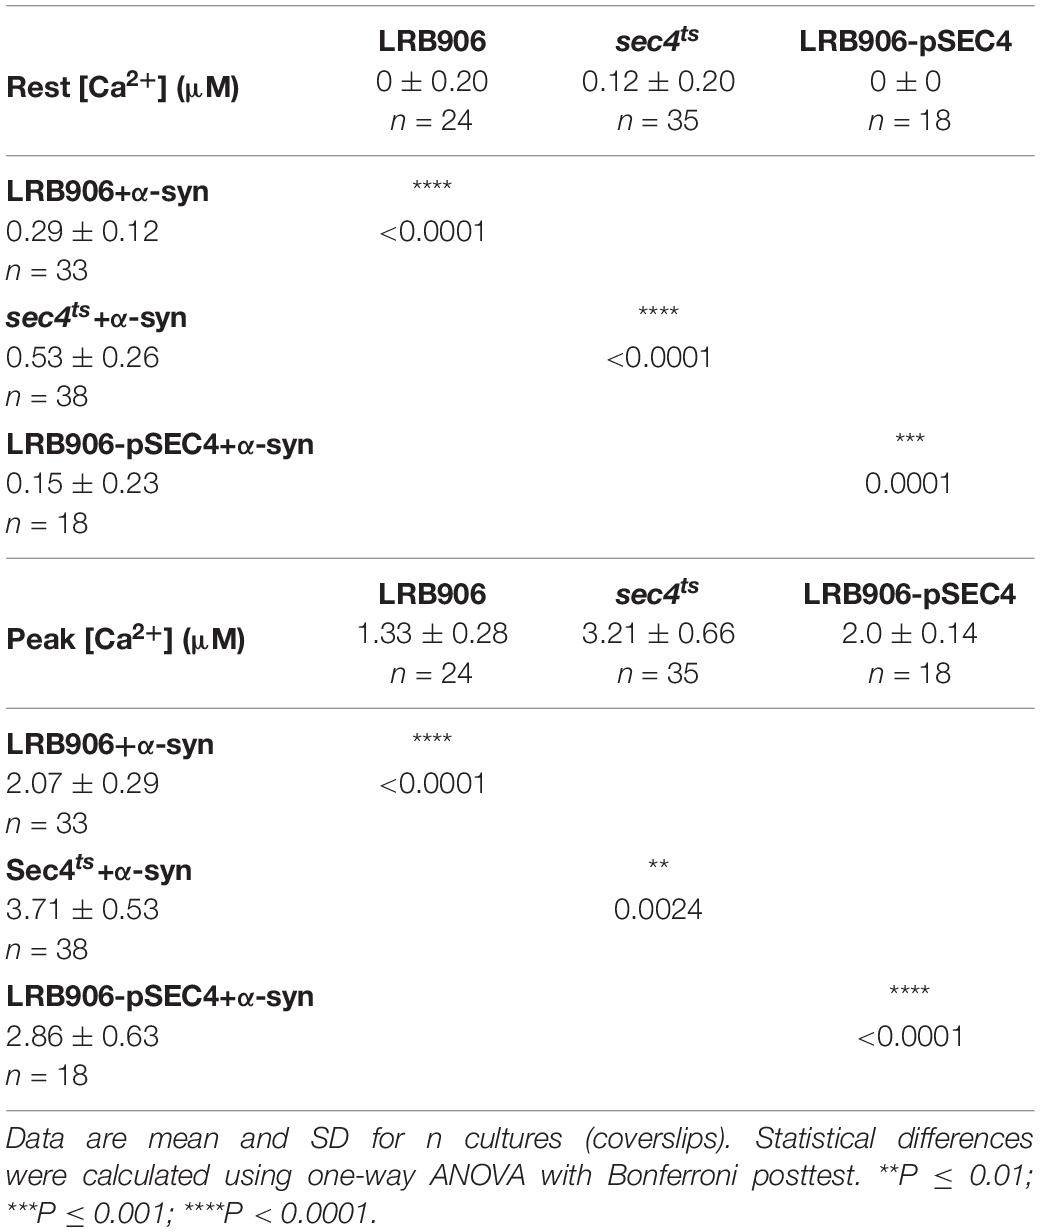
Table 1. [Ca2+]in determined at the end of the Ca2+-free period (Rest [Ca2+]) (before membrane permeabilization) and the peak amplitude of the Ca2+ release transient (Peak [Ca2+]) in LRB906 yeast strains at 37°C.
When the same experiment was repeated in LRB906 cells that overexpressed α-syn, cells displayed (1) elevated cytosolic Ca2+ levels in 10 mM external Ca2+ (775 nM); (2) incomplete decay of [Ca2+]in after switching to Ca2+-free medium (Rest [Ca2+] 0.29 ± 0.12 μM); (3) a quasi-monophasic Ca2+ release transient with increased peak [Ca2+] (Peak [Ca2+] 2.07 ± 0.29 μM attained 1 min 15 s after membrane permeabilization) and (4) a faster decay rate (Figure 1A – red trace – see also Supplementary Figures S1C,D).
As shown in Figure 1B, α-syn-induced Ca2+ changes were accompanied by significant growth inhibition measured at 25°C. Specifically, LRB906 cells overexpressing α-syn reached half time for growth (t50) after 42.27 ± 5.84 h, resulting in a significant Δt50 of 12.3 h relative to wild-type LRB906 cells transformed with an empty plasmid (t50 of 29.97 ± 2.99 h). The t50 values are listed in Table 2.
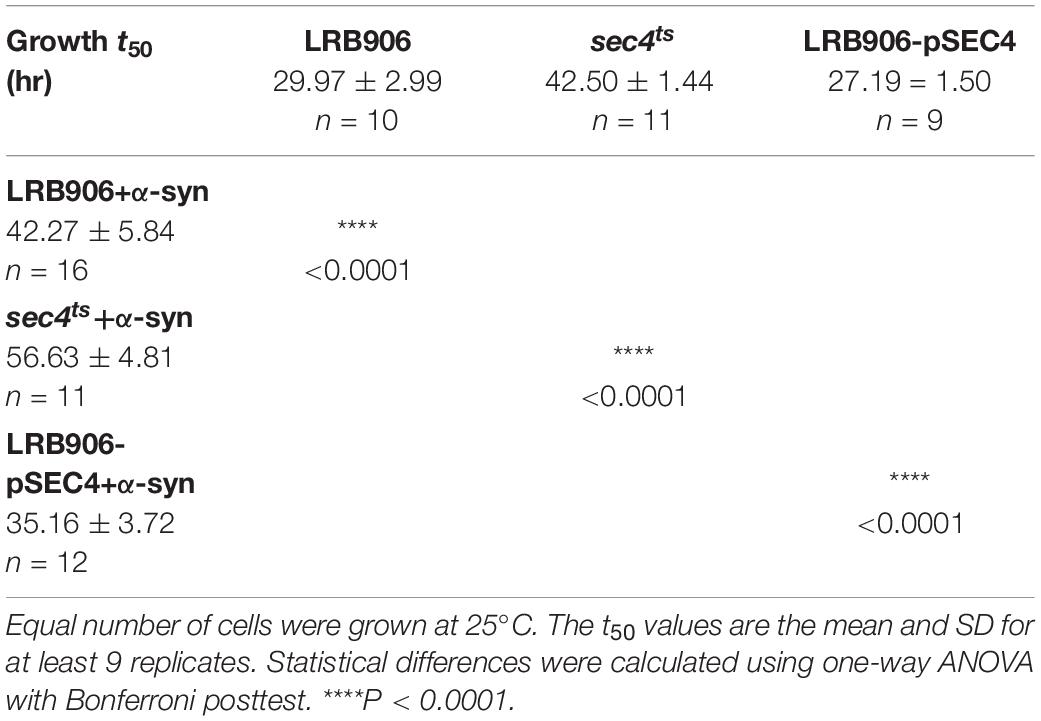
Table 2. Growth of LRB906 yeast strains.
α-Syn Induces a Shift From Biphasic to Quasi-Monophasic Ca2+ Release
There is compelling evidence that α-syn interferes with exocytotic pathways in both yeast and mammalian cells (Gitler et al., 2008; Choi et al., 2013; Burre et al., 2014). To exploit whether the α-syn-induced Ca2+ changes are directly linked to deficits in exocytosis, we designed a series of experiments using yeast cells carrying a temperature-sensitive (ts) mutation in SEC4 (sec4ts). Sec4, an ortholog of human Rab8, is a small G-protein required for delivery and initial docking of secretory vesicles at the plasma membrane.
At permissive temperature (25°C), the Ca2+ responses in sec4ts cells are very similar to those in wild-type LRB906 cells showing complete cytosolic [Ca2+] decay after switching to Ca2+-free medium and biphasic release of stored Ca2+ following membrane permeabilization (Supplementary Figure S2). However, as compared to wild-type LRB906 cells, the Ca2+ storage in sec4ts cells was significantly larger (Table 1). In addition, sec4ts cells grew slower than wild-type LRB906 cells (Table 2). At the restrictive temperature of 37°C, the decay of [Ca2+]in after switching to Ca2+-free medium in sec4ts cells was somewhat slowed down (Zero [Ca2+] 0.12 ± 0.20 μM), but much more strikingly was that the Ca2+ release following membrane permeabilization became monophasic with a much higher peak value (Peak [Ca2+] 3.21 ± 0.66 μM) and a faster decay rate (Figure 2A – blue trace – see also Supplementary Figure S2) as compared to wild-type LRB906 cells (Figure 2A – black trace). This monophasic Ca2+ release transient is clearly reminiscent of the one observed in LRB906 cells overexpressing α-syn (Figure 2A – green trace). Assuming that the large monophasic Ca2+ release transient in sec4ts cells at restrictive temperature reflects a rapid release of Ca2+ from clusters or pools of vesicles that can no longer undergo membrane fusion or exocytosis, our results may suggest that the α-syn-induced shift from biphasic to quasi-monophasic Ca2+ release reflects the effects of α-syn on vesicular dynamics.
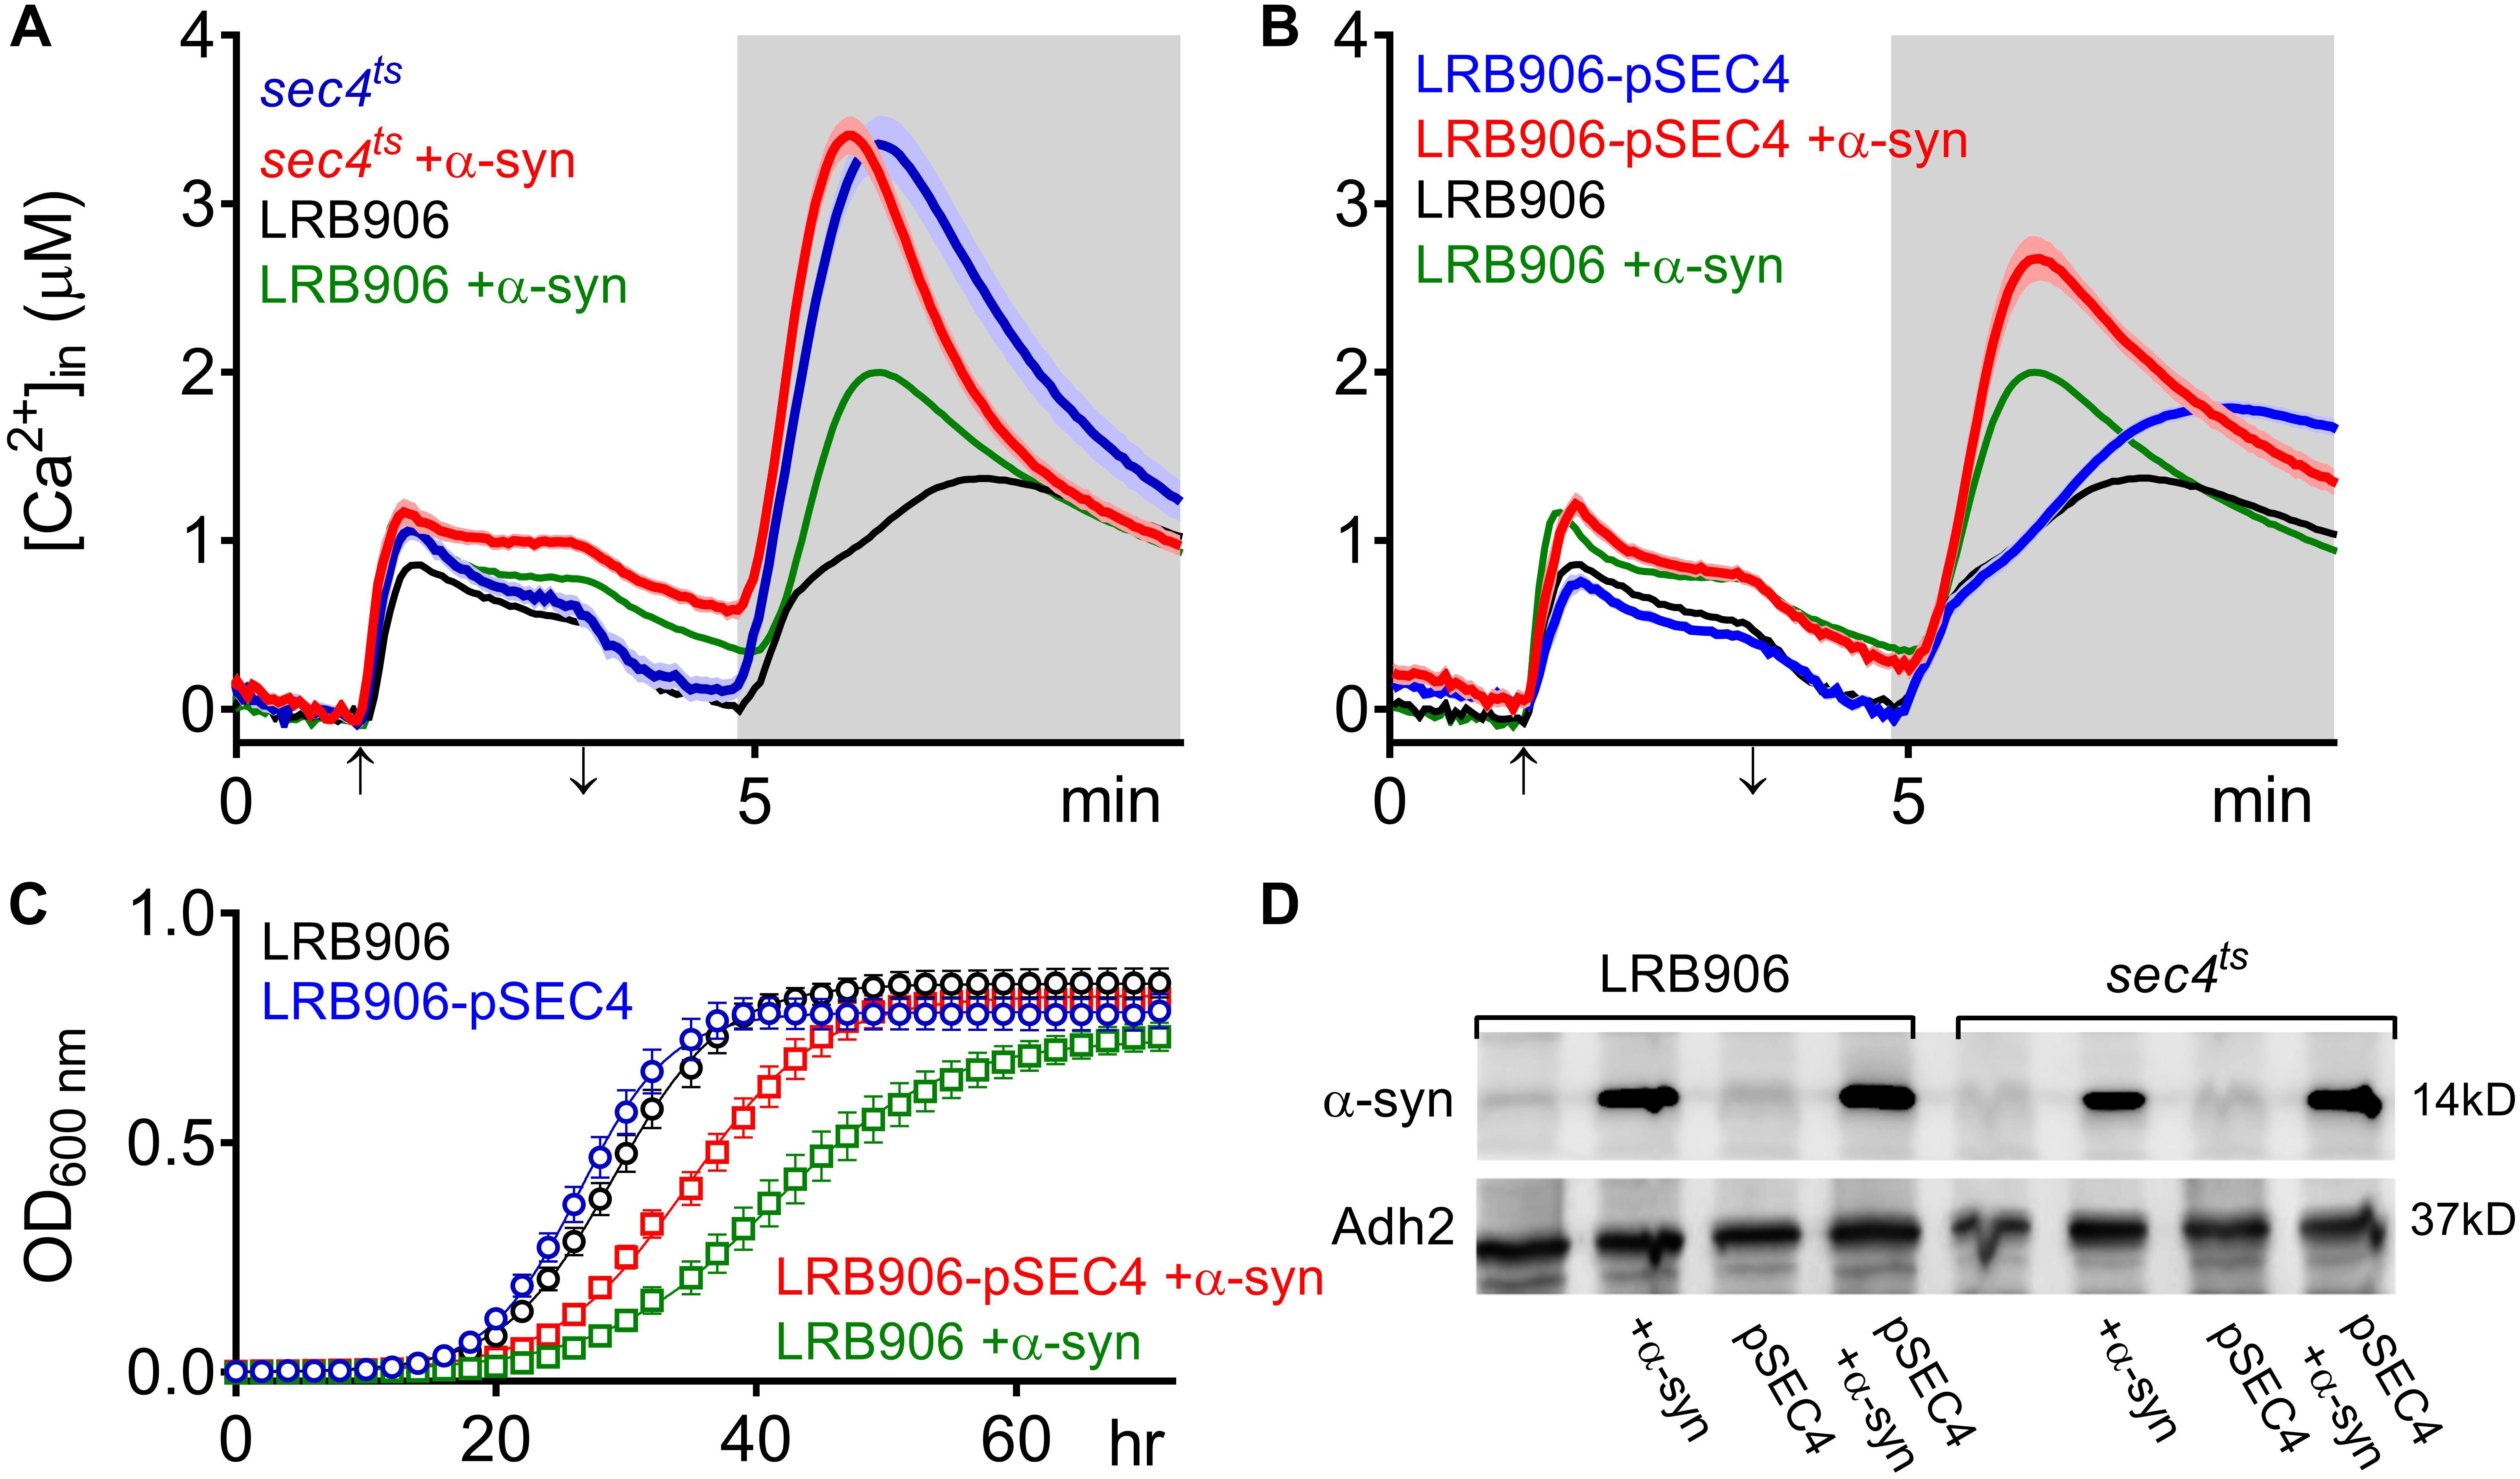
Figure 2. α-Syn overexpression in SEC4 mutant cells. (A,B) Averaged Ca2+ transient ± SEM (thin lines either side of the Ca2+ transient trajectory) of sec4ts (A) and LRB906 cells overexpressing SEC4 (LRB906-pSEC4) (B) with and without α-syn expression as compared to LRB906 cells at 37°C. Cells were initially perfused with Ca2+-free starvation medium and then transferred to a 10 mM external Ca2+ medium for 2 min (indicated by up and down arrow on X-axis). Thereafter, cells were briefly exposed to Ca2+-free intracellular medium prior to membrane permeabilization using Triton X-100 (indicated by light gray zone). (C) Growth curves based on OD600 density measurements at 25°C. Strains analyzed include LRB906 (black), LRB906 overexpressing SEC4 (LRB906-pSEC4 – blue), LRB906 overexpressing α-syn (LRB906 +α-syn – green) and LRB906 overexpressing SEC4 and α-syn (LRB906-pSEC4 +α-syn – red). Each time point represents the average ± SEM of triplicate cultures. (D) Western blot of control LRB906 cells and cells overexpressing SEC4 (pSEC4) with and without α-syn overexpression (first 4 lanes), and control sec4ts cells and cells overexpressing SEC4 with and without α-syn overexpression (last 4 lanes). Immunodetection was performed using primary antibodies directed against α-syn or Adh2 as indicated on the left. Molecular weight markers are indicated on the right.
When α-syn was overexpressed in sec4ts cells (Figure 2A – red trace), we observed that similar to the effects of α-syn in wild-type LRB906 cells, resting [Ca2+]in in 10 mM external Ca2+ was elevated (993 nM), the decay of cytosolic Ca2+ upon removal of external Ca2+ was much slower (Rest [Ca2+] 0.53 ± 0.26 μM) and the Ca2+ release transient decayed faster. Peak Ca2+ release moderately increased (Peak [Ca2+] 3.71 ± 0.53 μM) but this α-syn-induced effect was clearly less pronounced than in wild-type LRB906 cells. Western blot analysis further indicated that α-syn was expressed at similar levels in LRB906 and sec4ts cells (Figure 2D). These results therefore indicate that the mechanisms underlying the aberrant Ca2+ handling in α-syn overexpressing cells are only partially abrogated by Sec4 suppression.
As a next step, we also examined [Ca2+]in and growth in wild-type LRB906 cells overexpressing SEC4 (LRB906-pSEC4). As shown in Figure 2B, LRB906-pSEC4 cells displayed a similar intracellular Ca2+ pattern as WT cells but the peak level of the biphasic Ca2+ release was slightly higher. Also, the Ca2+ profile in LRB906-pSEC4 cells overexpressing α-syn (at similar levels as control cells – Figure 2D), remained similar to that seen in α-syn overexpressing wild-type cells though the decay of [Ca2+]in after removal of extracellular Ca2+ was somewhat faster (Rest [Ca2+] 0.15 ± 0.23 μM) while the peak level of the monophasic Ca2+ release was higher (Peak [Ca2+] 2.86 ± 0.63 μM) (Table 1). Surprisingly, the overexpression of SEC4 allowed the partial rescue of α-syn-induced growth inhibition (Figure 2C and Table 2).
To investigate whether aggregation of α-syn is required to induce [Ca2+]in changes, we monitored aggregation in LRB906 and sec4ts cells expressing α-syn fused with yeast-enhanced green fluorescent protein (yeGFP). Live-cell imaging of α-syn-yeGFP under these conditions revealed a significant percentage of cells displaying foci in both LRB906 (16.7 ± 8.8%) and sec4ts cells at permissive temperatures (29.3 ± 11.8%). Upon shifting to restrictive temperatures the percentage of cells displaying foci greatly increased in both LRB906 (26.7 ± 13.1%) and sec4ts cells (64.2 ± 11.2%), which in the latter was much more pronounced (Figure 3). We also noted that the percentage of cells that formed α-syn foci was not affected by overexpression of SEC4 (Supplementary Figure S3).
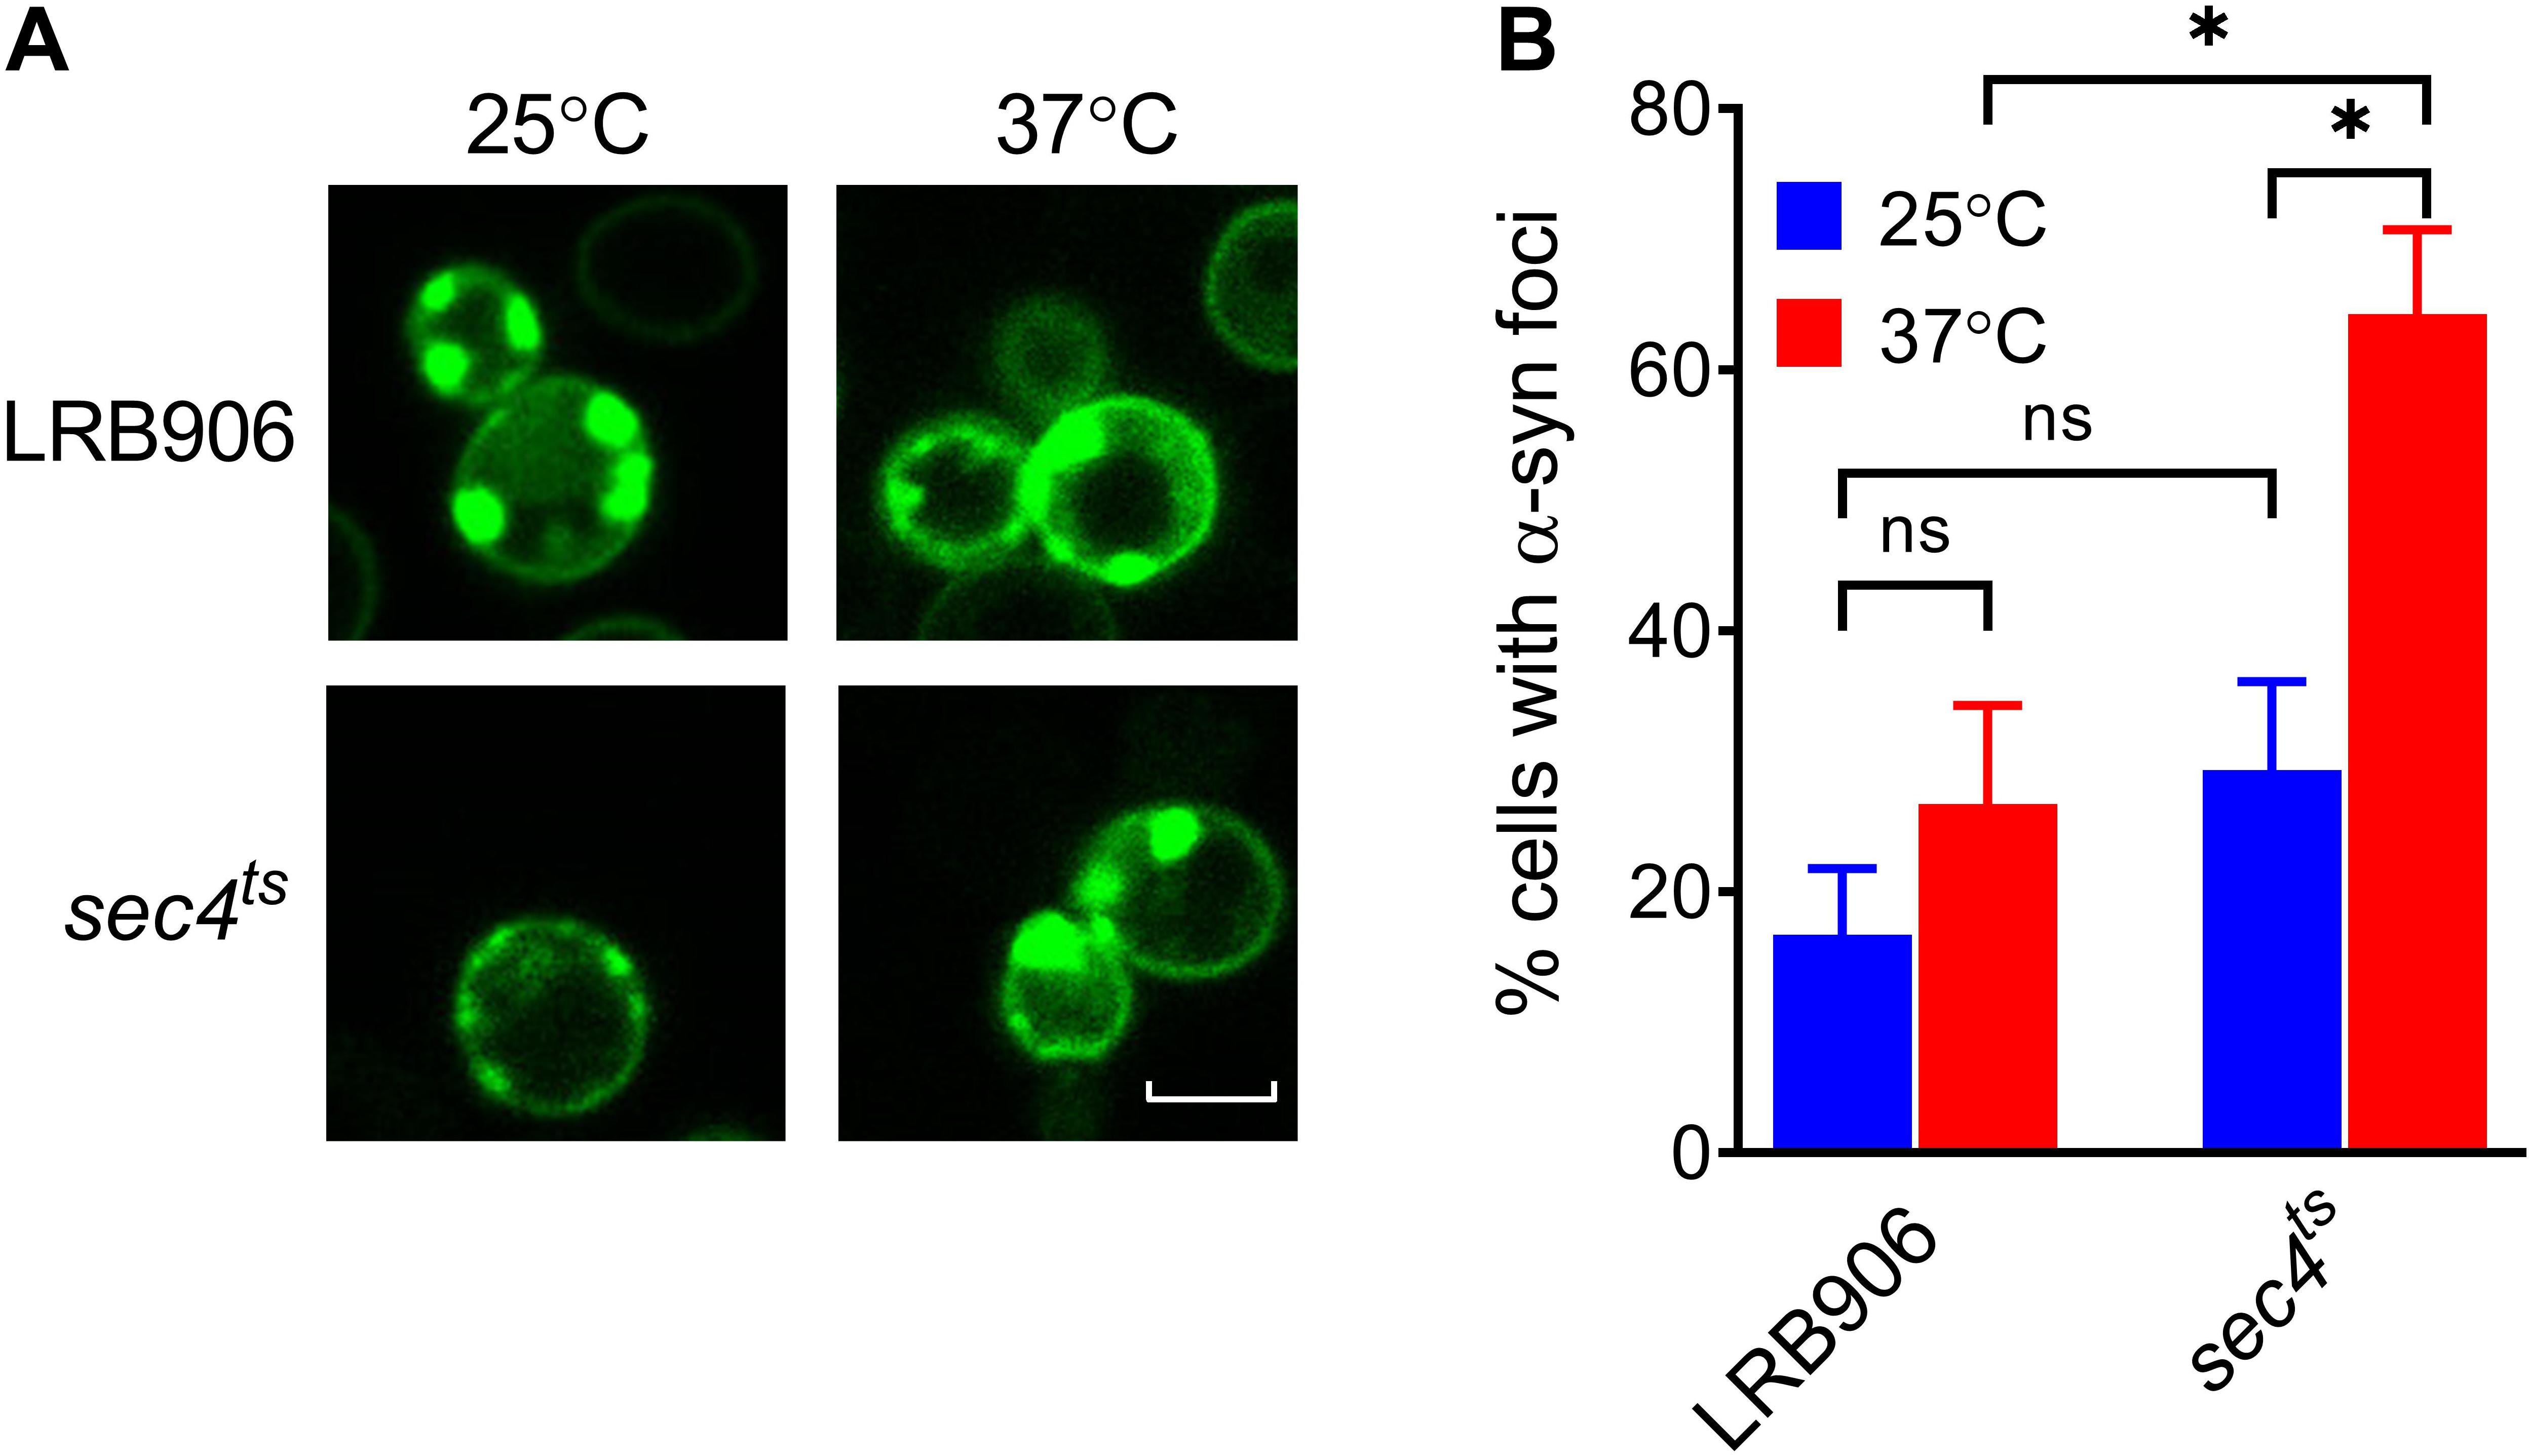
Figure 3. α-Syn aggregation in LRB906 and sec4ts cells. (A) Confocal images of LRB906 and sec4ts cells expressing α-syn-yeGFP prior to (25°C) and following incubation at restrictive temperature of 37°C for 1 h 15 min. Scale bar corresponds to 5 μm. (B) Bar graph showing percentage of cells containing α-syn foci (expressed as mean ± SD) under these experimental conditions. The percentage of cells with foci was determined by visual inspection of at least 300 cells. Results shown are representative of at least 3 independent experiments. The statistical significance was assessed using one-way ANOVA with Bonferroni posttest. ns (not significant) P > 0.05; *P ≤ 0.05.
α-Syn Impairs Ca2+ Storage
The higher [Ca2+]in in 10 mM external Ca2+, the incomplete decay of cytosolic [Ca2+] in Ca2+ free medium and the faster decay of the Ca2+ release transient observed in wild-type and sec4ts cells overexpressing α-syn clearly suggest that α-syn impairs cytosolic Ca2+ clearance and organellar Ca2+ storage. Since the vacuole is the main Ca2+ storage in yeast, we studied the effects of α-syn in strains lacking the vacuolar Ca2+ transporters Pmc1 and Vcx1 in the BY4741 background. To allow comparison with results obtained in wild-type LRB906 and sec4ts strains at restrictive temperatures, we first checked Ca2+ responses in wild-type BY4741 cells at 37 and 30°C (Figure 4 and Table 3). Cooling (37 to 30°C) significantly decreased the rate of [Ca2+]in changes but the overall effects of α-syn were still apparent including a higher resting [Ca2+]in in 10 mM external Ca2+, an incomplete decay of cytosolic [Ca2+] in Ca2+ free medium, a shift from a biphasic to a quasi-monophasic Ca2+ release and the faster decay of the Ca2+ release transient. As shown by the first derivative of the Ca2+ release transient (Figure 4 – insets), it becomes also apparent that the α-syn-induced shift from a biphasic to a quasi-monophasic Ca2+ release mainly reflects an increase in both the rate of Ca2+ release and the amplitude of the second slow component, while the first fast component is minimally or not affected. In addition, the α-syn-induced growth inhibition observed in the BY4741 strain (Figures 5A,B,E and Table 4) was similar to that in LRB906 cells (Δt50 values of 12.3 and 10.9 h in LRB906 and BY4741, respectively). As 30°C is the optimum temperature for yeast and to minimize temperature stress, further experimental assays in the BY4741 background were performed at 30°C. Furthermore, as shown in Supplementary Figure S4, extracellular [Ca2+] is not an absolute requirement for the α-syn-induced shift from biphasic to quasi-monophasic Ca2+ release. When cells were not challenged with extracellular Ca2+, membrane permeabilization evoked a similar biphasic Ca2+ release as in cells challenged with 10 mM external [Ca2+]. Likewise, the response in α-syn overexpressing cells became quasi-monophasic although peak [Ca2+] was significantly reduced compared to cells previously exposed to external [Ca2+].
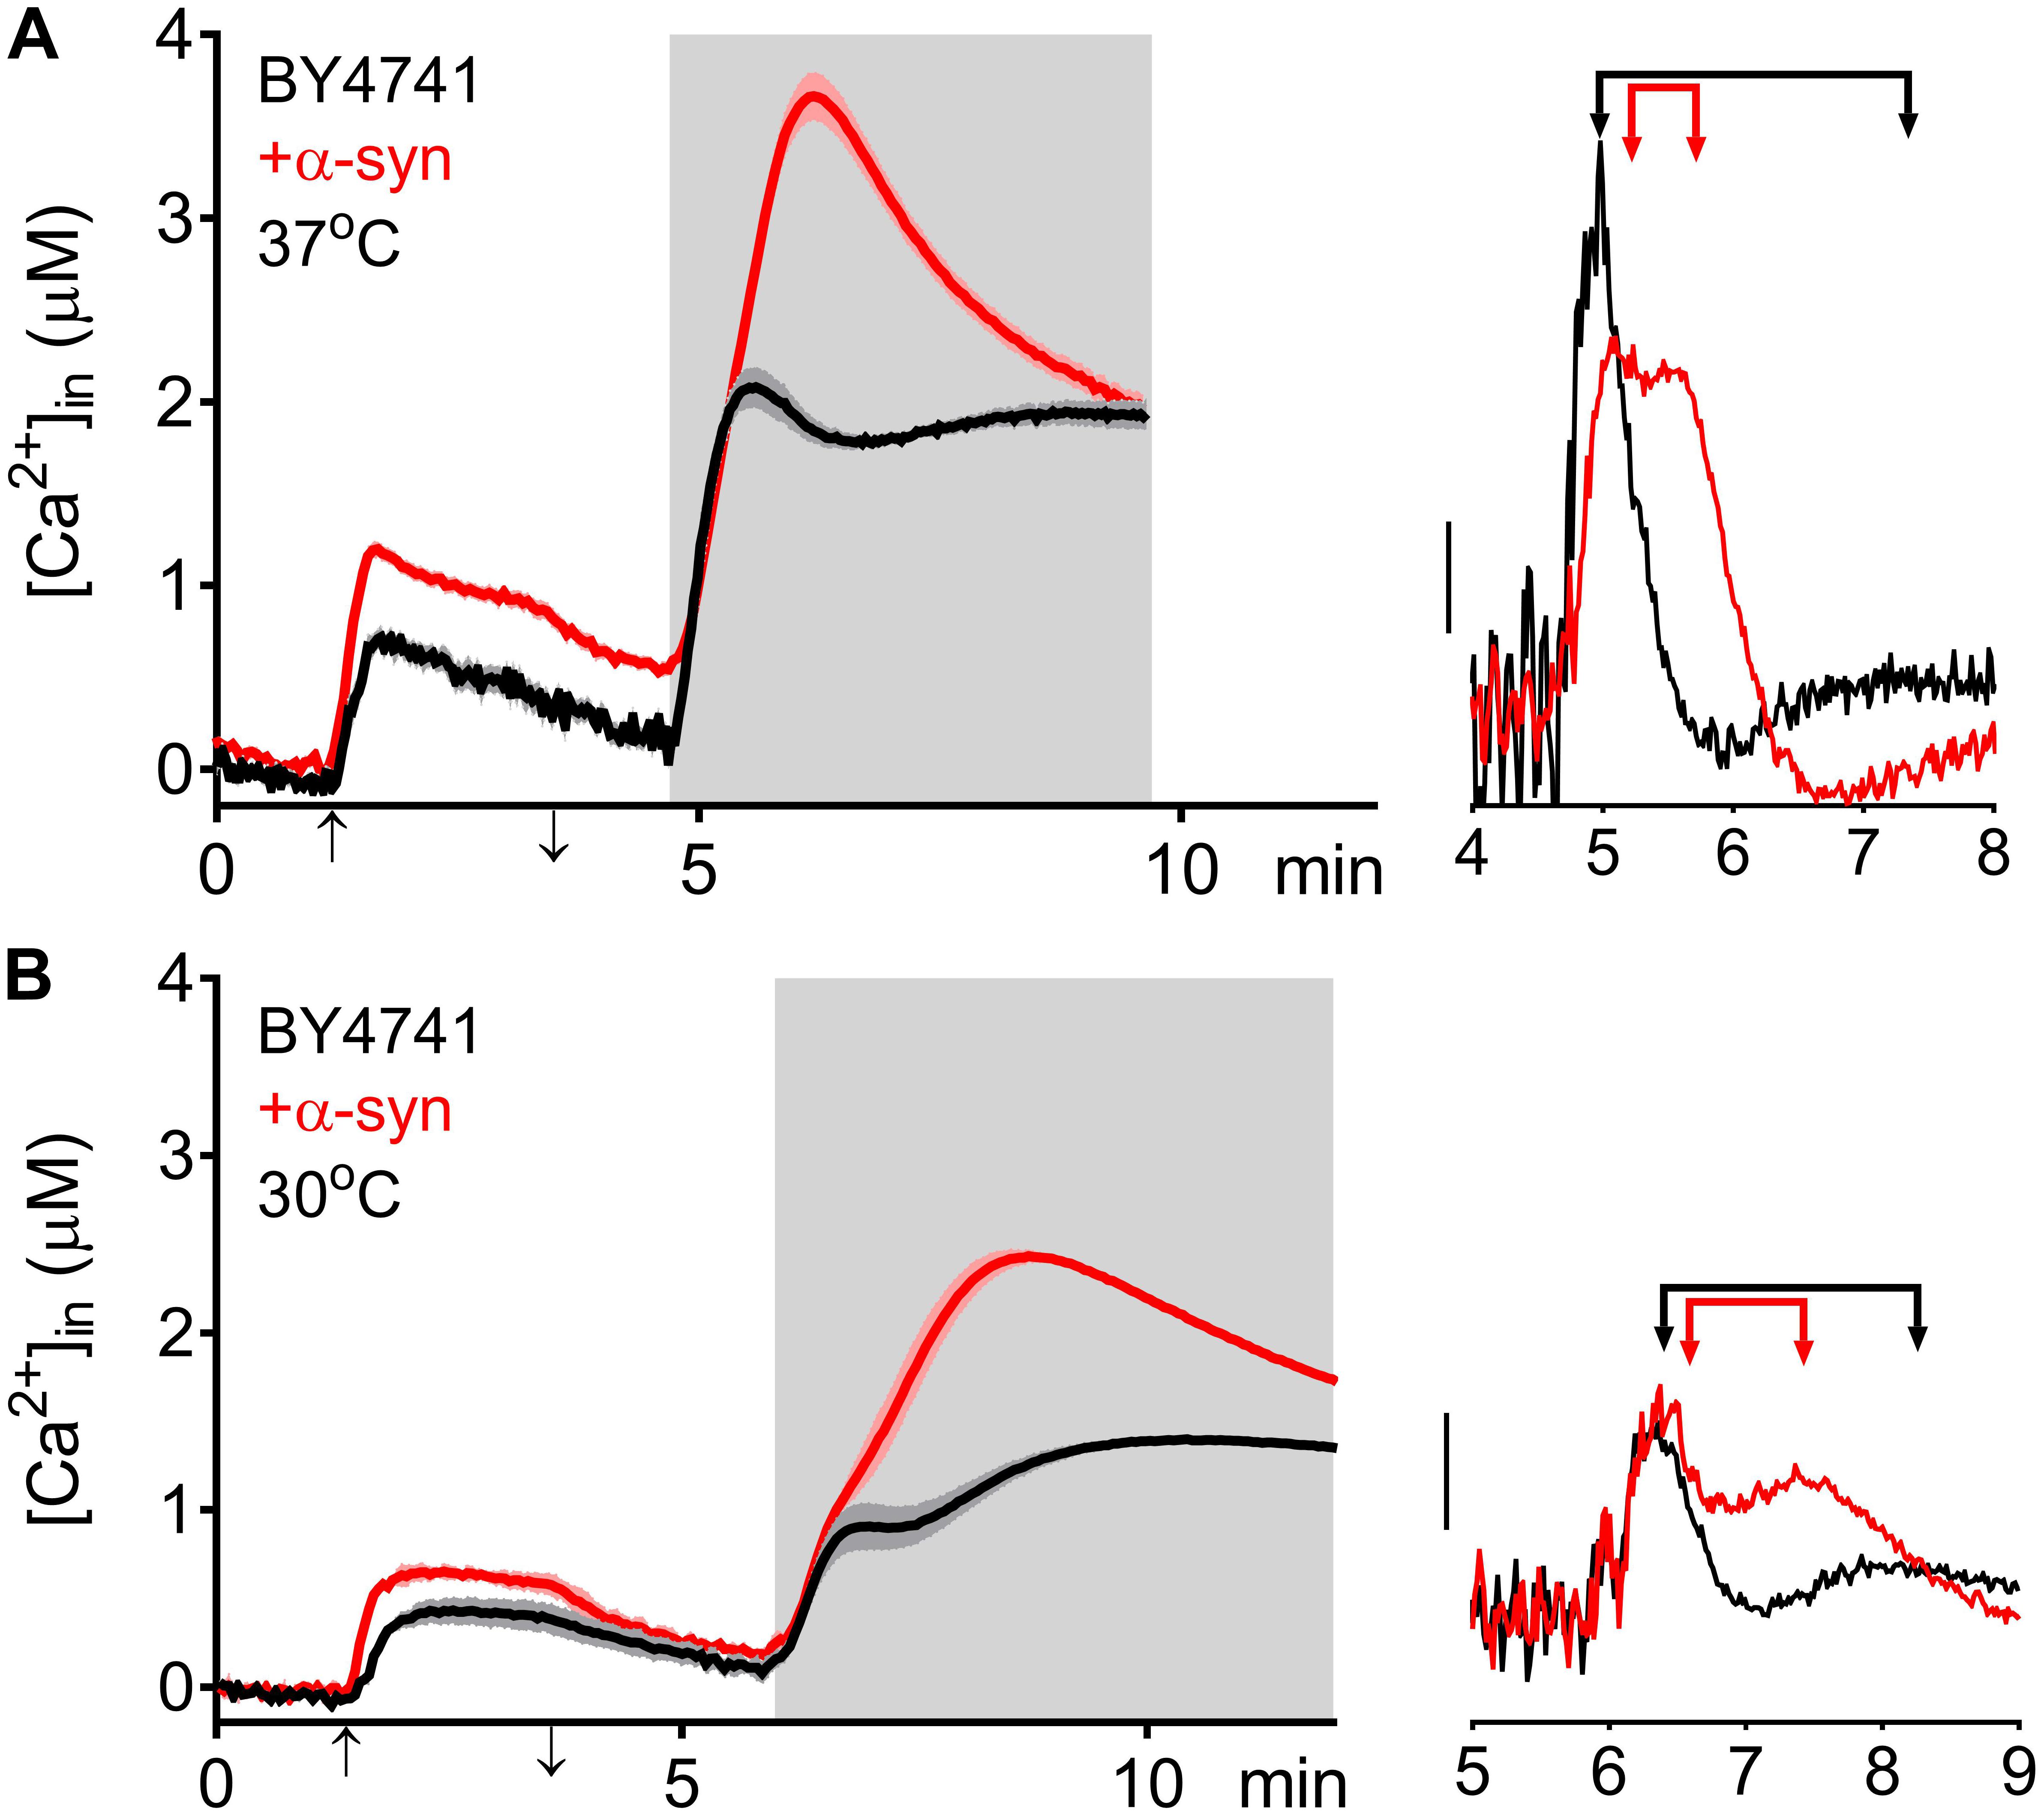
Figure 4. α-Syn overexpression in BY4741 cells. Averaged Ca2+ transient ± SEM (thin lines either side of the Ca2+ transient trajectory) of BY4741 (black traces) and BY4741 overexpressing α-syn (+α-syn – red traces) at 37 (A) and 30°C (B). Cells were initially perfused with Ca2+-free starvation medium and then transferred to a 10 mM external Ca2+ medium for 2 min (indicated by up and down arrow on X-axis). Thereafter, cells were briefly exposed to Ca2+-free intracellular medium prior to membrane permeabilization using Triton X-100 (indicated by light gray zone). Right insets: first derivative of the Ca2+ release transients versus time showing fast and slow release components (indicated by arrowed bars). Scale bar corresponds to 1 μM/min.
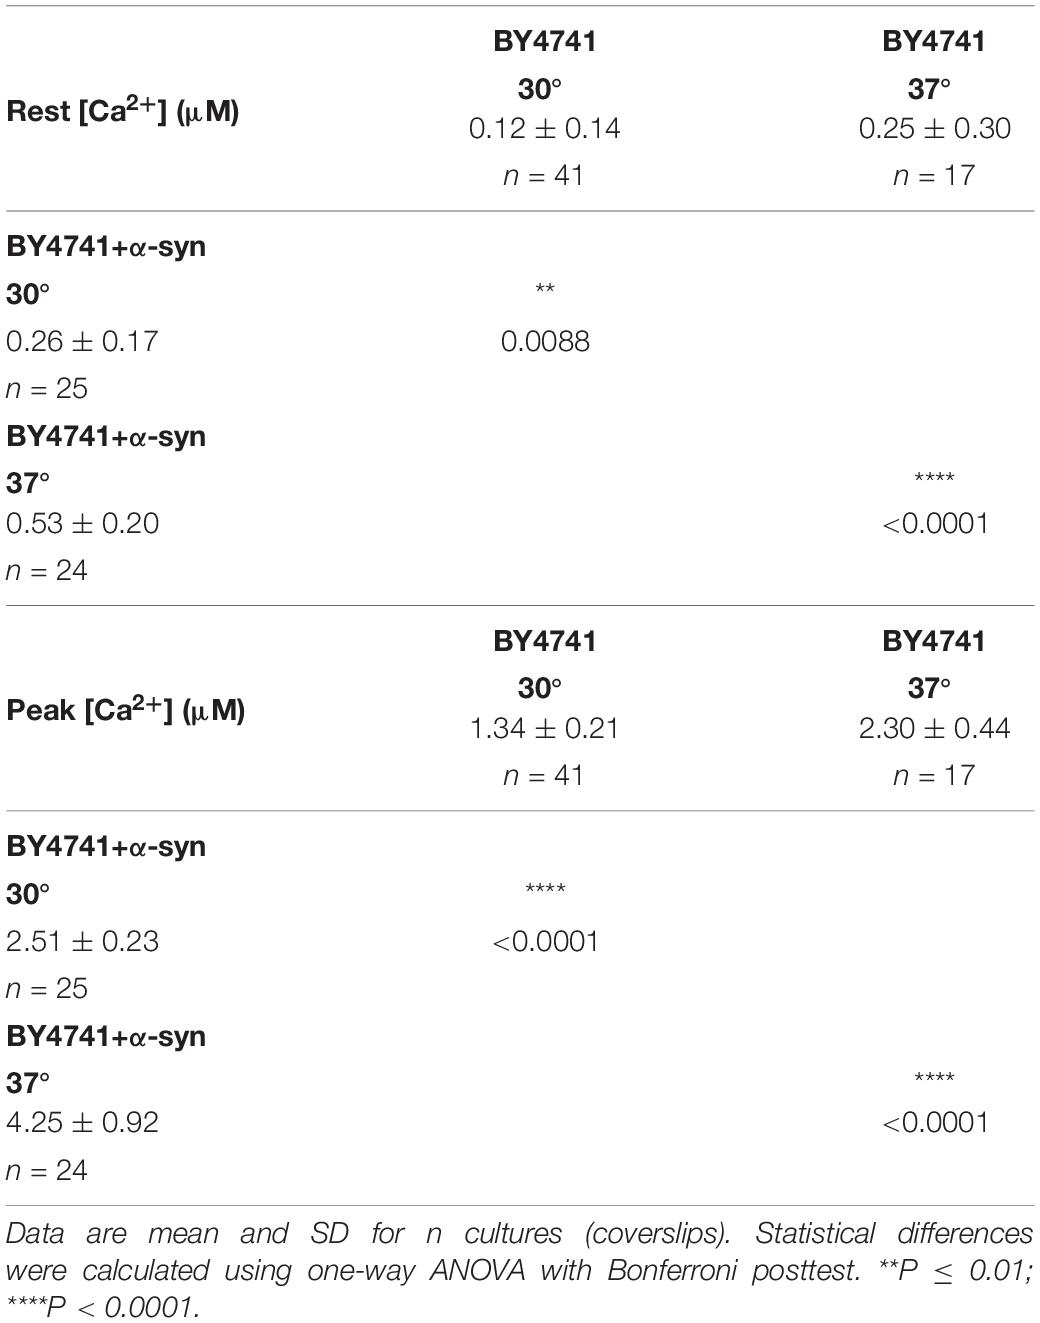
Table 3. [Ca2+]in determined at the end of the Ca2+-free period (Rest [Ca2+]) (before membrane permeabilization) and the peak amplitude of the Ca2+ release transient (Peak [Ca2+]) in BY4741 cells and BY4741 cells overexpressing α-syn at 30 and 37°C.
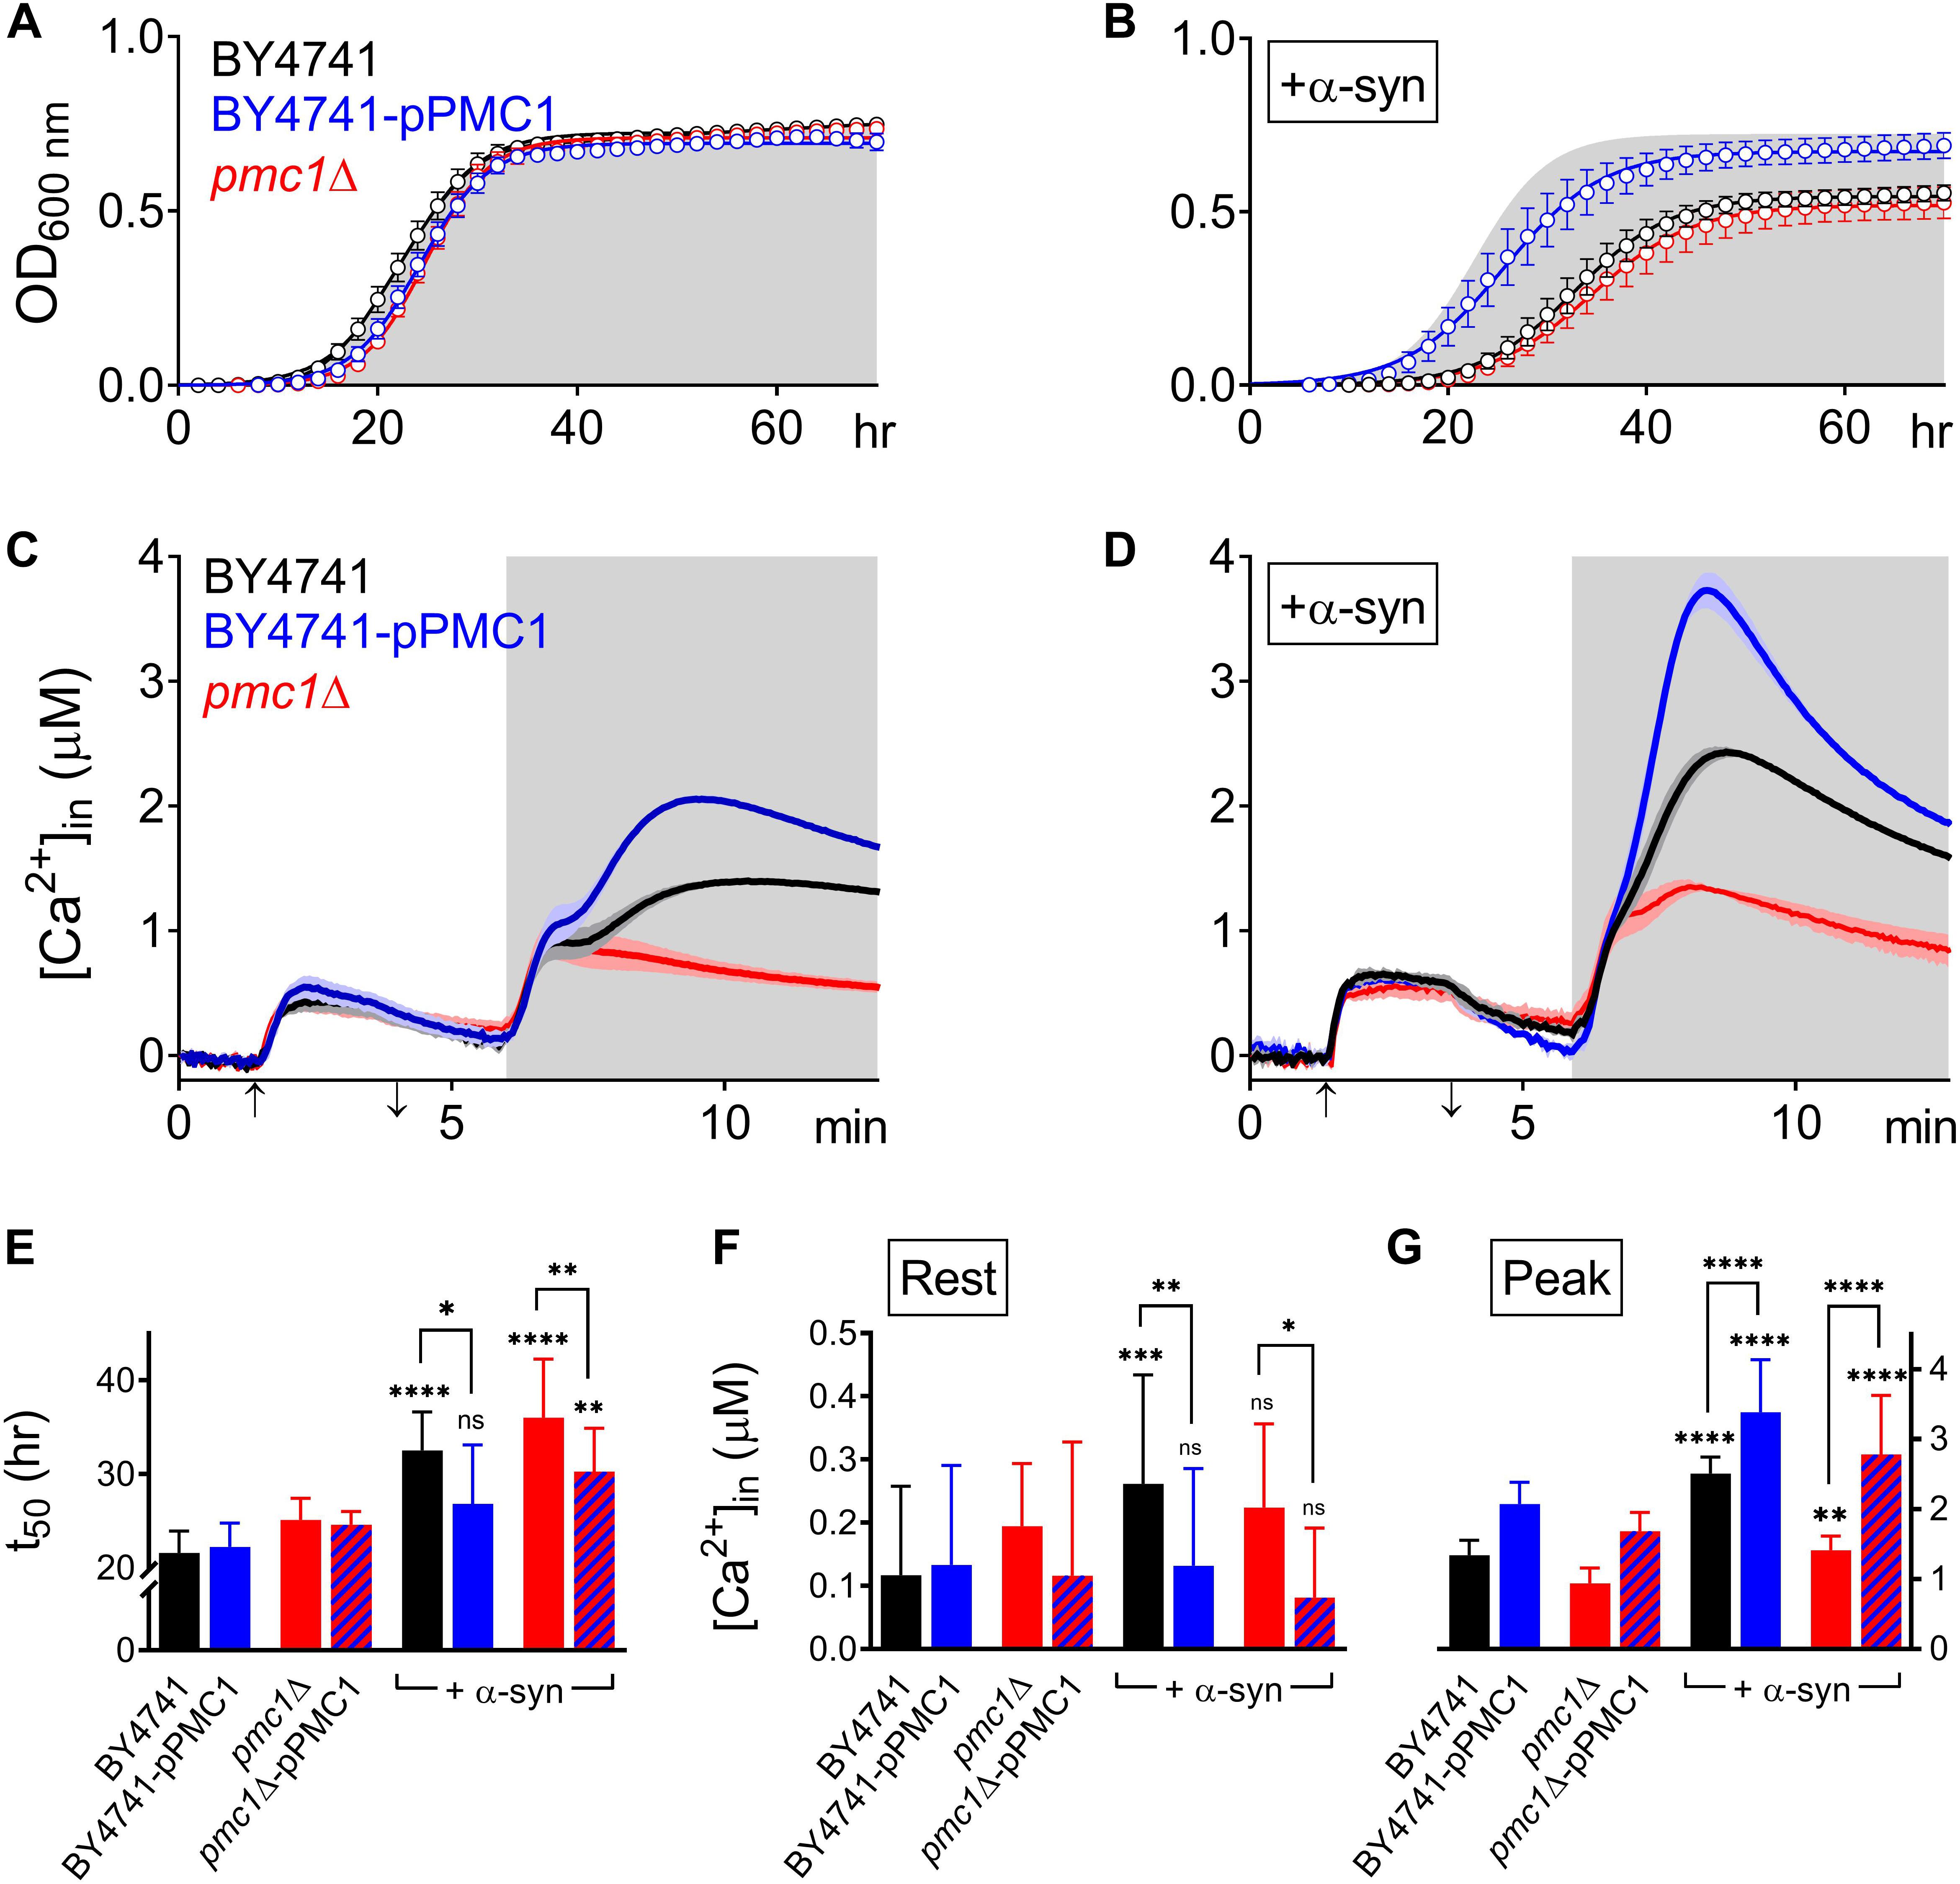
Figure 5. α-Syn overexpression in PMC1 mutant strains. (A,B) Cell growth analysis of BY4741 yeast strains. OD600 measurements were obtained for BY4741 cells (black), cells overexpressing PMC1 (BY4741-pPMC1 – blue) and pmc1Δ cells (red) without (A) or with overexpression of α-syn (B). Gray shaded area in (B) corresponds to growth curve of control BY4741 cells (A). Each time point represents the average ± SEM of triplicate cultures. (C,D) Averaged Ca2+ transient ± SEM (thin lines either side of the Ca2+ transient trajectory) of BY4741 cells (black), cells overexpressing PMC1 (BY4741-pPMC1 - blue) and pmc1Δ cells (red) without (C) or with overexpression of α-syn (D) at 30°C. Cells were initially perfused with Ca2+-free starvation medium and then transferred to a 10 mM external Ca2+ medium for 2 min (indicated by up and down arrow on X-axis). Thereafter, cells were briefly exposed to Ca2+-free intracellular medium prior to membrane permeabilization using Triton X-100 (indicated by light gray zone). (E–G) Comparison of t50 (time to reach half-maximal OD600) (C), Rest [Ca2+] ([Ca2+]in value determined at the end of the Ca2+-free period prior to permeabilization) (D) and Peak [Ca2+] (peak amplitude of the Ca2+ release transient following permeabilization) (E) for PMC1 mutant strains without and with α-syn overexpression. Bar graphs depicting mean ± SD. The statistical significance was assessed using one-way ANOVA with Bonferroni posttest. Unless otherwise indicated by connecting bar, differences were tested with respect to the control strain (without α-syn expression). ns (not significant) P > 0.05; *P ≤ 0.05; **P ≤ 0.01; ***P ≤ 0.001; ****P < 0.0001. Mean and P-values are listed in Tables 4, 5.
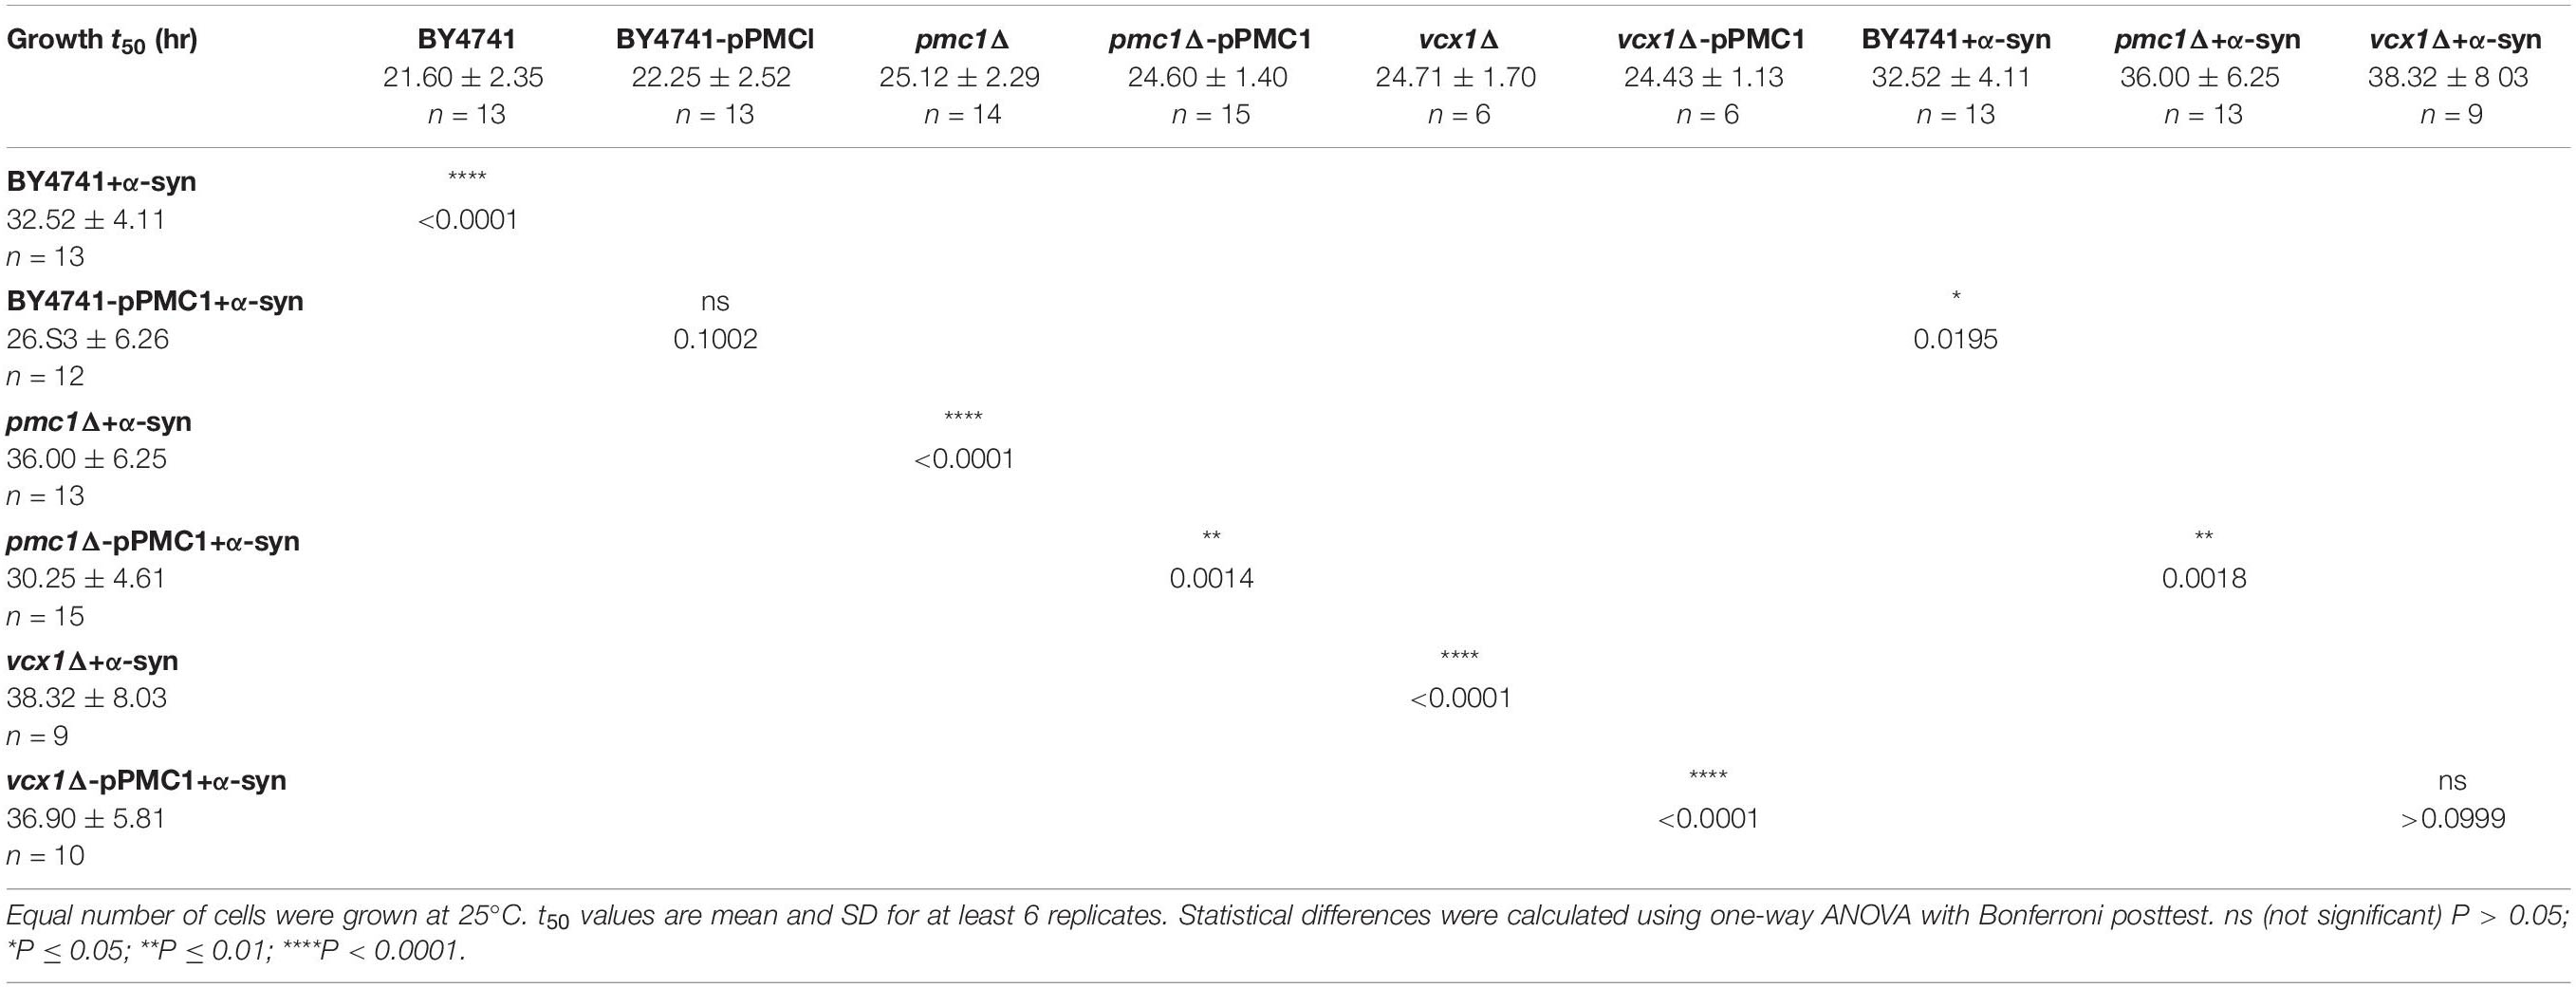
Table 4. Growth of BY4741 yeast strains.
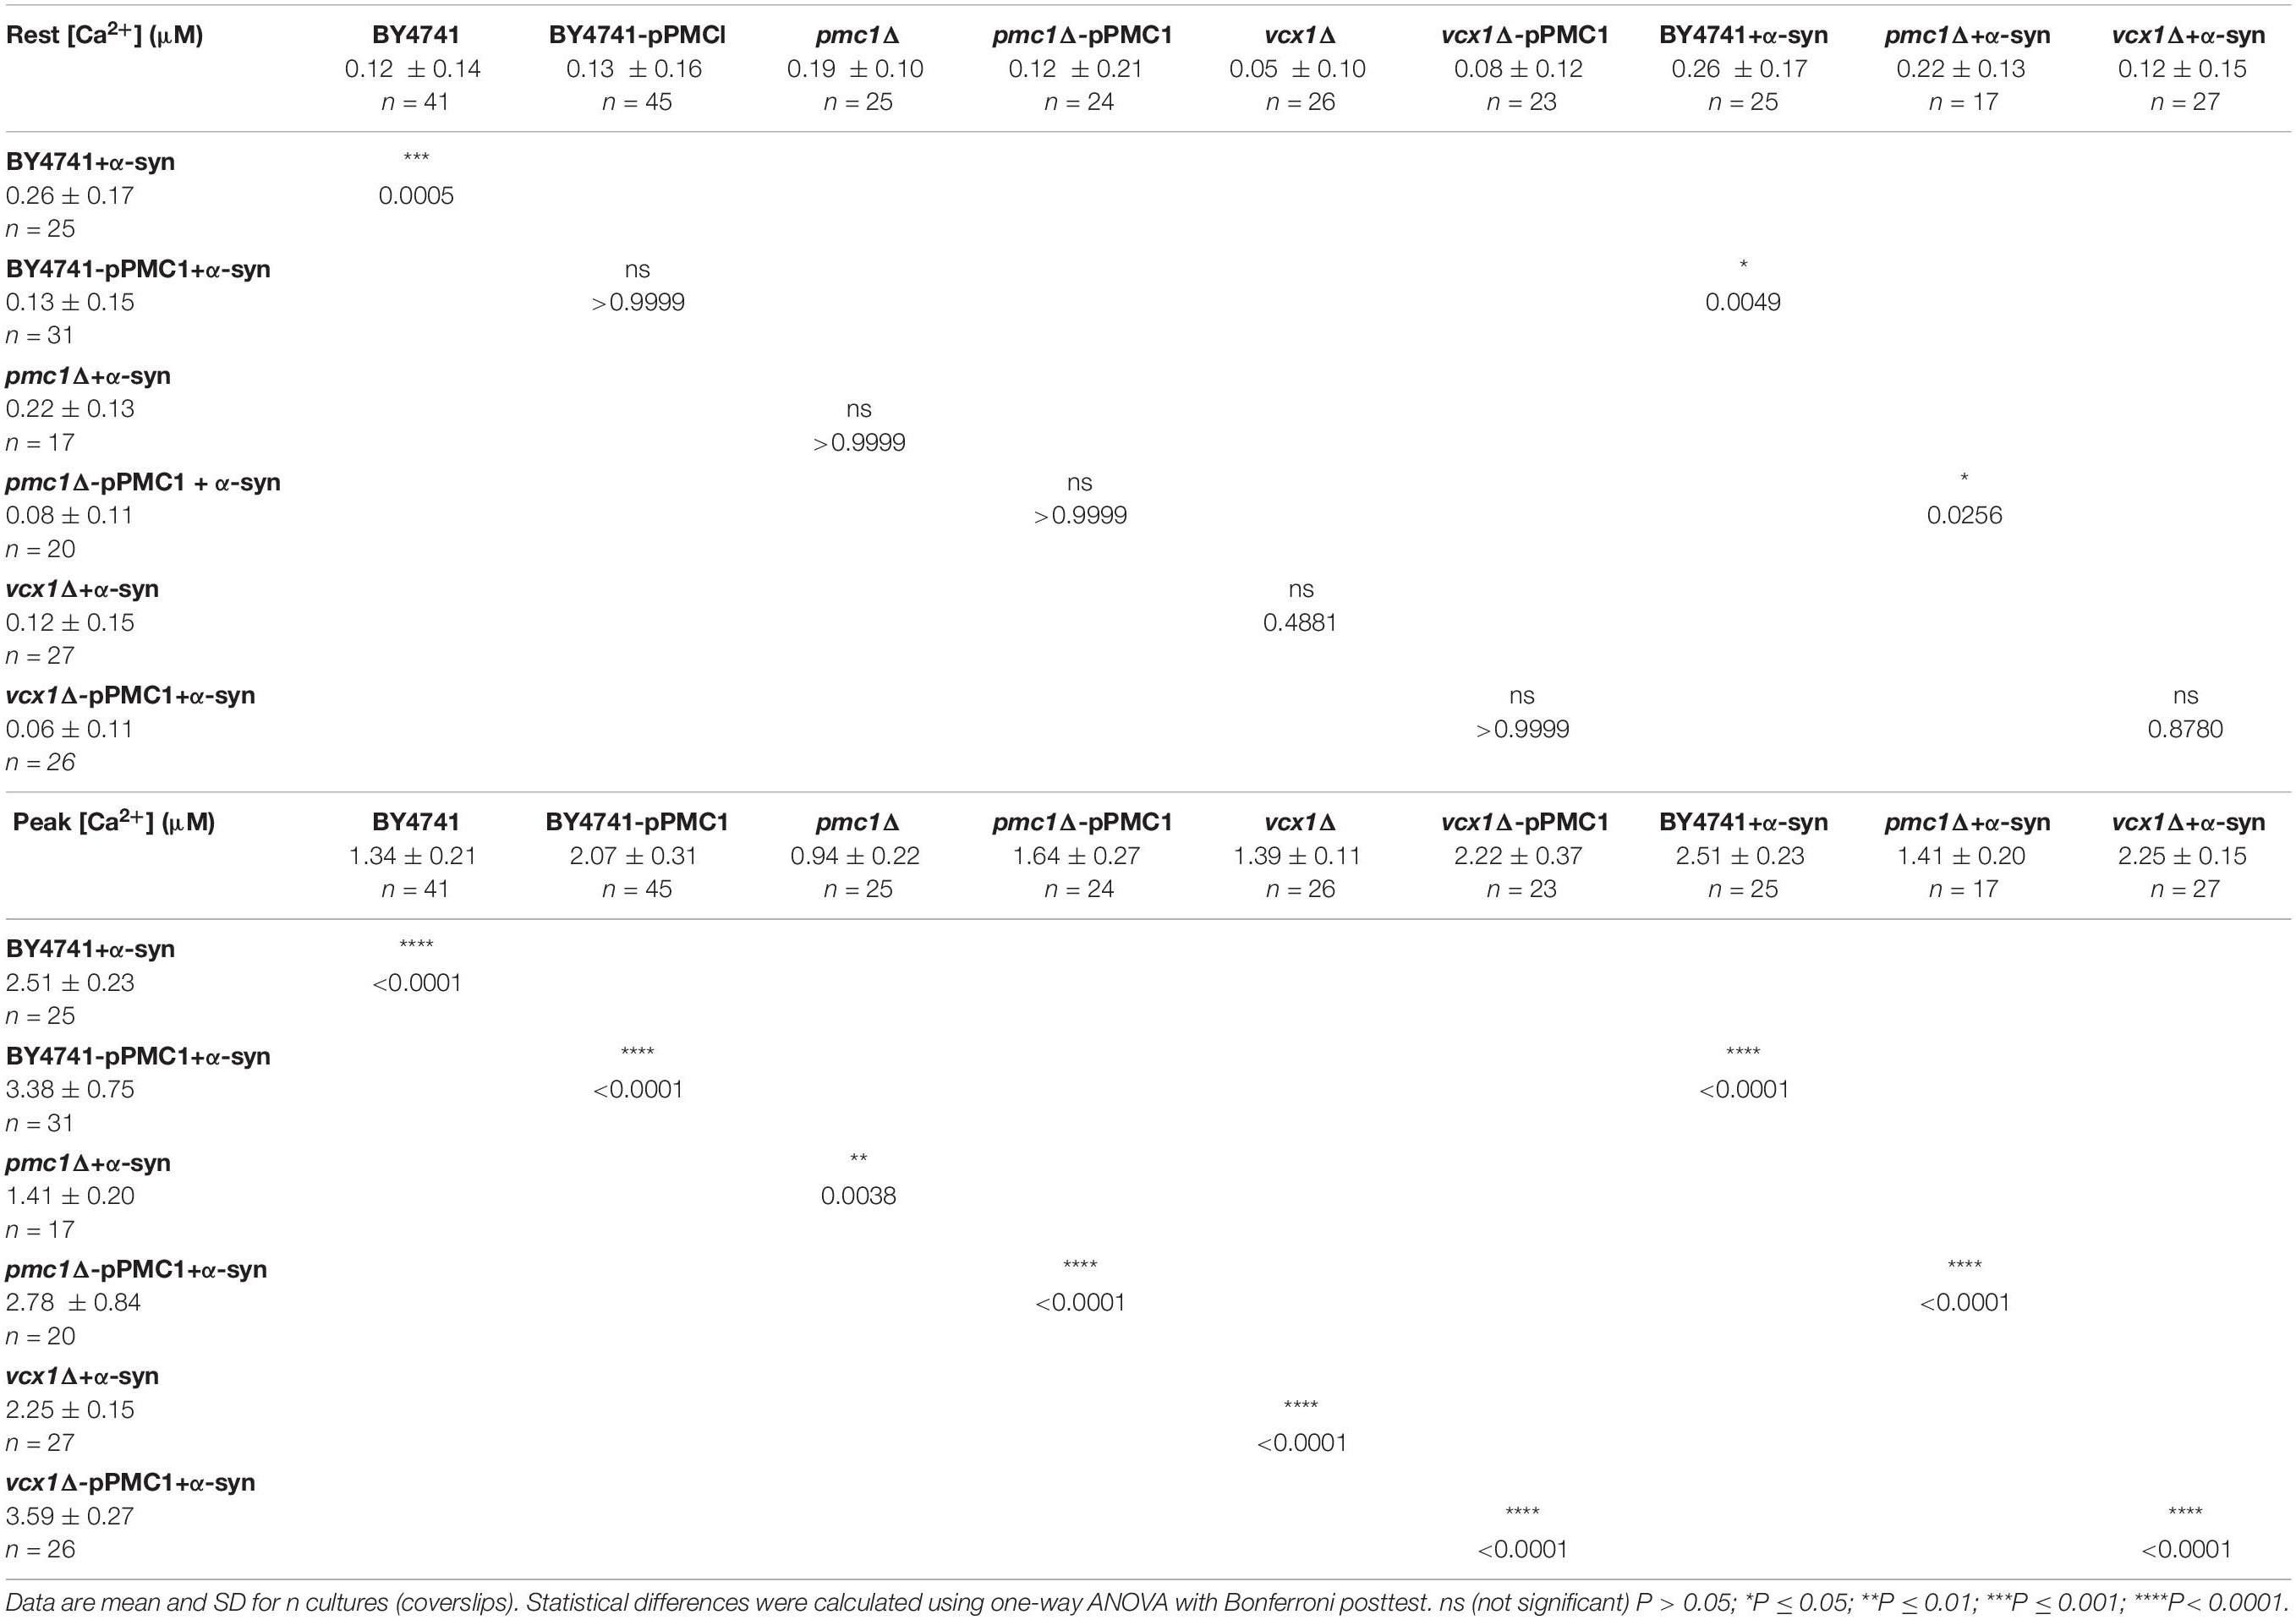
Table 5. [Ca2+]in determined at the end of the Ca2+-free period (Rest [Ca2+]) (before membrane permeabilization) and the peak amplitude of the Ca2+ release transient (Peak [Ca2+]) in BY4741 yeast strains at 30°C.
For the BY4741 strains, the [Ca2+]in values determined at the end of the Ca2+-free period before permeabilization (Rest [Ca2+]) as well as the peak amplitude of the Ca2+ release transient taken as the maximum of the biphasic Ca2+ release transient (Peak [Ca2+]) are listed in Table 5.
Pmc1 is the high affinity/low capacity vacuolar Ca2+ transporter in yeast cells that mainly controls resting [Ca2+]in (D’hooge et al., 2015). As compared to wild-type BY4741 cells (Figure 5C – black trace), pmc1Δ cells displayed an increase in resting [Ca2+]in value (Figure 5C – red trace; Figure 5F) and a small Ca2+ release transient upon membrane permeabilization, consisting of the fast Ca2+ release component (Figure 5C – red trace; Figure 5G). Upon overexpression of α-syn in pmc1Δ cells, resting [Ca2+]in slightly enhanced while a small second component appeared in the Ca2+ release transient (Figure 5D – red trace; Figures 5F,G). BY4741 cells overexpressing PMC1 (BY4741-pPMC1) showed similar resting [Ca2+]in value as wild-type BY4741 cells (Figure 5C – blue trace; Figure 5F) but an enhanced biphasic release transient (Figure 5C – blue trace; Figure 5G). Overexpression of α-syn in the BY4741-pPMC1 strain resulted in a large quasi-monophasic Ca2+ release transient but resting [Ca2+] was not affected (Figure 5D – blue trace; Figures 5F,G). This result suggests that the α-syn-induced shift from a biphasic to a quasi-monophasic Ca2+ release may reflect rapid Ca2+ release form an additional pool of vesicles loaded with Ca2+ by Pmc1. To further address this point, we studied Pmc1 localization in FM4-64 stained yeast cells. As evident from Supplementary Figure S5, BY4741 control cells typically showed one large vacuole containing Pmc1. By contrast, in BY4741 cells expressing α-syn Pmc1 was found in numerous small vesicle-like structures and FM4-64 staining identified these structures as vacuolar fragments.
Finally, overexpression of PMC1 rescued α-syn induced toxicity on growth both in wild-type (BY4741-pPMC1) and pmc1Δ (pmc1Δ-pPMC1) cells (Figure 5B,E and Table 4).
The vcx1Δ strain was also tested (Figure 6). Vcx1 has been characterized as a low affinity/high capacity vacuolar Ca2+/H+ antiporter in yeast cells (Cagnac et al., 2010). Compared to wild-type BY4741 cells, vcx1Δ cells displayed significantly decreased [Ca2+]in values in Ca2+-free medium (Rest [Ca2+] 0.05 ± 0.10 μM – Table 5), but the Ca2+ release transient was minimally affected and remained biphasic (Figure 6A – red trace; Figures 6D,E). Remarkably, overexpression of α-syn in vcx1Δ cells did not significantly increase [Ca2+]in in Ca2+ free medium (Rest [Ca2+] 0.12 ± 0.15 μM) but the Ca2+ release transient became nearly monophasic with a significantly higher peak value (Figure 6B – red trace; Figures 6D,E). vcx1Δ cells overexpressing PMC1 (vcx1Δ-pPMC1) showed similar resting [Ca2+]in as vcx1Δ cells but an enhanced biphasic release transient (Figures 6D,E). Overexpression of α-syn in the vcx1Δ-pPMC1 strain resulted in a larger Ca2+ release transient but resting [Ca2+] and growth rate were not significantly affected (Figures 6C–E). To further investigate this phenotype, we also measured PMC1 expression using qPCR (Figure 7). Wild-type BY4741 cells expressing α-syn showed a slight yet significant increase in PMC1 expression. However, a stronger PMC1 expression was observed in both vcx1Δ and vcx1Δ +α-syn cells.
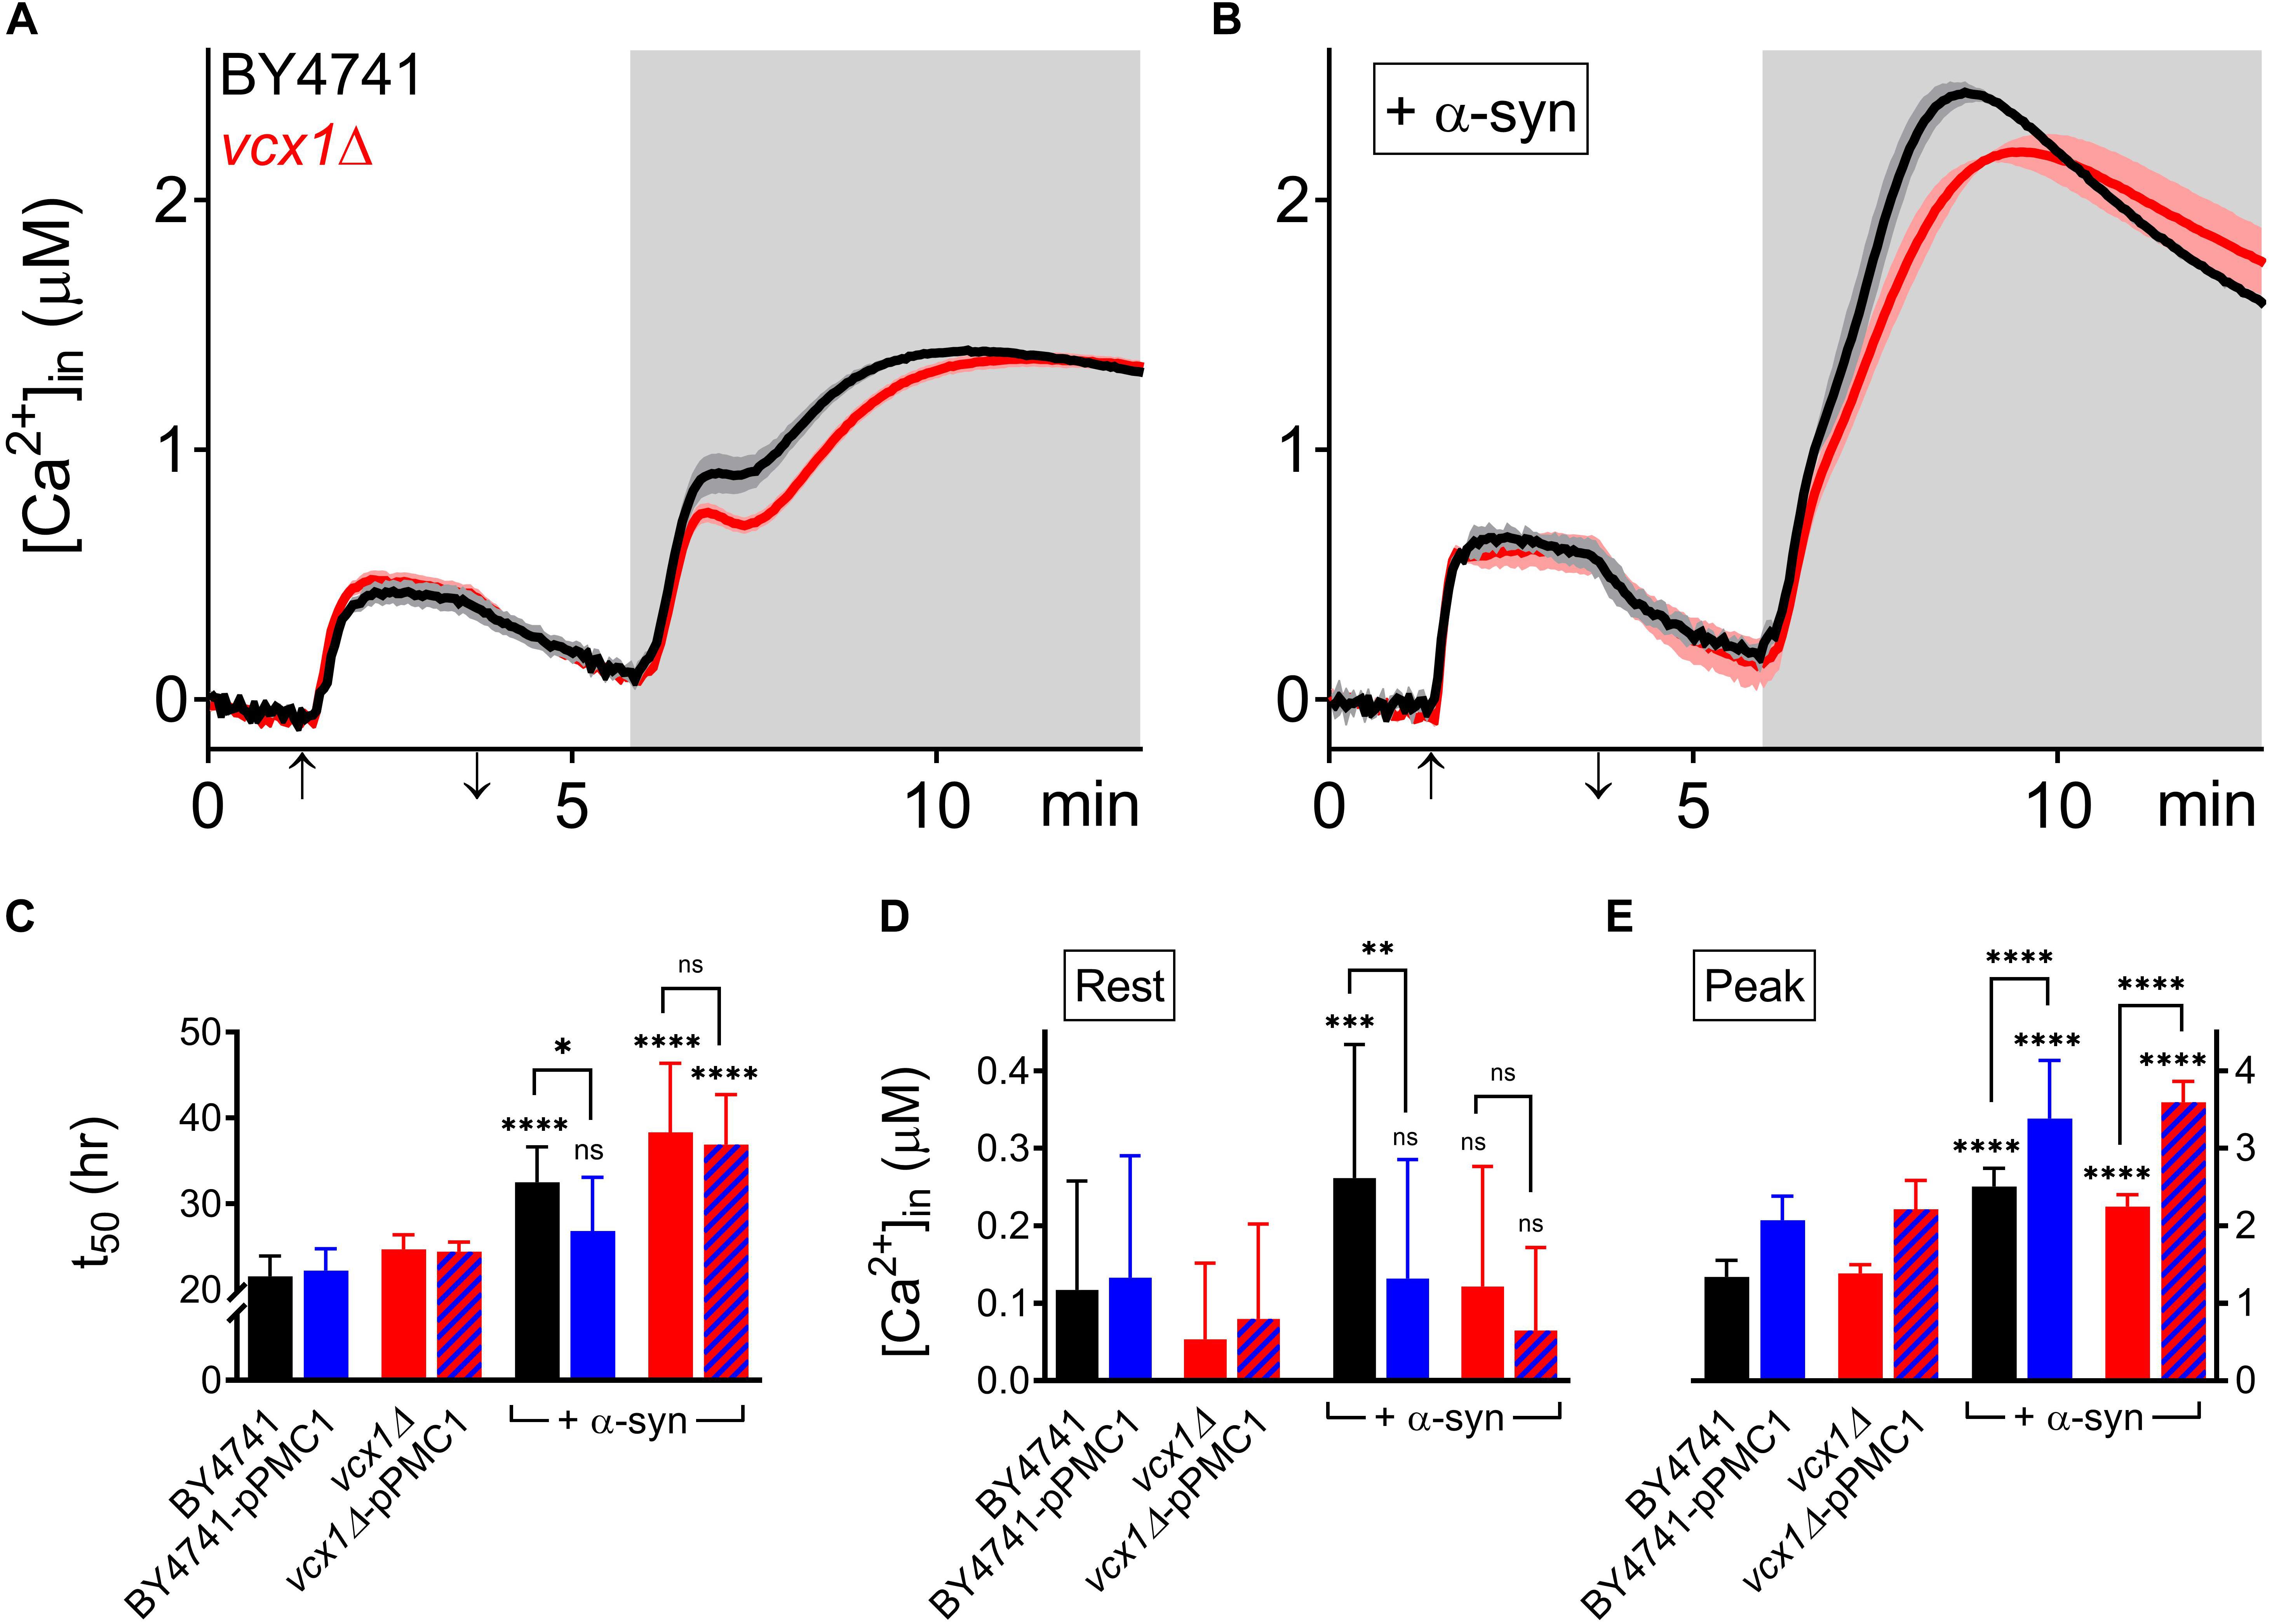
Figure 6. α-Syn overexpression in VCX1 mutant strains. (A,B) Averaged Ca2+ transient ± SEM (thin lines either side of the Ca2+ transient trajectory) of BY4741 cells (black) and vcx1Δ cells (red) without (A) or with overexpression of α-syn (B) at 30°C. Cells were initially perfused with Ca2+-free starvation medium and then transferred to a 10 mM external Ca2+ medium for 2 min (indicated by up and down arrow on X-axis). Thereafter, cells were briefly exposed to Ca2+-free intracellular medium prior to membrane permeabilization using Triton X-100 (indicated by light gray zone). (C–E) Comparison of t50 (time to reach half-maximal OD600) (C), Rest [Ca2+] ([Ca2+]in value determined at the end of the Ca2+-free period prior to permeabilization) (D) and Peak [Ca2+] (peak amplitude of the Ca2+ release transient following permeabilization) (E) for VCX1 mutant strains without and with α-syn overexpression. Bar graphs depicting mean ± SD. The statistical significance was assessed using one-way ANOVA with Bonferroni posttest. Unless otherwise indicated by connecting bar, differences were tested with respect to the control strain (without α-syn expression). ns (not significant) P > 0.05; ∗P ≤ 0.05; ∗∗P ≤ 0.01; ∗∗∗P ≤ 0.001; ****P < 0.0001. Mean and P-values are listed in Tables 4, 5.
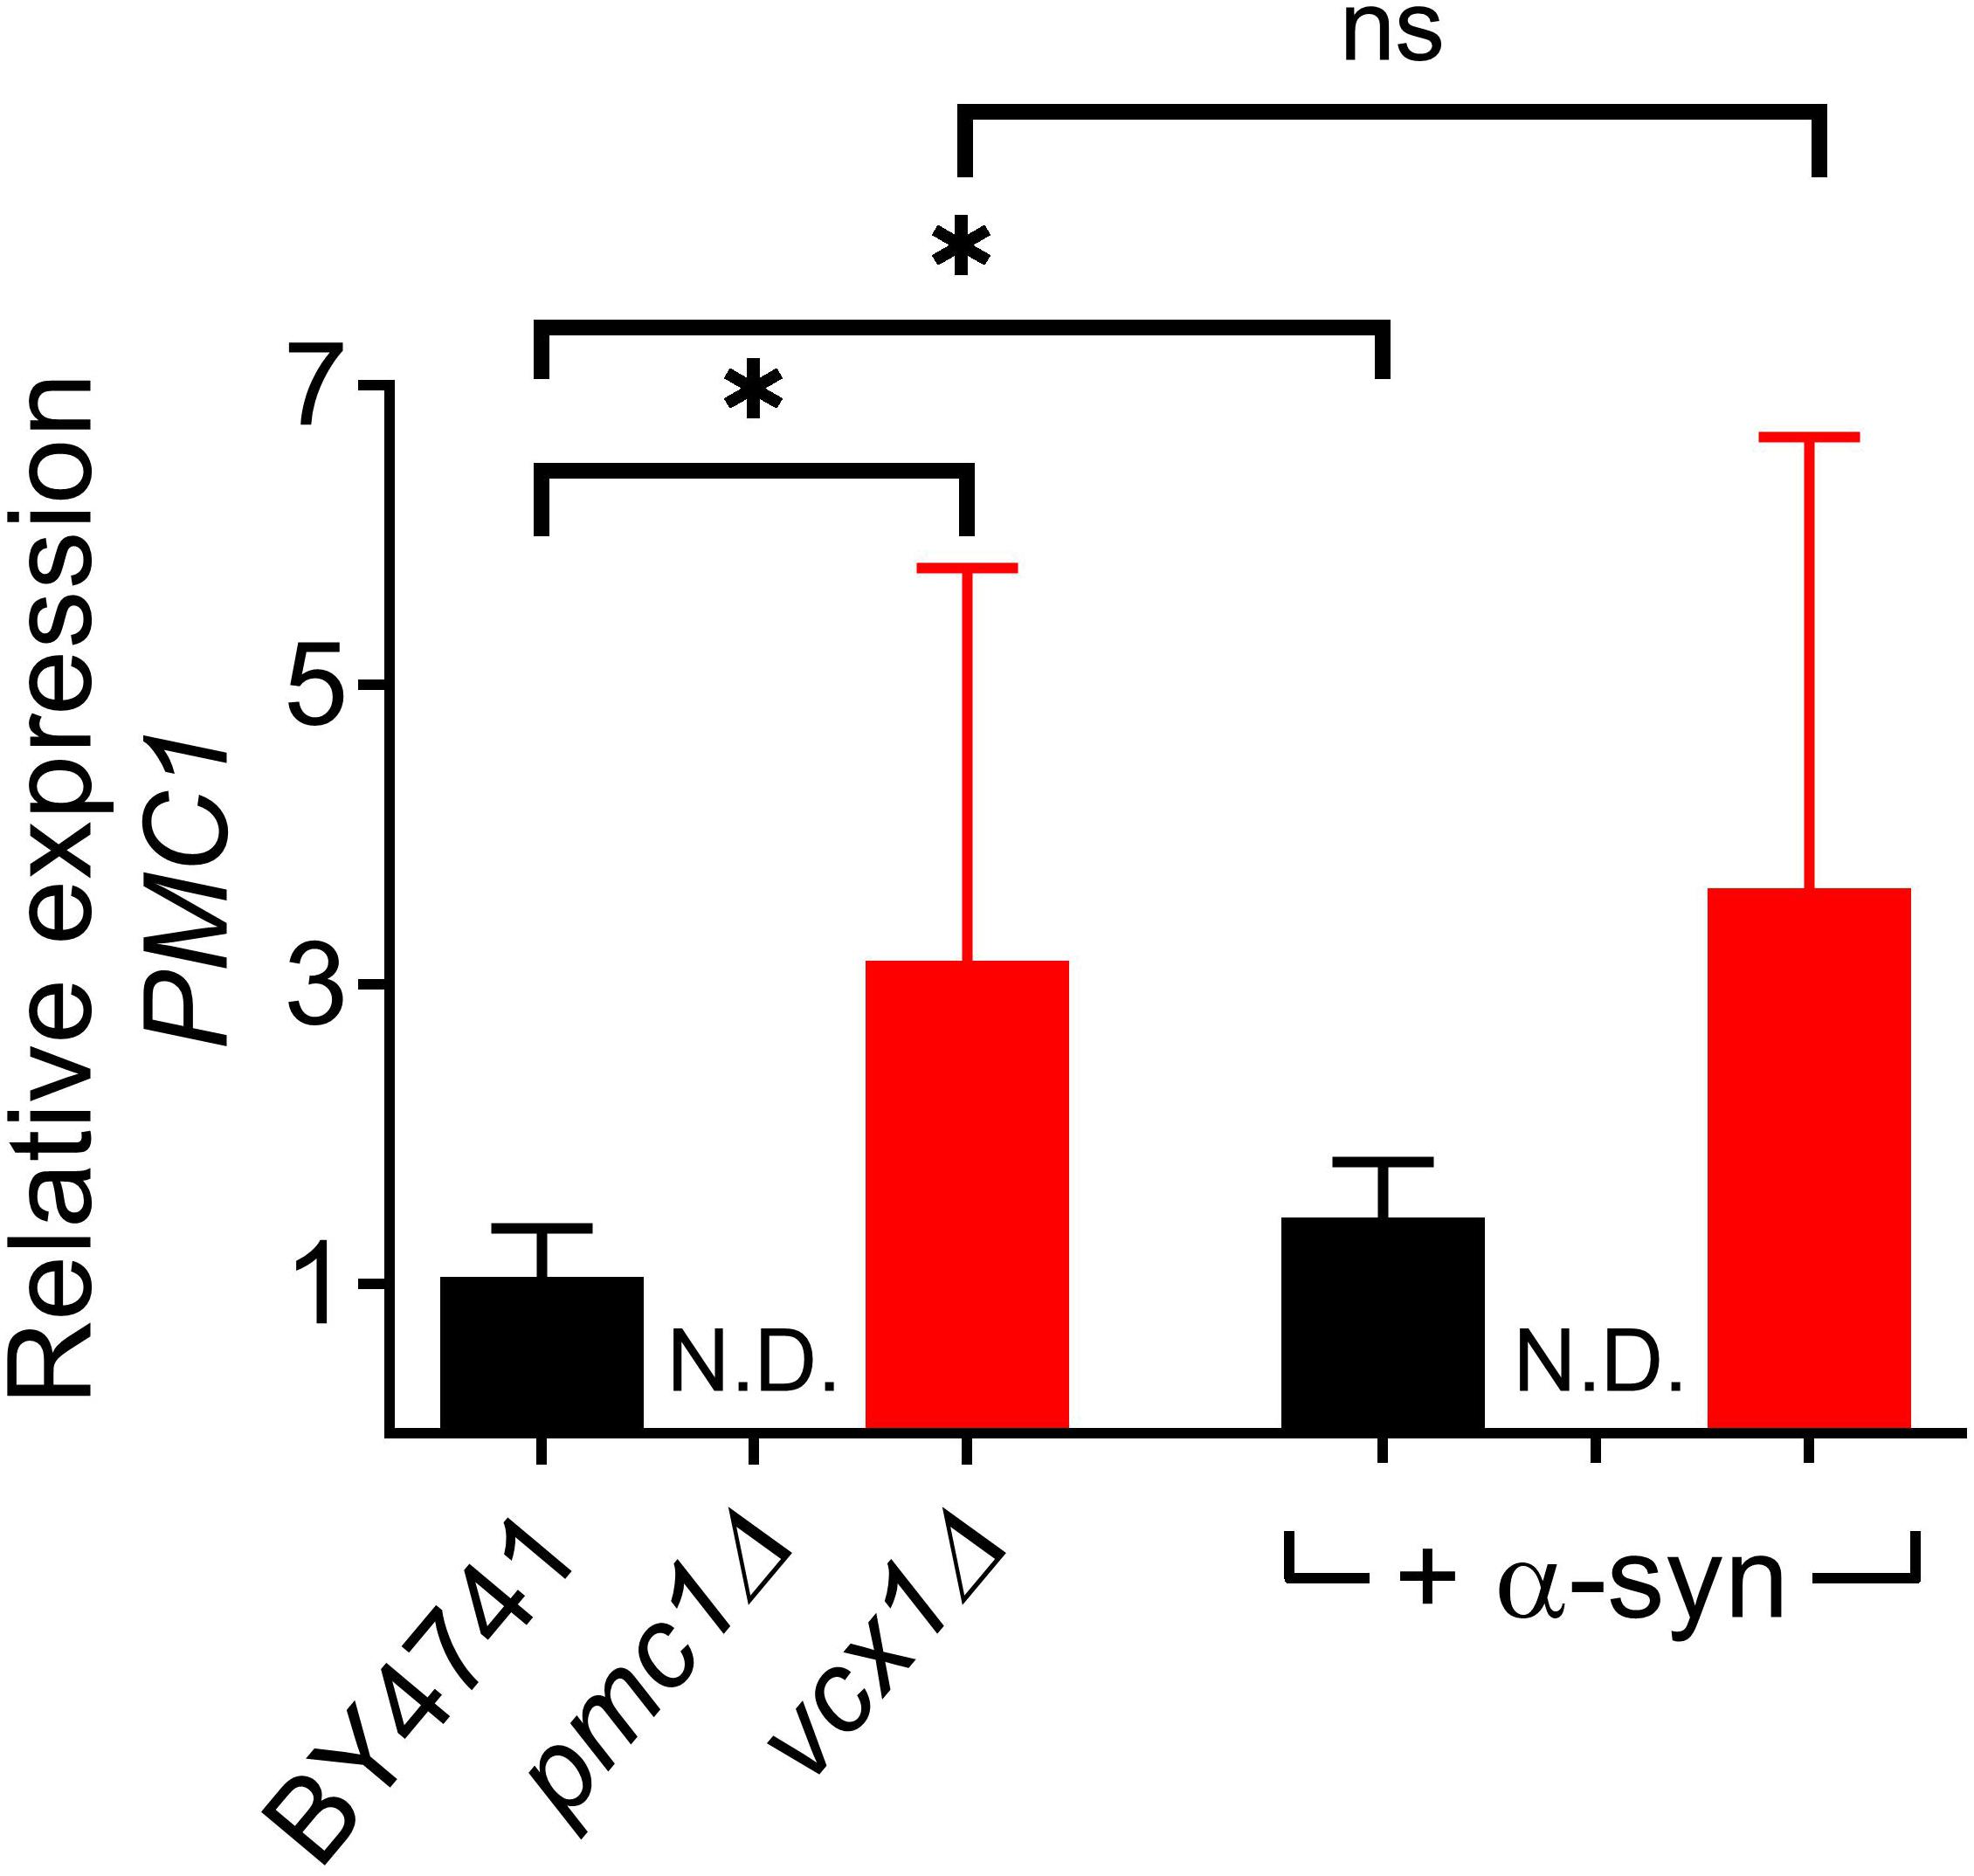
Figure 7. Relative PMC1 expression levels in vcx1Δ strains. Bar graph depicting relative mRNA levels of PMC1 in BY4741, pmc1Δ and vcx1Δ cells and cells overexpressing α-syn. Bars represent the means ± SD of at least 6 independent quantitative PCR assays. The statistical significance was assessed using unpaired Student’s t-test. ns (not significant) P > 0.05; *P ≤ 0.05; N.D, non-detectable.
Discussion
In this work, we particularly focused on the effects of α-syn on yeast Ca2+ homeostasis. Overexpression of α-syn in wild-type yeast cells affects Ca2+ clearance (as indicated by incomplete Ca2+ decay upon removal of extracellular Ca2+, denoted as the Rest [Ca2+]) and storage (as indicated by a shift from a biphasic to a quasi-monophasic Ca2+ release transient upon membrane permeabilization, denoted as the Peak [Ca2+]).
Yeast cells overexpressing α-syn showed increased cytosolic Ca2+ levels in Ca2+ free medium (increased Rest [Ca2+]). This increase may result from an enhanced Ca2+ efflux from intracellular stores and/or a reduced organellar Ca2+ uptake. Since several studies have demonstrated that α-syn may form Ca2+ permeable pores (Quist et al., 2005; Schmidt et al., 2012; Stockl et al., 2013; Angelova et al., 2016), the increased cytosolic Ca2+ levels may simply reflect increased Ca2+ leakage from intracellular Ca2+ stores. Results obtained in PMC1 overexpressing strains are in line with this conclusion. Indeed, the reduced effect of α-syn in PMC1 overexpressing cells could be easily explained by increased Pmc1 Ca2+ pumping activity, which opposes the α-syn-induced leakage. Similarly, the reduced effect of α-syn on Rest [Ca2+] in vcx1Δ cells likely reflects the compensatory increased expression of PMC1 in this deletion strain.
In wild-type yeast cells, a biphasic Ca2+ release transient was consistently found. In previous work (D’hooge et al., 2015), we have postulated that the initial fast phase mainly reflects free releasable Ca2+ from organelles (including ER, Golgi, mitochondria, vacuole and vesicle pools) while the second slower phase reflects the release of organellar bound Ca2+ (mainly Ca2+ bound to vacuolar polyphosphates). The finding that the deletion of Pmc1, the main vacuolar Ca2+ transporter, strongly reduces the second slower component further supports this hypothesis.
Yeast cells overexpressing α-syn typically showed a shift from biphasic to a quasi-monophasic release of stored Ca2+. Several studies have demonstrated that α-syn overexpression strongly inhibits vesicle trafficking (Cooper et al., 2006; Larsen et al., 2006; Gitler et al., 2008; Lee et al., 2011; Sancenon et al., 2012; Wang and Hay, 2015). To investigate whether changes in vesicle trafficking may underlie the shift from a biphasic to a quasi-monophasic Ca2+ release, we used yeast cells carrying a temperature-sensitive (ts) mutation in SEC4 (sec4ts). Our reigning hypothesis is that dysfunction of Sec4 disrupts exocytosis (Novick et al., 1993; Brennwald et al., 1994) and therefore significantly increases the size of the pool of vesicles. Assuming that vesicles are Ca2+ loaded, the number of vesicles available for rapid Ca2+ release in response to membrane permeabilization will affect the amplitude and kinetics of the Ca2+ release transient. As expected, at restrictive temperature sec4ts cells displayed a fast-rising Ca2+ release transient which presumably reflects a fast Ca2+ release from stocked vesicles. Because a similar fast-rising Ca2+ release transient was observed in yeast cells overexpressing α-syn, we propose that the shift of biphasic to quasi-monophasic Ca2+ release transient in α-syn overexpressing cells may reflect an increase in the pool size of vesicles that are no longer able to undergo fusion. In α-syn overexpressing cells, the accumulation of Ca2+ into these vesicles seems to be dependent on Pmc1 activity, as based on the changes in Peak [Ca2+] in parallel with PMC1 expression levels (compare pmc1Δ, BY4741 and BY4741-pPMC1 cells). Furthermore, while control cells showed a typical single large Pmc1-containing vacuole, cells expressing α-syn accumulated multiple small Pmc1-containing vesicles. Co-staining with endocytic marker FM4-64 revealed co-localization with vacuolar membranes. In accordance with these observations, we therefore propose that the additional pool of vesicles constitute fragmentation and vesiculation of vacuolar membranes, which display fewer fusion events as a consequence of α-syn interaction with vesicle trafficking components (Gitler et al., 2008; Zabrocki et al., 2008; Soper et al., 2011; Bridi and Hirth, 2018; Huang et al., 2019). Additionally, increased organellar Ca2+ leakage (α-syn pore forming activity) is expected to shorten the duration of the Ca2+ release transient and to reduce the time to peak [Ca2+] release.
The decay phase of the Ca2+ release transient was faster in α-syn expressing cells. In permeabilized cells, the rate of decay of the Ca2+ release transient reflects a balance between organellar Ca2+ release and Ca2+ leakage across the plasma membrane. In α-syn overexpressing cells, the Ca2+ release occurs at high cytosolic Ca2+ levels (peak [Ca2+] 2.51 ± 0.23 μM in BY4741 +α-syn) while this occurs in control cells at much lower levels (peak [Ca2+] 1.34 ± 0.21 μM in BY4741). Therefore, the initial Ca2+ leak across the plasma membrane will be significantly larger in the BY4741 +α-syn cells resulting in a faster decay of the Ca2+ release component. Additionally, as organellar Ca2+ leakage is likely to be increased (α-syn pore forming activity) in α-syn overexpressing cells, the total Ca2+ vacuolar storage will be lower resulting in a faster decay of the Ca2+ release component.
Finally, overexpression of PMC1 in BY4741 and in pmc1Δ abolished the α-syn-related cytotoxicity on growth. As Peak [Ca2+] increased and Rest [Ca2+] decreased in parallel with PMC1 expression levels, this observation suggests that the cytotoxicity of α-syn is closer related to its propensity to form pores rather than disrupting vesicle trafficking.
However, important to note is that overexpression of PMC1 in vcx1Δ cells did not reduce α-syn-induced toxicity. In vcx1Δ cells, it was found that PMC1 expression was enhanced. As PMC1 is a calcineurin-dependent gene and calcineurin may contribute to α-syn-induced toxicity (Caraveo et al., 2014) these findings raise the possibility that loss of Vcx1 function or calcineurin activity may create a cellular environment that augments α-syn-induced toxicity and warrants further investigation.
Data Availability Statement
All datasets generated for this study are included in the article/Supplementary Material.
Author Contributions
GC and JW supervised the project. MD, VV, T-YM, and PD’h performed the experiments and analyzed the data. VF provided yeast strains and vectors. VV, T-YM, and GC prepared the manuscript. All authors revised the manuscript.
Funding
This work was supported by a fellowship from the Fund for Scientific Research Flanders (F.W.O. Vlaanderen) to VF, a fellowship of the Taiwanese Government to T-YM, research grants of KU Leuven and F.W.O. Vlaanderen to JW and GC, and Hercules funding (Equipment renewal Flemish government) to GC.
Conflict of Interest
JW declares that he is co-founder and shareholder of the KU Leuven spin-off companies reMYND nv (Leuven, Belgium) and ADx NeuroSciences nv (Ghent, Belgium), but this did not influence in any way the studies reported in the manuscript.
The remaining authors declare that the research was conducted in the absence of any commercial or financial relationships that could be construed as a potential conflict of interest.
Supplementary Material
The Supplementary Material for this article can be found online at: https://www.frontiersin.org/articles/10.3389/fgene.2020.00266/full#supplementary-material
References
Adamczyk, A., and Strosznajder, J. B. (2006). Alpha-synuclein potentiates Ca2+ influx through voltage-dependent Ca2+ channels. Neuroreport 17, 1883–1886. doi: 10.1097/wnr.0b013e3280115185
Allen, D. G., and Blinks, J. R. (1978). Calcium transients in aequorin-injected frog cardiac muscle. Nature 273, 509–513. doi: 10.1038/273509a0
Angelova, P. R., Ludtmann, M. H. R., Horrocks, M. H., Negoda, A., Cremades, N., Klenerman, D., et al. (2016). Calcium is a key factor in a-synuclein induced neurotoxicity. J. Cell Sci. 129, 1792–1801. doi: 10.1242/jcs.180737
Appel-Cresswell, S., Vilarino-Guell, C., Encarnacion, M., Sherman, H., Yu, I., Shah, B., et al. (2013). Alpha-synuclein p.H50Q, a novel pathogenic mutation for Parkinson’s disease. Mov. Dis. 28, 811–813. doi: 10.1002/mds.25421
Auluck, P. K., Caraveo, G., and Lindquist, S. (2010). α-synuclein: membrane interactions and toxicity in Parkinson’s Disease. Annu. Rev. Cell Dev. Biol. 26, 211–233. doi: 10.1146/annurev.cellbio.042308.113313
Bonora, M., Giorgi, C., Bononi, A., Marchi, S., Patergnani, S., Rimessi, A., et al. (2013). Subcellular calcium measurements in mammalian cells using jellyfish photoprotein aequorin-based probes. Nat. Protoc. 8:2105. doi: 10.1038/nprot.2013.127
Brennwald, P., Kearns, B., Champion, K., Keranen, S., Bankaitis, V., and Novick, P. (1994). Sec9 is a SNAP-25-like component of a yeast SNARE complex that may be the effector of Sec4 function in exocytosis. Cell 79, 245–258. doi: 10.1016/0092-8674(94)90194-90195
Bridi, J. C., and Hirth, F. (2018). Mechanisms of α-synuclein induced synaptopathy in Parkinson’s Disease. Front. Neurosci. 12:80. doi: 10.3389/fnins.2018.00080
Burre, J., Sharma, M., and Sudhof, T. C. (2014). alpha-Synuclein assembles into higher-order multimers upon membrane binding to promote SNARE complex formation. Proc. Natl. Acad. Sci. U.S.A. 111, E4274–E4283. doi: 10.1073/pnas.1416598111
Büttner, S., Bitto, A., Ring, J., Augsten, M., Zabrocki, P., Eisenberg, T., et al. (2008). Functional mitochondria are required for a-synuclein toxicity in aging yeast. J. Biol. Chem. 283, 7554–7560. doi: 10.1074/jbc.m708477200
Büttner, S., Faes, L., Reichelt, W. N., Broeskamp, F., Habernig, L., Benke, S., et al. (2013). The Ca2+/Mn2+ ion-pump PMR1 links elevation of cytosolic Ca2+ levels to a-synuclein toxicity in Parkinson’s disease models. Cell Death. Differ. 20, 465–477. doi: 10.1038/cdd.2012.142
Cagnac, O., Aranda-sicilia, M. N., Leterrier, M., and Venema, K. (2010). Vacuolar cation/H+ antiporters of Saccharomyces cerevisiae. J. Biol. Chem. 285, 33914–33922. doi: 10.1074/jbc.m110.116590
Caraveo, G., Auluck, P. K., Whitesell, L., Chung, C. Y., Baru, V., Mosharov, E. V., et al. (2014). Calcineurin determines toxic versus beneficial responses to a-synuclein. Proc. Natl. Acad. Sci. U.S.A. 111, 3544–3552.
Chan, C. S., Gertler, T. S., and Surmeier, D. J. (2009). Calcium homeostasis, selective vulnerability and Parkinson’s disease. Trends Neurosci. 32, 249–256. doi: 10.1016/j.tins.2009.01.006
Chartier-Harlin, M. C., Kachergus, J., Roumier, C., Mouroux, V., Douay, X., Lincoln, S., et al. (2004). a-synuclein locus duplication as a cause of familial Parkinson’s disease. Lancet 364, 1167–1169. doi: 10.1016/s0140-6736(04)17103-1
Choi, B.-K., Choi, M.-G., Kim, J.-Y., Yang, Y., Lai, Y., Kweon, D.-H., et al. (2013). Large a-synuclein oligomers inhibit neuronal SNARE-mediated vesicle docking. Proc. Natl. Acad. Sci. U.S.A. 110, 4087–4092. doi: 10.1073/pnas.1218424110
Cooper, A. A., Gitler, A. D., Cashikar, A., Haynes, C. M., Hill, K. J., Bhullar, B., et al. (2006). a-synuclein blocks ER-golgi traffic and rab1 rescues neuron loss in Parkinson’s models. Science 313, 324–328. doi: 10.1126/science.1129462
Danzer, K. M., Haasen, D., Karow, A. R., Moussaud, S., Habeck, M., Giese, A., et al. (2007). Different Species of a-synuclein oligomers induce calcium influx and seeding. J. Neurosci. 27, 9220–9232. doi: 10.1523/jneurosci.2617-07.2007
D’hooge, P., Coun, C., Van Eyck, V., Faes, L., Ghillebert, R., Mariën, L., et al. (2015). Ca2+ homeostasis in the budding yeast Saccharomyces cerevisiae: impact of ER/Golgi Ca2+ storage. Cell Calcium. 58, 226–235. doi: 10.1016/j.ceca.2015.05.004
Franssens, V., Boelen, E., Anandhakumar, J., Vanhelmont, T., and Winderickx, J. (2010). Yeast unfolds the road map toward a-synuclein-induced cell death. Cell Death. Differ. 17, 746–753. doi: 10.1038/cdd.2009.203
Ghiglieri, V., Calabrese, V., and Calabresi, P. (2018). Alpha-synuclein: from early synaptic dysfunction to neurodegeneration. Front. Neurol. 9:295. doi: 10.3389/fneur.2018.00295
Giaever, G., and Nislow, C. (2014). The yeast deletion collection: a decade of functional genomics. Genetics 197, 451–465. doi: 10.1534/genetics.114.161620
Gietz Daniel, R., Schiestl, R. H., Willems, A. R., and Woods, R. A. (1995). Studies on the transformation of intact yeast cells by the LiAc/SS-DNA/PEG procedure. Yeast 11, 355–360. doi: 10.1002/yea.320110408
Gitler, A. D., Bevis, B. J., Shorter, J., Strathearn, K. E., Hamamichi, S., Su, L. J., et al. (2008). The Parkinson’s disease protein a-synuclein disrupts cellular Rab homeostasis. Proc. Natl. Acad. Sci. U.S.A. 105, 145–150. doi: 10.1073/pnas.0710685105
Hettiarachchi, N. T., Parker, A., Dallas, M. L., Pennington, K., Hung, C.-C., Pearson, H. A., et al. (2009). A-Synuclein modulation of Ca2+ signaling in human neuroblastoma (SH-SY5Y) cells. J. Neurochem. 111, 1192–1201. doi: 10.1111/j.1471-4159.2009.06411.x
Huang, M., Wang, B., Li, X., Fu, C., Wang, C., and Kang, X. (2019). α-Synuclein: a multifunctional player in exocytosis, endocytosis, and vesicle recycling. Front. Neurosci. 13:28. doi: 10.3389/fnins.2019.00028
Krüger, R., Kuhn, W., Müller, T., Woitalla, D., Graeber, M., Kösel, S., et al. (1998). Ala30Pro mutation in the gene encoding a-synuclein in Parkinson’s disease. Nat. Genet. 18, 106–108. doi: 10.1038/ng0298-106
Larsen, K. E., Schmitz, Y., Troyer, M. D., Mosharov, E., Dietrich, P., Quazi, A. Z., et al. (2006). Alpha-synuclein overexpression in PC12 and chromaffin cells impairs catecholamine release by interfering with a late step in exocytosis. J. Neurosci. 26, 11915–11922. doi: 10.1523/jneurosci.3821-06.2006
Lashuel, H. A., Overk, C. R., Oueslati, A., and Masliah, E. (2012). The many faces of α-synuclein: from structure and toxicity to therapeutic target. Nat. Rev. Neurosci. 14:38. doi: 10.1038/nrn3406
Lee, H. J., Kang, S. J., Lee, K., and Im, H. (2011). Human alpha-synuclein modulates vesicle trafficking through its interaction with prenylated Rab acceptor protein 1. Biochem. Biophys. Res. Commun. 412, 526–531. doi: 10.1016/j.bbrc.2011.07.028
Lesage, S., Anheim, M., Letournel, F., Bousset, L., Wang, B., Rozas, N., et al. (2013). G51D a-synuclein mutation causes a novel parkinsonian-pyramidal syndrome. Ann. Neurol. 73, 459–471. doi: 10.1002/ana.23894
Liu, Z., Tyo, K. E. J., Martin, Z., Jose, L., Petranovic, D., and Nielsen, J. (2012). Different expression systems for production of recombinant proteins in Saccharomyces cerevisiae. Biotechnol. Bioeng. 109, 1259–1268. doi: 10.1002/bit.24409
Novick, P., Brennwald, P., Walworth, N. C., Kabcenell, A. K., Garrett, M., Moya, M., et al. (1993). The cycle of SEC4 function in vesicular transport. Ciba Found. Symp. 176, 218–228.
Outeiro, T. F., and Lindquist, S. (2003). Yeast cells provide insight into alpha-synuclein biology and pathobiology. Science 302, 1772–1775. doi: 10.1126/science.1090439
Pacelli, C., Gigue, N., and Slack, R. S. (2015). Elevated mitochondrial bioenergetics and axonal arborization size are key contributors to the vulnerability of dopamine neurons. Curr. Biol. 25, 2349–2360. doi: 10.1016/j.cub.2015.07.050
Pasternak, B., Svanström, H., Nielsen, N. M., Fugger, L., Melbye, M., and Hviid, A. (2012). Use of calcium channel blockers and Parkinson’s disease. Am. J. Epidemiol. 175, 627–635. doi: 10.1093/aje/kwr362
Peelaerts, W., Bousset, L., Van der Perren, A., Moskalyuk, A., Pulizzi, R., Giugliano, M., et al. (2015). a-Synuclein strains cause distinct synucleinopathies after local and systemic administration. Nature 522, 340–344. doi: 10.1038/nature14547
Pinotsi, D., Michel, C. H., Buell, A. K., Laine, R. F., Mahou, P., Dobson, C. M., et al. (2016). Nanoscopic insights into seeding mechanisms and toxicity of a-synuclein species in neurons. Proc. Natl. Acad. Sci. U.S.A. 113, 3815–3819. doi: 10.1073/pnas.1516546113
Poewe, W., Seppi, K., Tanner, C. M., Halliday, G. M., Brundin, P., Volkmann, J., et al. (2017). Parkinson disease. Nat. Rev. Dis. Primers 3:17013. doi: 10.1038/nrdp.2017.13
Polymeropoulos, M. H., Lavedan, C., Leroy, E., Ide, S. E., Dehejia, A., Dutra, A., et al. (1997). Mutation in the a-Synuclein gene identified in families with Parkinson’s Disease. Science 276, 2045–2047. doi: 10.1126/science.276.5321.2045
Quist, A., Doudevski, I., Lin, H., Azimova, R., Ng, D., Frangione, B., et al. (2005). Amyloid ion channels: a common structural link for protein-misfolding disease. Proc. Natl. Acad. Sci. U.S.A. 102, 10427–10432. doi: 10.1073/pnas.0502066102
Rcom-H’cheo-Gauthier, A., Goodwin, J., and Pountney, D. (2014). Interactions between Calcium and Alpha-Synuclein in Neurodegeneration. Biomolecules 4, 795–811. doi: 10.3390/biom4030795
Sancenon, V., Lee, S. A., Patrick, C., Griffith, J., Paulino, A., Outeiro, T. F., et al. (2012). Suppression of a-synuclein toxicity and vesicle trafficking defects by phosphorylation at S129 in yeast depends on genetic context. Hum. Mol. Genet. 21, 2432–2449. doi: 10.1093/hmg/dds058
Scharff-Poulsen, P., and Pedersen, P. A. (2013). Saccharomyces cerevisiae-based platform for rapid production and evaluation of eukaryotic nutrient transporters and transceptors for biochemical studies and crystallography. PLoS One 8:e76851. doi: 10.1371/journal.pone.0076851
Schindelin, J., Arganda-Carreras, I., Frise, E., Kaynig, V., Longair, M., Pietzsch, T., et al. (2012). Fiji: an open-source platform for biological-image analysis. Nat. Methods 9, 676–682. doi: 10.1038/nmeth.2019
Schmidt, F., Levin, J., Kamp, F., Kretzschmar, H., Giese, A., and Botzel, K. (2012). Single-channel electrophysiology reveals a distinct and uniform pore complex formed by alpha-synuclein oligomers in lipid membranes. PLoS One 7:e42545. doi: 10.1371/journal.pone.0042545
Sharma, N., Brandis, K. A., Herrera, S. K., Johnson, B. E., Vaidya, T., Shrestha, R., et al. (2006). a-Synuclein budding yeast model: toxicity enhanced by impaired proteasome and oxidative stress. J. Mol. Neurosci. 28, 161–178. doi: 10.1385/jmn:28:2:161
Shrivastava, A. N., Redeker, V., Fritz, N., Pieri, L., Almeida, L. G., Spolidoro, M., et al. (2015). alpha-synuclein assemblies sequester neuronal alpha3-Na+/K+-ATPase and impair Na+ gradient. EMBO J. 34, 2408–2423. doi: 10.15252/embj.201591397
Singleton, A. B., Farrer, M., Johnson, J., Singleton, A., Hague, S., Kachergus, J., et al. (2003). a-synuclein locus triplication causes Parkinson’s Disease. Science 302:841. doi: 10.1126/science.1090278
Soper, J. H., Kehm, V., Burd, C. G., Bankaitis, V. A., and Lee, V. M. Y. (2011). Aggregation of α-synuclein in S. cerevisiae is associated with defects in endosomal trafficking and phospholipid biosynthesis. J. Mol. Neurosci. 43, 391–405. doi: 10.1007/s12031-010-9455-9455
Stockl, M. T., Zijlstra, N., and Subramaniam, V. (2013). alpha-Synuclein oligomers: an amyloid pore? Insights into mechanisms of alpha-synuclein oligomer-lipid interactions. Mol. Neurobiol. 47, 613–621. doi: 10.1007/s12035-012-8331-8334
Tisi, R., Baldassa, S., Belotti, F., and Martegani, E. (2002). Phospholipase C is required for glucose-induced calcium influx in budding yeast. FEBS Lett. 520, 133–138. doi: 10.1016/s0014-5793(02)02806-5
Tofaris, G. K., and Spillantini, M. G. (2007). Physiological and pathological properties of a-synuclein. Cell. Mol. Life Sci. 64, 2194–2201. doi: 10.1007/s00018-007-7217-5
Tosatto, L., Andrighetti, A. O., Plotegher, N., Antonini, V., Tessari, I., Ricci, L., et al. (2012). Alpha-synuclein pore forming activity upon membrane association. Biochim. Biophy. Acta Biomembr. 1818, 2876–2883. doi: 10.1016/j.bbamem.2012.07.007
Wang, T., and Hay, J. C. (2015). Alpha-synuclein toxicity in the early secretory pathway: how it drives neurodegeneration in parkinsons disease. Front. Neurosci. 9:433. doi: 10.3389/fnins.2015.00433
Zabrocki, P., Bastiaens, I., Delay, C., Bammens, T., Ghillebert, R., Pellens, K., et al. (2008). Phosphorylation, lipid raft interaction and traffic of a-synuclein in a yeast model for Parkinson. Biochim. Biophy. Acta Mol. Cell Res. 1783, 1767–1780. doi: 10.1016/j.bbamcr.2008.06.010
Keywords: yeast, Saccharomyces cerevisiae, α-synuclein, Ca2+ signaling, vesicle trafficking, pore formation, Ca2+ ATPase Pmc1
Citation: Callewaert G, D’hooge P, Ma T-Y, Del Vecchio M, Van Eyck V, Franssens V and Winderickx J (2020) Decreased Vacuolar Ca2+ Storage and Disrupted Vesicle Trafficking Underlie Alpha-Synuclein-Induced Ca2+ Dysregulation in S. cerevisiae. Front. Genet. 11:266. doi: 10.3389/fgene.2020.00266
Received: 03 September 2019; Accepted: 05 March 2020;
Published: 08 May 2020.
Edited by:
S. Michal Jazwinski, Tulane University, United StatesReviewed by:
Blagovesta Popova, University of Göttingen, GermanyDaniel F. Tardiff, Yumanity Therapeutics, United States
Copyright © 2020 Callewaert, D’hooge, Ma, Del Vecchio, Van Eyck, Franssens and Winderickx. This is an open-access article distributed under the terms of the Creative Commons Attribution License (CC BY). The use, distribution or reproduction in other forums is permitted, provided the original author(s) and the copyright owner(s) are credited and that the original publication in this journal is cited, in accordance with accepted academic practice. No use, distribution or reproduction is permitted which does not comply with these terms.
*Correspondence: Geert Callewaert, Z2VlcnQuY2FsbGV3YWVydEBrdWxldXZlbi5iZQ==; Joris Winderickx, am9yaXMud2luZGVyaWNreEBrdWxldXZlbi5iZQ==