- 1Institute of Urban Agriculture, Chinese Academy of Agricultural Sciences, Chengdu, China
- 2School of Life Sciences, Chongqing University, Chongqing, China
- 3Zhengzhou Research Base, State Key Laboratory of Cotton Biology, Zhengzhou University, Zhengzhou, China
DNA methylation is an indispensable epigenetic modification that dynamically regulates gene expression and genome stability during cell growth and development processes. The target of rapamycin (TOR) has emerged as a central regulator to regulate many fundamental cellular metabolic processes from protein synthesis to autophagy in all eukaryotic species. However, little is known about the functions of TOR in DNA methylation. In this study, the synergistic growth inhibition of Arabidopsis seedlings can be observed when DNA methylation inhibitor azacitidine was combined with TOR inhibitors. Global DNA methylation level was evaluated using whole-genome bisulfite sequencing (WGBS) under TOR inhibition. Hypomethylation level of whole genome DNA was observed in AZD-8055 (AZD), rapamycin (RAP) and AZD + RAP treated Arabidopsis seedlings. Based on functional annotation and KEGG pathway analysis of differentially methylated genes (DMGs), most of DMGs were enriched in carbon metabolism, biosynthesis of amino acids and other metabolic processes. Importantly, the suppression of TOR caused the change in DNA methylation of the genes associated with plant hormone signal transduction, indicating that TOR played an important role in modulating phytohormone signals in Arabidopsis. These observations are expected to shed light on the novel functions of TOR in DNA methylation and provide some new insights into how TOR regulates genome DNA methylation to control plant growth.
Introduction
DNA methylation is an important part of epigenetics, which is widely distributed in microbes, animals and plants. DNA methylation plays an important role in controlling transcriptional silencing of transposon, regulating gene expression and maintaining plant development (Moore et al., 2013; Bouyer et al., 2017; Zhang et al., 2018), which is one of the most studied epigenetic modifications in epigenetics. The methyl of DNA methylation provided by S-adenosylmethionine is transferred to the cytosine of genome DNA under the catalysis of DNA methyltransferase (Razin and Riggs, 1980). Mammals mainly methylate cytosine at symmetrical CG site, while plant DNA methylation occurs in all cytosine sequence contexts: CG, CHG, and CHH (H represents A, T, or C) (Lister et al., 2008). DNA methylation regions are mainly found in highly repetitive sequences (transposon and rDNA), promoter region (suppressing gene expression), coding sequence region and intergenic region. More than 5% of the expressed genes have DNA methylation in their promoter region, and more than 33% of genes contain DNA methylation within the coding sequence region in Arabidopsis (Zhang et al., 2006). Promoter-methylated genes are low expressed and show a greater degree of tissue specific expression, whereas genes methylated in transcribed regions are highly expressed (Zhang et al., 2006). However, recently study also showed that methylation in transcribed regions can negatively regulate the gene expression (Long et al., 2014; Lou et al., 2014).
DNA methylation is critically important for normal growth and development in both animals and plants; null mutations of DNA methyltransferase DNMT1 or DNMT3 result in embryonic lethality in mouse, and drm1/drm2/cmt3 triple mutants exhibit developmental abnormalities in Arabidopsis (Grace and Bestor, 2005; Chan et al., 2006). 5-Azacytidine (Azacitidine) is a nucleoside analog of cytidine that specifically inhibits DNA methylation by capturing DNA methyltransferase in bacteria and mammalian (Christman, 2002). In plants, genome-wide demethylation caused by methylation inhibitor azacitidine leads to growth retardation, malformations, and changes in the flowering time or flower sexuality (Fieldes et al., 2005; Marfil et al., 2012). Interestingly, azacitidine can increase amounts of somatic embryos in somatic embryogenesis stage, indicating that DNA demethylation caused by azacitidine promotes the reprogramming of gene expression, acquisition of totipotency and initiation of embryogenesis in explant (Osorio-Montalvo et al., 2018).
The target of rapamycin (TOR) is an evolutionarily conserved protein kinase that integrates nutrient and energy signaling to regulate growth and homeostasis in fungi, animals and plants. TOR is activated by both nitrogen and carbon metabolites and promotes energy-consuming processes such as mRNA translation, protein biosynthesis and anabolism while represses autophagy and catabolism in times of energy abundance (Dobrenel et al., 2016; Juppner et al., 2018; Ahmad et al., 2019). However, deregulated mammalian target of rapamycin (mTOR) signaling is implicated in the progression of cancer and diabetes, and the aging process in mammalian (Saxton and Sabatini, 2017). Genetic, physiological and genomic studies revealed that TOR plays central roles in plant embryogenesis, seedling growth, root and shoot meristem activation, root hair elongation, leaf expansion, flowering and senescence (Ren et al., 2011, 2012; Xiong et al., 2013; Yuan et al., 2013; Xiong and Sheen, 2014; Deng et al., 2017; Shi et al., 2018). TOR gene was originally identified by genetic mutant screens for resistance to rapamycin in budding yeast (Heitman et al., 1991). Subsequent research showed that null mutation of tor resulted in embryonic lethality in yeast, animals and plants (Heitman et al., 1991; Ren et al., 2011; Saxton and Sabatini, 2017), indicating that TOR was an essential kinase in eukaryotes. Since rapamycin acts as a specific inhibitor of the TOR kinase, the TOR signaling pathway is quickly considered as a central regulator by application of rapamycin in yeast and animals (Benjamin et al., 2011). However, TOR is insensitive to rapamycin in plants, which is mainly due to evolutionary mutation of the FK506-binding protein 12 (FKBP12) gene, resulting in loss of function to bind rapamycin (Xu et al., 1998). To dissect TOR signaling pathway in Arabidopsis by using rapamycin, Ren et al. (2012) generated a rapamycin-hypersensitive line (BP12-2) by introducing yeast FKBP12 gene into Arabidopsis. Inhibition of AtTOR in BP12-2 line by rapamycin resulted in slower root, shoot and leaf growth and development, leading to poor carbon and nitrogen metabolism, nutrient uptake and light energy utilization (Ren et al., 2012). Additionally, the ATP competitive TOR kinase inhibitors including Torin2, WYE-132, Ku-0063794, and AZD-8055 (AZD) were also applied to study the TOR pathway in plants (Montane and Menand, 2013; Li et al., 2015; Song et al., 2017, 2018). As revealed by recent studies, AZD had high specificity and strong inhibitory effects on TOR activity in flowering plants (Montane and Menand, 2013; Li et al., 2015), implying that AZD can be preferentially applied to plants to dissect TOR signaling pathway compared with other TOR kinase inhibitors in angiosperms.
The TOR signaling pathway is a central regulator in regulating cell growth, homeostasis, proliferation and metabolism (Dobrenel et al., 2016; Saxton and Sabatini, 2017; Shi et al., 2018). DNA methylation is an epigenetic mechanism that plays key roles in genome integrity, suppression of transposon, gene expression and somatic embryogenesis in plants (Osorio-Montalvo et al., 2018; Zhang et al., 2018). However, it has not been reported whether TOR directly or indirectly regulates the methylation level of genome DNA to control plant growth and development. In this study, we performed base-resolution whole-genome bisulfite sequencing (WGBS) under TOR inhibition in Arabidopsis. Differentially methylated regions and genes support the evolutionarily conserved TOR functions in ribosome biogenesis, metabolism, and cell growth. Our detailed genome-wide analysis of DNA methylation under TOR inhibition provides new insights into how TOR regulates global DNA methylation to control plant growth.
Materials and Methods
Plant Materials and Growth Conditions
WT Arabidopsis Columbia (Col-0) and the transgenic Arabidopsis BP12-2 line were used in this study (Ren et al., 2012). Sterile treatment of Arabidopsis seeds surface prior to plating. The seeds first repeatedly were shook in 75% ethanol for 2 min and the supernatant was discarded. Then, shaking the seeds repeatedly with 10% sodium hypochlorite containing 0.3% Tween-20 for 4 min, and discarding the supernatant; followed by four or five rinses with sterile water, and the supernatant was discarded. Finally, the seeds were suspended in 0.15% sterile agarose solution and kept at 4°C for 2 days. Sterilized seeds were plated on plates, and then grown in a controlled environment at 22°C under 16 h 60–80 μE⋅m–2 s–1 continuous light and 8 h darkness.
DNA Library Construction and Whole-Genome Bisulfite Sequencing
BP12-2 seedlings of 7 days were treated with DMSO, AZD (1 μM), RAP (5 μM), and AZD (1 μM) + RAP (5 μM) for 24 h, and each sample contained three biological replicates. Total genomic DNA was extracted using a plant genomic DNA kit (TIANGEN, Beijing, China) according to the manufacturer’s instructions. Genomic DNA degradation and contamination was monitored on agarose gels. DNA purity was checked using the NanoPhotometer® spectrophotometer (IMPLEN, Westlake Village, CA, United States). DNA concentration was measured using Qubit® DNA Assay Kit in Qubit® 2.0 Fluorometer (Life Technologies, CA, United States). A total amount of 5.2 microgram genomic DNA spiked with 26 ng lambda DNA were fragmented by sonication to 200–300 bp with Covaris S220, followed by end repair and adenylation. Cytosine-methylated barcodes were ligated to sonicated DNA as per manufacturer’s instructions. Then these DNA fragments were treated twice with bisulfite using EZ DNA Methylation-Gold KitTM (Zymo Research). In addition, the resulting single-strand DNA fragments were PCR amplificated using KAPA HiFi HotStart Uracil + ReadyMix (2X). Library concentration was quantified by Qubit® 2.0 Fluorometer (Life Technologies, CA, United States) and quantitative PCR, and the insert size was checked on Agilent Bioanalyzer 2100 system. The clustering of the index-coded samples was performed on a cBot Cluster Generation System using TruSeq PE Cluster Kit v3-cBot-HS (Illumia) according to the manufacturer’s instructions. After cluster generation, the prepared library were sequenced on an Illumina Hiseq 2000/2500 platform, and 100/50 bp single-end reads were generated. Image analysis and base calling were performed with the standard Illumina pipeline, and finally 100 bp paired-end reads were generated.
Estimating Methylation Level
To identify the methylation level, we employed a sliding-window approach, which was conceptually similar to approaches that have been used for bulk BS-Seq. With window size = 3,000 bp and step size = 600 bp (Smallwood et al., 2014), the sum of methylated cytosine (mC) and unmethylated cytosine (C) read counts in each window were calculated. Methylation level (ML) for each cytosine site showed the fraction of methylated C, and was defined as: ML (mC) = reads (mC)/reads (mC) + reads (C). Calculated ML was further corrected with the bisulfite non-conversion rate according to previous studies (Lister et al., 2013).
Analysis of Methylation Levels in Genomic Functional Regions
Analysis of the average methylation level of the CG, CHG, and CHH sites in genomic functional regions including promoter (2 kb region upstream of the transcription start site), 5′UTR, exon, intron and 3′UTR regions. Divided each functional element region in the genome annotation into 20 bins, and counted the number of mC and C reads in each bin. For average plots, average values in 20 bins were calculated and plotted.
Differentially Methylated Regions (DMRs) Analysis
Differentially methylated regions (DMRs) were identified using the Bsseq R package software, which used a sliding-window approach (reads coverage ≥5). The window was set to 1,000 bp and step length was 100 bp. The main steps of identification DMR were as follows: First set the sliding window and sliding step size, every 1000 bp as a window and 100 bp as the step size. Selected the DNA methylation level difference value >0.1 and the DNA methylation difference fold-change >2 between the treatment and the control sample, and the number of cytosine >10 as potential DMRs. Next, probabilities were calculated using a Fisher’s exact test. The regions with significant differences (p < 0.05) were considered as DMRs. Then, moved to the next window with the step size and repeated the above steps to obtain DMRs information of the whole genome. FDR (FDR < 0.05) was used to correct the p value of all DMRs.
GO and KEGG Enrichment Analysis of DMR-Related Genes (DMGs)
Gene Ontology (GO) enrichment analysis of genes related to DMRs was implemented by the GOseq R package (Young et al., 2010), in which gene length bias was corrected. GO terms with corrected P-value less than 0.05 were considered significantly enriched by DMGs. Kyoto Encyclopedia of Genes and Genomes (KEGG) (Minoru et al., 2008) is a database resource for understanding high-level functions and utilities of the biological system, such as the cell, the organism and the ecosystem, from molecular-level information, especially large-scale molecular datasets generated by genome sequencing and other high-through put experimental technologies1. We used KOBAS software (Mao et al., 2005) to test the statistical enrichment of DMGs in KEGG pathways.
Quantitative Real-Time PCR
Total RNA of transgenic Arabidopsis BP12-2 seedlings which treated for 24 h in mediums containing DMSO, AZD (1 μM), RAP (5 μM), and AZD (1 μM) + RAP (5 μM) was isolated using the RNAprep Pure Plant Kit (TIANGEN, Beijing, China). Total RNA was reverse transcribed into cDNA using the PrimeScript R RT reagent kit (Takara, Dalian, China). Relative transcript levels were assayed by the CFX96 real-time PCR system (BIO-RAD, United States). AtACTIN2 was used as an internal control. Real-time PCR primers were shown in Supplementary Table S1. Reaction was performed in a final volume of 20 μL containing 10 μL of 2 × Power Top Green qPCR SuperMix (TRANSGEN, Beijing, China). RNA relative quantification analyses were performed with the Bio-Rad CFX manager software. The data represented the mean ± SD of three independent experiments.
Combination Index (CI) Value Measurement
Combination index (CI) values were used to evaluate the interaction between azacitidine and AZD/RAP. The degree of reagents interaction was based on synergistic effect (CI < 1), additive effect (CI = 1), or antagonism (CI > 1) (Chou, 2006). WT and BP12-2 seeds were sown on plates containing DMSO, azacitidine, RAP, AZD, and pairwise combination for 10 days, and then fresh weight was measured for CI value assessment. Experiments were repeated at least three times. The values of affected fraction (Fa) were calculated according to the CompuSyn software program (Chou and Talalay, 1984; Chou, 2006).
Results
Azacitidine and TOR Inhibitors Synergistically Inhibit Seedlings Growth in Arabidopsis
Azacitidine is a specific inhibitor of DNA methylation, which interacts with DNA methyltransferase to inhibit DNA methylation in mammalian (Christman, 2002). To test the effect of azacitidine on seeds germination and seedlings growth in Arabidopsis, we treated Arabidopsis seeds with different concentrations of azacitidine. With the increase of azacitidine concentrations, Col-0 (WT) and BP12-2 seeds germination was not affected by azacitidine, whereas the seedlings growth was subjected to different degrees of inhibition, reflecting in the reduction of fresh weight and shorter root length (Figure 1). The 50% growth inhibitory dose (GI50) of azacitidine was 10 μM in accordance with fresh weight (Figure 1B). The phenotype of azacitidine-treated Arabidopsis seedlings is similar to that of TOR kinase inhibitors, implying that TOR may play a role in regulating DNA methylation in Arabidopsis. Interestingly, the transcription level of AtTOR did not significantly change in azacitidine-treated WT and BP12-2 seedlings (Supplementary Figure S1A), indicating that azacitidine had no effect on TOR expression.
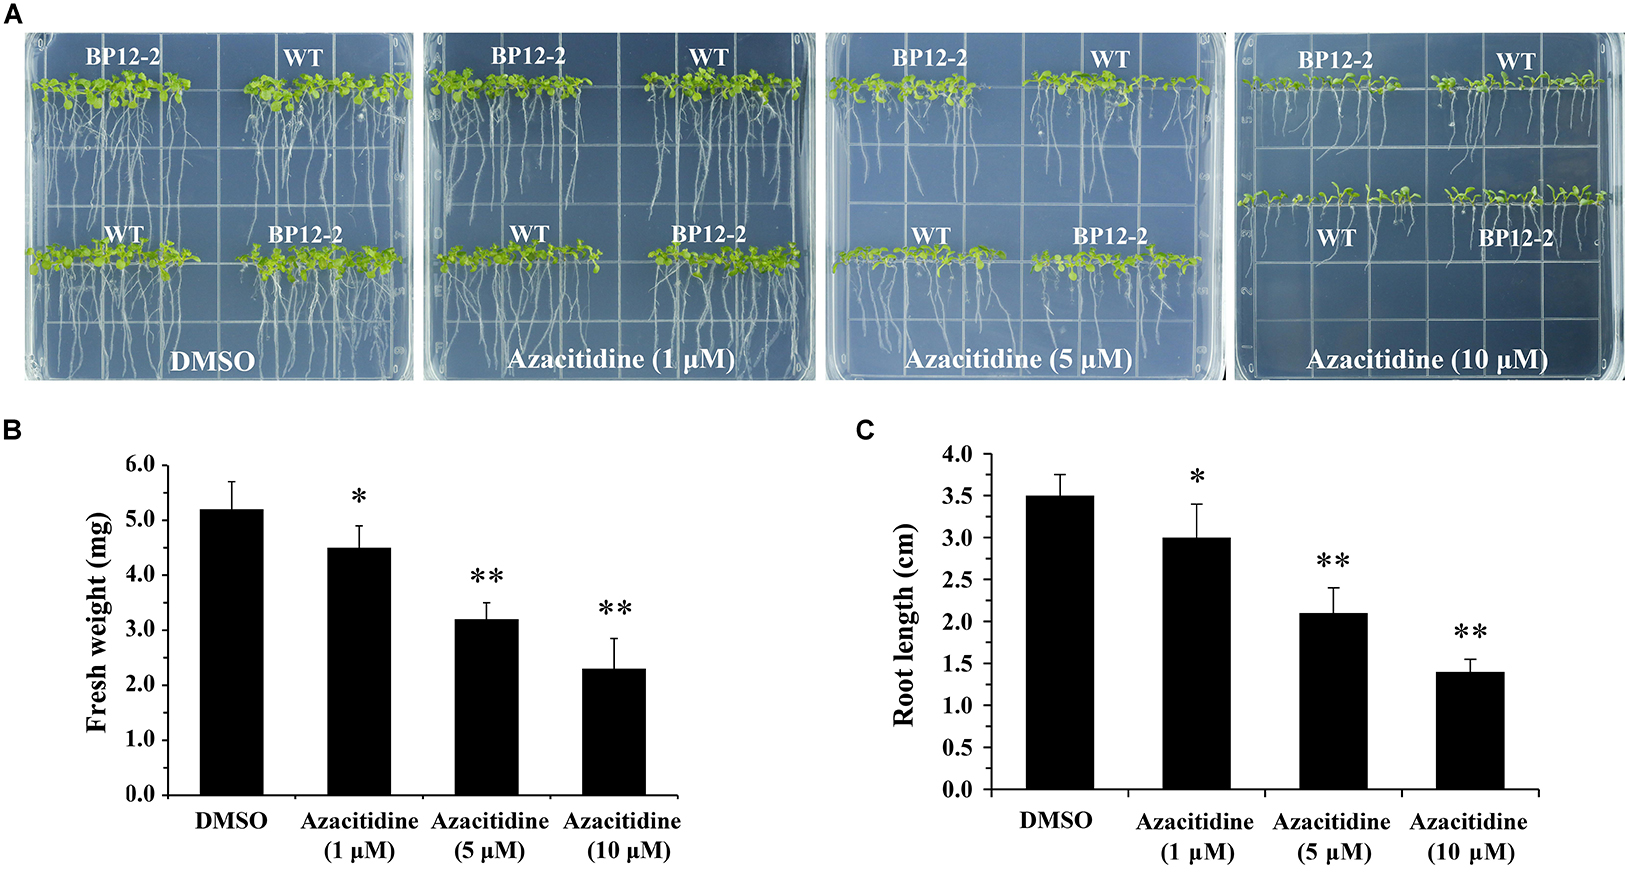
Figure 1. Azacitidine inhibits seedlings growth in dose-dependent manner in Arabidopsis. (A) Phenotypes of WT and BP12-2 seeds cultured on 1/2 MS medium containing increasing concentrations of azacitidine for 10 days. (B,C) Fresh weight and root length of WT seedlings growing on different azacitidine concentrations for 10 days. Each graph represents the average of 30 seedlings. Error bars indicate means ± SD of three biological replicates. Asterisks denote Student’s t-test significant difference compared with DMSO (∗P < 0.05, ∗∗P < 0.01).
To examine the roles of TOR in the regulation of DNA methylation, we used combinations of TOR inhibitors and azacitidine to treat Arabidopsis seeds. Rapamycin (RAP) and AZD-8055 (AZD) that act as different types of TOR kinase inhibitors were selected to treat WT and BP12-2 Arabidopsis seeds. Consistent with the previous reports (Ren et al., 2012), RAP had no obvious inhibitory effect on WT seedlings, whereas significantly inhibited roots and shoots elongation and leaves expansion in BP12-2 seedlings (Figure 2A). The combination of RAP and azacitidine enhanced the inhibition of seedlings growth compared with RAP or azacitidine alone treatment, resulting in leaves yellowing and growth retardation in BP12-2 seedlings (Figures 2A,B). Meanwhile, the combination of AZD and azacitidine also enhanced the inhibition of seedlings growth, implying that TOR inhibitors and azacitidine may synergistically inhibit seedlings growth in Arabidopsis. To further explore whether TOR inhibitors and azacitidine synergistically inhibit seedlings growth, we used a combination index (CI) to calculate the interaction between TOR inhibitors and azacitidine in Arabidopsis. The combination treatment of RAP and azacitidine generated a strong synergistic effect (CI < 0.5) in BP12-2 seedlings. Meanwhile, the combination treatment of AZD and azacitidine also generated the synergistic effects (CI < 1) in WT plants (Figure 2C). These results indicated that TOR inhibitors and azacitidine synergistically inhibit the growth of Arabidopsis seedlings, implying the functions of TOR in DNA methylation.
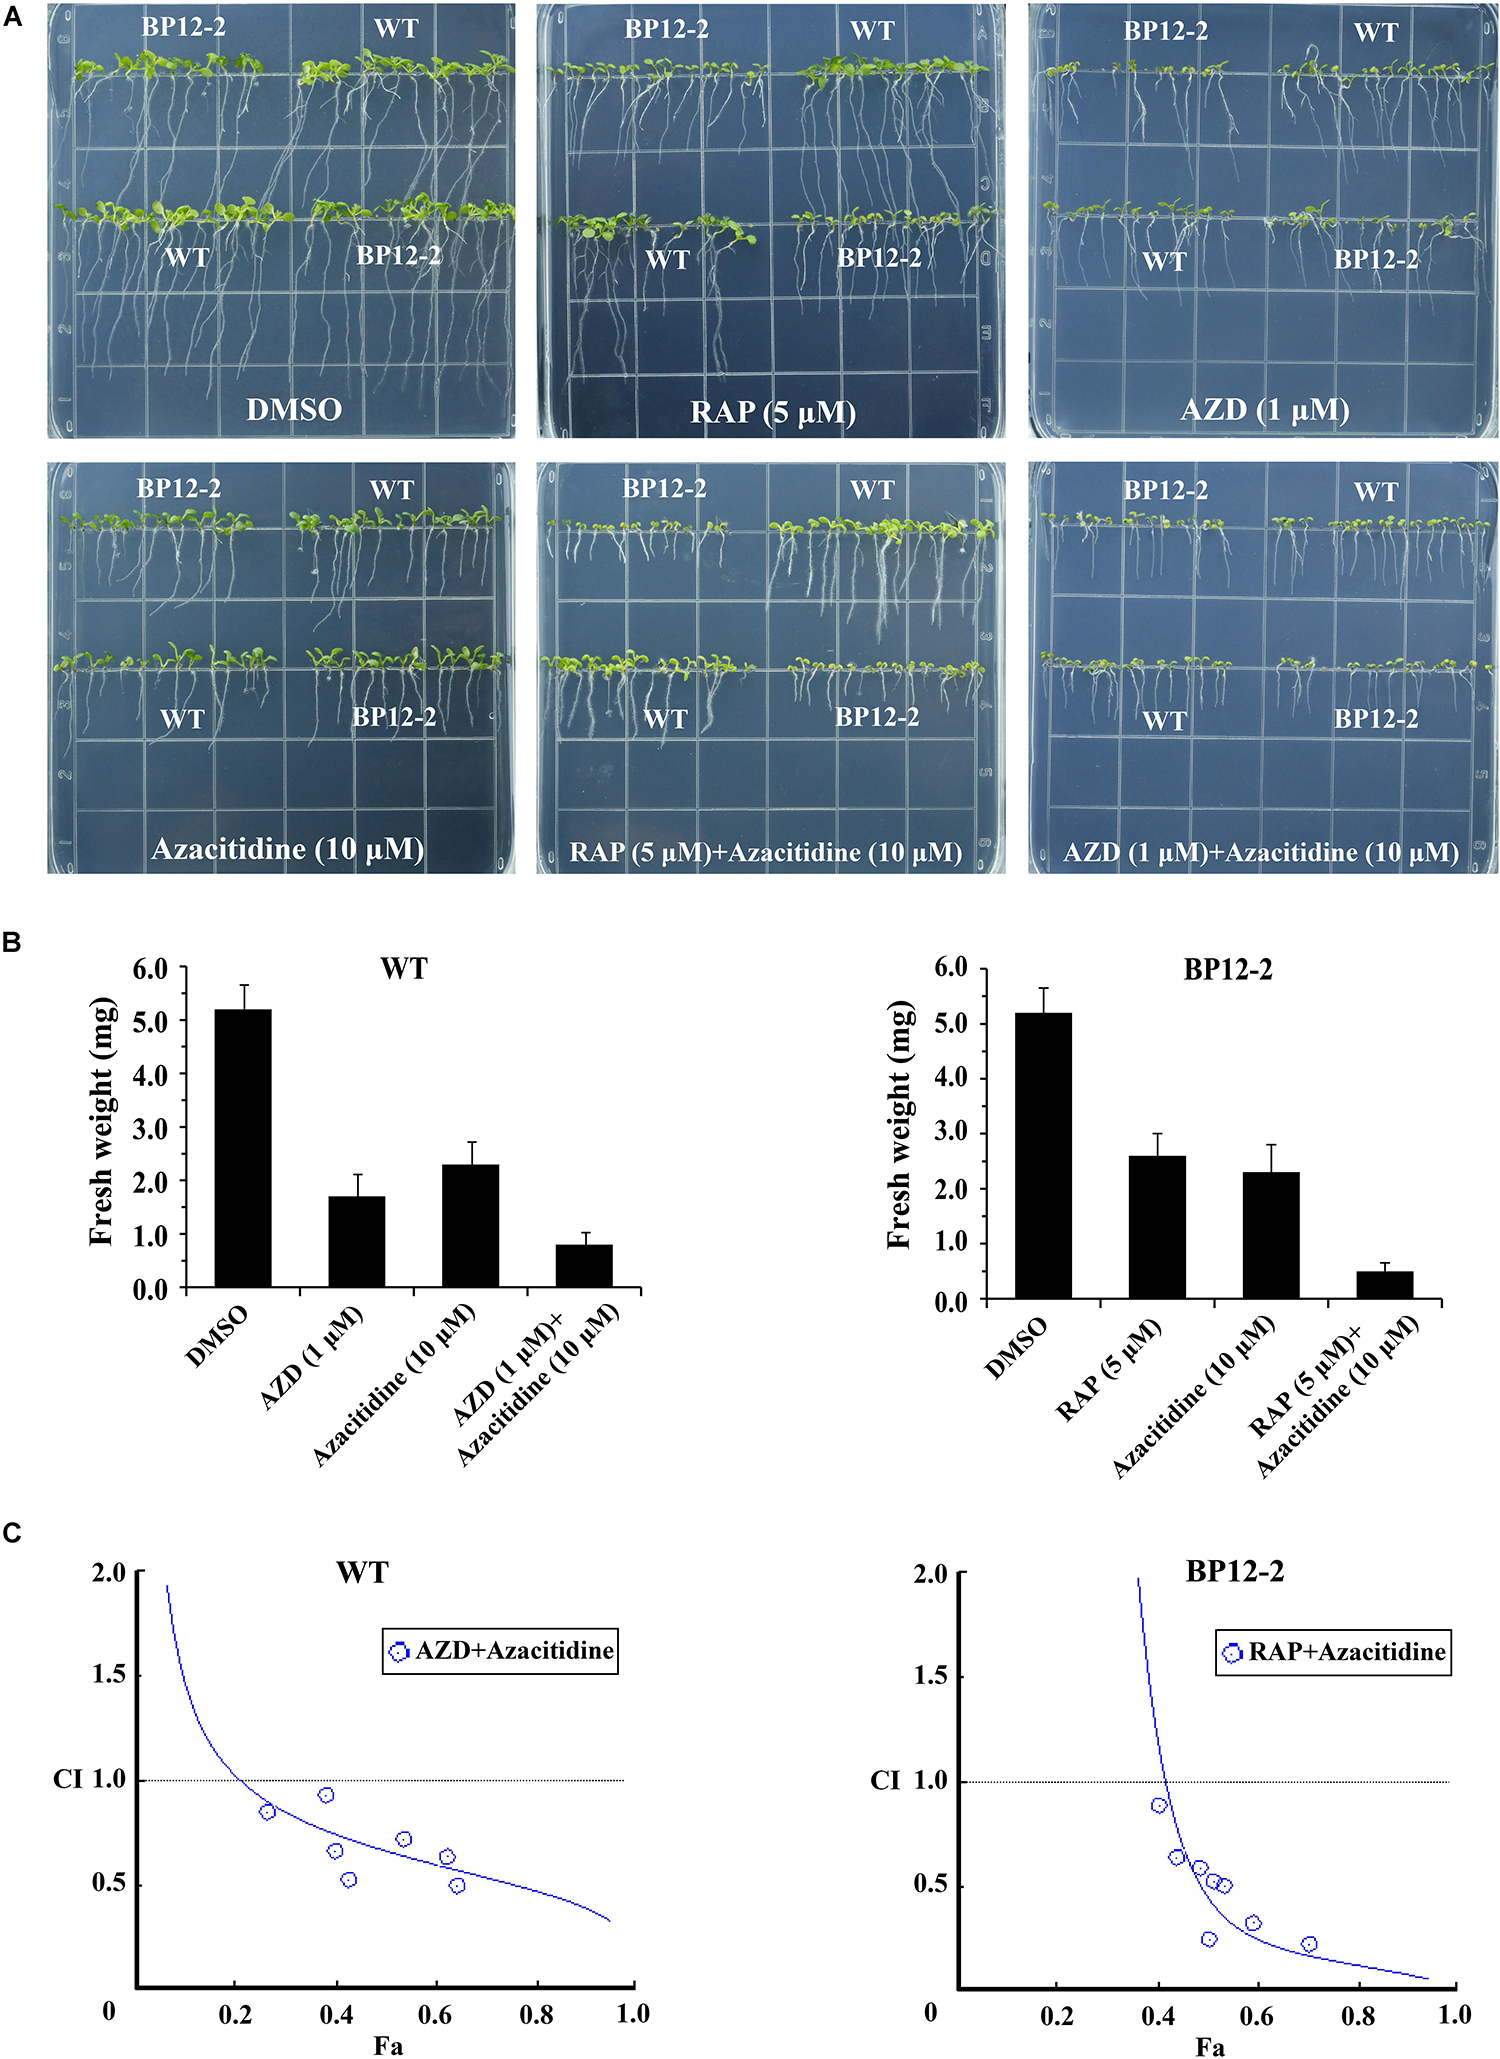
Figure 2. Azacitidine and TOR inhibitors synergistically inhibit seedlings growth in Arabidopsis. (A) Phenotypes of 10-day-old WT and BP12-2 seeds sown on 1/2 MS medium containing DMSO, azacitidine (10 μM), RAP (5 μM), AZD (1 μM), and the combination of RAP (5 μM) + azacitidine (10 μM) and AZD (1 μM) + azacitidine (10 μM). (B) Fresh weight of WT and BP12-2 seedlings sown on different plates for 10 days. Each graph represents the average of 30 seedlings. Error bars indicate means ± SD of three biological replicates. (C) Azacitidine and TOR inhibitors synergistically inhibit plant growth in vitro. WT and BP12-2 seeds were sown on plates containing DMSO, azacitidine, RAP, AZD, and pairwise combination for 10 days, and then fresh weight was measured for CI value assessment. The Fa-CI curve shows synergistic effects (CI < 1) between AZD + azacitidine and RAP + azacitidine in WT and BP12-2 seedlings, respectively.
Inhibition of TOR Reduces Whole-Genome Methylation Level in Arabidopsis
To further analyze the functions of TOR in the regulation of DNA methylation, we performed base-resolution whole-genome bisulfite sequencing (WGBS) under TOR inhibition by AZD, RAP, and AZD + RAP treatment in Arabidopsis. Each sample contained more than 51 million clean reads after removing the low-quality reads, duplicate reads and adapters. The bisulfite conversion efficiency exceeded 99.5% in all samples, providing a reliable guarantee of the accuracy of WGBS (Table 1). We used Bowtie2 (Bismark) software to map the clean reads to the reference genome, and more than 58% of the reads were uniquely mapped to the Arabidopsis genome in each sample (Table 1). Further statistical analysis found that DNA methylation occurred mainly at three different sequence sites: CG, CHG, and CHH sites (H = A, T, or C) in all samples, we calculated methylation ratio of the three sequence contexts in the genome. The methylation ratio of the CG sequence was the highest, followed by the CHG sequence and the CHH sequence in all samples (Table 2). Among them, the methylation ratio of CG context was decreased, while the methylation ratio of CHH context was increased under TOR inhibition. Importantly, the total mCX methylation ratio was reduced in TOR-inhibited samples compared to DMSO control group (Table 2). Furthermore, genome-wide methylation level was decreased in TOR-inhibited samples, of which the methylation level was most obviously decreased in AZD + RAP treated sample (Figure 3A). Additionally, we analyzed the proportion of methylated C site on each chromosome and found that the methylation ratio of CG site on each chromosome was higher than the CHG and CHH sites. Consistent with the above findings, inhibition of TOR also reduced the proportion of methylated CX sites on each chromosome (Figure 3B).
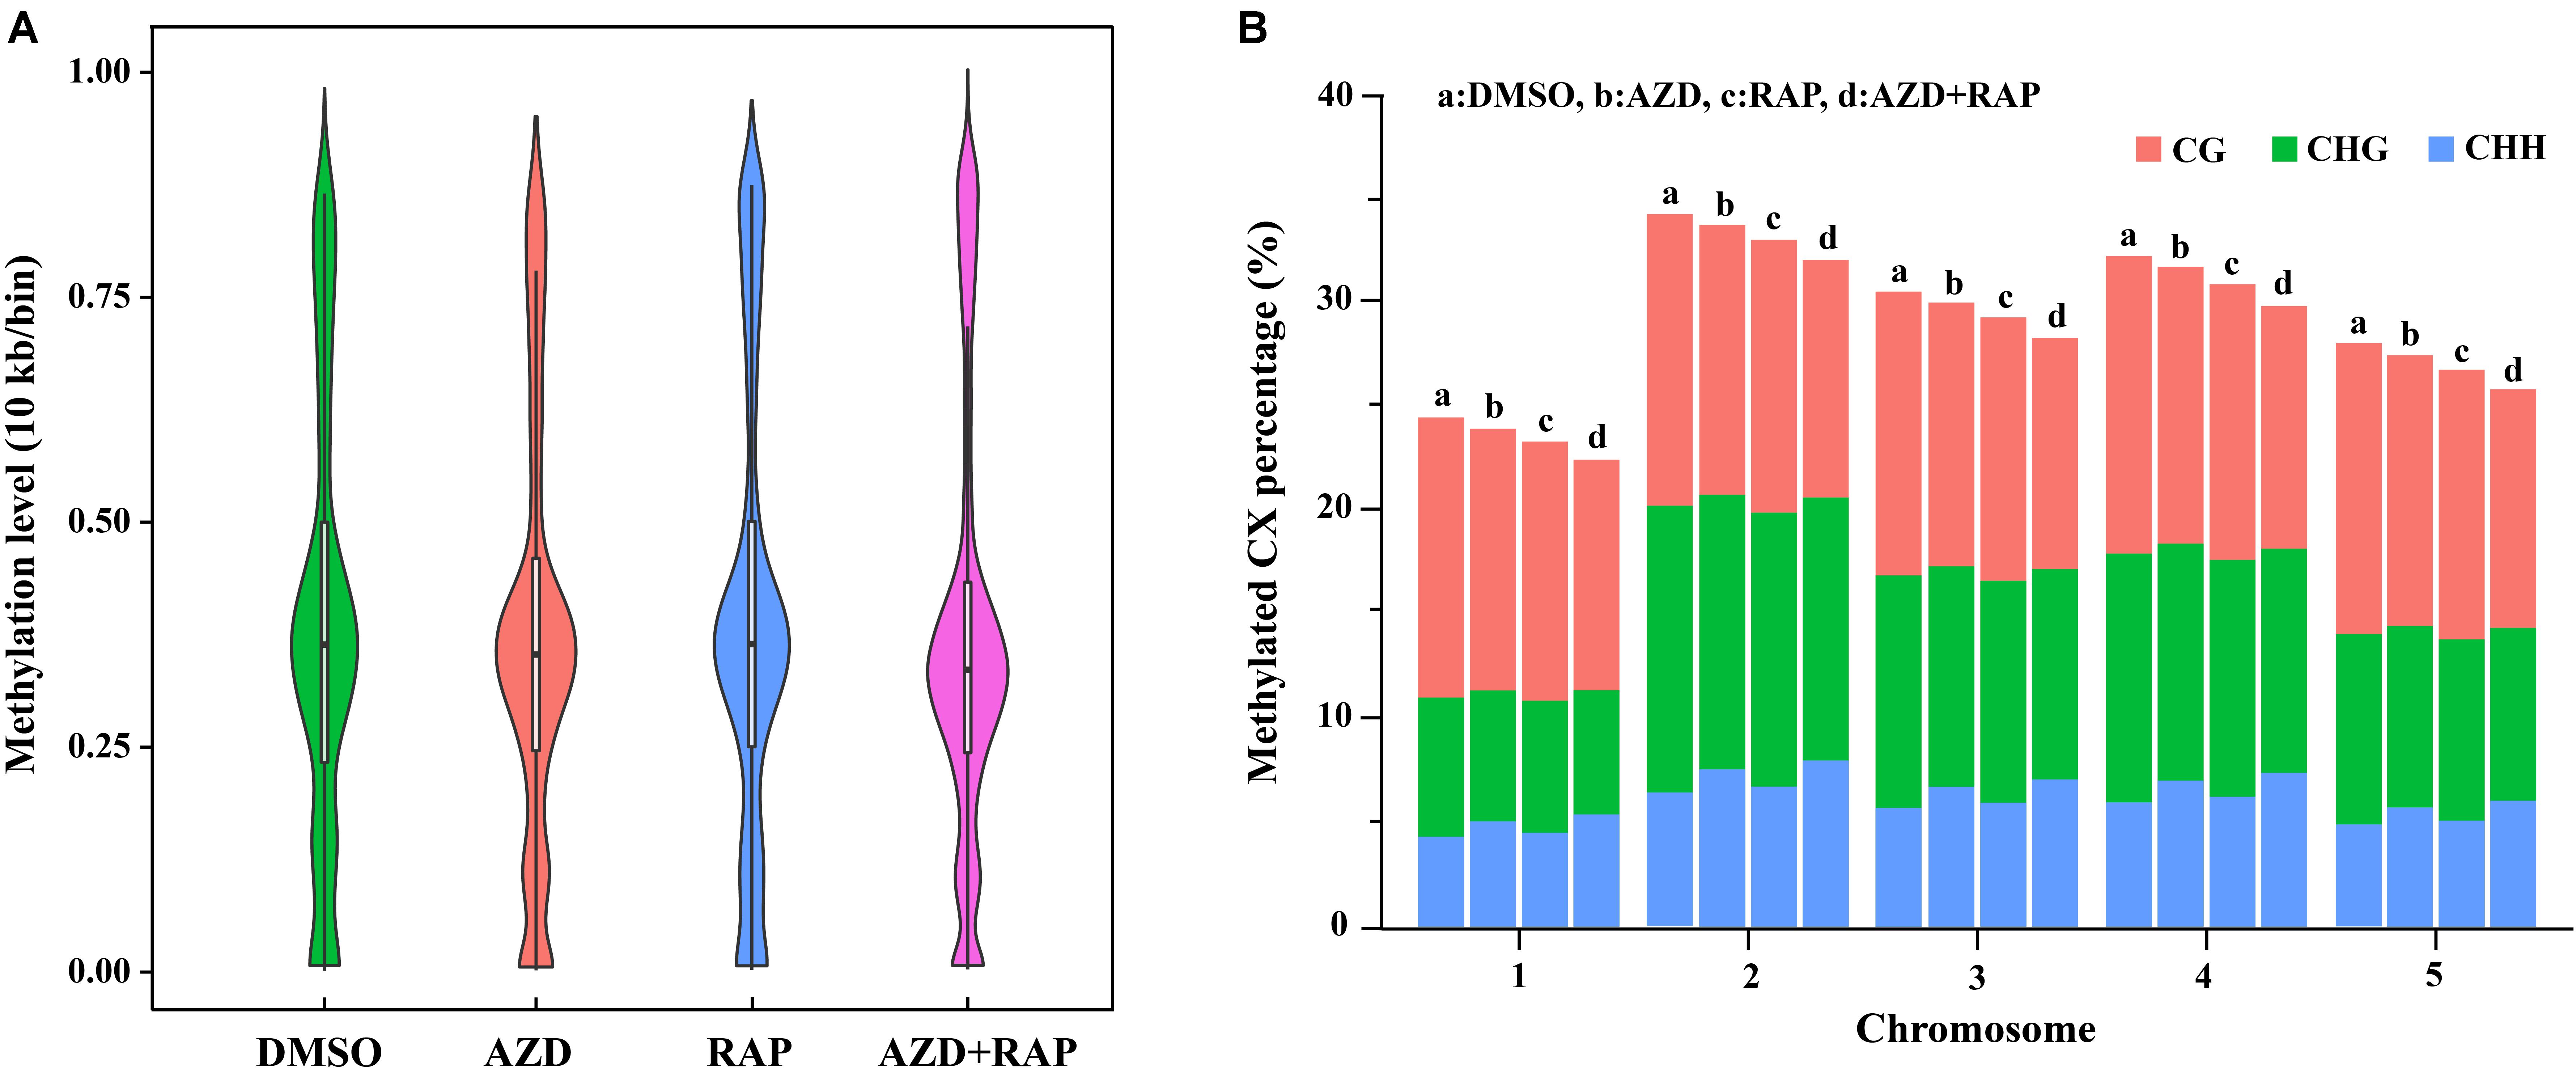
Figure 3. Genome-wide methylation level and distribution of mCG, mCHG and mCHH on chromosomes. (A) Methylation level distribution of whole genome in different samples. Take 10 Kb as a bin. The width of each violin represents the number of points at the methylation level. (B) The distribution of mCG, mCHG, and mCHH in all methylated cytosine on chromosomes. The X-axis shows chromosomes, the Y-axis represents the proportion of the methylation level on the corresponding chromosomes, different colors represent different context. a: DMSO, b: AZD, c: RAP, d: AZD + RAP.
To explore the role of DNA methylation in regulating gene expression, we analyzed the changes of DNA methylation levels on genomic functional elements including promoters, exons, introns and UTR regions. Similar methylation levels were observed in the three methylated CX contexts in each functional element of all samples. Among them, the promoter had the highest DNA methylation ratio, followed by the exon region, and the 5′UTR had the lowest DNA methylation ratio in all samples (Figure 4). Interestingly, we found that inhibition of TOR increased the average methylation level of mCHH in the promoter region whereas mCG and mCHG had no obvious change, implying that TOR plays an important role in regulation of methylation of CHH site in promoter region. To investigate whether the reduction in genome-wide methylation was caused by methyltransferases, we examined the transcription levels of methyltransferase and demethylase genes under TOR inhibition. The transcription level of METHYLTRANSFERASE 1 (MET1) that maintains CG methylation in plants was down-regulated in TOR-inhibited seedlings (Supplementary Figure S2A). However, DOMAINS REARRANGED METHYLASE 1 (DRM1) and DRM2 genes, which maintain asymmetric CHH site methylation in plants (Chan et al., 2005), were up-regulated under TOR inhibition, which could account for high methylation level of CHH site in the promoter region under TOR inhibition. Besides, the transcription levels of demethylase genes including ROS1, MBD7, and IBM1 were significantly up-regulated in TOR-inhibited seedlings (Supplementary Figure S2B). These results indicated that TOR regulated DNA methylation by altering the transcription levels of methyltransferase and demethylase genes in Arabidopsis.
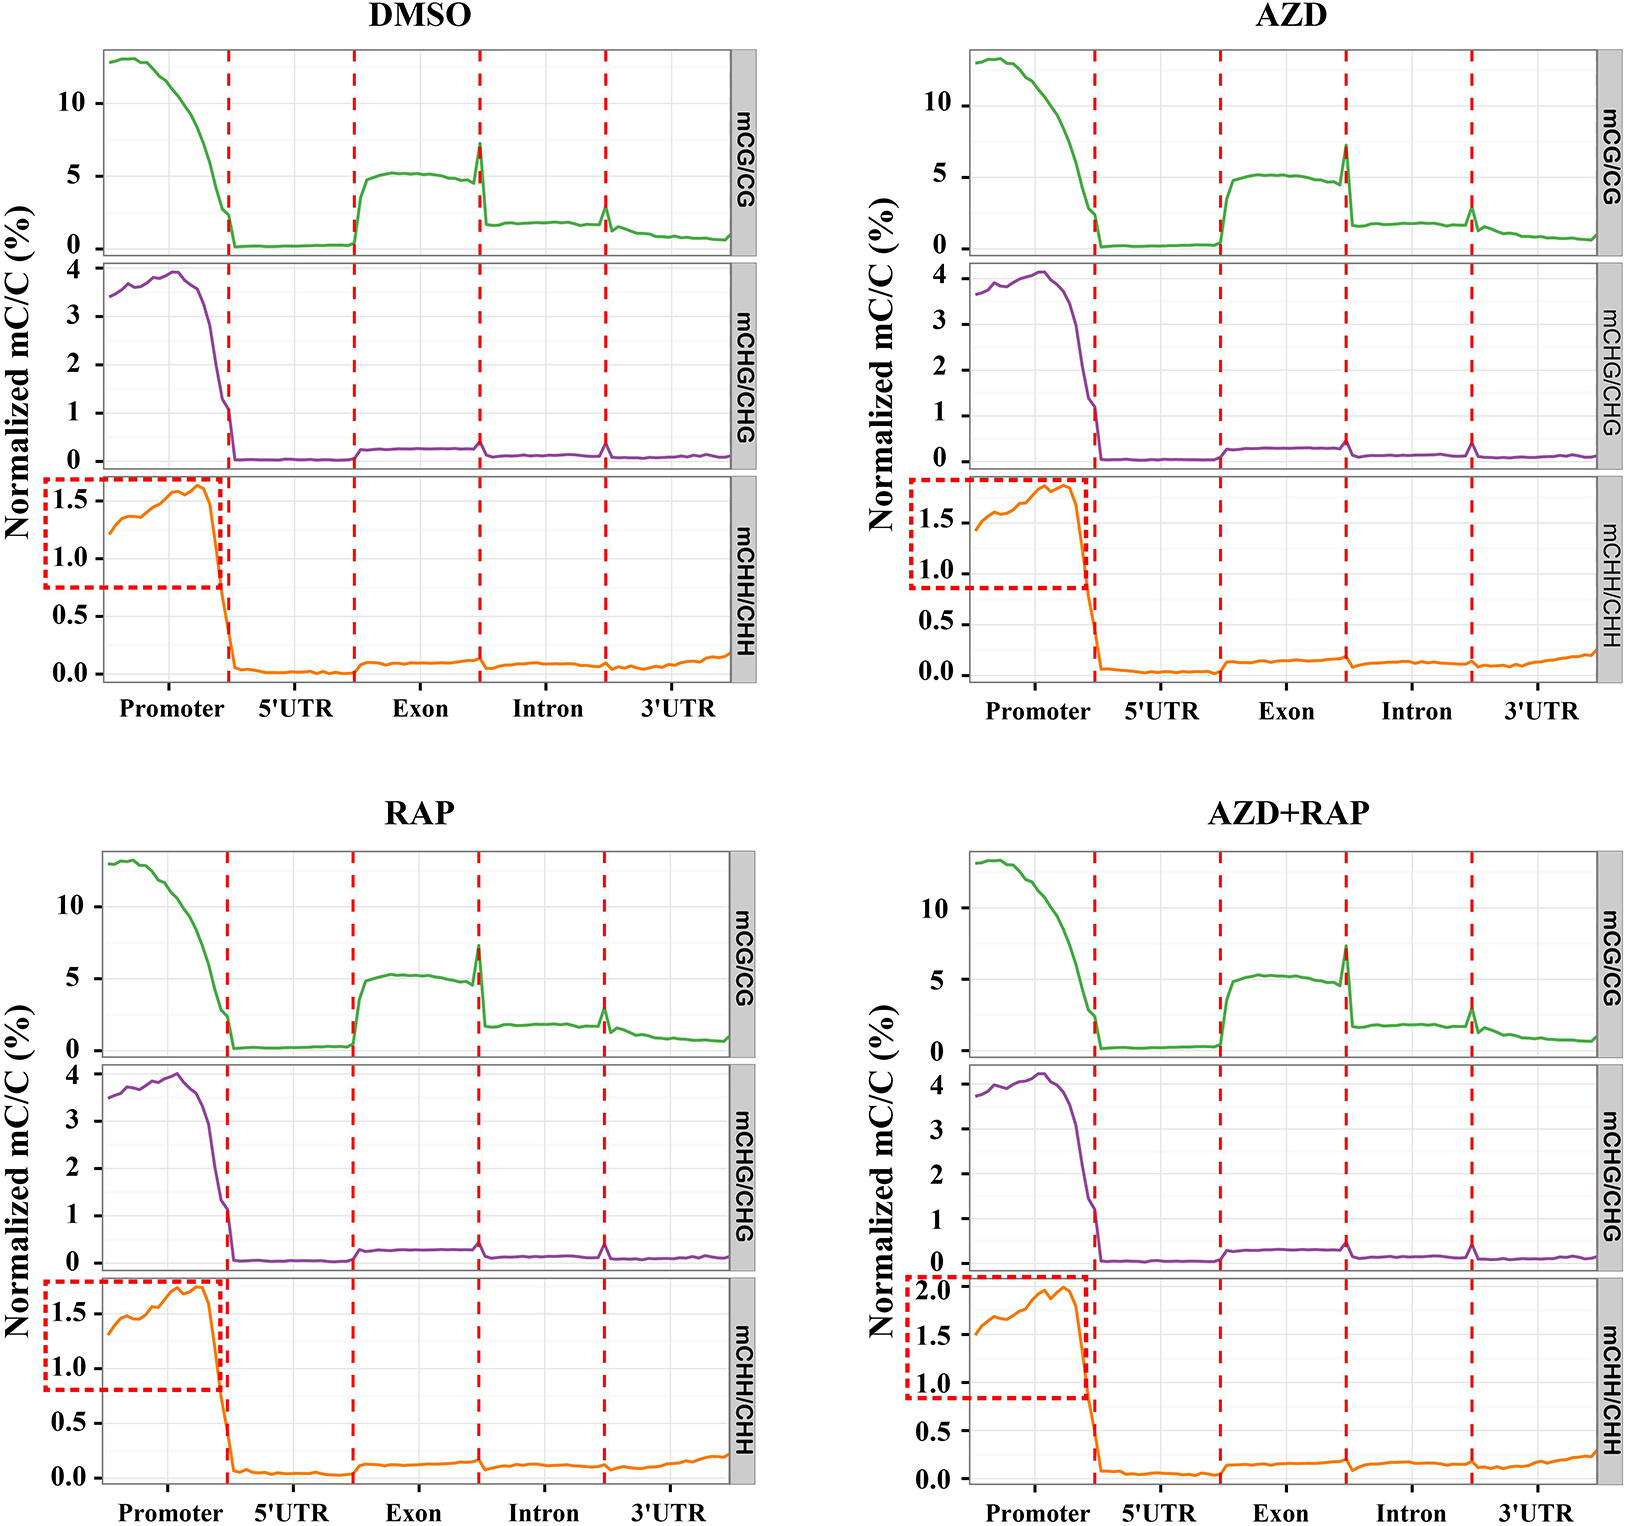
Figure 4. Distribution of methylation levels of all samples on different genomic elements. Abscissa represented different genomic elements, ordinate represented the average level of methylation, and different colors represented different sequence contexts (CG, CHG, and CHH). The promoter region is a 2 kb region upstream of the TSS site.
Analysis of Differentially Methylated Region (DMR) Under TOR Inhibition
Whole genome differential methylation analysis was performed in AZD vs. DMSO, RAP vs. DMSO, and AZD + RAP vs. DMSO groups. Total 1417, 4664, and 5282 DMRs were identified in AZD vs. DMSO, RAP vs. DMSO, and AZD + RAP vs. DMSO groups, respectively. All DMRs were classified into five types according to genome elements, most of which were distributed in promoter and exon regions. Moreover, hypermethylated DMRs were more than hypomethylated DMRs under TOR inhibition, of which hypermethylated DMRs were also mainly distributed in promoter and exon regions (Figure 5A). We further mapped the obtained DMRs of promoter, 5′UTR, exon, intron, and 3′UTR to genes. A total of 1296, 4015, and 4520 differentially methylated genes (DMGs) were found in AZD vs. DMSO, RAP vs. DMSO, and AZD + RAP vs. DMSO groups, respectively. The Venn diagram displayed that 314 DMGs were overlapping among three groups, while approximately 50% of the DMGs were not overlapping between these groups (Figure 5B). Furthermore, hierarchical cluster analysis of DMGs was performed using Cluster software, and methylated genes were clustered using a distance metric based on the Pearson correlation. The results showed that some DMGs had a hypomethylated status under TOR inhibition (Figure 5C). Especially, some significant hypomethylated genes were found in RAP-treated seedlings (Supplementary Table S2).
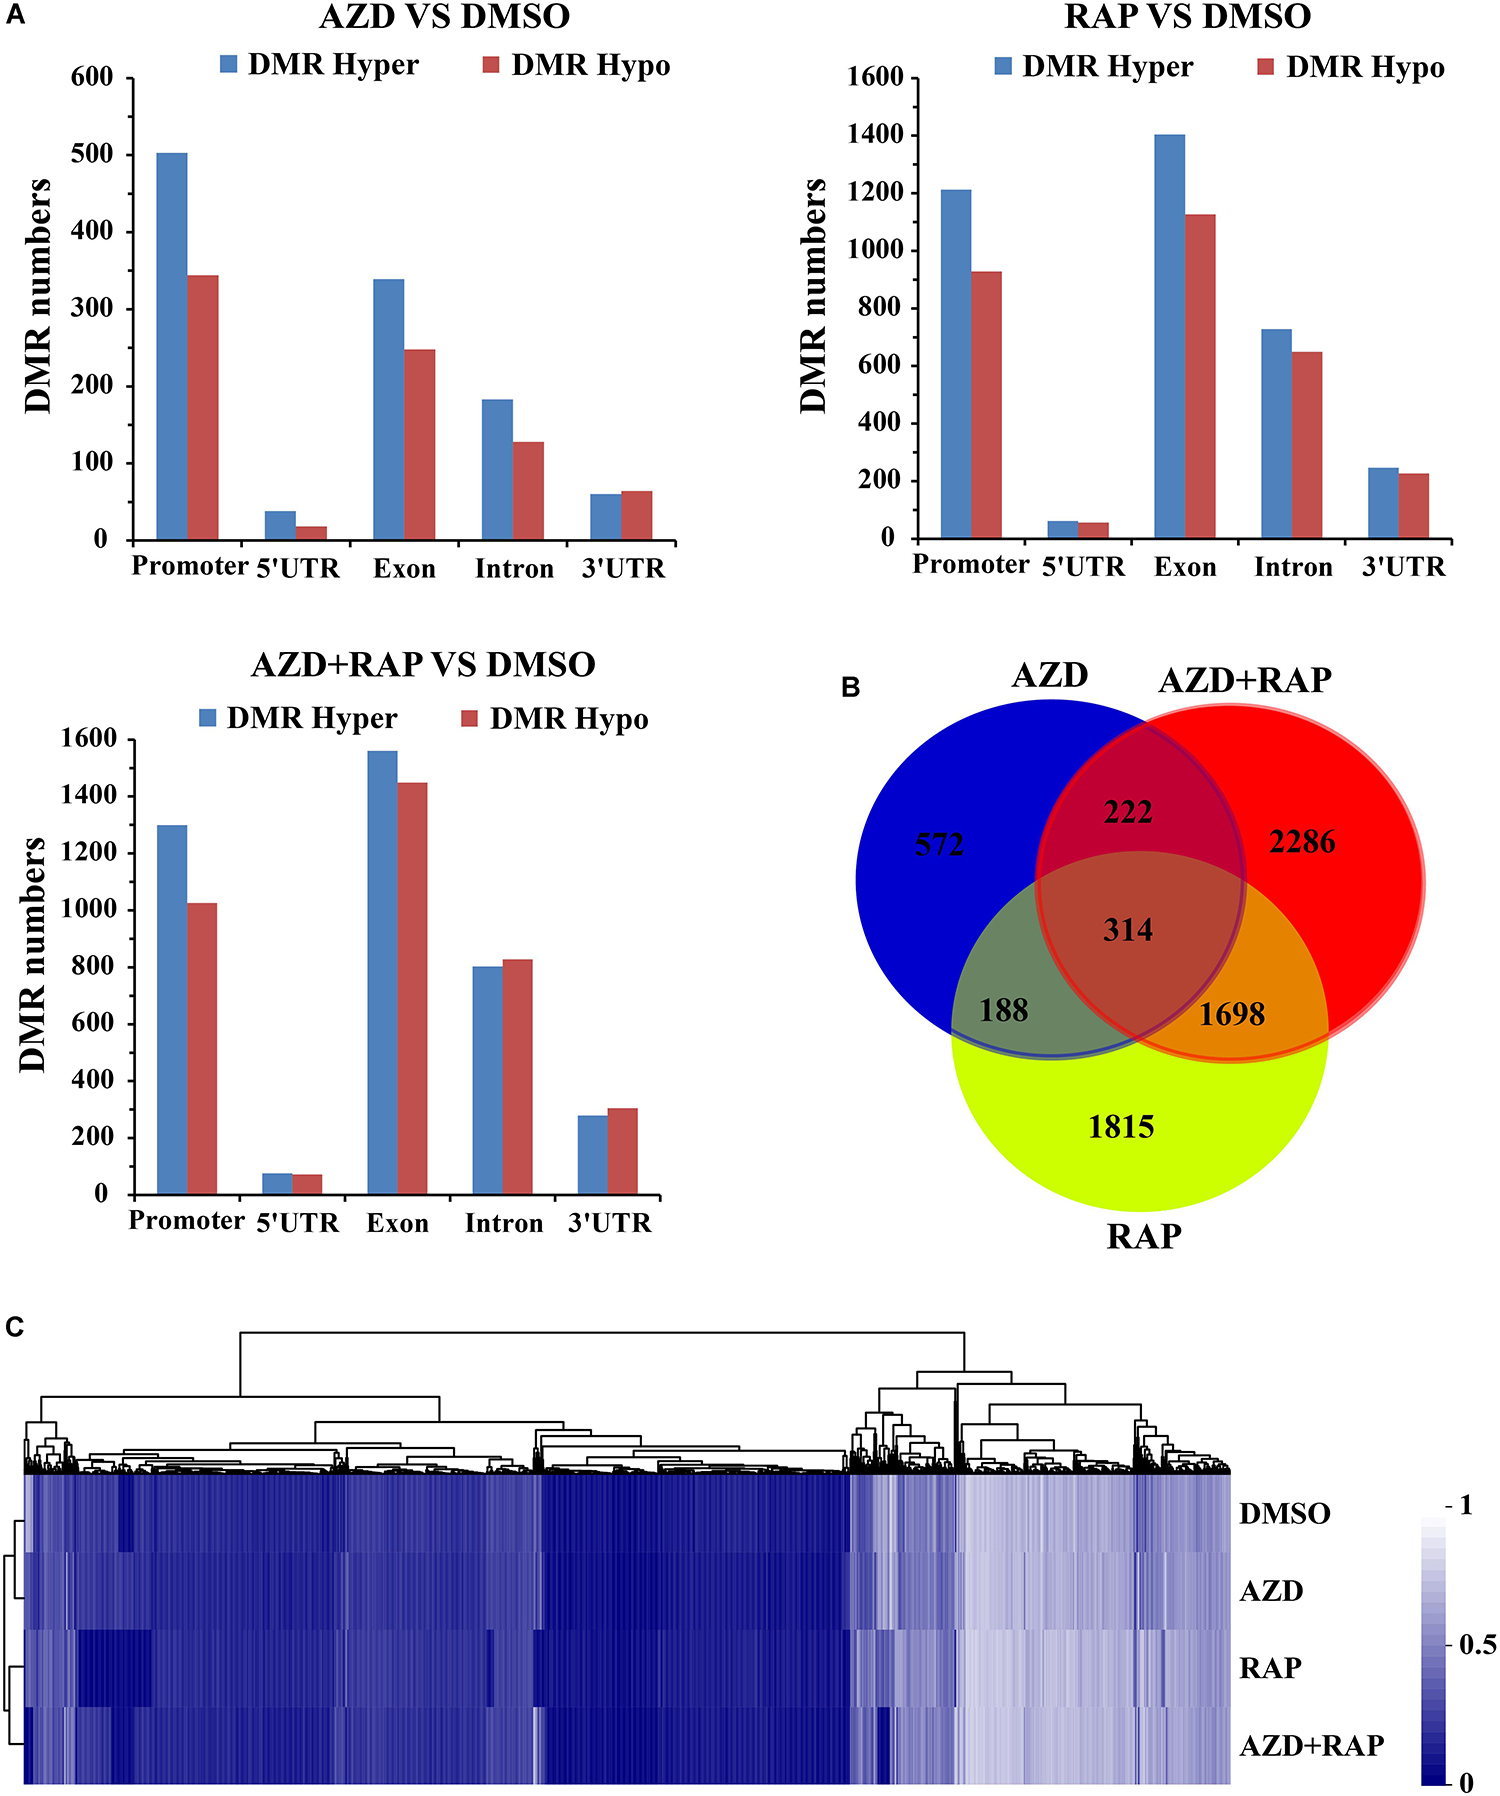
Figure 5. Differentially methylated regions (DMRs) analysis of DMSO, AZD, RAP, and AZD + RAP samples. (A) The numbers of DMRs in genome elements. Histograms showing the overall DMRs numbers of genome elements: promoter, 5′UTR, exon, intron, and 3′UTR regions. Hyper: high methylation level, hypo: low methylation level. (B) The Venn diagram of differentially methylated genes (DMGs) among different combinations of AZD vs. DMSO, RAP vs. DMSO, and AZD + RAP vs. DMSO groups. (C) Cluster analysis of DMGs for DMSO, AZD, RAP, and AZD + RAP treated samples. The blue color represented lower methylation level and the white color represented higher methylation level. Each row represented a sample, each column represented a gene.
Gene Ontology (GO) and KEGG Pathway Enrichment Analysis of DMGs
We further functionally categorized the DMGs and analyzed their significant differences by using the GOseq R package (Young et al., 2010). These DMGs were assigned to one or more of three categories: biological process, cellular component, and molecular function base on the GO assignments, and they were significantly enriched in 25, 132, and 198 terms of three GO categories in AZD vs. DMSO, RAP vs. DMSO, and AZD + RAP vs. DMSO groups, respectively (corrected P < 0.05) (Supplementary Table S3). The top three significantly enriched GO terms were “cell periphery,” “plasma membrane,” and “catalytic activity” in AZD vs. DMSO group, “catalytic activity,” “nucleotide binding,” and “nucleoside phosphate binding” in RAP vs. DMSO group, and “nucleotide binding,” “nucleoside phosphate binding,” and “ribonucleoside binding” in AZD + RAP vs. DMSO group (Figure 6A and Supplementary Figure S3A), suggesting that these GO terms may play important roles in TOR-regulated genomic methylation. Furthermore, the largest number of functional GO term was “cell” under TOR inhibition, which distributed in the cellular component category, implying that TOR may participate in the regulation of cellular component GO terms.
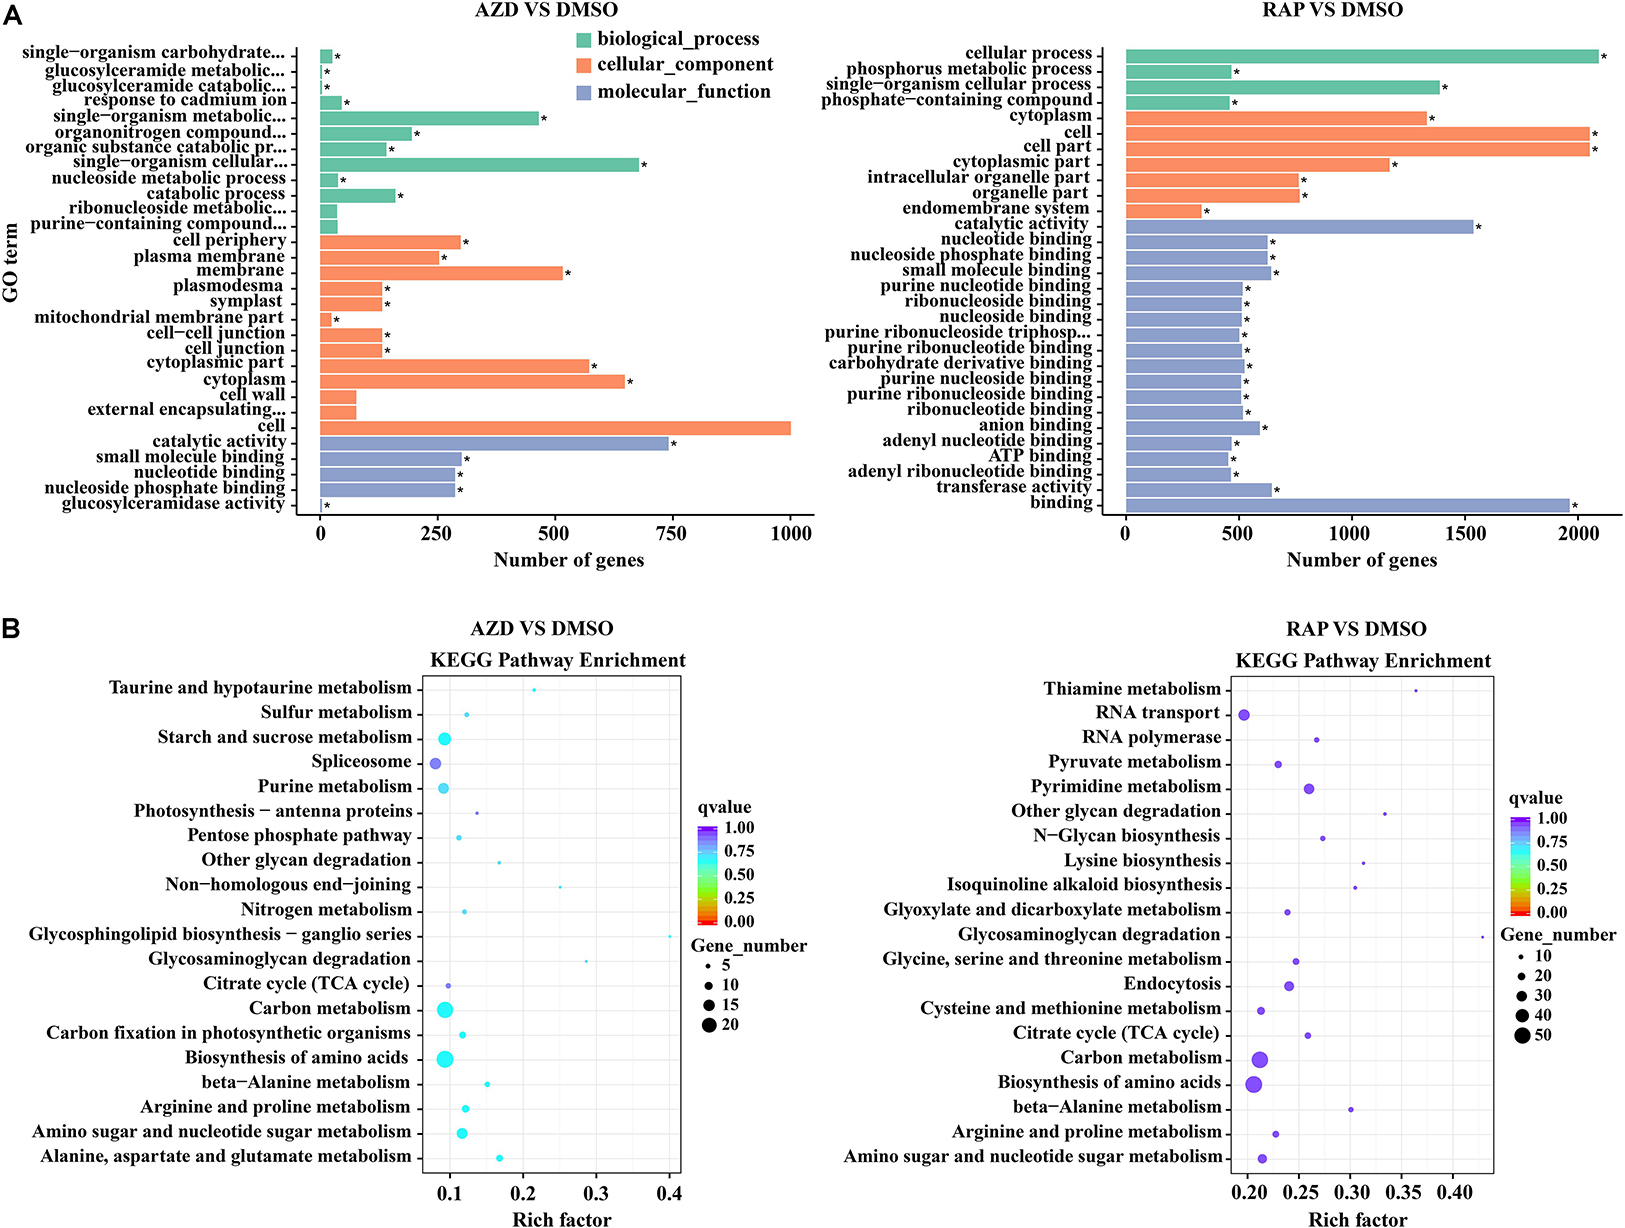
Figure 6. Gene ontology (GO) and KEGG pathway enrichment analysis of DMGs under TOR inhibition. (A) The top 30 most enriched GO terms analysis of DMGs. different colors represent biological processes, cellular components, and molecular functions. “∗” indicates significantly enriched GO terms, of which the P-value < 0.05. (B) The top 20 functionally enriched KEGG analysis of DMGs.
To provide further insight into the pathways, we performed KEGG pathway analysis of the DMGs under TOR inhibition. The major metabolic pathways and signal transduction pathways of DMGs were identified by KEGG significant enrichment. The top two enriched KEGG pathways were “Carbon metabolism” and “Biosynthesis of amino acids” under TOR inhibition (Figure 6B and Supplementary Figure S3B). In addition, DMGs in “RNA transport,” “Ribosome biogenesis in eukaryotes,” and “beta-Alanine metabolism” pathways were also found under TOR inhibition.
DMGs Involved in the Regulation of Cell Growth
Carbon metabolism and synthesis of proteins are important limiting factors for cell growth and proliferation (Webb and Satake, 2015; Saxton and Sabatini, 2017). Among these altered metabolic processes in KEGG pathways, the number of “Carbon metabolism” and “Biosynthesis of amino acids” pathways was the largest (Figure 6B), indicating that TOR controlled cell growth and proliferation by regulating the methylation level of the genes. We further analyzed the methylation levels of “Carbon metabolism” and “Biosynthesis of amino acids” pathways in RAP vs. DMSO group. A total of 21 and 17 DMGs had significant changed methylation levels in “Carbon metabolism” and “Biosynthesis of amino acids” pathways, respectively (methylation ratio > 1.5-fold) (Table 3). The genes encoding rate-limiting enzymes of carbon metabolism and biosynthesis of amino acids such as 6-phosphofructokinase (PFK6) and isocitrate dehydrogenase (IDH5) were hypermethylated, suggesting that TOR inhibition by RAP reduced the carbon metabolism levels in Arabidopsis. In addition, the methylation levels of genes in “Carbon metabolism” and “Biosynthesis of amino acids” pathways were also changed in AZD-treated samples (Supplementary Table S4). These results indicated that TOR regulated multiple metabolic processes by altering the methylation levels of related genes.
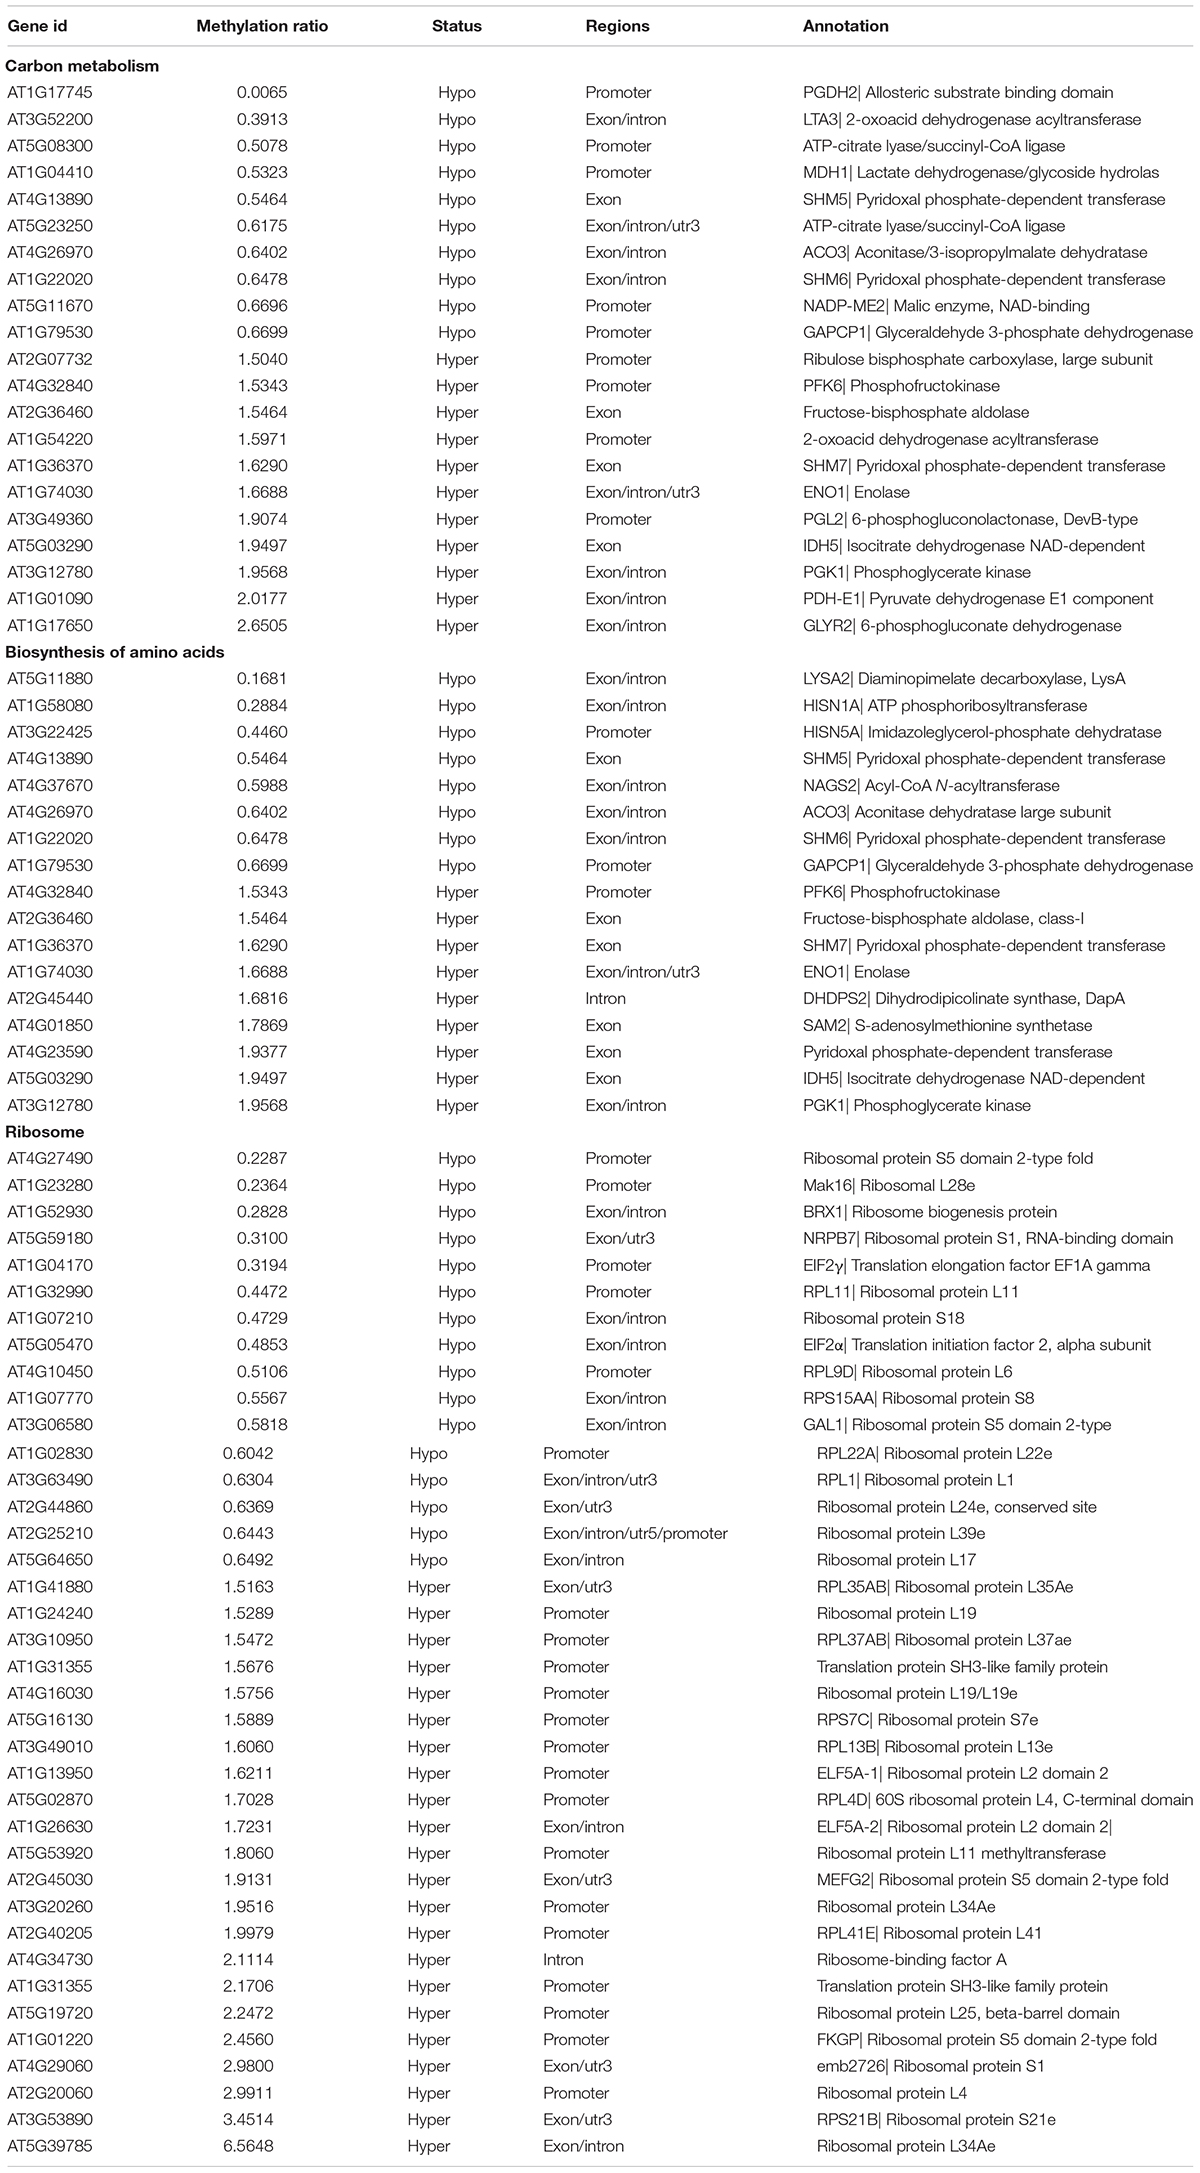
Table 3. Differentially methylated genes (DMGs) of carbon metabolism, biosynthesis of amino acids and ribosome in RAP vs. DMSO group.
The ribosome, composed of ribosomal RNAs and ribosomal proteins, is responsible for the synthesis of proteins in prokaryotes and eukaryotes (Adam et al., 2011; Opron and Burton, 2018). TORC1 positively regulates multiple steps including ribosomal RNAs transcription, the synthesis of ribosomal proteins and other components in ribosome biogenesis (Iadevaia et al., 2014; Kos-Braun and Kos, 2017). We found that 38 DMGs associated with ribosome genes in RAP vs. DMSO group (Table 3). Besides, a large number of DMGs associated with ribosome were also found in AZD and AZD + RAP treated samples (Supplementary Tables S4, S5). Interestingly, “Ribosome biogenesis in eukaryotes” was the most enriched pathway in AZD + RAP vs. DMSO group, of which 31 DMGs were found in this pathway (Supplementary Figure S3B and Table S5). Additionally, we found that the methylation level of TOR was reduced whereas the transcription level of TOR was up-regulated under TOR inhibition (Supplementary Figure S1B), suggesting a feedback regulation of TOR inhibition in Arabidopsis. Collectively, these results and observations suggested that TOR plays a crucial role in plant growth and development through regulating multiple metabolic processes and protein synthesis.
DMGs Involved in the Regulation of Plant Hormone Signal Transduction
Plant hormones play indispensable roles in mediating cellular metabolism, regulating plant growth and development, and resisting biotic and abiotic stresses (Rubio et al., 2009). Based on the WGBS data, DMGs associated with auxin, cytokinin (CK), brassinosteroid (BR), abscisic acid (ABA), ethylene (ET), and jasmonic acid (JA) were detected under TOR inhibition (Supplementary Table S6). Among these phytohormone signaling pathways, the top three largest number of DMGs were CK, BR, and ABA signaling pathways. Recent studies showed that TOR interacted with ABA signaling to balance plant growth and stress responses in plants (Wang et al., 2018). Based on our data, several ABA signaling pathway-related genes were significantly differentially methylated. In detail, the protein kinase SnRK2 of the ABA signaling pathway was hypermethylated, whereas protein phosphatase PP2CA was hypomethylated. Besides, some important plant hormone-related genes were differentially methylated. For example, auxin responsive SAUR proteins were hypermethylated in the promoter region, and BR signaling protein kinases BSK1 and BSK2 were hypomethylated under TOR inhibition (Supplementary Table S6). The transcription levels of ABI5, BSK2, and PP2CA genes were up-regulated whereas methylation levels of these genes were decreased in the promoter regions under TOR inhibition (Supplementary Figure S2C and Supplementary Table S6). These results showed that TOR may act as a regulator to mediate plant hormone signals transduction in Arabidopsis.
Association of DMGs With Gene mRNA Expression Level
To dissect the relationship between DMGs and gene mRNA expression level, we examined the expression levels of related genes using qRT-PCR. Eight DMGs were randomly selected for the real-time PCR, of which three DMGs involved in stresses response and five DMGs involved in metabolism and cell growth. Consistent with the previous study (Zhang et al., 2006), gene mRNA expression level was decreased in the hypermethylated promoter region in this study (Figure 7). For example, AT4G16520 (ATG8F) and AT4G16760 (ACX1) induced by stresses were hypomethylated in the promoter region, while mRNA expression level was upregulated under TOR inhibition. AT5G05490 (SYN1) and AT5G49630 (AAP6) that involved in cell growth were hypermethylated whereas mRNA expression level was downregulated. Besides, some genes hypermethylated in transcribed regions were highly expressed whereas other genes were low expressed (Figure 7 and Supplementary Table S7), demonstrating methylation in transcribed regions both positive and negative relationships to gene expression (Zhang et al., 2006; Lou et al., 2014).
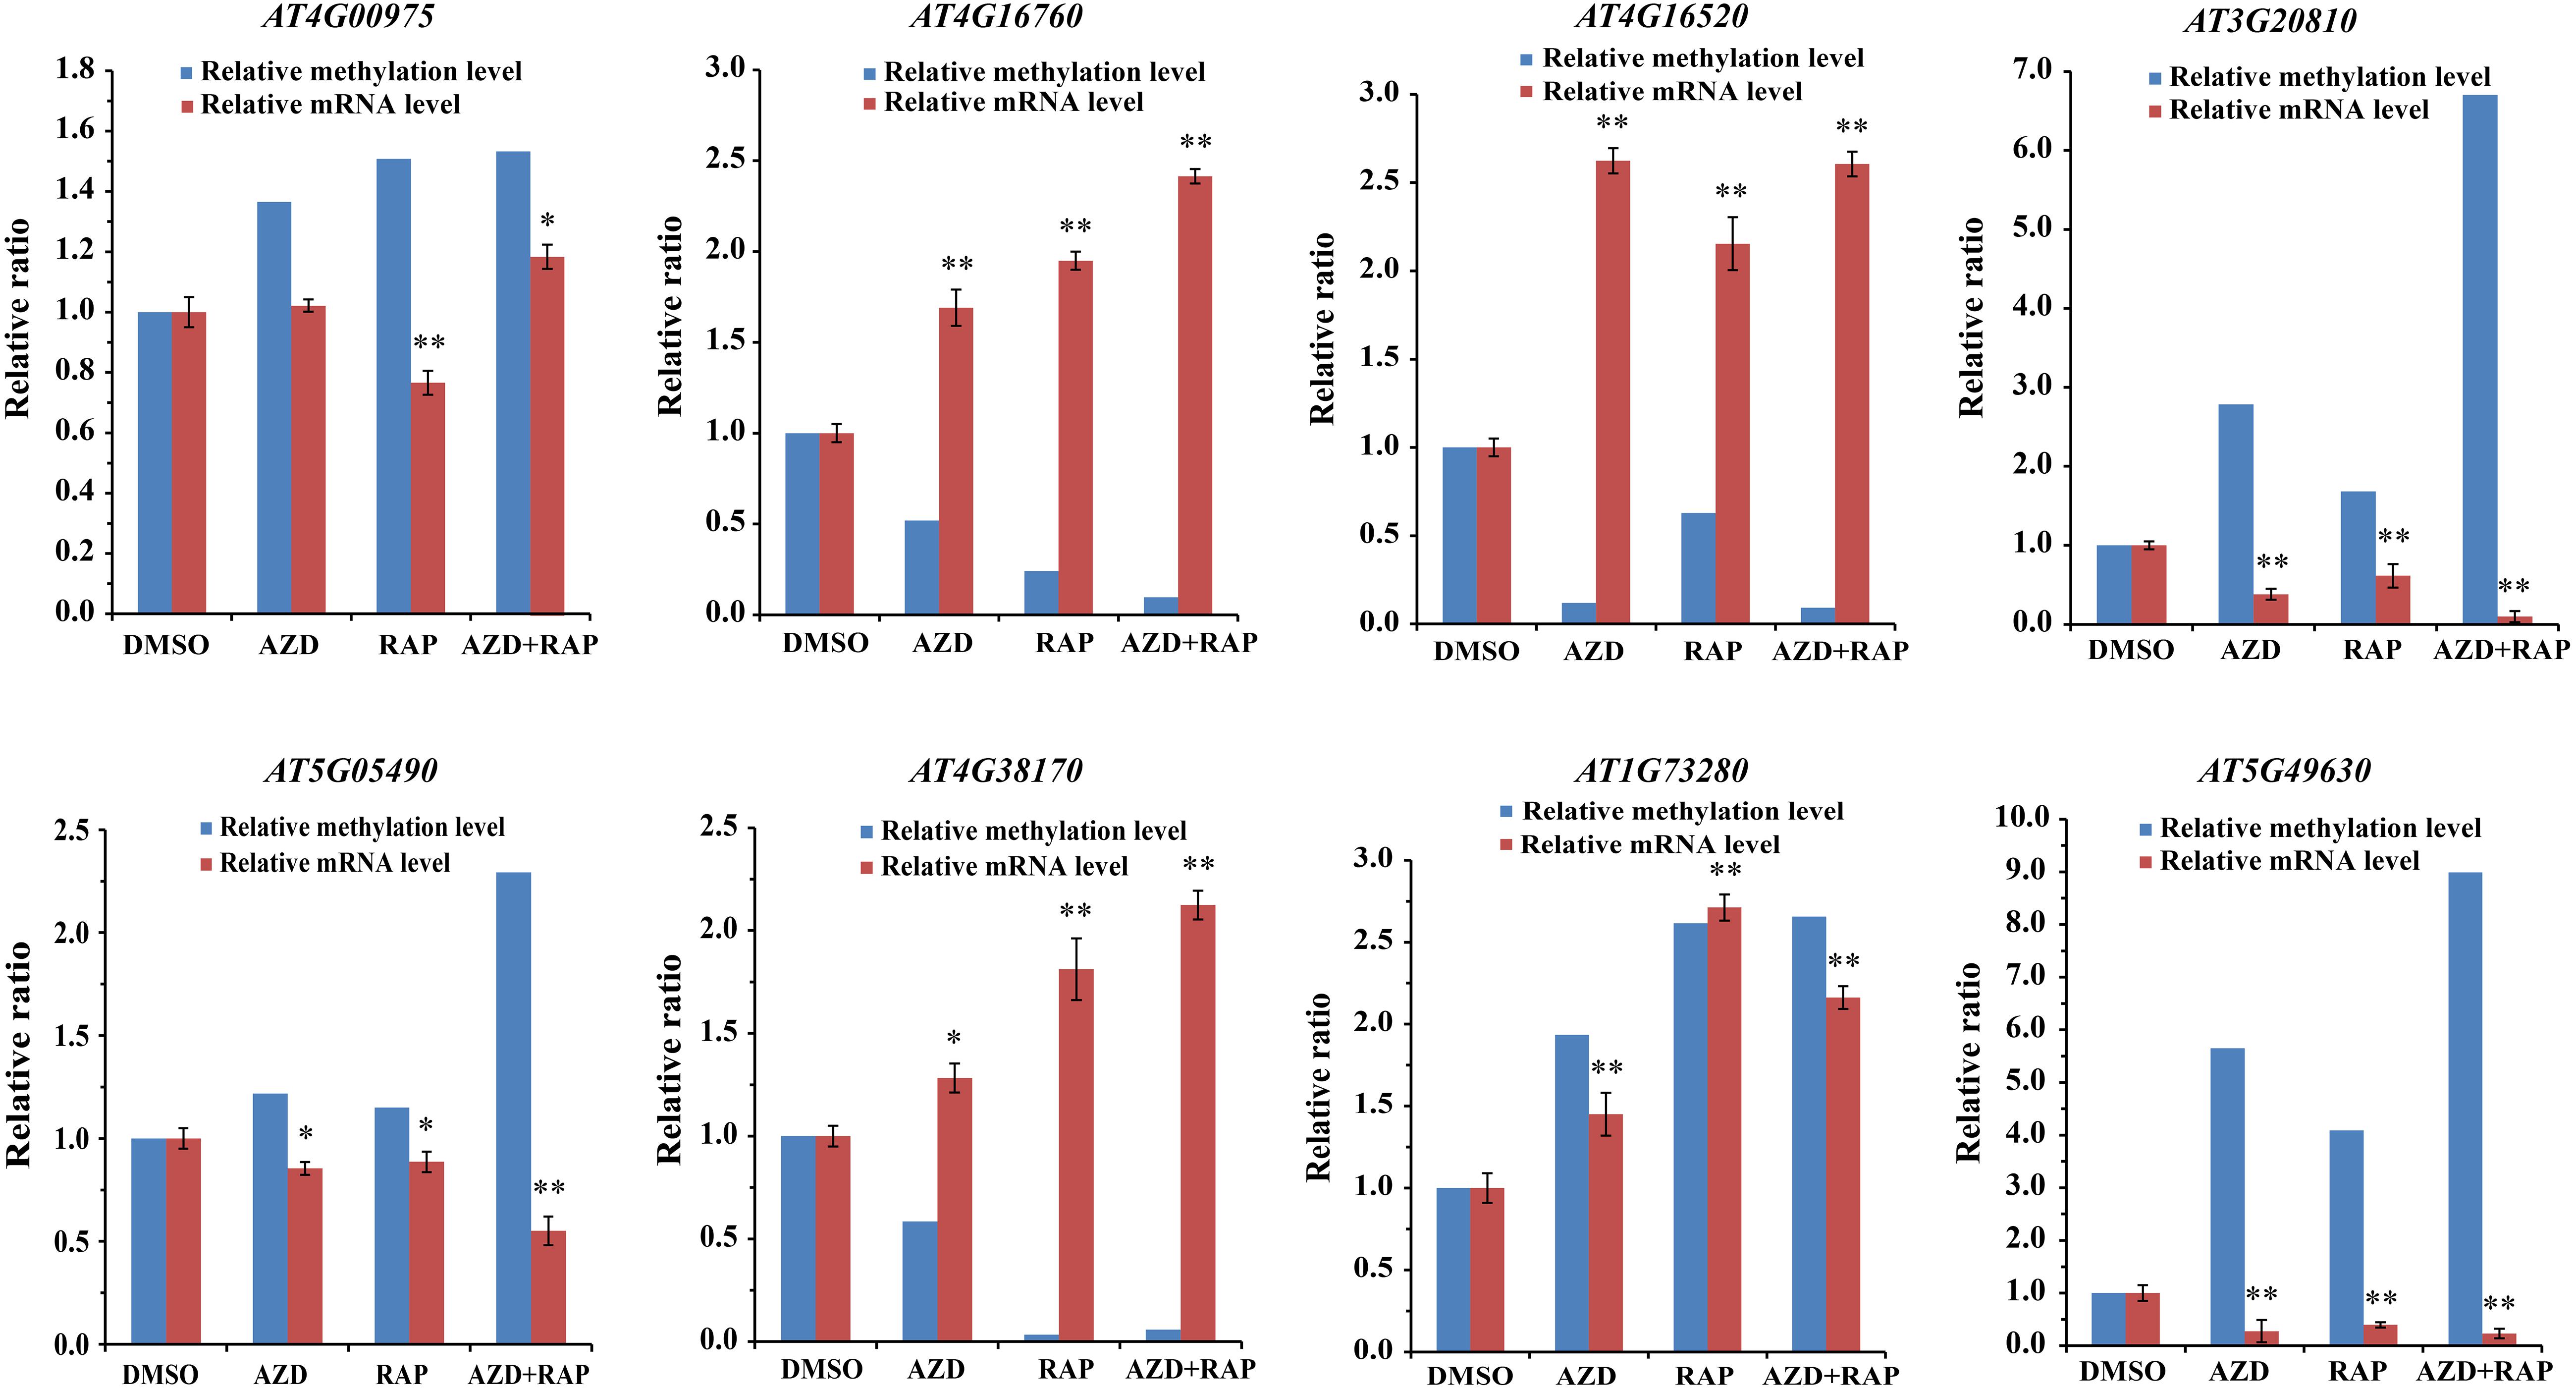
Figure 7. Relationship between DNA methylation and gene mRNA expression level in DMSO, AZD, RAP, and AZD + RAP treated BP12-2 samples. Error bars indicate means ± SD of three biological replicates. Asterisks denote Student’s t-test significant difference compared with DMSO (∗P < 0.05, ∗∗P < 0.01).
Discussion
In this study, we analyzed the functions of TOR in the regulation of DNA methylation using WGBS. We found that inhibition of TOR reduced whole-genome methylation levels whereas the methylation level of CHH site in the promoter region was increased. CHH methylation is maintained by DRM1 or DRM2 in plants. Through RNA-directed DNA methylation (RdDM) pathway, DRM2 maintains CHH methylation at RdDM target regions (Zhang et al., 2018). The transcription level of MET1 gene was down-regulated whereas DRM1 and DRM2 genes were up-regulated under TOR inhibition. Furthermore, the transcription level of DNA demethylation genes were significantly up-regulated in TOR-inhibited seedlings. These results explained that inhibition of TOR results in lower genome-wide methylation levels but increases methylation level of CHH site in the promoter region. Besides, CHROMOMETHYLASE 2 (CMT2) is also involved in maintaining CHH methylation in plants (Zemach et al., 2013; Stroud et al., 2014). Methylation level of CMT2 was decreased in AZD + RAP treated sample, implying that TOR inhibition may activate DRM2 or CMT2 to maintain CHH methylation level. Interestingly, our study showed that TOR regulated genome DNA methylation to control plant growth in Arabidopsis, while curcumin induced the promoter hypermethylation of mTOR gene in myeloma cells (Chen et al., 2019), suggesting that TOR had a feedback regulation mechanism in the process of regulating DNA methylation. The detailed regulatory mechanisms of TOR and DNA methyltransferases still need further study in the future.
In addition to reduced genome-wide methylation, we also identified 1296, 4015, and 4520 DMGs in AZD vs. DMSO, RAP vs. DMSO, and AZD + RAP vs. DMSO groups, respectively. The difference of DMGs between AZD and RAP may be caused by off-target effects in ScFKBP12-overexpressed Arabidopsis. Previous studies suggested that the expression of FKBP12 in Arabidopsis might have unexpected molecular phenotypes unrelated to TOR signaling pathway due to its peptidyl-prolyl isomerase activity (Gerard et al., 2011; Alavilli et al., 2018). Changes of non-TOR-kinase specific in intracellular metabolism caused by RAP off-targets in ScFKBP12-overexpressed Arabidopsis still need further study.
TOR signaling is indispensible for growth and development from embryogenesis to senescence by modulating translation, autophagy, metabolism, and cell cycle in plants (Ren et al., 2012; Xiong and Sheen, 2014; Shi et al., 2018). In our study, many genes of cellular metabolic processes and signal pathways were differentially methylated under TOR inhibition, especially carbon metabolism and biosynthesis of amino acids. Furthermore, DMGs associated with ribosome and ribosome biogenesis were detected. It is well known that TOR controls protein synthesis at multiple levels from transcription, ribosome biogenesis to protein translation in various eukaryotes (De Virgilio and Loewith, 2006; Xiong et al., 2013; Yang et al., 2013; Xiong and Sheen, 2014; Dong et al., 2015; Li et al., 2019). Our results indicated that TOR involved in the regulation of ribosome and ribosome biogenesis by changing the methylation levels of related genes, which is responsible for protein synthesis and plant growth.
Plant hormones play essential roles in plant growth, development and reproduction (Durbak et al., 2012). Previous studies demonstrate that TOR is indispensable for auxin signaling transduction, and auxin activates TOR to promote translation reinitiation in Arabidopsis (Deng et al., 2016; Schepetilnikov et al., 2017). Moreover, TOR signaling also promotes accumulation of BZR1 protein to promote plant growth in Arabidopsis (Zhang et al., 2016). Nevertheless, TOR signal and ABA or JA signal are antagonism to balance plant growth and stress response (Song et al., 2017; Wang et al., 2018). Based on the WGBS data, we found some DMGs in plant hormone signal transduction including auxin, BR and ABA signals. The differential methylation of these genes may result in changes in gene expression level, providing a new insight of the involvement of TOR in phytohormone signaling.
In summary, DNA methylation inhibitor azacitidine and TOR inhibitors synergistically inhibited the growth of Arabidopsis seedlings, implying that TOR played a role in DNA methylation. We therefore further systematically investigated changes in genome DNA methylation levels under TOR inhibition by high-throughput bisulfite sequencing, and we obtained a large number of differentially methylated regions and genes. Based on the whole-genome DNA methylation data, hypomethylation level of whole-genome DNA was observed in AZD, RAP, and AZD + RAP treated Arabidopsis. KEGG pathway enrichment showed that DMGs were involved in many metabolic pathways, such as carbon metabolism and biosynthesis of amino acids. Additionally, we also found that some plant hormone signal transduction-related genes displayed significant differences in methylation level under TOR inhibition. In conclusion, the above studies revealed the genome methylation pattern under TOR inhibition, providing important clues for further analysis of the functions of TOR in DNA methylation.
Data Availability Statement
The datasets generated for this study can be found in the NCBI Sequence Read Archive (SRA) accession: PRJNA606264.
Author Contributions
MR, TZ, and LL designed the experiments. TZ and LL performed the experiments. LL, LF, and HM analyzed the data. MR, TZ, and LL wrote the manuscript.
Funding
This work was supported by grants from the National Natural Science Foundation of China (Nos. U1804231 and 31972469), the Genetically Modified Organisms Breeding Major Project of China (No. 2019ZX08010004-004), Central Public-interest Scientific Institution Basal Research Fund (No. Y2020XK04), and Chengdu Agricultural Science and Technology Center local financial special fund project (NASC2019TI13).
Conflict of Interest
The authors declare that the research was conducted in the absence of any commercial or financial relationships that could be construed as a potential conflict of interest.
Supplementary Material
The Supplementary Material for this article can be found online at: https://www.frontiersin.org/articles/10.3389/fgene.2020.00186/full#supplementary-material
Footnotes
References
Adam, B. S., Nicolas, G. D. L., Sergey, M., Lasse, J., Gulnara, Y., and Marat, Y. (2011). The structure of the eukaryotic ribosome at 3.0? resolution. Science 334, 1524–1529. doi: 10.1126/science.1212642
Ahmad, Z., Magyar, Z., Bogre, L., and Papdi, C. (2019). Cell cycle control by the target of rapamycin signalling pathway in plants. J. Exp. Bot. 70, 2275–2284. doi: 10.1093/jxb/erz140
Alavilli, H., Lee, H., Park, M., Yun, D. J., and Lee, B. H. (2018). Enhanced multiple stress tolerance in Arabidopsis by overexpression of the polar moss peptidyl prolyl isomerase FKBP12 gene. Plant Cell Rep. 37, 453–465. doi: 10.1007/s00299-017-2242-9
Benjamin, D., Colombi, M., Moroni, C., and Hall, M. N. (2011). Rapamycin passes the torch: a new generation of mTOR inhibitors. Nat. Rev. Drug Discov. 10, 868–880. doi: 10.1038/nrd3531
Bouyer, D., Kramdi, A., Kassam, M., Heese, M., Schnittger, A., Roudier, F., et al. (2017). DNA methylation dynamics during early plant life. Genome Biol. 18:179. doi: 10.1186/s13059-017-1313-0
Chan, S. W., Henderson, I. R., and Jacobsen, S. E. (2005). Gardening the genome: DNA methylation in Arabidopsis thaliana. Nat. Rev. Genet. 6, 351–360.
Chan, S. W., Henderson, I. R., Zhang, X., Shah, G., Chien, J. S., and Jacobsen, S. E. (2006). RNAi, DRD1, and histone methylation actively target developmentally important non-CG DNA methylation in Arabidopsis. PLoS Genet. 2:e83. doi: 10.1371/journal.pgen.0020083
Chen, J., Ying, Y., Zhu, H., Zhu, T., Qu, C., Jiang, J., et al. (2019). Curcumin-induced promoter hypermethylation of the mammalian target of rapamycin gene in multiple myeloma cells. Oncol. Lett. 17, 1108–1114. doi: 10.3892/ol.2018.9662
Chou, T. C. (2006). Theoretical basis, experimental design, and computerized simulation of synergism and antagonism in drug combination studies. Pharmacol. Rev. 58, 621–681.
Chou, T. C., and Talalay, P. (1984). Quantitative analysis of dose-effect relationships: the combined effects of multiple drugs or enzyme inhibitors. Adv. Enzyme Regul. 22, 27–55.
Christman, J. K. (2002). 5-Azacytidine and 5-aza-2’-deoxycytidine as inhibitors of DNA methylation: mechanistic studies and their implications for cancer therapy. Oncogene 21, 5483–5495.
De Virgilio, C., and Loewith, R. (2006). Cell growth control: little eukaryotes make big contributions. Oncogene 25, 6392–6415.
Deng, K., Dong, P., Wang, W., Feng, L., Xiong, F., Wang, K., et al. (2017). The TOR pathway is involved in adventitious root formation in Arabidopsis and potato. Front. Plant Sci. 8:784. doi: 10.3389/fpls.2017.00784
Deng, K., Yu, L., Zheng, X., Zhang, K., Wang, W., Dong, P., et al. (2016). Target of rapamycin is a key player for auxin signaling transduction in Arabidopsis. Front. Plant Sci. 7:291. doi: 10.3389/fpls.2016.00291
Dobrenel, T., Caldana, C., Hanson, J., Robaglia, C., Vincentz, M., Veit, B., et al. (2016). TOR signaling and nutrient sensing. Plant Biol. 67, 261–285.
Dong, P., Xiong, F., Que, Y., Wang, K., Yu, L., Li, Z., et al. (2015). Expression profiling and functional analysis reveals that TOR is a key player in regulating photosynthesis and phytohormone signaling pathways in Arabidopsis. Front. Plant Sci. 6:677. doi: 10.3389/fpls.2015.00677
Durbak, A., Yao, H., and Mcsteen, P. (2012). Hormone signaling in plant development. Curr. Opin. Plant Biol. 15, 92–96. doi: 10.1016/j.pbi.2011.12.004
Fieldes, M. A., Schaeffer, S. M., Krech, M. J., and Brown, J. C. (2005). DNA hypomethylation in 5-azacytidine-induced early-flowering lines of flax. Theor. Appl. Genet. 111, 136–149.
Gerard, M., Deleersnijder, A., Demeulemeester, J., Debyser, Z., and Baekelandt, V. (2011). Unraveling the role of peptidyl-prolyl isomerases in neurodegeneration. Mol. Neurobiol. 44, 13–27. doi: 10.1007/s12035-011-8184-2
Grace, G. M., and Bestor, T. H. (2005). Eukaryotic cytosine methyltransferases. Annu. Rev. Biochem. 74, 481–514.
Heitman, J., Movva, N. R., and Hall, M. N. (1991). Targets for cell cycle arrest by the immunosuppressant rapamycin in yeast. Science 253, 905–909.
Iadevaia, V., Liu, R., and Proud, C. G. (2014). mTORC1 signaling controls multiple steps in ribosome biogenesis. Semin. Cell Dev. Biol. 36, 113–120. doi: 10.1016/j.semcdb.2014.08.004
Juppner, J., Mubeen, U., Leisse, A., Caldana, C., Wiszniewski, A., Steinhauser, D., et al. (2018). The target of rapamycin kinase affects biomass accumulation and cell cycle progression by altering carbon/nitrogen balance in synchronized Chlamydomonas reinhardtii cells. Plant J. 93, 355–376. doi: 10.1111/tpj.13787
Kos-Braun, I. C., and Kos, M. (2017). Post-transcriptional regulation of ribosome biogenesis in yeast. Microb. Cell 4, 179–181.
Li, L., Song, Y., Wang, K., Dong, P., Zhang, X., Li, F., et al. (2015). TOR-inhibitor insensitive-1 (TRIN1) regulates cotyledons greening in Arabidopsis. Front. Plant Sci. 6:861. doi: 10.3389/fpls.2015.00861
Li, L., Zhu, T., Song, Y., Luo, X., Feng, L., Zhuo, F., et al. (2019). Functional characterization of target of rapamycin signaling in Verticillium dahliae. Front. Microbiol. 10:501. doi: 10.3389/fmicb.2019.00501
Lister, R., Mukamel, E. A., Nery, J. R., Urich, M., Puddifoot, C. A., Johnson, N. D., et al. (2013). Global epigenomic reconfiguration during mammalian brain development. Science 341:1237905. doi: 10.1126/science.1237905
Lister, R., O’malley, R. C., Tonti-Filippini, J., Gregory, B. D., Berry, C. C., Millar, A. H., et al. (2008). Highly integrated single-base resolution maps of the epigenome in Arabidopsis. Cell 133, 523–536. doi: 10.1016/j.cell.2008.03.029
Long, J., Zhi, J., Xia, Y., Lou, P. E., Lei, C., Wang, H., et al. (2014). Genome-wide DNA methylation changes in skeletal muscle between young and middle-aged pigs. BMC Genomics 15:653. doi: 10.1186/1471-2164-15-653
Lou, S., Lee, H. M., Qin, H., Li, J. W., Gao, Z., Liu, X., et al. (2014). Whole-genome bisulfite sequencing of multiple individuals reveals complementary roles of promoter and gene body methylation in transcriptional regulation. Genome Biol. 15:408. doi: 10.1186/s13059-014-0408-0
Mao, X., Tao, C. J. G. O., and Wei, L. (2005). Automated genome annotation and pathway identification using the KEGG orthology (KO) as a controlled vocabulary. Bioinformatics 21, 3787–3793.
Marfil, C. F., Asurmendi, S., and Masuelli, R. W. (2012). Changes in micro RNA expression in a wild tuber-bearing Solanum species induced by 5-azacytidine treatment. Plant Cell Rep. 31, 1449–1461. doi: 10.1007/s00299-012-1260-x
Minoru, K., Michihiro, A., Susumu, G., Masahiro, H., Mika, H., Masumi, I., et al. (2008). KEGG for linking genomes to life and the environment. Nucleic Acids Res. 36, 480–484.
Montane, M. H., and Menand, B. (2013). ATP-competitive mTOR kinase inhibitors delay plant growth by triggering early differentiation of meristematic cells but no developmental patterning change. J. Exp. Bot. 64, 4361–4374. doi: 10.1093/jxb/ert242
Moore, L. D., Le, T., and Fan, G. (2013). DNA methylation and its basic function. Neuropsychopharmacology 38, 23–38. doi: 10.1038/npp.2012.112
Opron, K., and Burton, Z. F. (2018). Ribosome structure, function, and early evolution. Int. J. Mol. Sci. 20:E40.
Osorio-Montalvo, P., Sáenz-Carbonell, L., and De-La-Peña, C. (2018). 5-azacytidine: a promoter of epigenetic changes in the quest to improve plant somatic embryogenesis. Int. J. Mol. Sci. 19:3182. doi: 10.3390/ijms19103182
Ren, M., Qiu, S., Venglat, P., Xiang, D., Feng, L., Selvaraj, G., et al. (2011). Target of rapamycin regulates development and ribosomal RNA expression through kinase domain in Arabidopsis. Plant Physiol. 155, 1367–1382. doi: 10.1104/pp.110.169045
Ren, M., Venglat, P., Qiu, S., Feng, L., Cao, Y., Wang, E., et al. (2012). Target of rapamycin signaling regulates metabolism, growth, and life span in Arabidopsis. Plant Cell 24, 4850–4874. doi: 10.1105/tpc.112.107144
Rubio, V., Bustos, R., Irigoyen, M. L., Cardona-López, X., Rojas-Triana, M., and Paz-Ares, J. (2009). Plant hormones and nutrient signaling. Plant Mol. Biol. 69, 361–373. doi: 10.1007/s11103-008-9380-y
Saxton, R. A., and Sabatini, D. M. (2017). mTOR signaling in growth, metabolism, and disease. Cell 168, 960–976. doi: 10.1016/j.cell.2017.02.004
Schepetilnikov, M., Makarian, J., Srour, O., Geldreich, A., Yang, Z., Chicher, J., et al. (2017). GTPase ROP2 binds and promotes activation of target of rapamycin, TOR, in response to auxin. EMBO J. 36, 886–903. doi: 10.15252/embj.201694816
Shi, L., Wu, Y., and Sheen, J. (2018). TOR signaling in plants: conservation and innovation. Development 145:dev160887. doi: 10.1242/dev.160887
Smallwood, S. A., Lee, H. J., Angermueller, C., Krueger, F., Saadeh, H., Peat, J., et al. (2014). Single-cell genome-wide bisulfite sequencing for assessing epigenetic heterogeneity. Nat. Methods 11, 817–820. doi: 10.1038/nmeth.3035
Song, Y., Li, L., Yang, Z., Zhao, G., Zhang, X., Wang, L., et al. (2018). Target of rapamycin (TOR) regulates the expression of lncRNAs in response to abiotic stresses in cotton. Front. Genet. 9:690. doi: 10.3389/fgene.2018.00690
Song, Y., Zhao, G., Zhang, X., Li, L., Xiong, F., Zhuo, F., et al. (2017). The crosstalk between target of rapamycin (TOR) and jasmonic acid (JA) signaling existing in Arabidopsis and cotton. Sci. Rep. 7:45830. doi: 10.1038/srep45830
Stroud, H., Do, T., Du, J., Zhong, X., Feng, S., Johnson, L., et al. (2014). Non-CG methylation patterns shape the epigenetic landscape in Arabidopsis. Nat. Struct. Mol. Biol. 21, 64–72. doi: 10.1038/nsmb.2735
Wang, P., Zhao, Y., Li, Z., Hsu, C. C., Liu, X., Fu, L., et al. (2018). Reciprocal regulation of the TOR kinase and ABA receptor balances plant growth and stress response. Mol. Cell 69, 100–112.e6. doi: 10.1016/j.molcel.2017.12.002
Webb, A. A., and Satake, A. (2015). Understanding circadian regulation of carbohydrate metabolism in Arabidopsis using mathematical models. Plant Cell Physiol. 56, 586–593. doi: 10.1093/pcp/pcv033
Xiong, Y., Mccormack, M., Li, L., Hall, Q., Xiang, C., and Sheen, J. (2013). Glucose-TOR signalling reprograms the transcriptome and activates meristems. Nature 496, 181–186. doi: 10.1038/nature12030
Xiong, Y., and Sheen, J. (2014). The role of target of rapamycin signaling networks in plant growth and metabolism. Plant Physiol. 164, 499–512. doi: 10.1104/pp.113.229948
Xu, Q., Liang, S., Kudla, J., and Luan, S. (1998). Molecular characterization of a plant FKBP12 that does not mediate action of FK506 and rapamycin. Plant J. 15, 511–519.
Yang, H., Rudge, D. G., Koos, J. D., Vaidialingam, B., Yang, H. J., and Pavletich, N. P. (2013). mTOR kinase structure, mechanism and regulation. Nature 497, 217–223.
Young, M. D., Wakefield, M. J., Smyth, G. K., and Oshlack, A. (2010). Gene ontology analysis for RNA-seq: accounting for selection bias. Genome Biol. 11:R14. doi: 10.1186/gb-2010-11-2-r14
Yuan, H. X., Xiong, Y., and Guan, K. L. (2013). Nutrient sensing, metabolism, and cell growth control. Mol. Cell 49, 379–387. doi: 10.1016/j.molcel.2013.01.019
Zemach, A., Kim, M. Y., Hsieh, P. H., Coleman-Derr, D., Eshed-Williams, L., Thao, K., et al. (2013). The Arabidopsis nucleosome remodeler DDM1 allows DNA methyltransferases to access H1-containing heterochromatin. Cell 153, 193–205. doi: 10.1016/j.cell.2013.02.033
Zhang, H., Lang, Z., and Zhu, J. K. (2018). Dynamics and function of DNA methylation in plants. Nat. Rev. Mol. Cell Biol. 19, 489–506. doi: 10.1038/s41580-018-0016-z
Zhang, X., Yazaki, J., Sundaresan, A., Cokus, S., Chan, S. W., Chen, H., et al. (2006). Genome-wide high-resolution mapping and functional analysis of DNA methylation in Arabidopsis. Cell 126, 1189–1201.
Keywords: target of rapamycin, DNA methylation, AZD-8055, rapamycin, plant growth, Arabidopsis
Citation: Zhu T, Li L, Feng L, Mo H and Ren M (2020) Target of Rapamycin Regulates Genome Methylation Reprogramming to Control Plant Growth in Arabidopsis. Front. Genet. 11:186. doi: 10.3389/fgene.2020.00186
Received: 04 November 2019; Accepted: 17 February 2020;
Published: 03 March 2020.
Edited by:
Kai Tang, Purdue University, United StatesReviewed by:
Yu-Hung Hung, Donald Danforth Plant Science Center, United StatesZoltan Magyar, Biological Research Centre, Hungarian Academy of Sciences (MTA), Hungary
Copyright © 2020 Zhu, Li, Feng, Mo and Ren. This is an open-access article distributed under the terms of the Creative Commons Attribution License (CC BY). The use, distribution or reproduction in other forums is permitted, provided the original author(s) and the copyright owner(s) are credited and that the original publication in this journal is cited, in accordance with accepted academic practice. No use, distribution or reproduction is permitted which does not comply with these terms.
*Correspondence: Maozhi Ren, cmVubWFvemhpMDFAY2Fhcy5jbg==
†These authors have contributed equally to this work
 Tingting Zhu1,2†
 Maozhi Ren
