
95% of researchers rate our articles as excellent or good
Learn more about the work of our research integrity team to safeguard the quality of each article we publish.
Find out more
ORIGINAL RESEARCH article
Front. Genet. , 27 February 2020
Sec. Computational Genomics
Volume 11 - 2020 | https://doi.org/10.3389/fgene.2020.00075
This article is part of the Research Topic Computational Learning Models and Methods Driven by Omics for Precision Medicine View all 36 articles
 Akram Emdadi1
 Changiz Eslahchi1,2*
The ability to predict the drug response for cancer disease based on genomics information is an essential problem in modern oncology, leading to personalized treatment. By predicting accurate anticancer responses, oncologists achieve a complete understanding of the effective treatment for each patient. In this paper, we present DSPLMF (Drug Sensitivity Prediction using Logistic Matrix Factorization) approach based on Recommender Systems. DSPLMF focuses on discovering effective features of cell lines and drugs for computing the probability of the cell lines are sensitive to drugs by logistic matrix factorization approach. Since similar cell lines and similar drugs may have similar drug responses and incorporating similarities between cell lines and drugs can potentially improve the drug response prediction, gene expression profile, copy number alteration, and single-nucleotide mutation information are used for cell line similarity and chemical structures of drugs are used for drug similarity. Evaluation of the proposed method on CCLE and GDSC datasets and comparison with some of the state-of-the-art methods indicates that the result of DSPLMF is significantly more accurate and more efficient than these methods. To demonstrate the ability of the proposed method, the obtained latent vectors are used to identify subtypes of cancer of the cell line and the predicted IC50 values are used to depict drug-pathway associations. The source code of DSPLMF method is available in https://github.com/emdadi/DSPLMF.
Cancer is a genetic disease that results when cellular changes and accumulation of different types of mutations cause the uncontrolled growth and division of cells. There are more than 200 different types of cancer, having a significant global impact on public health. Since cancer is a disease of genetic complexity and diversity, the drug response for different patients can be different. The main reason for this occurrence is the difference in the molecular and genetic information of individuals, such as gene expression data, the type of mutation in the genome and copy number alteration information. These findings and achievements have recently made a significant challenge in the prediction of drug response for an individual patient in the research of precision medicine.
High-throughput drug screening technologies on several panels of cancer cell lines have been provided. For instance, two recent consortiums Genomics of Drug Sensitivity in Cancer (GDSC) Yang et al. (2012) and Cancer Cell Line Encyclopedia (CCLE) Barretina et al. (2012) have collected around 1,000 cell lines and their pharmacological profiles for several cancer drugs. The IC50 measure (minimal concentration of drug that induced 50% cell line death) is usually used as a sensitivity measure. To facilitate and speed up drug discovery and prediction process, many methods have been developed in these fields by researches from numerous domains such as computational biology, machine learning, and data mining approaches.
In the challenge of the DREAM project, the performance of 44 drug response prediction algorithms was considered for breast cancer cell lines. The introduced algorithms were evaluated using the weighted probabilistic c-index (WPC-index) and resampled Spearman correlation Costello et al. (2014). Various machine learning methods have been proposed in this area. Barretina et al. proposed a method for predicting drug response based on naive Bayes classifier that selected importance features by two steps. First, they used Wilcoxon Sum Rank Test and Fisher Exact Test to select the 30 top features and then they applied naive Bayes classifier for drug response prediction Barretina et al. (2012). SVM-RFE method is a wrapper that used SVM classifier and recursive feature selection method Dong et al. (2015). FSelector method used k-nearest neighbor (KNN) algorithm based on selected features that are achieved by information entropy Soufan et al. (2015). Suphavilai et al. (2018) proposed the CaDRReS method as a predictor cancer drug response model based on the recommender system and learning projections for drugs and cell lines into a latent space. AutoBorutaRF was presented by Xu et al., based on feature selection for classification of anticancer drug responses. The method first built a subset of essential features, then used Boruta algorithms Kursa et al. (2010) to select some features for applying Random-Forest classifier to predict drug response Lu et al. (2019).
In this paper, we modeled the cancer drug sensitivity problem based on “Recommender Systems” approach. A logistic matrix factorization algorithm was used for predicting drug cancer response. By applying the proposed model to GDSC and CCLE datasets, we proved that DSPLMF is of excellent prediction accuracy.
The performance of drug response prediction algorithms was evaluated on two benchmark datasets, including GDSC and CCLE. The datasets were downloaded by using R package PharmacoGx Smirnov et al. (2015). In these datasets, there are several types of information such as IC50 values according to the set of cell lines and drugs and some other information such as gene expression profile, copy number alteration, and single-nucleotide mutation that used in the model designing for more efficiency. Since in these datasets some of the above information is missing, the method of compensating for missing values given by Lu et al. (2019) is used. The missing value for a cell line can belong to response value, copy number alteration, and single-nucleotide mutation features. The cell lines with more than 50% missing value were removed from the dataset and for remaining, the missing values were predicted from the known values of k-nearest cell lines. At the end, 555 cell lines and 98 drugs remain without any missing value for GDSC and 363 cell lines and 24 drugs for CCLE datasets.
The main idea of the model DSPLMF is to construct a classification model for predicting how a cell line responds to a drug. Since drug response can be divided into two classes “sensitivity” and “resistance,” there are many ways for the purpose of classification based on IC50 values. By considering the histograms of IC50, we observed some histograms are normal-like, and others have skewness. Also, it can be supposed that the labels of classes should be determined by the data of individual drugs. For normal-like histograms, median, and mean are the same. If the histogram is skewed right, the mean is greater than the median, and if the histogram is skewed left, the mean is smaller than the median. We chose medium because we wanted to set a single, universal standard threshold for all drugs. So, the strategy introduced by Li et al. (2015) was used and the median of IC50 values were applied as a threshold for classification. The "sensitivity" or class with label 1 was assigned to a cell line if its IC50 is smaller than the median of cell lines for an individual drug and "resistance" or class with label 0 to a cell line was assigned, otherwise. DSPLMF method has four main steps as follows.
In the first step, by converting the model to a classification problem, a 0,1 observation matrix was achieved, as cell lines and drugs are rows and columns of the matrix, respectively. Then, a logistic matrix factorization method for constructing the latent vectors for each cell line and drug is applied. In the second step, for improving the prediction accuracy of the model, the similarity information for cell lines and drugs are used. In the third step, a model is applied to learn to predict the probability that a new cell line would sensitive to a drug. Subsequently, with applying the threshold to predicted probabilities of the cell line-drug pairs, we classified each pair to sensitive or resistance class. In the next section, first the similarity matrices used in the model, were introduced and then the details of each step are explained in the following steps. The main scheme of DSPLMF algorithm is represented in Figure 1.

Figure 1 Scheme of DSPLMF algorithm. First, similarities between each pair of cell lines are constructed based on the information of gene expression, single-nucleotide mutation, copy number alteration, and IC50 values. Also, similarity between each pair of drugs is defined based on chemical substructure and the median of IC50 values are applied as a threshold for classification. Using DSPLMF model, the latent vectors for each cell line and drug are achieved. For each new cell line, decision tree classifier is applied to find its t-most nearest neighbors and the probabilities that this cell line is sensitive to drugs are estimated based on the latent vectors of its neighbors. Eventually, a threshold is applied on probabilities to assign sensitive or resistance class to each new cell line-drug pair.
In this part, the four similarities between each pair of cell lines based on the information of gene expression, single-nucleotide mutation, copy number alteration, and IC50 values were defined.
● Gene expression Similarity, Simexp Gene expression information is an auxiliary feature for similarity between cell lines. Let ei denoted the gene expression vector of cell line ci in cancerous conditions. For pair of cell lines ci and cj, Simexp(ci, cj) is defined as the Pearson correlation between the vectors ei and ej and the gene expression similarity matrix between cell lines considered as Simexp = [Simexp(ci, cj)]n × n, where n is the numbers of cell lines. Each entry of these metrics is in [−1,1]. The numbers of considered genes for two datasets GDSC and CCLE for similarity measure are 11,712 and 19,389, respectively. So the length of vector ei is 11,712 and 19,389 for GDSC and CCLE dataset, respectively.Q[SpecialChar] Verify that all the equations and special characters are displayed correctly.
● Single-nucleotide mutation Similarity, Simmut Let zero-one vectors mi indicate that whether a mutation occurred in the set of genes for cell line ci or not. Simmut(ci, cj) is defined as the Jaccard similarity between the vectors mj and mj and the single-nucleotide mutation similarity matrix between cell lines considered as Simmut = [Simmut(ci, cj)]n × n. Each entry of these metrics is in [0, 1]. The mutation information of 54 genes are accessible for cell lines in GDSC dataset and 1667 genes for cell lines in CCLE dataset, respectively.
● Copy number alteration Similarity, Simcnv Let vi denoted the copy number alteration vector for cell line ci. Simcnv(ci, cj) is defined as the Pearson correlation between the vectors vi and vj and the copy number alteration similarity matrix between cell lines considered as Simcnv = [Simcnv(ci, cj)]n × n. Each entry of these metrics is in [−1, 1]. The information of copy number alteration of 24,959 and 24,960 genes for two GDSC and CCLE datasets are accessible, respectively.
● IC50 value Similarity, SimIC50 Moreover, the similarity between cell lines proposed by Liu et al. (2018) based on the correlation between their response IC50 values was used. Let ICi denoted the vector of IC50 values of drugs in cell line ci. SimIC50(ci, cj) is defined as the Pearson correlation between the vectors ICi and ICj and the similarity based on IC50 matrix between cell lines considered as SimIC50 = [SimIC50(ci, cj)]n × n and each element of these metrics in [−1, 1].
To aggregate these similarities to a single matrix, Simtotal = [SCij]n × n, the following formula is used:
where γ, λ, ϕ and ψ are parameters that represent the importance of each of the matrix and tuned in the model. The numbers of considered genes for two datasets GDSC and CCLE for Simexp are 11,712 and 19,389, respectively. The mutation information of 54 genes is accessible for cell lines in GDSC dataset and 1,667 genes for cell lines in CCLE dataset. The information of copy number alteration of 24,959 and 24,960 genes for two GDSC and CCLE datasets are accessible, respectively. Since three matrices Simexp, Simcnv, and Simmut have been constructed by different sets of genes (the number of common genes between them is about 50%), there is not an additive relation between them. In general, an absolute correlation coefficient of >0.7 among two or more predictors indicates the presence of collinearity. But as Table 1 shows, all correlation coefficients between similarity matrices are very low, so there is not collinearity between matrices and they can be linearly combined.
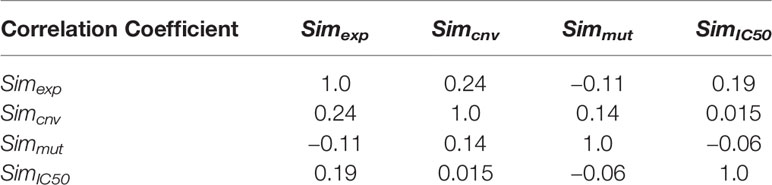
Table 1 Correlation coefficient between four matrices Simexp, Simcnv, Simmut, and SimIC50.
Since it is expected that similar drugs have the same effect on cell lines, drug similarity information for predicting drug response was used in the proposed method. A drug can be represented as a binary feature vector, by using drug substructures, drug transporters, drug targets, drug enzymes, drug pathways, drug indications, or drug side effects information. Since there is only information about chemical substructures, for each drug we have a zero-one vector of size 881, where 881 is the number of known chemical substructures of a drug. In this vector one indicates the presence of a substructure of drug and zero otherwise. We downloaded the substructure for each drug from PubChem. The PubChem system generates a binary substructure fingerprint for chemical structures. These fingerprints are used by PubChem for similarity neighboring and similarity searching. Let and are the vectors correspond to the drugs di and dj. Similarity (di, dj) is considered as Jaccard similarity between these two vectors. We construct the matrix Simdrug = [SDij]m × m as similarity matrix between each pair of drugs.
Assume the set of cell lines is denoted by C = {c1, c2, …, cn } and the set of drugs is denoted by D = {d1, d2, …, dm }, where n and m are the numbers of cell lines and the numbers of drugs, respectively. The relationship between cell lines and drugs are represented by a binary matrix Q = [qij]n × m, where each element qij ∈ {0, 1}. If a cell line is ci sensitive to a drug dj, qij = 1 and otherwise qij = 0. The probability of sensitivity of a cell line to a drug is defined by a logistic function as follows:
where ui nd vj are the latent vectors of size L corresponding to i-th cell line and j-th drug, respectively and the latent vectors of all cell lines and all drugs are denoted by U and V, respectively. On the other hands, the non-negative values and are the bias parameters according to cell line i and drug j, respectively. Moreover, we denoted βc ∈ ℝn × 1 and βd ∈ ℝm × 1 as bias vectors for cell lines and drugs, respectively. Bias parameters are considered because some cell lines respond significantly to many drugs and there are cell lines that respond to few drugs. Similarly for some drugs, there are many cell lines that respond to them, and there are drugs that most cell lines do not respond to significantly. Thus, by applying these parameters, we try to reduce bias. The vectors and considered as bias vector of the model.
In this model, all the data in the training set are assumed to be independent. So the probability that matrix Q occurred, considering the latent and bias vectors, can be computed as:
When qij = 1 then both r (1 – qij) and 1 – qij are zero. Similarly, when qij = 0, rqij = qij = 0. So, formula 3 is rewritten as follows:
Finally, the above probability is shown as follows:
Where (r ≧̸ 1) is used to control the importance levels of observed interactions. In some classification problems with two classes (0 and 1), lack of information make us to assign label zero to some objects. But, it may be that the real label of these objects are one. So, the members of class one are highly trusted, while some members assign to class zero because of lack of information. As an example, in drug-target prediction or drug-drug interaction prediction models, the observed interacting drug-target pairs or drug-drug pairs have been experimentally verified; thus, they are more trustworthy and important than the unknown pairs. Toward more accurate modeling for these prediction models, the authors can assign higher importance levels to the interaction pairs than unknown pairs. This importance weighting strategy (considering r > 1) has been demonstrated to be effective for personalized recommendations. On the other hand, in DSPLMF model, both classes (sensitivity and resistance) have the same importance and validity. So, we set r to be one.
We also deposited zero-mean spherical Gaussian priors on latent vectors of cell lines and drugs as:
where I denotes the identity matrix and and are parameters for controlling the variances of prior distributions of cell lines and drugs. Based on Bayesian theorem we have:
Since U, V, βc, βd are the parameters in the model M, Bayesian theorem is as follows:
So we can conclude the following relation:
According to the Bayesian theorem and equations 5, 6, and 7, the log of the posterior distribution is estimated as follows:
In formula 11, regarding how Bayesian theorem is applied to classification problems, we could convert the direct proportional relation between the left hand side and the numerator of the fraction of equation 10 to equalized, by adding constant term T to the formula. Where T is independent of the model parameters Hand et al. (1999). , . The parameters of the model can be learned by maximizing the above formula, which is equivalent to minimizing the following objective function:
where ‖·‖F denotes the Frobenius norm of matrix.
For regularization the objective function 12, for each cell line ci, we choose the set Nk(ci) that denotes the k-most similar cell lines to c (except ci) using Simtotal matrix. We constructed adjacency matrix A= [aij]nxn that represents cell line neighborhood information as follow:
A is an n × n matrix, which for the row corresponding to cell line ci, the entries of columns corresponding to the k-most similar cell lines of ci are obtained from their similarities, Simtotal matrix, and the other elements of this row are zero.
Similarly, for a drug di, the set Nk(di) denotes the k-most similar drugs to di (except di) using Simdrug matrix. The adjacency matrix B to describe the drug neighborhood information is denoted by B = [bij]m×m, where;
B is an m × m matrix, which for the row corresponding to drug di, the entries of columns corresponding to the k-most similar drugs of di are obtained from their similarities, Simdrug matrix, and the other elements of this row are zero.
To illustrate the data structure of these similarity matrices, as an example, for k = 5 and 24 drugs in CCLE dataset, the similarity matrix B is denoted in Figure 2A. Figure 2B, shows the graph corresponding to this matrix. As it can be seen from Figure 2A, each row i of the matrix has five nonzero elements corresponding to the five-most similar drugs of di in Simdrug matrix, and the other elements are zero. In Figure 2B, the degree of each node is five and the red edges denote the neighbors of the nutlin-3. 5-most similar drugs to Nutlin-3 based on sim drug matrix are AEW541, AZD0530, Lapatinib, crizotinib, and sorafenib.
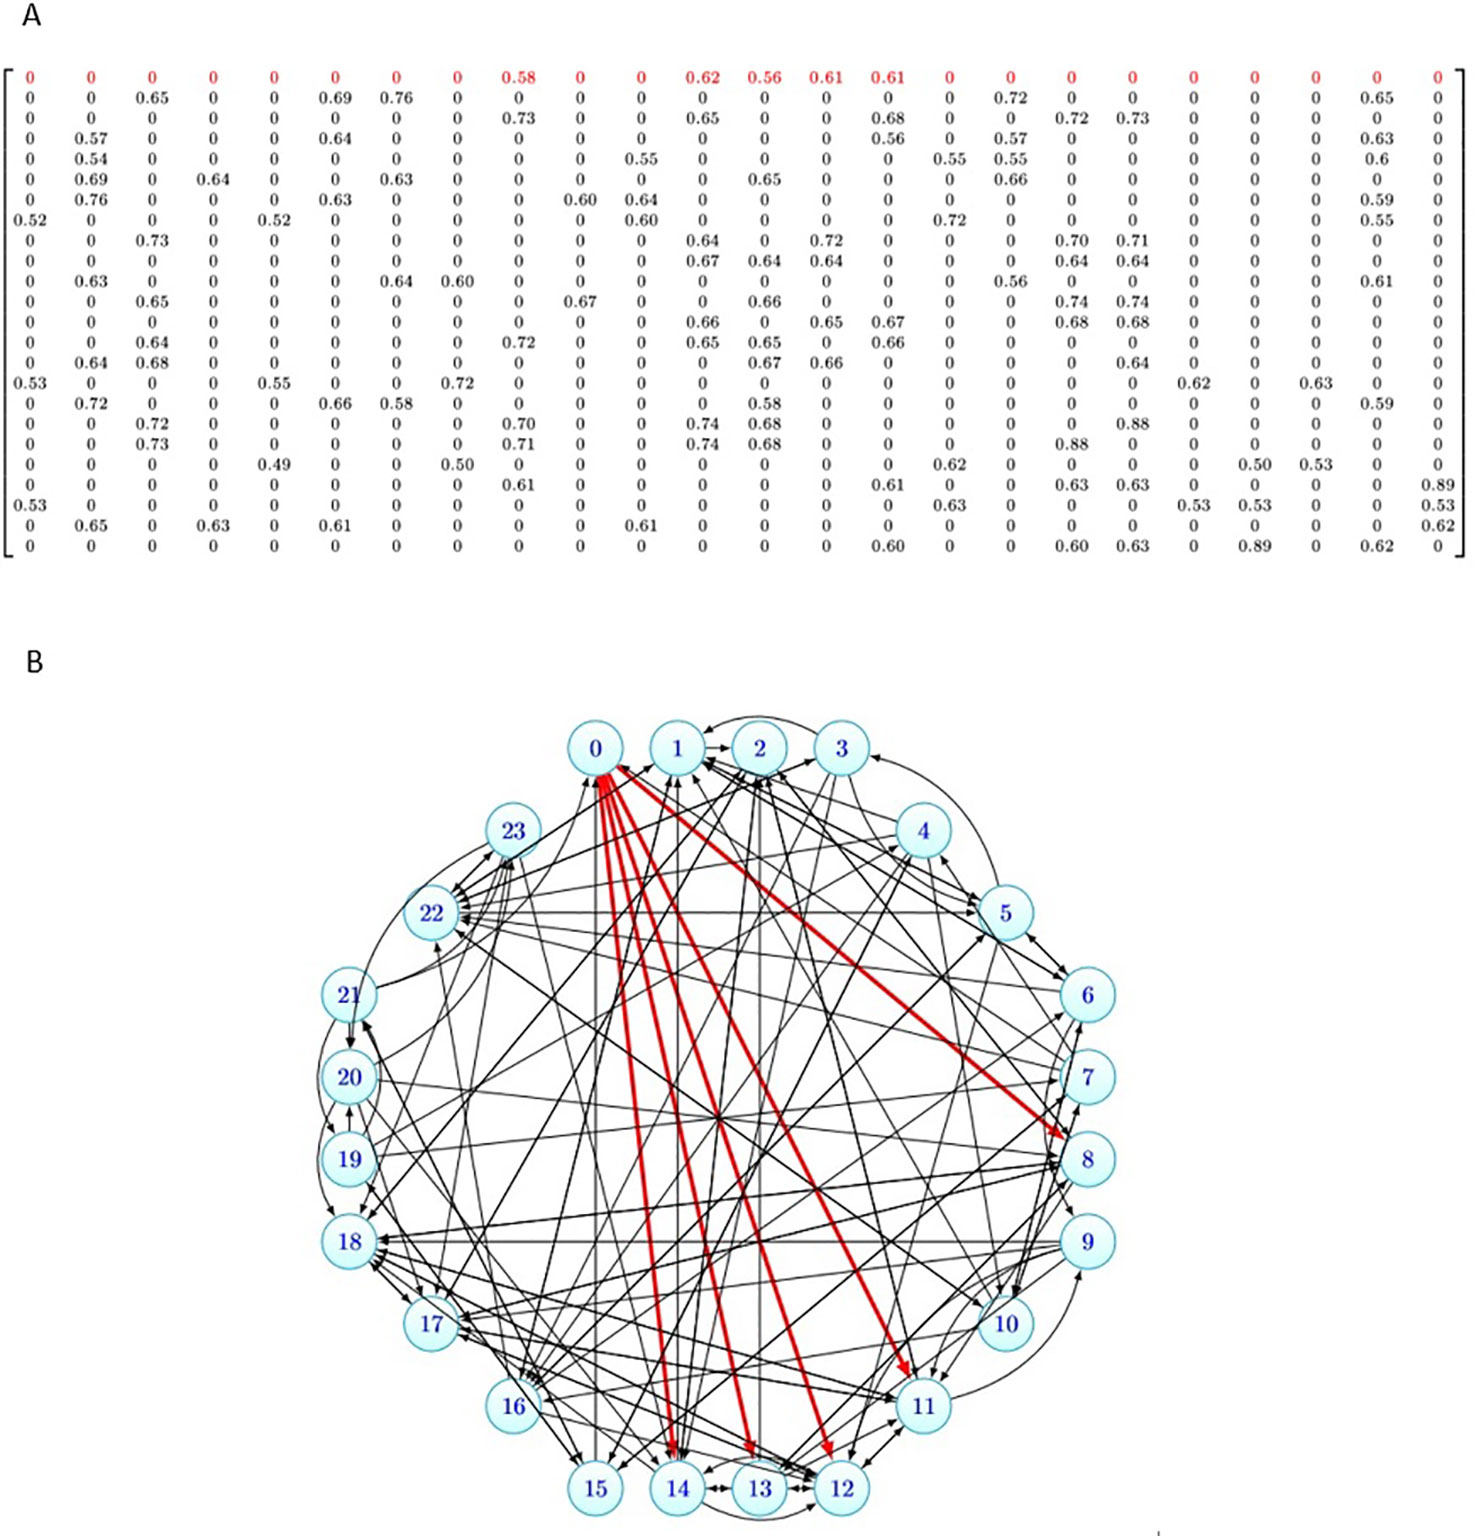
Figure 2 Data structure of the similarity matrix for 24 drugs in Cancer Cell Line Encyclopedia (CCLE) dataset. (A) The similarity matrix B24 × 24. (B) The graph corresponding to the similarity matrix B24 × 24.
To minimize the distance between feature vector corresponding to cell line i and vectors of its nearest neighbors in latent space, we minimize two objective functions in formulas 15, 16 as follows:
Where tr(.) is the trace of a matrix, , Ec and are two diagonal matrices and their diagonal elements are and , . Ed and are two diagonal matrices and their diagonal elements are and . α and β are two parameters for weighting the similarity between cell lines and drugs, respectively.
The values of two matrices A and B show the similarity of the cell lines to each other and the similarity of the drugs to each other, respectively. Using the calculation of Frobenius norm multiplied by the elements in A and B is because of we would like more similar cell lines (drugs), have closer latent vectors in the latent space. But, the parameters α and β determine the effectiveness of these two matrices A and B in the objective function. By these strategies and tuning the parameters α and β, we determine the impact of cell line similarity and drug similarity in DSPLMF method.
By plugging two equations 15, 16 into formula 12, we will have the following:
Finally, we upgrade the formula 17 as follows:
By this function, we try to predict the latent vectors of cell lines and drugs, where the similar cell lines or drugs have closer latent vectors to their KNNs.
For optimization the above function, the alternating gradient descent method was used. In each iteration of this algorithm, first U and are fixed to compute V and and then V and are fixed to compute U and . Besides, to accelerate the convergence, the AdaGrad algorithm was applied and the details of this algorithm are deposited in the Supplementary File 3 (Data Sheet 3). The objective function in formula 18 is denoted by Y and the partial gradients of biases and latent vectors are calculated as follow:
Once the latent matrices U and V and the biases and have been learned, the probability of sensitivity cell line i to drug j can be estimated by logistic function in formula 2. Since in our model, the importance of the positive observations and negative observations are the same, we set r = 1 in this logistic function.
When a new cell line is given, its information of IC50 of the drugs is unknown and SimIC50 matrix values cannot be calculated, while it must be calculated to predict the latent vectors of this new cell line. In this section, we introduced a classification model for predicting t-most nearest neighbors by using the similarity values between cell lines which are obtained from gene expression profile, copy number alteration and single-nucleotide mutation information. The purpose of this model is to find t-most nearest neighbors for the new cell line and then to estimate the latent vector for this new cell line based on average of latent vectors of its neighbors. After obtaining the latent vector, we can predict the IC50 values across all drugs for the new cell line. For training the model, 10-fold cross validation technique is used on cell line dataset, so the dataset was partitioned into 10 equal-sized subsets, nine subsets were used as the train set for learning this classification model. A single subset was used as the test set to predict the t-most nearest neighbors for each cell line of this set.
In this classification model, the amounts of SimIC50 matrix of train set were converted to 0 or 1. To do this, the values of each row of the matrix are sorted in descending order and then t-largest values are set to 1 and remaining values are set to 0. Among the methods available for classification, we chose “Decision Tree Classifier” method. It is one of the predictive modeling approaches that used tree models to predict the value of a target variable based on several input features. Where leaves represent class labels and branches denote conjunctions of features that lead to those class labels. Learned trees can be represented as sets of if-then rules. Decision tree classifier is a heuristic and nonbacktracking search through the space of all possible decision trees. The main idea of decision tree classification is recursively partition data into subgroups. The functionality of decision tree classification is as follows: Polat and Güneş (2007)
● Choosing an attribute and formulating a logical attribute test.
● Branching on each test result, transferring subset of examples (training information) to the appropriate child node to satisfy that result.
● Running each child’s node recursively.
● The end rule indicates when a leaf node is to be declared.
For decision tree classifier, the three features of train set, Simexp, Simcnv, and Simmut, are considered as input and 0 or 1 value of each pair (ci,cj) are considered as output and then as the classifier train. If the number of predicted nearest neighbors for a cell line was less than t, we considered them as nearest neighbors for this cell line. If this number was greater than t, t neighbors were selected randomly. Finally, ui was estimated as the average of latent vectors of neighbors of the new cell line ci.
When the latent vector of the new cell line is predicted, the probabilities that this cell line is sensitive to drugs are estimated. Eventually, a threshold on probabilities to assign sensitive or resistance class to each cell line-drug pair is applied. So if the predicted value is lower than this threshold for a cell line-drug pair, the resistance class is assigned to it; otherwise, it is labeled as a sensitive class.
We empirically evaluate our proposed approach and compare it against some of the state-of-the-art methods. This section first describe evaluation criteria and then demonstrate the performance of DSPLMF method.
To evaluation the performance of DSPLMF method, the 10-fold cross-validation Was performed and this process was repeated 30 times. The mean of following criteria was obtained in the 30 times and it was used as the final criteria to evaluate the predictive performance of the methods.
where TP or true positive prediction is the number of cell lines labeled with sensitivity and predicted as sensitivity. TN or true negative is the number of cell lines labeled with resistance and predicted as resistance. FP or false positive is the number of cell lines labeled with resistance and predicted as sensitivity. FN or false negative is the number of cell lines labeled with sensitivity and predicted as resistance.
In addition to the above metrics, we used area under the receiver operating characteristic curve (AUC), which is one of the most important evaluation metrics for checking the performance of any classification model. This metric was calculated for the methods.
To demonstrate the effectiveness of our method, we compared the predictive performance of the proposed model against the state-of-the-art-methods such as naive Bayes Barretina et al. (2012), SVM-RFE Dong et al. (2015), FSelector Soufan et al. (2015), CaDRReS Suphavilai et al. (2018), AutoBorutaRF Lu et al. (2019), and the AutoHidden method, which is constructed based on the hidden layer of the autoencoder in AutoBorutaRF method as features Lu et al. (2019).
All the methods mentioned above are classification models except the CaDRReS, since this method predicted IC50 values as output, a threshold was applied for its output. So if the value predicted for a cell line-drug pair is smaller than this threshold, the resistance class was assigned to it; otherwise, it was labeled with sensitive class. The median of the IC50 values was chosen as the best threshold for this algorithm. The results of the mentioned methods on two datasets GDSC and CCLE are shown in Tables 2 and 3, and the bold number represents the best result. The results of Table 2 show that the value of Accuracy criterion by DSPLMF has increased by 0.03 compared to the result of the best algorithm, AutoBorutaRF. Furthermore, the value of Recall, F1Score, MCC, and AUC criteria have increased by 0.10, 0.05, 0.06, and 0.05 compared to the best algorithm. Only in the case of the Specificity criterion, the naive Bayes method performs significantly better than the other methods. The reason is that this method has predicted zero class data for most of the data, and by looking at the result of other criteria, such as Accuracy, Recall, and F1Score for this method, we can see that this method does not predict sensitive class data very well. The results of Table 3 are the same as those in the previous table, except that the best result for the AUC criterion belongs to the AutoBorutaRF method, demonstrating the effectiveness of this method. The best result for the Specificity criterion belongs to the AutoHidden method; the low performance of other criteria indicates that this method is weak in predicting sensitive data. In general, the results of these two tables show that the DSPLMF significantly outperforms other methods. Thus, it is evident our method able to find much more useful features for drug response prediction rather than other methods. Overall, DSPLMF improvement on the GDSC dataset is stronger.
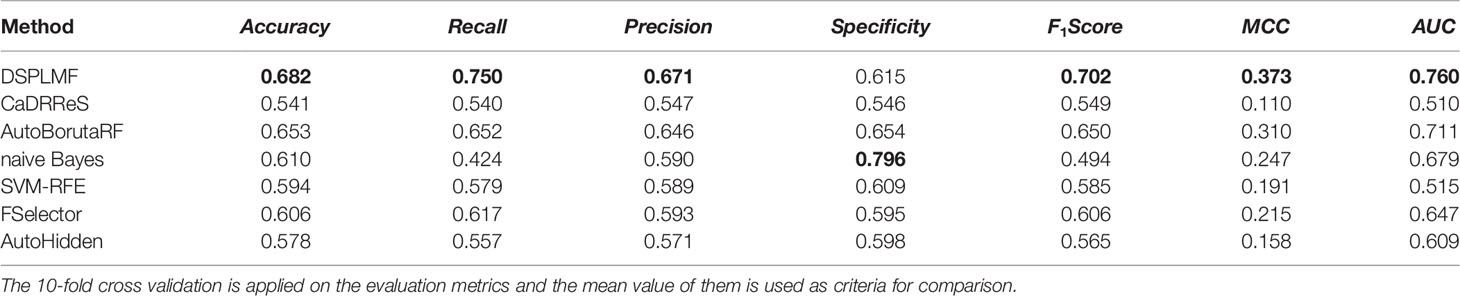
Table 2 Prediction performance of the different algorithms based on seven criteria on Genomics of Drug Sensitivity in Cancer (GDSC) dataset.

Table 3 Prediction performance of the different algorithms based on seven criteria on Cancer Cell Line Encyclopedia (CCLE) dataset.
To evaluate the improvement of the logistic matrix factorization method by applying the novel regularization approach, we compared the predictive performance of the DSPLMF model against the logistic matrix factorization method without the novel regularization approach. In this model, the classification method for predicting t-most nearest neighbors for each new cell line by using the similarity values between cell lines which are obtained from gene expression profile, copy number alteration and single-nucleotide mutation information, is not applied. The result of the above algorithm based on seven criteria on GDSC and CCLE datasets is calculated, and the 10-fold cross-validation is applied on the evaluation metrics, and the mean value of them is used as criteria for comparison. The results of Tables 2 and 4 show that the value of Accuracy criterion by DSPLMF on GDSC dataset has increased by 0.10 compared to the result of the logistic matrix factorization method without the novel regularization approach. Furthermore, the value of Recall, Precision, Specificity, F1Score, MCC, and AUC criteria have increased by 0.04, 0.10, 0.17, 0.07, 0.21, and 0.14 compared to this algorithm. The results of Tables 3 and 4 show that the value of Accuracy criterion by DSPLMF on CCLE dataset has increased by 0.10 compared to the result of the logistic matrix factorization method without the novel regularization approach. Furthermore, the value of Recall, Precision, Specificity, F1Score, MCC, and AUC criteria has increased by 0.05, 0.11, 0.10, 0.09, 0.16, and 0.10 compared to this algorithm. So, using of the classification method for predicting t-most nearest neighbors of each new cell line in logistic matrix factorization algorithm, will increase the performance by 10%.
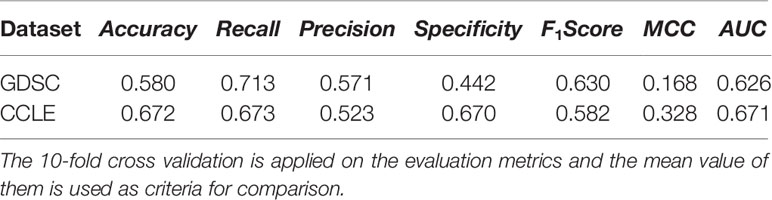
Table 4 Prediction performance of the logistic matrix factorization method without the novel regularization approach based on seven criteria on Cancer Cell Line Encyclopedia (CCLE) and Genomics of Drug Sensitivity in Cancer (GDSC) datasets.
The data in the GDSC dataset is related to different cancers. To demonstrate the performance of DSPLMF method on cancer tissue type, 73 hematopoietic cell lines and 98 drugs from GDSC dataset are considered. This specific type of cell lines are used to train the proposed model and predicted responses for the drugs based on this tissue type. Figure 3 shows the results of all mentioned criteria on these cell lines for the DSPLMF method using 30 times 10-fold cross-validation. The mean of these values are shown in Table 5. As the table shows, if the algorithm is specifically run on a particular type of cancer, it would be expected to yield better results than when considering different types of cancer. These results indicate that DSPLMF can also achieve consistent performance on a specific type of cancer.
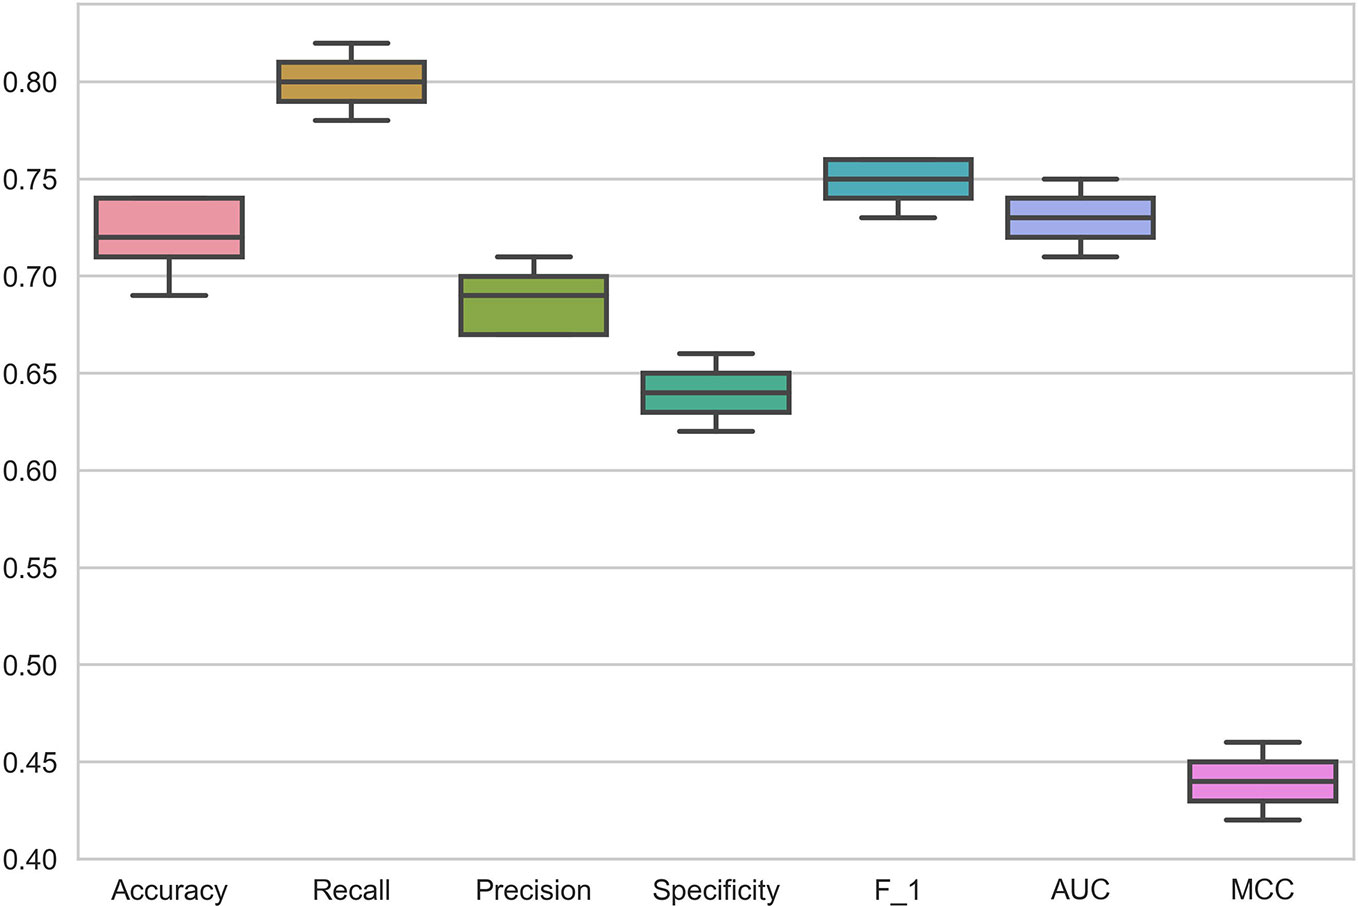
Figure 3 Box Plots of seven criteria on haematopoietic cell lines in Genomics of Drug Sensitivity in Cancer (GDSC) dataset to show the prediction performance of DSPLMF method.
Table 5 Prediction performance of DSPLMF method on haematopoietic cell lines based on seven criteria on Genomics of Drug Sensitivity in Cancer (GDSC) dataset.
For further evaluation and to demonstrate the performance of the proposed algorithm, the scatter plots of observed versus predicted responses values for four drugs in CCLE are illustrated in Figure 4. The values predicted by our model are probabilities that cell lines are sensitive to the drugs. For calculation correlation between predicted and observed responses values, the values in Formula 2 as the predicted IC50 values for cell line ci and drug dj were used. As the plots indicate, there is a high correlation between observed and predicted response values. The scatter plots of all 24 drugs in the CCLE dataset are illustrated in the Supplementary File 2 (Data Sheet 2: Figures S1–S4).

Figure 4 Correlations between observed and predicted activity areas using DSPLMF method for CCLE cell lines across four drugs. (A) shows the scatter plot of observed and predicted drug responses for Topotecan with 0.71 as Pearson Correlation. (B) shows the scatter plot of observed and predicted drug responses for 17-AAG with 0.60 as Pearson Correlation. (C) shows the scatter plot of observed and predicted drug responses for AZD6244 with 0.68 as Pearson Correlation. (D) shows the scatter plot of observed and predicted drug responses for PD-032590 with 0.79 as Pearson Correlation.
For tuning hyperparameters, GDSC dataset has been used, and the obtained hyperparameters are considered for both datasets. The 10-fold cross-validation procedure is applied on GDSC and hyperparameters are chosen empirically by maximizing the summing up of the Accuracy, Recall, Precision, Specificity, F1Score, and MCC criteria. For each set of hyperparameters, the whole 10-fold process is repeated 30 times and the average value of the above summing has been calculated. Since the search space of hyperparameters values is large, a grid-search procedure for choosing the hyperparameters was applied.
The dimension of latent space, L, was selected between 1 and 98, the number of drugs. The number of KNNs for building Nk(ci) in equation 13 and the number of t-nearest neighbors in prediction section, were selected from 1 to 50 by step 2. The impact factors of nearest neighbors α and β in equations 15 and 16 were picked from {2–5, 2–4,…, 22} and the variance controlling parameters, λc and λd, were chosen from{2–5, 2–4,…, 21}. The γ, λ, ϕ and ψ parameters represent the importance of each similarity measure between cell lines in formula 1 and were selected from 1 to 10. Threshold parameter applied on equation 2 for determining the label of the class for each new cell line ci, and was picked from 0.1 to 1 by step 0.1, and the best accuracy of the result is obtained by threshold=0.6.
In Table 6, the learned hyperparameters using GDSC dataset is shown. For both datasets, these tuned hyperparameters are used to design the model, except to L, that is calculated for CCLE dataset separately and for this dataset it is set as 23.
Table 6 Learned hyperparameters of DSPLMF method based on Genomics of Drug Sensitivity in Cancer (GDSC) dataset.
We used 555 cell lines from different cancerous tissue types in GDSC dataset. For representing the higher similarity between latent vectors of the cell lines from the same tissue type rather than the cell lines from different tissue types, the t-SNE plot for some tissue types of cancer cell lines is shown in Figure 5. Top five most frequent tissue types including, breast, central nervous system, hematopoietic and lymphoid tissue, COREAD, and lung cancer were considered. As it can be seen from Figure 5 (A), the embedded latent vectors of the cell lines with the same tissue type are located closer than the cell lines with diverse tissue types. This suggests that the proposed method assigned more similar latent vector to cell lines with the same tissue type. In the following, we consider an example of some latent vectors and the similarities between them: Let v1, v2 and v3 are three latent vectors obtained DSPLMF method of length 95 corresponding to Breast cancer cell line BT − 20, Breast cancer cell line BT − 549 and hematopoietic cancer cell line CA46, respectively. v1 = [0.01, 0.23, −0.14,…, 0.12]1x95, v2 = [0.17,0.67, −0.1,…,0.34]1x95 and v3 = [0.89, −0.9, 0.55,…, −0.17]1x95. Similarity (v1,v2) = 0.78, Similarity (v1,v2) = 0.13 and Similarity(v2,v3) = 0.04. As the results show, two vectors belonging to the same tissue types are more similar than two vectors that belong to two different tissue types. Also, in the t-SNE plot, these two vectors belonging to the same tissue types are closer than two vectors that belong to two different tissue types.
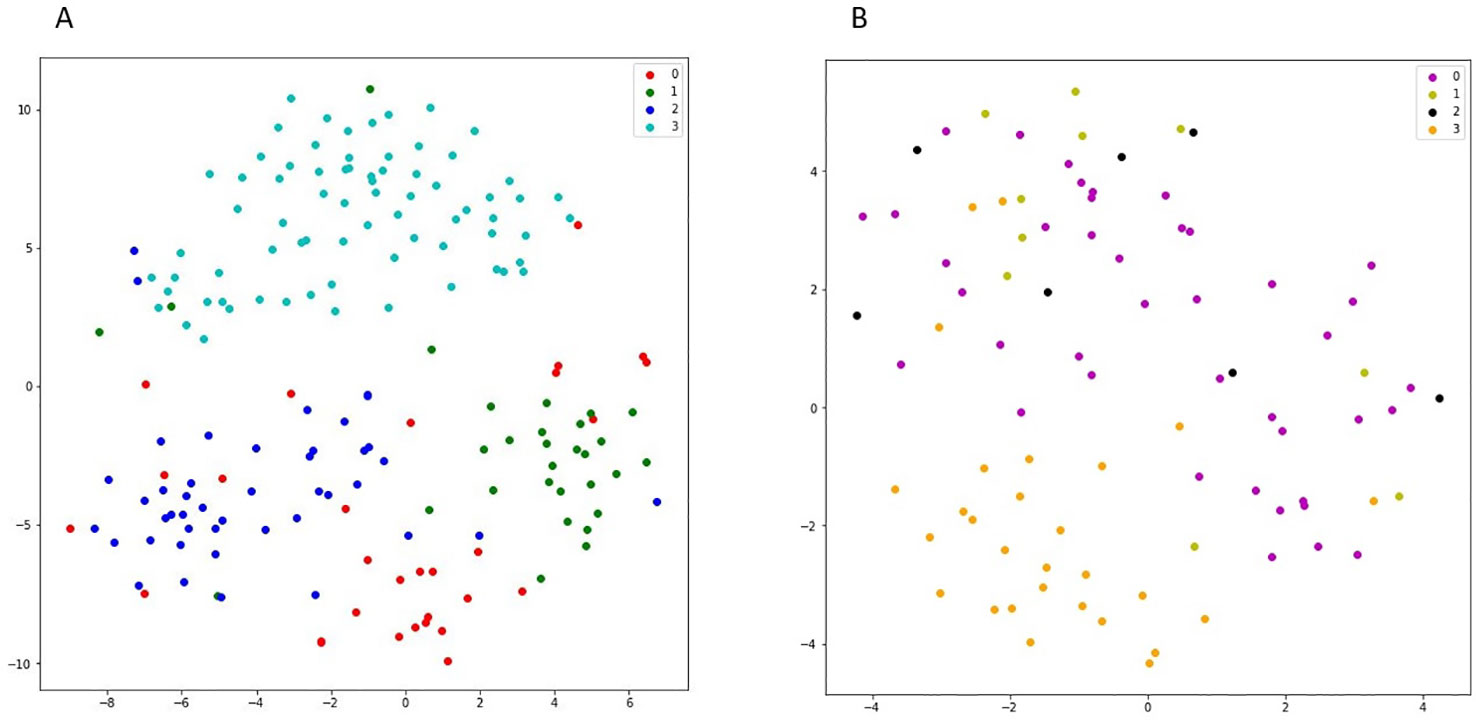
Figure 5 (A) shows the t-SNE plot of latent space corresponding to four different cancer subtypes in GDSC dataset. In this figure, red points show the latent vectors of breast cancer and green, dark blue, and light blue points show the latent vectors of COREAD, central nervous system, and haematopoietic and lymphiod tissue, respectively. (B) shows the t-SNE plot of latent space corresponding to different lung cancer subtypes in Genomics of Drug Sensitivity in Cancer (GDSC) dataset. In this figure, purple points show the latent vectors of adenocarcinoma and light green, black and orange points show the latent vectors of large cell, squamous cell, and small cell carcinoma, respectively.
In Figure 5B, the latent vectors of different subtypes of lung cancer were considered. These different subtypes are: adenocarcinoma, large cell, squamous cell, and small cell carcinoma. In this figure, the closeness of vectors corresponding to cell line of the same subtype in this cancer justifies the efficiency of obtained latent vectors.
For inferring drug-pathway associations, the heatmap of Pearson correlation between predicted drug responses and pathway activity scores similar to Suphavilai et al. (2018) is used. We considered 50 Biocarta pathway gene sets from MSigDB Liberzon et al. (2011), and pathway activity scores for CCLE cell lines were calculated as follows:
Let PW is a pathway and G(PW) = {g1,g2,…, gr} is the set of genes corresponding to pathway PW. Let fold-change value of gi in cell line cj is xij, which is obtained by:
Pathway activity score of pathway PW for cell line cj, PASj(PW) was calculated by formula 22.
Pathway activity score of PW for all cell line, PAS(PW), are considered as the vector PAS(PW) = [PAS1(PW), PAS2(PW),…, PASn(PW)], where n is the numbers of cell lines. Also, the predicted drug responses by DSPLMF for each drug were considered as the vector IC50predicted = [IC1, IC2,…,ICn].
Then, the association between drug dj and pathway PW is computed by the Pearson correlation between IC50predicted for drug dj and PAS(PW). A positive correlation indicates that a pathway plays a role in drug resistance and negative correlation demonstrated that a pathway is important in drug sensitivity. The result of the Pearson correlation of 30 pathway gene sets and 24 drugs of CCLE dataset is shown in Figure 6 and the result of 20 other pathways is represented in the Supplementary File 1 (Data Sheet 1). In this figure, the blue is represented the assistance and the red is represented the resistance case. Below, we investigated several instances that indicates consistency between the result of calculated Pearson correlation and previous studies and researches.
● The activation score of the HDAC (Histone deacetylases) pathway is negatively correlated (assistant association) with predicted IC50 value of some drugs such as Panobinostat. These observations were consistent with two studies, showing that the Panobinostat can inactive HDAC pathway De Marinis et al. (2013); Yee and Raje (2018).
● We observed the RELA (Acetylation and Deacetylation of RelA in The Nucleus) pathway had an assistant association with the 17-AAG (HSP90 inhibitor) drug. The RELA gene is one member of the NF-kB family and two important roles of the RELA are the transcriptional regulation and NF-kB signed transduction. Since the 17-AAG drug affects the NF-kB activity, it also affects the RELA gene and RELA pathway Thangjam et al. (2014).
● The activation score of the EGFR − SMRTE pathway was negatively correlated with predicted IC50 value of four EGFR inhibitors drugs, namely, Lapatinib, Erlotinib, Vandetanib, and AZD0530. These observations matched the previous study that denoted the amplification of the EGFR gene is correlated with a high response to EGFR inhibitors Normanno et al. (2006). Moreover, the predicted IC50 values of the Crizotinib (ALK-inhibitor) were positively correlated with the activity score of this pathway and this issue was confirmed in the previous studies Sasaki et al. (2011).
● The MTA3 (Downregulated of MTA-3 in ER-negative Breast Tumors) pathway was associated (positively correlated) with two predicted IC50 vectors belong to L-685458(gamma-secretase) and PD-0332991(CDK4/6) drugs. Therefore, the cell lines with inactivated MTA3 pathway tend to sensitive to these two drugs Suphavilai et al. (2018).
● The VEGF-Hypoxia-Angiogenesis (VEGF) pathway was assistance associated with two RAF inhibitors drugs, namely, PLX4720 and RAF265 drugs that were verified in the previous researches. One of these studies considered inducing the VEGF expression by Raf promotes angiogenesis and blocking RAF/MEK/ERK pathway by RAF inhibitors McCubrey et al. (2007). Moreover, the activity score of the VEGF pathway was negatively correlated with Sorafenib drug Liu et al. (2006).
● The activity score of the mTOR Signaling Pathway that is a central regulator of metabolism and physiology was negatively correlated with predicted Ic50 vector of some drugs such as Panobinostat. Various preclinical studies have been performed to combine panobinostat with several drugs as mTOR inhibitor Singh et al. (2016).
● It has been shown that c-met inhibitor drugs such as PHA-665752 and Crizotinib can inhibit WNT pathway activity in tumour cells. We observed the activity score of this pathway was negatively correlated with predicted IC50 vectors of these drugs Tuynman et al. (2008); Zhang et al. (2018).
● The assistant association was observed between L − 685458 drug and IGF-1 MTOR pathways. These observations were also reported by Shih et al Shih and Wang (2007).
● We observed that the MEK inhibitors such as AZD6244 and PD − 0325901 were positively correlated with activity scores for the EIF2 pathway. Therefore, as mentioned in the previous researches, the cell lines with inactivated EIF2 p athway were sensitive to these drugs Quevedo et al. (2000); Liberzon et al. (2011).

Figure 6 Drug-pathway association based on Cancer Cell Line Encyclopedia (CCLE) dataset. For visualization, 30 Biocarta pathways across 24 drugs were selected. Negative and positive correlations between pathway activity and drug sensitivity scores are denoted as being “assistant” and “resistant” associations, respectively. The blue color is represented the assistance and the red color is represented the resistance.
In this work, we introduce a novel method for cancer drug sensitivity prediction based on a recommender system approach. A logistic matrix factorization is applied to predict the extent to which a cell line is sensitive to a drug. The advantage of this method is to obtain latent features of cell lines and drugs for better prediction performance. Since the similarity information of cell lines and drugs can improve higher predictive power, some information such as gene expression profile, copy number alteration and single-nucleotide mutation data for cell lines and Chemical structures of drugs are used.
To demonstrate the validity of DSPLMF method for identifying drug response 10-fold cross validation on CCLE and GDSC datasets are performed. The comparison of DSPLMF with six other the state-of-the-art prediction methods showed that DSPLMF outperformed other methods. The results indicated that the proposed method was able to uncover much more effective features than the other methods for drug response prediction.
The source code of proposed method and Datasets folder for GDSC and CCLE datasets as input data are available in https://github.com/emdadi/DSPLMF and Supplementary File 4 (Data Sheet 4).
AE designed the algorithm, performed the experiments, and wrote the main manuscript text and the programming codes. CE conducted the experiments and analyzed the results. All authors reviewed the manuscript.
The authors declare that the research was conducted in the absence of any commercial or financial relationships that could be construed as a potential conflict of interest.
The Supplementary Material for this article can be found online at: https://www.frontiersin.org/articles/10.3389/fgene.2020.00075/full#supplementary-material
Supplementary File 1 (Data Sheet 1) | Results of drug pathway association on CCLE dataset.
Supplementary File 2 (Figures S1–S4) | The scatter plots of all 24 drugs in the CCLE dataset.
Supplementary File 3 (Data Sheet 3) | AdaGrad Algorithm.
Supplementary File 4 (Data Sheet 4) | Implementation Codes.
Barretina, J., Caponigro, G., Stransky, N., Venkatesan, K., Margolin, A. A., Kim, S., et al. (2012). The cancer cell line encyclopedia enables predictive modelling of anticancer drug sensitivity. Nature 483, 603. doi: 10.1038/nature11003
Costello, J. C., Heiser, L. M., Georgii, E., Gönen, M., Menden, M. P., Wang, N. J., et al. (2014). A community effort to assess and improve drug sensitivity prediction algorithms. Nat. Biotechnol. 32, 1202. doi: 10.1038/nbt.2877
De Marinis, F., Atmaca, A., Tiseo, M., Giuffreda, L., Rossi, A., Gebbia, V., et al. (2013). A phase ii study of the histone deacetylase inhibitor panobinostat (lbh589) in pretreated patients with small-cell lung cancer. J. Thoracic. Oncol. 8, 1091–1094. doi: 10.1097/JTO.0b013e318293d88c
Hand, D., Kok, J. N., Berthold, M. R. (1999). Advances in Intelligent Data Analysis: Third International Symposium, IDA-99 Amsterdam, The Netherlands, August 9-11, 1999 Proceedings (Verlag Berlin Heidelberg:Springer Science & Business Media).
Kursa, M. B., Rudnicki, W. R.. (2010). Feature selection with the boruta package. J. Stat. Softw. 36, 1–13. doi: 10.18637/jss.v036.i11
Li, B., Shin, H., Gulbekyan, G., Pustovalova, O., Nikolsky, Y., Hope, A., et al. (2015). Development of a drug-response modeling framework to identify cell line derived translational biomarkers that can predict treatment outcome to erlotinib or sorafenib. PloS One 10, e0130700. doi: 10.1371/journal.pone.0130700
Liberzon, A., Subramanian, A., Pinchback, R., Thorvaldsdóttir, H., Tamayo, P., Mesirov, J. P. (2011). Molecular signatures database (msigdb) 3.0. Bioinformatics 27, 1739–1740. doi: 10.1093/bioinformatics/btr260
Liu, H., Zhao, Y., Zhang, L., Chen, X. (2018). Anti-cancer drug response prediction using neighbor-based collaborative filtering with global effect removal. Mol. Therapy-Nucleic Acids 13, 303–311. doi: 10.1016/j.omtn.2018.09.011
Liu, L., Cao, Y., Chen, C., Zhang, X., McNabola, A., Wilkie, D., et al. (2006). Sorafenib blocks the raf/mek/erk pathway, inhibits tumor angiogenesis, and induces tumor cell apoptosis in hepatocellular carcinoma model plc/prf/5. Cancer Res. 66, 11851–11858. doi: 10.1158/0008-5472.CAN-06-1377
Lu, X., Gu, H., Wang, Y., Wang, J., Qin, P. (2019). Autoencoder based feature selection method for classification of anticancer drug response. Front. In Genet. 10, 233. doi: 10.3389/fgene.2019.00233
McCubrey, J. A., Steelman, L. S., Chappell, W. H., Abrams, S. L., Wong, E. W., Chang, F., et al. (2007). Roles of the raf/mek/erk pathway in cell growth, malignant transformation and drug resistance. Biochim. Biophys. Acta (BBA)-Mol. Cell Res. 1773, 1263–1284. doi: 10.1016/j.bbamcr.2006.10.001
Normanno, N., De Luca, A., Bianco, C., Strizzi, L., Mancino, M., Maiello, M. R., et al. (2006). Epidermal growth factor receptor (egfr) signaling in cancer. Gene 366, 2–16. doi: 10.1016/j.gene.2005.10.018
Polat, K., Güneş, S. (2007). Classification of epileptiform eeg using a hybrid system based on decision tree classifier and fast fourier transform. Appl. Math. Comput. 187, 1017–1026. doi: 10.1016/j.amc.2006.09.022
Quevedo, C., Alcázar, A., Salinas, M. (2000). Two different signal transduction pathways are implicated in the regulation of initiation factor 2b activity in insulin-like growth factor-1-stimulated neuronal cells. J. Biol. Chem. 275, 19192–19197. doi: 10.1074/jbc.M000238200
Sasaki, T., Koivunen, J., Ogino, A., Yanagita, M., Nikiforow, S., Zheng, W., et al. (2011). A novel alk secondary mutation and egfr signaling cause resistance to alk kinase inhibitors. Cancer Res. 71, 6051–6060. doi: 10.1158/0008-5472.CAN-11-1340
Shih, I.-M., Wang, T.-L. (2007). Notch signaling, γ-secretase inhibitors, and cancer therapy. Cancer Res. 67, 1879–1882. doi: 10.1158/0008-5472.CAN-06-3958
Singh, A., Patel, V. K., Jain, D. K., Patel, P., Rajak, H. (2016). Panobinostat as pan-deacetylase inhibitor for the treatment of pancreatic cancer: recent progress and future prospects. Oncol. Ther. 4, 73–89. doi: 10.1007/s40487-016-0023-1
Smirnov, P., Safikhani, Z., El-Hachem, N., Wang, D., She, A., Olsen, C., et al. (2015). Pharmacogx: an r package for analysis of large pharmacogenomic datasets. Bioinformatics 32, 1244–1246. doi: 10.1093/bioinformatics/btv723
Soufan, O., Kleftogiannis, D., Kalnis, P., Bajic, V. B. (2015). Dwfs: a wrapper feature selection tool based on a parallel genetic algorithm. PloS One 10, e0117988. doi: 10.1371/journal.pone.0117988
Suphavilai, C., Bertrand, D., Nagarajan, N. (2018). Predicting cancer drug response using a recommender system. Bioinformatics 34, 3907–3914. doi: 10.1093/bioinformatics/bty452
Thangjam, G. S., Dimitropoulou, C., Joshi, A. D., Barabutis, N., Shaw, M. C., Kovalenkov, Y., et al. (2014). Novel mechanism of attenuation of lps-induced nf-κb activation by the heat shock protein 90 inhibitor, 17-n-allylamino-17-demethoxygeldanamycin, in human lung microvascular endothelial cells. Am. J. Respiratory Cell Mol. Biol. 50, 942–952. doi: 10.1165/rcmb.2013-0214OC
Tuynman, J. B., Vermeulen, L., Boon, E. M., Kemper, K., Zwinderman, A. H., Peppelenbosch, M. P., et al. (2008). Cyclooxygenase-2 inhibition inhibits c-met kinase activity and wnt activity in colon cancer. Cancer Res. 68, 1213–1220. doi: 10.1158/0008-5472.CAN-07-5172
Yang, W., Soares, J., Greninger, P., Edelman, E. J., Lightfoot, H., Forbes, S., et al. (2012). Genomics of drug sensitivity in cancer (gdsc): a resource for therapeutic biomarker discovery in cancer cells. Nucleic Acids Res. 41, D955–D961. doi: 10.1093/nar/gks1111
Yee, A. J., Raje, N. S. (2018). Panobinostat and multiple myeloma in 2018. Oncol. 23, 516–517. doi: 10.1634/theoncologist.2017-0644
Keywords: cancer, drug response, recommender system, matrix factorization, personalized treatment
Citation: Emdadi A and Eslahchi C (2020) DSPLMF: A Method for Cancer Drug Sensitivity Prediction Using a Novel Regularization Approach in Logistic Matrix Factorization. Front. Genet. 11:75. doi: 10.3389/fgene.2020.00075
Received: 11 November 2019; Accepted: 23 January 2020;
Published: 27 February 2020.
Edited by:
Quan Zou, University of Electronic Science and Technology of China, ChinaCopyright © 2020 Emdadi and Eslahchi. This is an open-access article distributed under the terms of the Creative Commons Attribution License (CC BY). The use, distribution or reproduction in other forums is permitted, provided the original author(s) and the copyright owner(s) are credited and that the original publication in this journal is cited, in accordance with accepted academic practice. No use, distribution or reproduction is permitted which does not comply with these terms.
*Correspondence: Changiz Eslahchi, Q2gtRXNsYWhjaGlAc2J1LmFjLmly
Disclaimer: All claims expressed in this article are solely those of the authors and do not necessarily represent those of their affiliated organizations, or those of the publisher, the editors and the reviewers. Any product that may be evaluated in this article or claim that may be made by its manufacturer is not guaranteed or endorsed by the publisher.
Research integrity at Frontiers
Learn more about the work of our research integrity team to safeguard the quality of each article we publish.