 Chaoyang Li
 Yunlin Zhao1
 Zhenggang Xu
 Guiyan Yang
 Jiao Peng
94% of researchers rate our articles as excellent or good
Learn more about the work of our research integrity team to safeguard the quality of each article we publish.
Find out more
ORIGINAL RESEARCH article
Front. Genet. , 20 February 2020
Sec. Evolutionary and Population Genetics
Volume 11 - 2020 | https://doi.org/10.3389/fgene.2020.00073
This article is part of the Research Topic Bioinformatics of Genome Regulation and Systems Biology View all 21 articles
Lack of complete genomic information concerning Vicia sepium (Fabaceae: Fabeae) precludes investigations of evolution and populational diversity of this perennial high-protein forage plant suitable for cultivation in extreme conditions. Here, we present the complete and annotated chloroplast genome of this important wild resource plant. V. sepium chloroplast genome includes 76 protein-coding genes, 29 tRNA genes, 4 rRNA genes, and 1 pseudogene. Its 124,095 bp sequence has a loss of one inverted repeat (IR). The GC content of the whole genome, the protein-coding, intron, tRNA, rRNA, and intergenic spacer regions was 35.0%, 36.7%, 34.6%, 52.3%, 54.2%, and 29.2%, respectively. Comparative analyses with plastids from related genera belonging to Fabeae demonstrated that the greatest variation in the V. sepium genome length occurred in protein-coding regions. In these regions, some genes and introns were lost or gained; for example, ycf4, clpP intron, and rpl16 intron deletions and rpl20 and ORF292 insertions were observed. Twelve highly divergent regions, 66 simple sequence repeats (SSRs) and 27 repeat sequences were also found in these regions. Detailed evolutionary rate analysis of protein-coding genes showed that Vicia species exhibit additional interesting characteristics including positive selection of ccsA, clpP, rpl32, rpl33, rpoC1, rps15, rps2, rps4, and rps7, and the evolutionary rates of atpA, accD, and rps2 in Vicia are significantly accelerated. These genes are important candidate genes for understanding the evolutionary strategies of Vicia and other genera in Fabeae. The phylogenetic analysis showed that Vicia and Lens are included in the same clade and that Vicia is paraphyletic. These results provide evidence regarding the evolutionary history of the chloroplast genome.
Complete chloroplast sequences are indispensable for analyzing genome evolution and phylogenetics (Sabir et al., 2014; Moner et al., 2018). These sequences offer two advantages over genomic ones, namely, a high degree of conservation and a relatively compact gene alignment, resulting from symbiotic horizontal transfer (Timmis et al., 2004). In angiosperms, the chloroplast is a uniparentally inherited organelle. It originated from a cyanobacterium-like organism through an endosymbiosis event. Compared to the nuclear genome, chloroplast genomes, with a quadripartite circular structure, exhibit highly conserved sizes, structures and gene contents across photosynthetic plants (Wicke et al., 2011). Nuclear genomes are highly complex because of the high frequency of the loss and gain of genetic material at any time (Wolfe et al., 1987), making the identification of orthologous genes difficult. Evolutionary and phylogenetic analyses based on complete chloroplast sequences can provide more valuable information of a higher quality than that obtained by analysis of one or more gene loci (Martin et al., 2005). Complete chloroplast sequence datasets contain all site patterns (or all genes) for the reconstruction of evolutionary history. The comparison of complete genomes can reduce the sampling error inherent in analyses of only one or a few genes. That is not to say that we oppose the use of one or a few genes in evolutionary studies, but we instead suggest the investigation of conflicts between complete chloroplast genomes and analyses of one or a few genes that may indicate crucial evolutionary events. Another advantage of the chloroplast genome is that it contributes to structural diversity at low taxonomic levels and among basal lineages. Although genome organization is relatively well conserved in angiosperms, several types of structural diversity have been found. This structural diversity, including the loss of one copy of IRs, gene and intron gains or losses, large inversions, expansions, contractions and localized hypermutable phenomena, provides a powerful tool for evaluating genomic evolutionary history. For example, the loss of one IR is observed in the inverted-repeat-lacking clade (IRLC) (Sabir et al., 2014); the loss of accD, psaI, ycf4, rpl33, clpP, and rps16 resulting in gene function loss is observed in various legume lineages; a 36-kb inversion is observed in the Genistoid clade; a 39-kb inversion is observed in Robinia (Keller et al., 2017); and hypermutation of ycf4 is observed in Lathyrus (Magee et al., 2010). With the development of high-throughput sequencing, more than 800 complete chloroplast genomes have been made available in the National Center for Biotechnology Information (NCBI) database (Asaf et al., 2017a).
The Fabaceae family, especially the Papilionoideae subfamily, is considered a model system for understanding the mechanisms of chloroplast genome evolution due to the presence of major genome rearrangements in this group such as loss of one IR, gene and intron gains and losses, large inversions, expansions, contractions and localized hypermutable regions (Sabir et al., 2014; Keller et al., 2017). However, the mechanisms of these chloroplast genome rearrangements are not known (Sveinsson and Cronk, 2016). Some scholars believe that these genome rearrangements within the Fabaceae chloroplast genomes may be derived from the loss of one copy of IRs; however, Medicago and Cicer species, which exhibit the typical conserved quadripartite structure found in angiosperms (Jansen et al., 2005), also present extensive chloroplast genome rearrangements (Jansen et al., 2008; Sveinsson and Cronk, 2016). Therefore, further in-depth research on the mechanisms of chloroplast genome evolution is needed.
Previous research on Fabaceae chloroplast genomes demonstrated that the deletion or addition of genes and introns, inversions, repeats, and nucleotide variability can result in significant changes in genome length, GC content, and gene composition and orientation (Lei et al., 2016; Yin et al., 2017; Wang et al., 2018). In these genomes, coding regions are better conserved than intergenic spacer (IGS) regions (Sabir et al., 2014; Asaf et al., 2017b; Yin et al., 2018). However, it is unclear whether a consistent pattern in the genomic variation can be observed in species of the tribe Fabeae, which belong to Fabaceae. A possible explanation for these results may be the lack of complete genomic information for Fabeae. To date, 21 complete Fabeae chloroplast genomes have been sequenced (including 18 in the last four years), mainly from the genus Lathyrus (13) and a few from the genera Lens (1), Pisum (4) and Vicia (3). Another possible explanation is the structural diversity among Papilionoideae (Jansen et al., 2008; Sabir et al., 2014; Sveinsson and Cronk, 2016). For example, even within the same genus, the Trifolium subterraneum (Fabaceae) chloroplast genome exhibits 14-18 inversions, while there are only 3 inversions in Trifolium grandiflorum and Trifolium aureum (Sabir et al., 2014). Therefore, the study of the genomic variation and phylogeny of Fabeae species can provide a basis for understanding chloroplast genome evolution.
Vicia sepium (Bush vetch), belonging to the tribe Fabeae, is an important wild resource plant with a wide distribution area (Maxted, 1995), various flowering periods from May to November, abundant proteins, and suitability for cultivation in extreme cold and dry conditions (Maršalkienė, 2016) and can be used as a good potential perennial forage. Additionally, compared with other legumes, V. sepium provides herbage for a long period because of its perennial habit (Maršalkienė, 2016). This plant also produces extrafloral nectaries to attract ants, which act as plant defenders by preying on arthropod herbivores or interrupting their oviposition or feeding (Lenoir and Pihlgren, 2006). However, previous studies on V. sepium have mainly focused on the morphological characteristics (Maršalkienė, 2016) and classification (Schaefer et al., 2012; Jaaska, 2015) of this plant and the relationship between plants and insects (Kruess and Tscharntke, 2000; Lenoir and Pihlgren, 2006). Therefore, little is known regarding the nutrient content, genetic resources, and forage value of this species. As a result, no plant materials of V. sepium have been released for commercial production. However, another Vicia species, Vicia sativa, has been widely used as forage and for hay and silage production. A key difficulty in the use of V. sativa is the presence of a neurotoxic compound in its seeds (Huang et al., 2017). Therefore, the expansion of forage resources based on Vicia species is necessary.
Another difficulty in the utilization of V. sepium is that the taxonomy of some taxa in Fabeae remains controversial (Schaefer et al., 2012; Jaaska, 2015; Iberite et al., 2017) because of the high morphological variability among species. Notably, some variation in morphological characteristics is genetically fixed. For example, Iberite’s cultivation tests (Iberite et al., 2017) conducted in V. sativa, Vicia barbazitae, Vicia grandiflora and V. sepium showed that the characteristics of the leaf margins are maintained through successive generations. Recent molecular phylogenetic studies have focused on multitribe legumes or tribe level analyses of Fabeae (Schaefer et al., 2012). These studies have suggested that the taxonomy of some genera in Fabeae is not monophyletic. However, these phylogenetic studies did not use the complete chloroplast genome, instead using plastid DNA sequence data, such as the matK, trnL, rbcL, and nuclear ribosomal internal transcribed spacer (ITS) sequences. Therefore, it is necessary to acquire comprehensive knowledge regarding the organization and evolution of V. sepium.
Here, we present a new complete chloroplast genome of V. sepium, from the genus Vicia. We compare it with chloroplast genomes from related genera (Lens, Pisum, Lathyrus) belonging to tribe Fabeae. The aim of this work is to reveal the genome variation and phylogeny of Fabeae and the genus Vicia and to provide evidence regarding the history of chloroplast genome evolution.
The sample was collected from the Dongting Lake region (28°48′46.06″N, 112°21′10.19″E) and stored at the Hunan Research Center of Engineering Technology for Utilization of Environmental and Resources Plant, China, under accession number 20170707JJ. Plant sampling was performed in areas that were not privately owned or protected in any way, and no specific permits were required for this study. We collected mature V. sepium leaves and placed them in a liquid nitrogen container. Leaf samples were stored at -80°C until sequencing. Extraction of total chloroplast DNA was carried out with the Plant Chloroplast Purification Kit and Column Plant DNA Extraction Kit (Beijing Baiaolaibo Technology, Co., Ltd., China). The chloroplast DNA of V. sepium was fragmented using a Covaris M220 (Covaris, USA) instrument. Whole-genome sequencing and paired-end (PE) library construction were performed according to the method described by Zhang et al. (2017). Raw data were obtained through next-generation sequencing with PE 150-bp reads. Then, N-containing sequences and adapter sequences were removed. Sequences with a Q value less than 20 or an average four-base mass of less than 20 were also removed. Finally, if the length of the reads was less than 50 nt, the reads were removed. All the above filtering steps were performed using Trimmomatic v 0.32 (Bolger et al., 2014), and clean data for subsequent analysis were obtained. Then, all high-quality paired reads were assembled into contigs by using SOAPdenovo2 (Luo et al., 2012) and scaffolded by using SSPACE (Boetzer et al., 2011) to obtain the whole-genome sequence. In this process, different K-mers were selected first for assembly, and the best K-mer, k=25, was chosen to obtain the assemblies. The above K parameter was determined on the basis of a K-mer curve and experience. Finally, one contig of 124,095 bp was obtained.
Our previous study used the programs CpGAVAS (Liu et al., 2012) and DOGMA (Wyman et al., 2004) to annotate the complete chloroplast genome of V. sepium (Li et al., 2018). In this study, to study genomic evolution between V. sepium and its related species in Fabeae, the same V. sepium genome was annotated in Plann (Huang and Cronk, 2015) against the V. sativa genome (NC027155). Gene mapping and relative synonymous codon usage (RSCU) were performed in OGDRAW v1.2 (Lohse et al., 2013) and DAMBE6 (Xia, 2017) according to Dong’s method (Dong et al., 2019).
We detected SSRs by referring to the method of Lei et al. (2016) using the MISA Perl Script (Thiel et al., 2003) with parameter settings of 8 for mono-, 4 for di- and tri-, and 3 for tetra-, penta- and hexa-nucleotide SSRs. Forward, palindromic, reverse, and complement sequences were identified as described by Cauz-Santos et al. (2017) using REPuter (Kurtz et al., 2001) with 90% or greater sequence identity and a length of 30 bp or longer. Tandem repeats were identified using Tandem Repeats Finder version 4.09 (Benson, 1999) with default parameters.
Blast ring image generator (BRIG) (Alikhan et al., 2011) and mVISTA (Frazer et al., 2004) software were used to compare the complete chloroplast genome variation in all available Fabeae chloroplast genomes using V. sepium annotation as a reference. BRIG focus on protein coding segment variation and mVISTA align whole chloroplast genome without discrimination. All the species were included the following twenty-one Fabeae species and one Cicereae species (Cicer arietinum), listed with the corresponding GenBank accession numbers: V. sepium, V. sativa (NC027155), V. faba (KF042344), Pisum abyssinicum (NC037830), Pisum sativum (NC014057), Pisum sativum subsp. Elatius (NC039371), Pisum fulvum (NC036828), Lens culinaris (NC027152), Lathyrus pubescens (NC027079), Lathyrus venosus (NC027080), Lathyrus palustris (NC027078), Lathyrus japonicus (NC027075), Lathyrus ochroleucus (NC027077), Lathyrus davidii (NC027073), Lathyrus littoralis (NC027076), Lathyrus inconspicuus (NC027149), Lathyrus graminifolius (NC027074), Lathyrus tingitanus (NC027151), Lathyrus clymenum (NC027148), Lathyrus sativus (NC014063), Lathyrus odoratus (NC027150), and C. arietinum (NC011163). Genome rearrangement relative to V. sepium was performed in Mauve (Darling et al., 2004).
To determine the phylogenetic position of V. sepium within Fabeae, four datasets were used to construct the following phylogenetic trees for Fabeae: (I) the complete chloroplast genomes of 21 Fabeae species and C. arietinum (that is, the same 22 species in the comparative analysis); (II) the conserved chloroplast protein-coding sequences of 21 Fabeae species and C. arietinum (that is, the same 22 species in the comparative analysis); (III) the rbcL gene sequences of 50 Fabeae species, Trifolium pretense and T. repens; and (IV) the matK gene sequences of 62 Fabeae species, T. pretense and T. repens. The names of the species included in the four phylogenetic analyses can be found in Table S1.
Specifically, the conserved chloroplast protein-coding sequence of each species comprised 70 concatenated homologous genes shared among twenty-two related species. These genes were atpA, atpB, atpE, atpF, atpH, atpI, ccsA, cemA, clpP, matK, ndhA, ndhB, ndhC, ndhD, ndhE, ndhF, ndhG, ndhH, ndhI, ndhJ, ndhK, petA, petB, petD, petG, petL, petN, psaA, psaB, psaC, psaJ, psbA, psbB, psbC, psbD, psbE, psbF, psbH, psbI, psbK, psbL, psbM, psbN, psbT, psbZ, rbcL, rpl14, rpl16, rpl2, rpl20, rpl23, rpl32, rpl33, rpl36, rpoA, rpoB, rpoC1, rpoC2, rps11, rps12, rps14, rps15, rps19, rps2, rps3, rps4, rps7, rps8, ycf1, ycf2, and ycf3.
All datasets were aligned using MAFFT v7.380 (Katoh and Standley, 2013) under the FFT-NS-2 default setting. The alignments were used for phylogenetic analysis. All alignments were used to construct phylogenetic trees via the neighbor joining (NJ) method in MEGA7.0 (Kumar et al., 2016) under the default settings. Then, we obtained four NJ trees.
In addition, we used another method, the maximum likelihood (ML) method, to construct a phylogenetic tree based on conserved chloroplast protein-coding sequences. The aim of this work was to test the effects of different methods on the phylogenetic relationships of Fabeae species. First, we used MAFFT v7.380 to align twenty-two conserved chloroplast protein-coding sequences under the FFT-NS-2 default settings. Second, ModelTest was employed to find the best model in MEGA7.0. Finally, the tree was constructed using the ML method with the GTR+G+I model and 1,000 bootstrap replicates. C. arietinum was selected as the outgroup.
To determine the sequence divergence of the complete chloroplast genomes, the average pairwise sequence distances of twenty-one Fabeae species and one Cicereae species (that is, the same 22 species in the comparative analysis) were calculated. After alignment with MAFFT v7.380, the average pairwise sequence distances (K2P rate) of these species were presented according to Asaf’s method using MEGA7 (Kimura, 1980; Asaf et al., 2017b).
Additionally, the synonymous (Ks) and nonsynonymous (Ka) nucleotide substitution rates as well as the Ka/Ks ratio were used to calculate the sequence divergence of other homologous protein-coding regions. All twenty-one available chloroplast genomes belonging to the genera Vicia, Pisum, Lens, and Lathyrus were selected for this analysis. These species were divided into two groups: (I) within Vicia: V. sepium, V. sativa, V. faba; (II) outside of Vicia (or other genera): V. sepium, P. abyssinicum, P. sativum, P. sativum subsp. Elatius, P. fulvum, L. pubescens, L. venosus, L. palustris, L. japonicus, L. ochroleucus, L. davidii, L. littoralis, L. inconspicuus, L. graminifolius, L. tingitanus, L. clymenum, L. sativus, and L. odoratus. A total of 71 homologous genes (Table S2) from these species were selected and examined separately. After aligning each gene using the ClustalW (Codons) program in MEGA7, the Ks, Ka, and Ka/Ks values between V. sepium and other species were determined according to Dong’s method (Dong et al., 2019) with the program from the PAML package (Yang and Nielsen, 1998). The two independent-samples t-test was used to examine the significance of the sequence divergence between Vicia and other genera. The p-values were determined with Levene's test. If the Levene's test result was less than 0.05, we used the unequal variance as the p-value; if not, we used the equal variance as the p-value.
Once Vicia showed a significantly higher Ka/Ks ratio than the other genera, codon-based likelihood analysis based on the branch model test in CodeML from the PAML package was carried out to identify the lineages in Fabeae that exhibited significantly high evolutionary rates. This test employed the user-defined topology of Fabeae lineages with five other lineages: A0 (Cicer), A1 (Pisum and Lathyrus), A2 (Lens and Vicia), A3 (Lens), and A4 (Vicia). This topology was constructed based on the concatenated DNA sequences of matK and rbcL (Figure S1) using the ML method with the GTR+G50 model in MEGA7.0. The method was the same as that used for the phylogenetic analysis described previously. A one-ratio model (model = 0) and a two-ratio model (model =2) were used to calculate the Ka/Ks ratio for each branch. A one-ratio model, or null model (model = 0), is one in which all clades (or all lineages) exhibit the same Ka/Ks ratio. A two-ratio model, or alternative model (model = 2), is one in which one or more clades present different Ka/Ks ratios. The transition/transversion and Ka/Ks ratios were set as automatically estimated. Codon frequencies were set as the F3 × 4 method. The hypotheses of the two-ratio model are described in Table S3. The likelihood ratio test (LRT) was used to find the best model (P < 0.05) through comparison of two different models. From the best model, we could infer whether a homologous gene showed accelerated evolution in Vicia. In addition, all genes exhibiting accelerated evolution were compared with two genes showing nonaccelerated evolution (matK and rbcL), in two ways. First, we compared their synonymous and nonsynonymous nucleotide substitution rates in Ks trees and Ka trees. The branch lengths representing the substitutions per synonymous site or nonsynonymous site were determined from the best model. Second, we compared their amino acid sequence differences. Amino acid sequence alignment was performed in Jalview v2.10.5 (Waterhouse et al., 2009).
The original image data obtained by next-generation sequencing technology was converted into the original sequenced reads by CASAVA base calling analysis to obtain raw reads (10,808,365) or raw data (3.24 gigabytes). A total of 7,696,368 clean reads (2.31 gigabytes of clean data) with an average length of 150 bp were obtained after the adapter sequences and low-quality reads were removed. A single long contig of 124,095 bp was assembled using clean data via de novo assembly, forming a loop representing the whole chloroplast genome sequence of V. sepium. The V. sepium chloroplast genome, under GenBank accession number NC039595, showed the loss of one IR and contained 76 protein-coding genes, 29 tRNA genes, four rRNA genes and one pseudogene (rpl23 Ψ). In particular, one unannotated protein-coding gene, ORF292, was identified (Table 1). The gene map of these 110 genes was presented (Figure 1). Among these protein-coding genes, 9 genes (ndhA, ndhB, rpl2, rpl16, petD, petB, atpF, rpoC1, clpP) contained a single intron, while one gene, ycf3, contained two introns (Table 2). Additionally, four tRNA genes containing one intron were also identified as follows: trnVUAC, trnAUGC, trnIGAU, and trnLUAA. As observed in most legumes, the infA, rpl22, and rps16 genes were lost (Lei et al., 2016). The overall GC content of the V. sepium chloroplast genome was 35.0%, whereas that of the protein-coding, intron, tRNA, rRNA and IGS regions was 36.7%, 34.6%, 52.3%, 54.2%, and 29.2%, respectively (Table S4). The RSCU result revealed that the V. sepium protein-coding sequences showed codon usage bias, with all preferred synonymous codons ending with A/T nucleotides and a high AT content at the 3rd codon positions (72.2%) (Figure S2, Table S4).
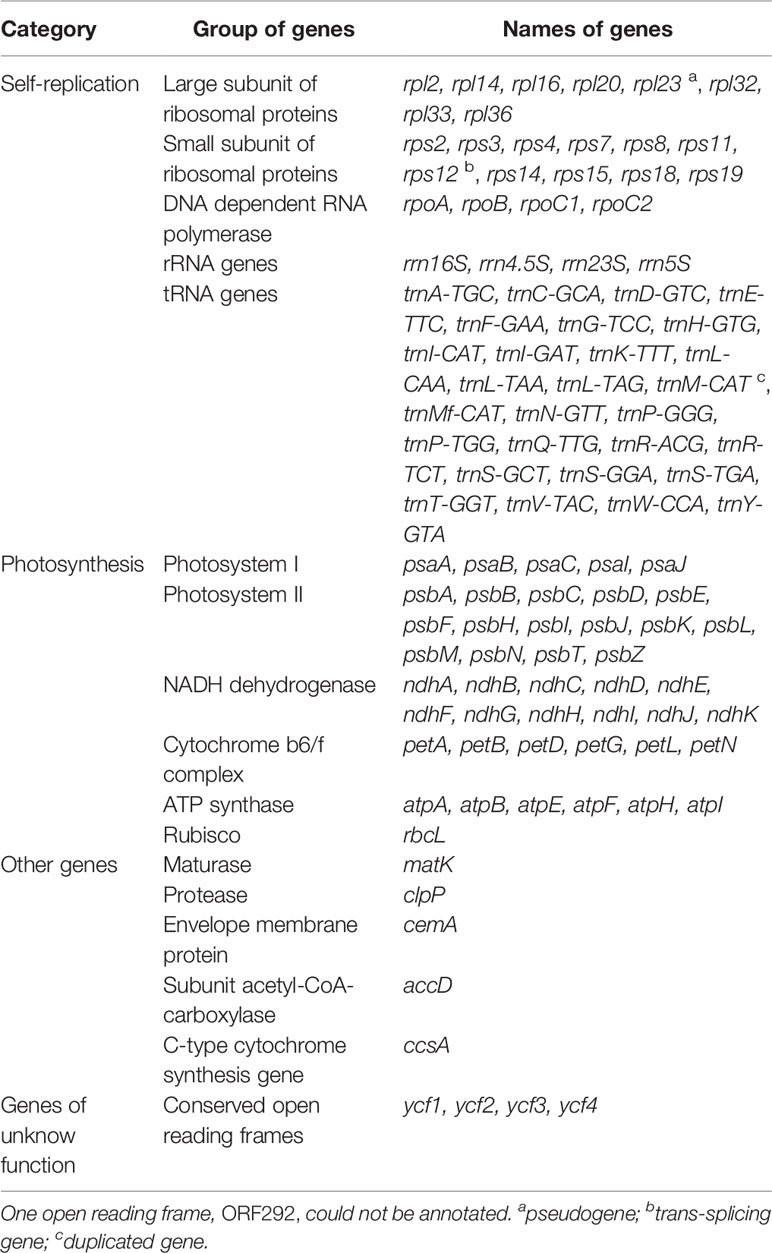
Table 1 Genes predicted in the chloroplast genome of V. sepium.
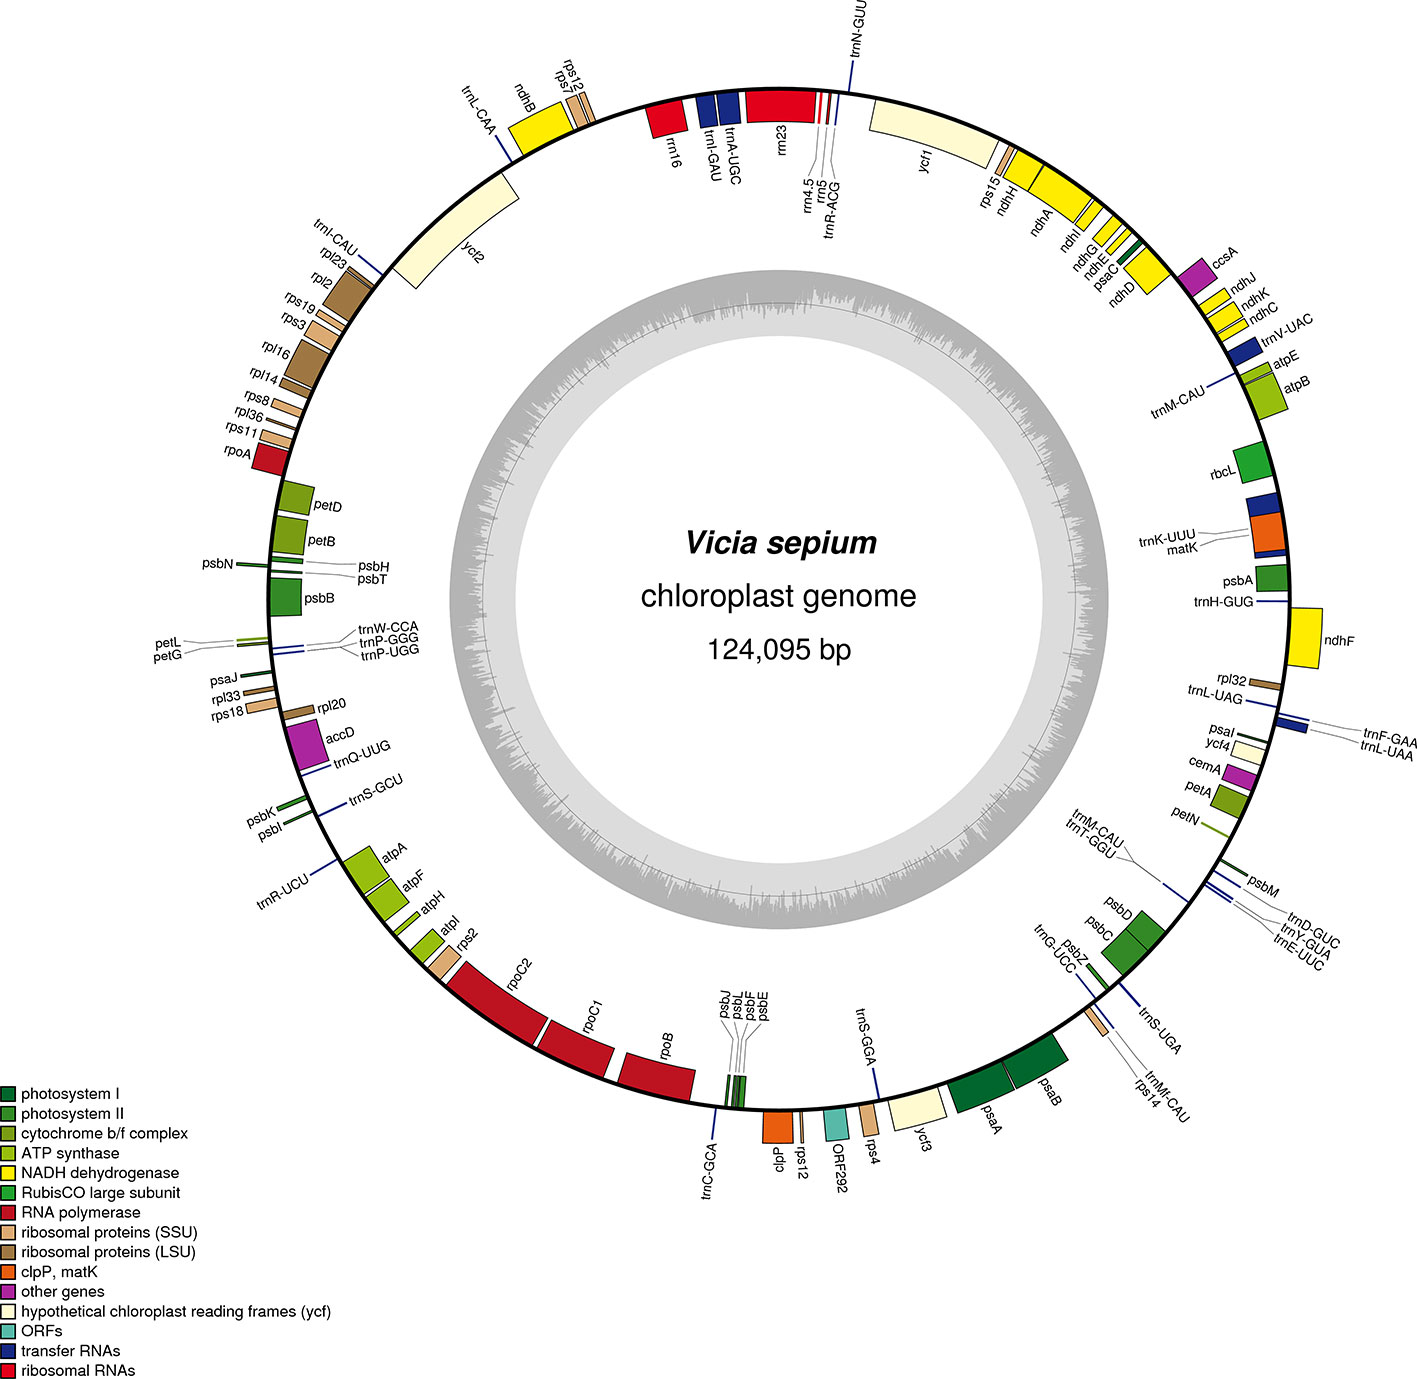
Figure 1 Gene map of the complete chloroplast genome of V. sepium. Genes inside the circle are transcribed clockwise, and those outside are transcribed counterclockwise. The different colors of the blocks represent different functional groups. The darker gray color of the inner circle corresponds to the GC content, and the lighter gray color corresponds to the AT content.
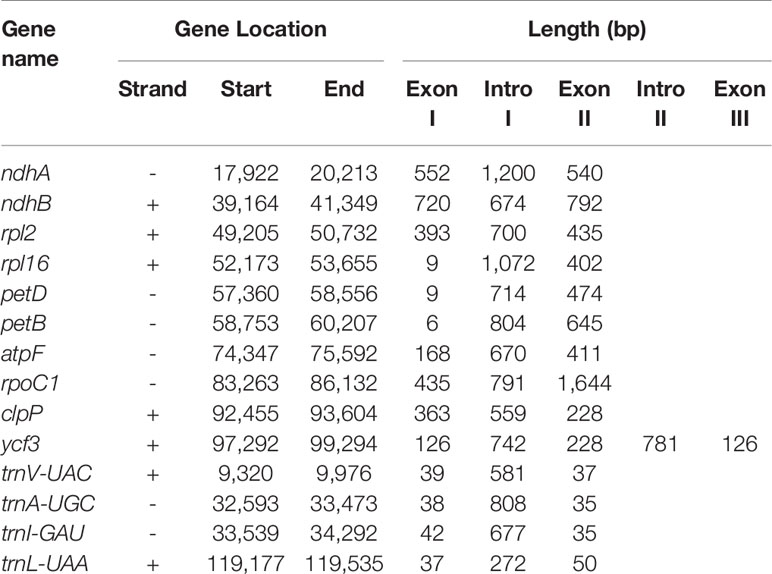
Table 2 Lengths of introns and exons of the split genes in the V. sepium complete chloroplast genome.
We analyzed the presence of SSRs and repeats in V. sepium. SSRs, which are regarded as useful gene markers, exhibited a high mutation rate. In this study, a total of 201 SSRs were found in the chloroplast genome of V. sepium (Figure 2). A majority of the SSRs were composed of mono-nucleotide and di-nucleotide repeat motifs. The types of SSRs distributed within the chloroplast genome of V. sepium were characterized, revealing that the SSR motifs of mono-nucleotide repeats mainly consisted of A/T (98.5%) and that those of di-nucleotide repeats mainly consisted of AT/TA (86.8%). A total of 116 and 66 V. sepium SSRs were distributed in the IGS and CDS regions, respectively (Figure 2).
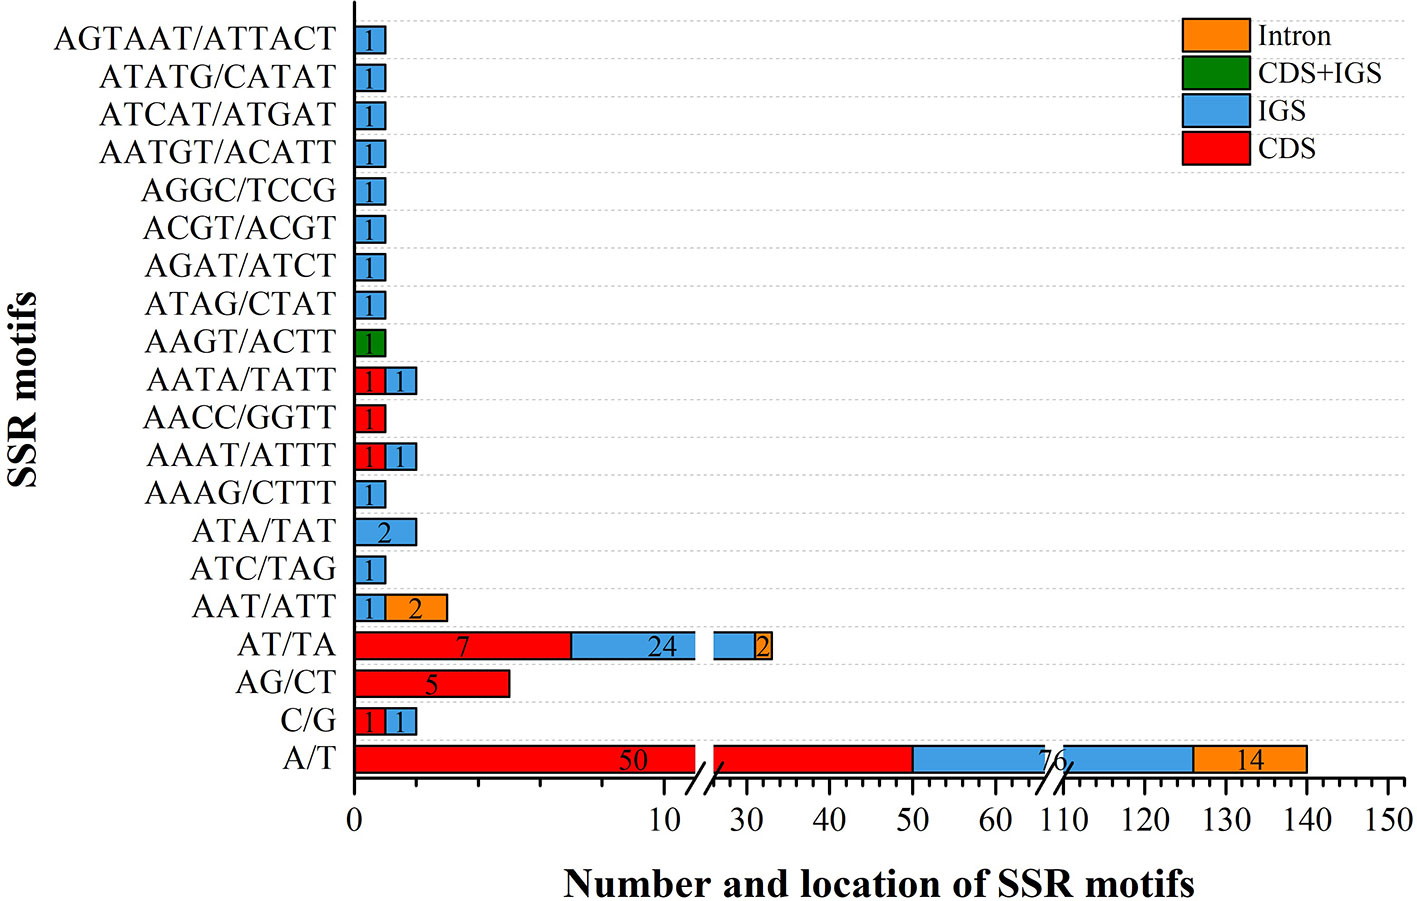
Figure 2 The types and distribution of SSRs along the chloroplast genome of V. sepium. Different locations, including CDS, IGS, CDS and IGS, and intron regions, are represented as colored boxes.
Repeat sequences are essential for genome rearrangements, phylogenetic construction (Cavalier-Smith, 2002) and indel, and substitution variation (Yi et al., 2013). Sixty-two repeats, including 46 forward repeats, 4 palindromic repeats, and 12 tandem repeats, were found in the chloroplast genome of V. sepium. The lengths of the palindromic repeats were 45, 50, 54, and 155 bp, and the lengths of the forward repeats and tandem repeats ranged from 45 to 222 bp and 32 to 229 bp, respectively (Table S5). In addition, the maximum number of repeats (n = 49) were located in IGS regions, followed by those in CDSs (n = 27) (Table S5). We also found that most of these repeats were located in the psaB-rps14 (n = 20), ycf1-trnN-GUU (n = 10), accD (n = 6) and rps14 (n = 5) regions.
Twenty complete chloroplast genomes from within Fabeae were selected for comparison with V. sepium. One Cicereae species, C. arietinum, was set as the outgroup (Table 3). The changes in chloroplast genome length in these species ranged from 120, 289 bp (L. odoratus) to 126,421 bp (L. pubescens), and the greatest variation in length relative to V. sepium was 3.0% in the protein-coding region of L. culinaris, followed by the IGS region (2.8%) of L. culinaris. An average difference in length of only 0.1% was found in the tRNA and rRNA gene regions. Additionally, the GC content of the twenty-two complete chloroplast genomes ranged from 33.9% to 35.2%, exhibiting little change. After comparing V. sepium genes with those of twenty-one other Fabeae species, we found an inserted gene that is a unique unannotated protein-coding gene, ORF292, between rps12 and rps4 in V. sepium. Moreover, the rps12 to rps4 region in V. sativa also contained an inserted duplicated rpl20 gene (not mentioned in the table). From genome rearrangement, we can infer that inversion events may result in gene insertion (Figure S3). We also found a pseudogene, rpl23, in V. sepium, V. sativa, P. abyssinicum, P. sativum, P. sativum subsp. Elatius and L. sativus. By analyzing gene and intron losses, all twenty-two species lost the infA, rpl22, and rps16 genes, similar to most of the IR-lacking species. Ycf4 genes were found in only V. sepium, V. faba, P. sativum, and L. sativus. Moreover, one intron of the clpP and rpl16 genes was lost in L. graminifolius and V. faba, respectively (Table 3).
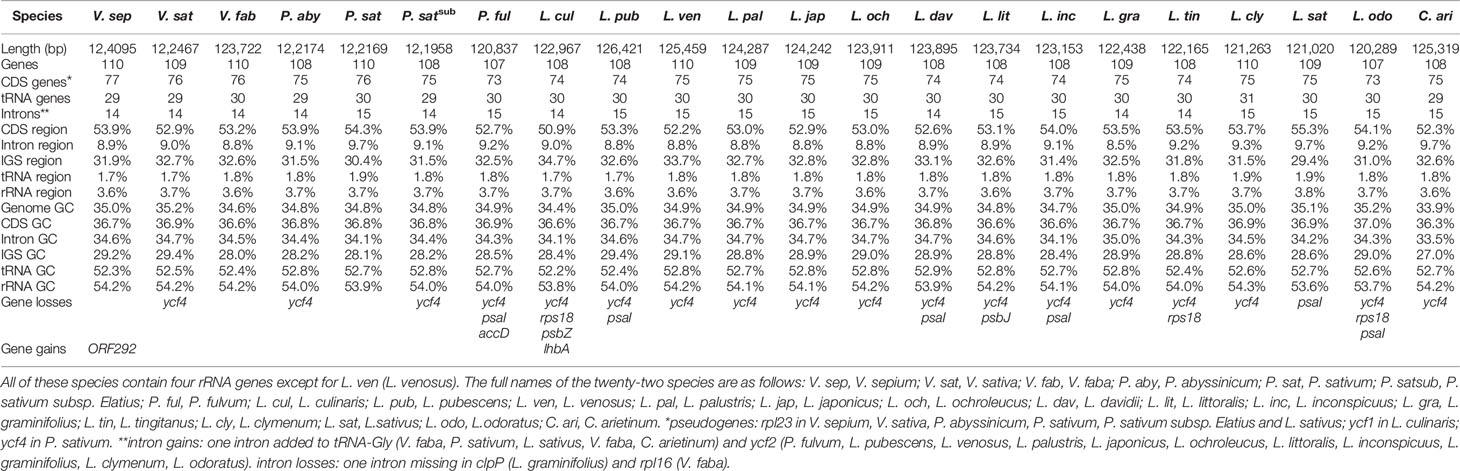
Table 3 Characteristics of twenty-one Fabeae species and Cicer arietinum.
The sequence identity of the chloroplast genomes of V. sepium and twenty-one other Fabaceae species was visualized (Figures 3 and S4), and the results revealed that coding regions are more highly conserved than noncoding regions. Usually, regions with 50% or less sequence identity can be regarded as highly divergent regions. In coding regions, ycf1, ycf2, rpl23, rps3, rps18, accD, rpoC1, clpP, ORF292, ycf4, psaI, and rpl32 contained relatively low identity regions. In addition, these highly divergent noncoding regions include rps15-ycf1, ycf1-trnN-GUU, rrn16-rps12, ycf2-trnI-CAU, trnI-CAU -rpl23, rpl16 intron, rpl14-rps8, rps8-rpl36, psbB-petL, accD-trnQ-UUG, trnQ-UUG-psbK, psbE-clpP, clpP-rps12, psaB-rps14, psbD-trnT-GUU, ycf4-psaI, psaI-trnL-UAA, and rpl32-ndhF (Figure 3 and S4).
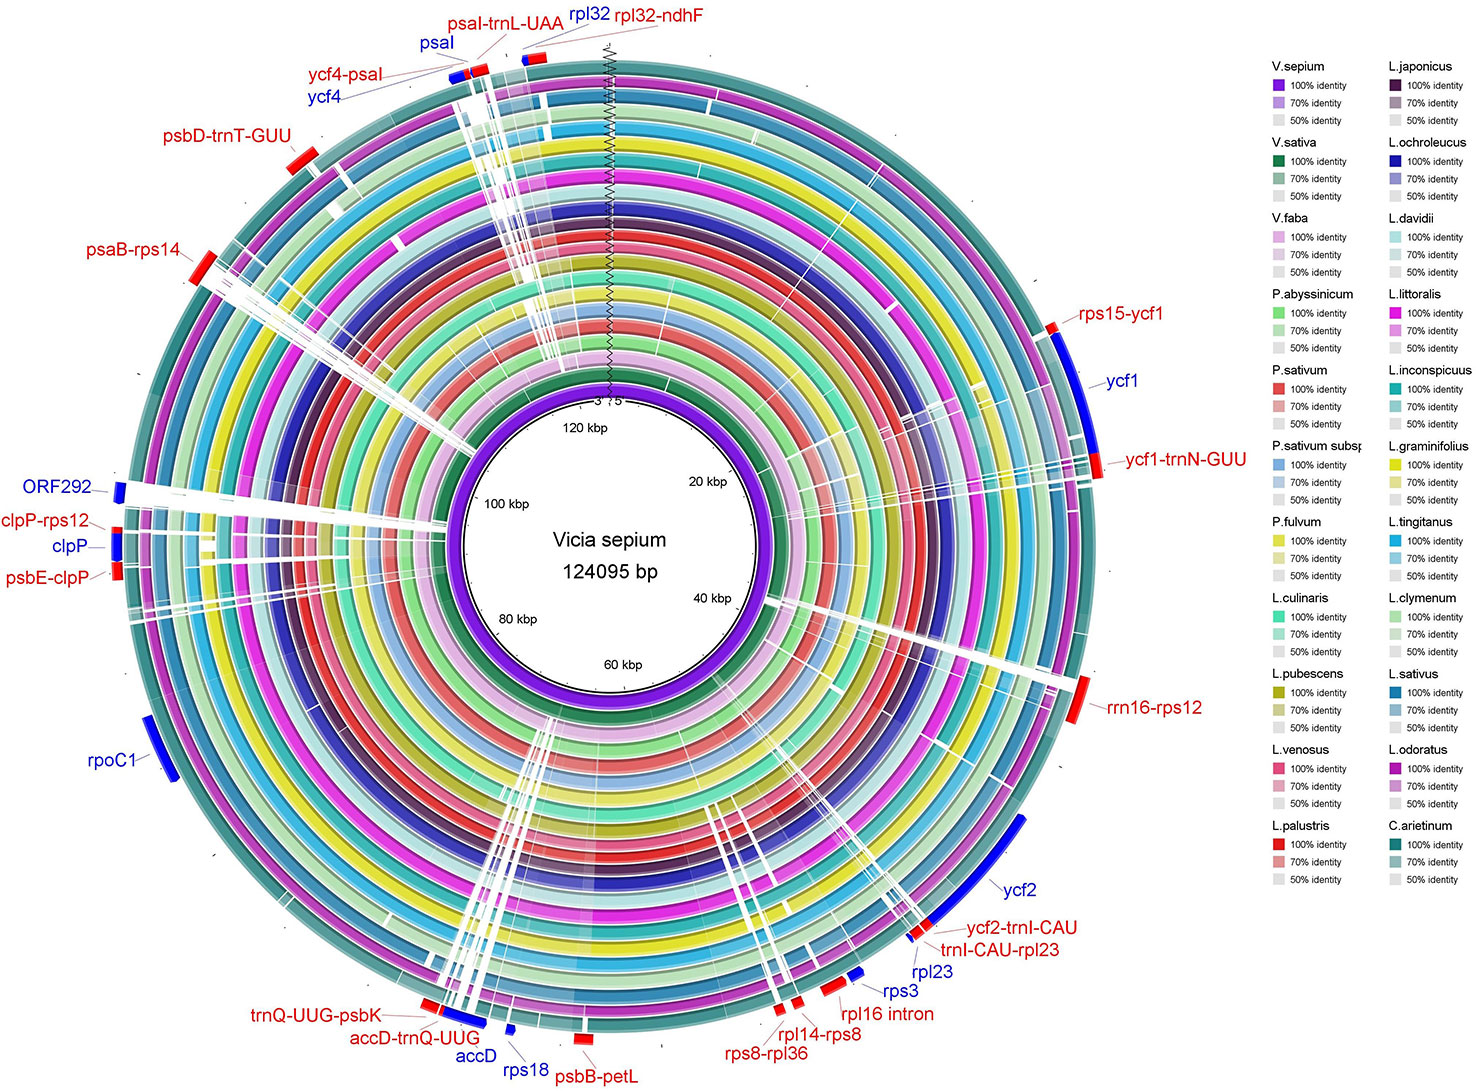
Figure 3 The sequence identity of 22 Fabaceae species. The inner circle is the reference genome. Next circles represent the sequence identity between V. sepium and 21 other species. The outermost circle corresponds to the protein-coding genes and intergenic spacer regions. Genes with clockwise arrows represent reverse strands, while genes with the counterclockwise arrow represent forward strands.
The pairwise distances (K2P rates) of complete chloroplast genome sequences from twenty-one Fabeae species and one Cicereae species were calculated (Table S6). The results showed that the nucleotide variability rate ranged from 0.001 to 0.248 (L. sativus vs C. arietinum). Compared with V. sepium, the lowest K2P rate was 0.027 (V. sativa) while the highest K2P rate was found in C. arietinum (0.246) (Table S6). The mean K2P rate between Pisum and V. sepium was 0.217. The mean K2P rate between Lathyrus and V. sepium was 0.193. Specifically, the K2P rate between V. faba and V. sepium was 0.207, which was higher than the rate between V. sepium and some Lathyrus species. We hypothesized that V. sepium and V. sativa were located in the same clade and showed different evolutionary directions compared with V. faba.
Ka and Ks nucleotide substitutions within Vicia and outside of Vicia were calculated with V. sepium as the reference, as well as the Ka/Ks ratio (Table S2, Figure 4). The Ka/Ks ratio is an important parameter for determination of the selective constraint acting on each gene (Keller et al., 2017). Ka/Ks > 1 indicates that the gene was under positive selection, whereas Ka/Ks = 1 or <1 indicates genes under neutral selection or purifying selection (Kimura, 1980). The mean Ks between V. sepium and twenty Fabeae species ranged from 0.0058 (petN) to 0.2375 (ycf1), and the mean Ka ranged from 0 (petG, psbF) to 0.1846 (clpP) (Table S2). Within the genus Vicia, nine genes (ccsA, clpP, rpl32, rpl33, rpoC1, rps15, rps2, rps4 and rps7) with a Ka/Ks ratio >1 (Figure 4) evolved under beneficial mutations, and 60 genes evolved under purifying selection, including sixteen genes that evolved almost neutrally, showing a ratio range of 0.5 to 1. Twelve conserved genes (atpH, petG, petN, psaC, psbA, psbD, psbF, psbH, psbK, psbL, psbM and rpl36 with Ka/Ks = 0) presented a very strong purifying selective pressure. Comparison of sequence divergence between Vicia and other genera showed that the Ka/Ks ratios of the eight genes (accD, atpA, matK, rpl32, rpl33, rps2, rps4, ycf1) were significantly higher (P < 0.05) in Vicia, and among these genes, the ratios of accD, atpA, rpl32, rps2 and rps4 were extremely significantly higher (P < 0.01).
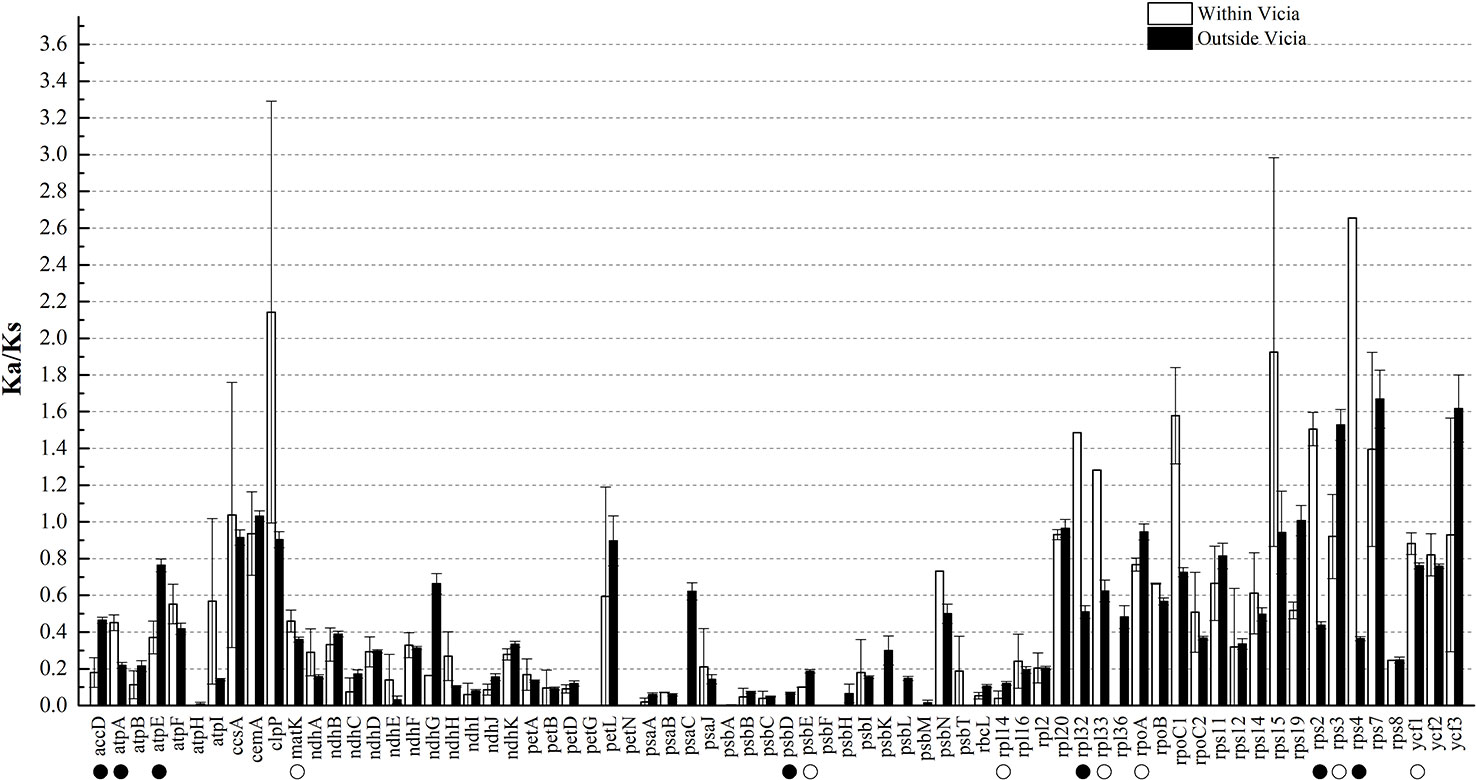
Figure 4 The Ka/Ks ratios of homologous protein-coding genes within and outside of the genus Vicia with V. sepium as the reference. White boxes represent the mean Ka/Ks values within the genus Vicia, and black boxes indicate the mean Ka/Ks values outside of the genus Vicia. The data are the arithmetic mean ± SE. Symbols under the gene names indicate levels of statistical significance between the species within Vicia and the species outside of Vicia: no symbol, P > 0.05, blank circle, P = 0.01–0.05; black circle, P < 0.01. The X-axis denotes the homologous genes.
Codon-based likelihood analysis (Table S3; Figure S1) was performed to compare the Ka/Ks ratios of the accD, atpA, rpl32, rps2, and rps4 genes across different Fabeae lineages. C. arietinum was set as the reference. The null model (H0) hypothesized that the A0 (Cicer), A1 (Pisum and Lathyrus), A2 (Lens and Vicia), A3 (Lens), and A4 (Vicia) clades exhibit the same Ka/Ks ratio. The alternative model hypothesized that one or more clades present different Ka/Ks ratios. By comparing the p-values of the two different models, the results demonstrated that the best models for accD, atpA, rpl32, rps2, and rps4 are H2, H3, H0, H2, and H0, respectively (Table S3). A higher Ka/Ks ratio in a specific clade is considered to indicate accelerated evolution of the clade. The Ka/Ks ratios of accD, atpA and rps2 in the Vicia clade were higher than those in the Cicer clade, and the Ka/Ks ratios of rpl32 and rps4 were the same in the two clades. The results revealed that evolution rates increased in atpA, rps2 and accD of the Vicia lineage but exhibited no change in rpl32 or rps4 (Table S3). The Ka/Ks ratios of rps2 in the Vicia clade were higher than those in the Pisum and Lathyrus clade, but the Vicia clade presented lower Ka/Ks ratios in the accD and atpA genes. The results revealed that rps2 exhibited a higher evolutionary rate in Vicia, while atpA and accD in Pisum and Lathyrus evolved much faster. We also compared the synonymous and nonsynonymous nucleotide substitution rates of genes that evolved rapidly (accD, atpA, and rps2) in different Fabeae lineages to the rates observed in genes that did not evolve rapidly (rbcL and matK) based on codon-based ML phylogenetic analysis. As shown in Figure 5, in the Ka and Ks trees, the substitutions per nonsynonymous site of rps2 evolved much faster in Vicia than in other Fabeae species, but no similar acceleration was observed in rbcL and matK. In addition, all Fabeae lineages showed accelerated evolution in the accD gene for high synonymous and nonsynonymous nucleotide substitution rates compared to rbcL and matK. This result can supplement Magee’s findings (Magee et al., 2010). We also detected amino acid differences in the accD, atpA, rps2, matK, and rbcL genes within and outside of Vicia by aligning the sequences from Fabeae species (Figures S5–S9). Notably, there is less amino acid sequence conservation in accD (83.03% identity between Vicia species) and rps2 (91.98% identity between Vicia species) than in matK (94.23% identity between Vicia species) and rbcL (99.16% identity between Vicia species). The lengths of the amino acid sequences ranged from 165 to 1,141 in accD.
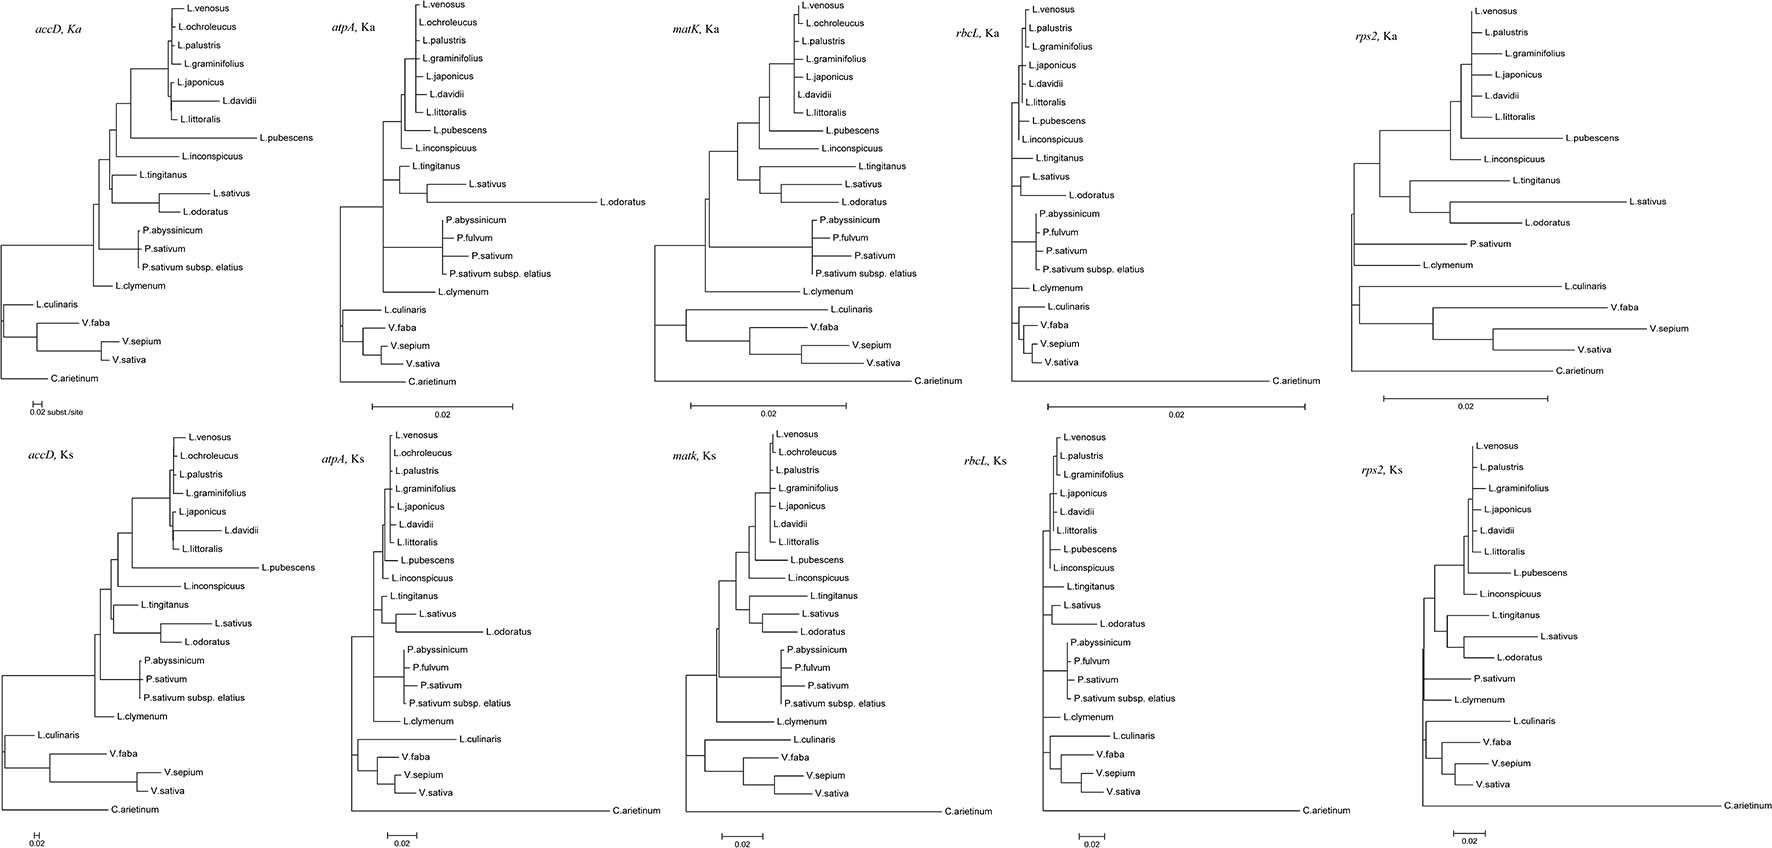
Figure 5 Synonymous and nonsynonymous divergence in the Fabeae chloroplast genes. All tree topologies were completely constrained as described in the Methods section. All trees were drawn to the same scale representing the number of substitutions per synonymous or nonsynonymous site.
Considering the rather limited number of complete Vicia chloroplast genomes (only 3), it is difficult to determine whether Vicia is paraphyly. Therefore, in addition to the complete chloroplast genomes and conserved chloroplast protein-coding sequences, we constructed a phylogenetic tree of Vicia using two widely sequenced chloroplast genes, namely, rbcL and matK, to support our result. Detailed information regarding these four datasets can be found in Table S1. Upon comparing the four NJ trees, we found that V. sepium, V. sativa, and V. faba were located in the same evolutionary branch with support rates of 100% in the protein-coding sequence tree, 99% in the matK tree, and 49% in the rbcL tree. However, in the whole-genome tree, the result was different, with V. sepium and V. sativa located in the same clade and V. faba located in another clade. These results indicated that the evolutionary histories of V. sepium and V. sativa were similar but different from that of V. faba (Figures S10–S12). Both the rbcL and matK phylogenetic trees showed that Vicia species were included in different clades, which supports our hypothesis that Vicia is paraphyletic (Figures S11 and S12).
Both the NJ and ML phylogenetic trees for homologous protein-coding sequences showed that Vicia and Lens were included in the same clade, together with Pisum and Lathyrus (Figure 6), but the ML tree presented a higher support rate for the Vicia and Lens clade than the NJ tree.
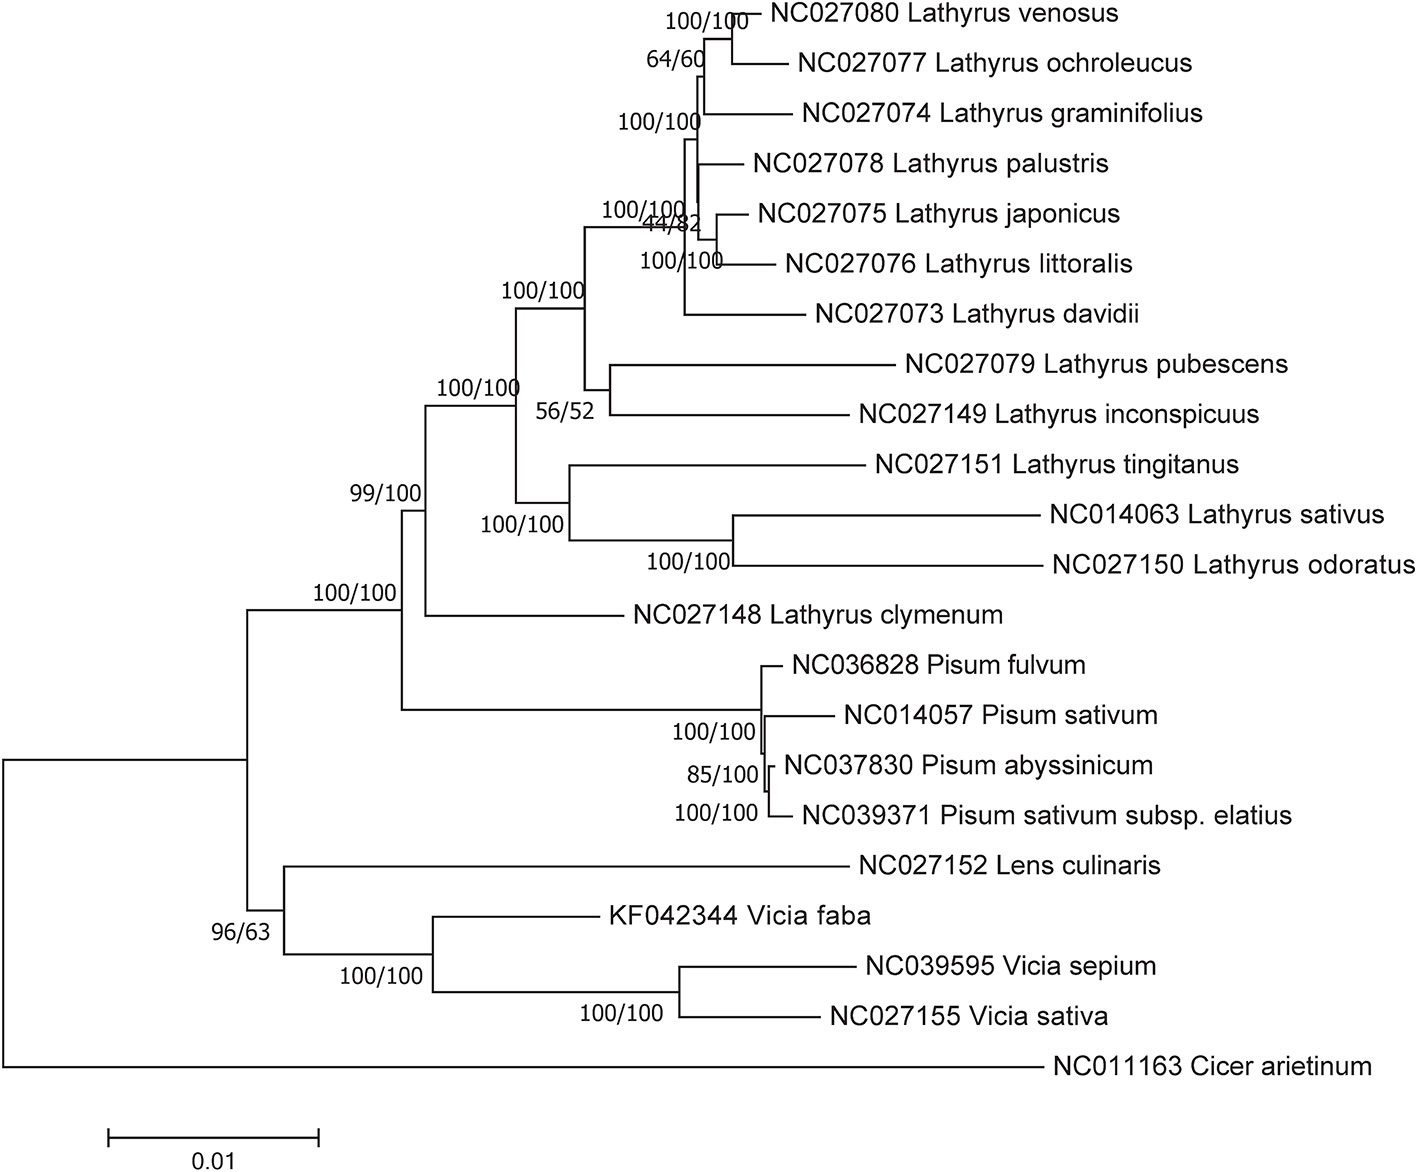
Figure 6 Phylogenetic relationships based on the conserved chloroplast protein-coding sequences of 21 Fabeae species and C. arietinum with the maximum likelihood (ML) method and the neighbor joining (NJ) method. C. arietinum was selected as the outgroup. Numbers on the left and right side at the branches represent bootstrap values of the ML method and the NJ method respectively.
In our study, within genus Vicia, ccsA, clpP, rpl32, rpl33, rpoC1, rps15, rps2, rps4, and rps7 showed positive selection, with a Ka/Ks ratio >1 (Figure 4). None of these genes are related to photosynthesis (psa, psb, ndh, pet, atp). In fact, genes related to photosynthesis were under less selection pressure than other types of genes (Du et al., 2016; Li et al., 2017; Gao et al., 2018). Such positive selection is also found in other species, as observed for two genes flanking ycf4 (accD and cemA) in Lathyrus (Magee et al., 2010); accD, ycf1, and atpA in seed plants (Zheng et al., 2017); rps14 in Dodonaea viscosa and Sapindus mukorossi (Saina et al., 2018); and the atpF gene in two deciduous Quercus species (Yin et al., 2018). In general, genes under selection pressures are mainly identified by comparing the synonymous and nonsynonymous nucleotide substitution rates in related species. Thus, genes under positive selection pressure in different lineages can be identified. However, the positive selection acting on genes in a specific lineage contrasts with the silent molecular clock hypothesis, according to which the point mutation rate in all regions of the same genome is almost constant (Ochman and Wilson, 1987). The factors causing a higher Ka/Ks ratio in some sequences than in the rest of the genome remain unclear. Here, we consider two explanations for this difference. One possible explanation for this phenomenon is that a greater number of nucleotide substitutions are associated with gene duplications and gene losses. Erixon found that positive selection acting on the clpP gene in various plant lineages is related to repeated duplication (Erixon and Oxelman, 2008). Magee showed that the Ka/Ks ratios of cemA and accD flanking ycf4 are >1 in Lathyrus. This may occur because the increase in the nucleotide mutation rate near the hypermutational ycf4 gene affects the purifying selection acting on the amino acid sequence (Magee et al., 2010). Another possibility is that differential selection may act on gene divergence. For example, research on oak species showed that the atpF gene is highly divergent (Ka/Ks > 1) in the comparation between deciduous oak and evergreen sclerophyllous oak because the former loses its leaves in the cold and drought seasons (Yin et al., 2018). Another study on seed plants suggested that genes affected by positive selection are always involved in plant adaptation, such as accD, ycf1 and atpA (Zheng et al., 2017).
We also found that atpA, accD, and rps2 of Vicia showed significantly accelerated evolution (Figures 4, 5, S5–S7, Table S3). Rps2, encoding the ribosomal protein S2, is retained in almost all plants. The exceptions mainly occur in Apocynaceae. For example, in milkweeds, a 2.4-kb mitochondrial DNA sequence was horizontally transferred to the rps2-rpoC2 plastid intergenic region, resulting in two pseudogenes, namely, rps2 and rpoC2, contained in plastomes (Straub et al., 2013). However, such plastome insertion is rare. A relatively common type of evolution is the point mutation described in our study. For example, Ka and Ks rates are elevated in parasitic Scrophulariaceae and Orobanchaceae, which provide suitable material for studying the evolution of hemi- and holoparasitic plant lineages (dePamphilis et al., 1997). In Gossypium, the Yrp8 and Cys11 sites of rps2 and the other nine genes are undergoing protein sequence evolution, which may aid the adaptation of cotton species to diverse environments (Wu et al., 2018). The accelerated evolution of atpA (participating in ATP synthesis) has also been found in other species, such as Dipsacales (Fan et al., 2018) and Urophysa (Xie et al., 2018) species. Consistent with our study, only one to three sites show positive selection. AccD is essential for plant leaf development and has been lost in some angiosperm lineages. It is believed that accD was functionally transferred to the nucleus (Magee et al., 2010; Sabir et al., 2014).
At present, Vicia is the only known legume genus in which so many genes show positive selection and accelerated evolution in the chloroplast genome. Therefore, a comprehensive understanding of the mechanism underlying the increased nucleotide substitution of homologous protein-coding genes is necessary, and Vicia species may be suitable model systems for such studies.
To detect the genome variation in the chloroplast genome of V. sepium, we compared V. sepium with related genera in the tribe Fabeae. Our results revealed that the greatest variation in genome length relative to V. sepium was located in protein-coding regions (Table 3). This finding is consistent with Zheng’s research (Zheng et al., 2017), showing that chloroplast gene length is an important factor affecting chloroplast genome size based on phylogenetic signals. The length variation of protein-coding regions may result from gene loss and gain or differences in the lengths of homologous genes. Ycf4, encoding a photosystem I assembly protein, is the most easily deleted gene in Fabeae species (Table 3). This result supports previous findings revealing that ycf4 has been lost in many species of Lathyrus and Pisum due to its functional transfer to the nuclear genome (Magee et al., 2010). Furthermore, gene insertion events involving one new unannotated protein-coding gene, namely, ORF292 (879 bp) and one duplicated gene, namely, rpl20 (354 bp), were found in V. sepium and V. sativa, respectively. One pseudogene, rpl23, was identified in V. sepium and V. sativa (Table 3). This indicates that the evolutionary histories of V. sepium and V. sativa are similar and that V. faba may be located in a different evolutionary clade. In general, a chloroplast gene cannot be lost arbitrarily unless the function of the gene is transferred to the nuclear genome or replaced by that of a nuclear gene (Magee et al., 2010). Therefore, the mechanism of loss of the rpl23 gene in V. sepium and V. sativa requires further in-depth research. In addition to gene loss, one intron was also missing in clpP (L. graminifolius) and rpl16 (V. faba) (Table 3). The clpP gene normally contains two introns in angiosperms (Jansen et al., 2007; Jansen et al., 2008). Jansen determined that the IRLC lineage (in which Fabeae is included) has lost one intron of clpP (Jansen et al., 2008). However, the loss of two introns observed in clpP is rare; Sabir’s research (Sabir et al., 2014) on the IRLC lineage (in which Fabeae is included) showed that this phenomenon has only occurred in Glycyrrhiza glabra, and our findings are complementary to this previous work. V. faba was the only species found to have lost the intron of rpl16 in the tribe Fabeae, and the rpl16 intron shows high divergence in Chusquea (Kelchner and Clark, 1997), Gleditsia (Schnabel and Wendel, 1998), and Cacteae (Butterworth et al., 2002). This result indicates that different evolutionary clades exist in Vicia. In addition to gene loss and gain, differences in the lengths of homologous genes are also found in Fabeae species (ranging from 495 to 3,423, 36 to 537, and 3,879 to 5,403 in accD, rps12 and ycf1, respectively). In seed plants, the length difference in atpA, accD, and ycf1 is the main reason for chloroplast genome size variation (Zheng et al., 2017).
In addition to protein-coding region expansion and contraction in V. sepium, protein-coding sequence divergence also exists. In our study, the GC content of the chloroplast genome of V. sepium was found to be lower than that of other species, such as Chikusichloa mutica [tribe rice (Wu et al., 2017)], Arabidopsis thaliana [Brassicaceae (Asaf et al., 2017a)], and Quercus aquifolioides [Fagaceae (Yin et al., 2018)], which exhibit a conserved structure and evolution of the chloroplast genome (Table S4). Normally, a higher GC content indicates a more stable genome sequence (Wu et al., 2017). Therefore, to consider the genome variation in V. sepium protein-coding regions, we surveyed SSRs, repeat loci, highly divergent regions and pairwise sequence divergence. Many SSRs and repeat loci appeared in the protein-coding regions (CDSs) (Table S5, Figure 2). These results are consistent with previous reports on Astragalus membranaceus (Lei et al., 2016). Because of the slippage of DNA strands, SSRs, regarded as useful gene markers, present a high mutation rate (Huang et al., 2018). Repeated sequences are believed to result in aberrant replication and repair pathways (Sabir et al., 2014). The genes ycf1, ycf2, rpl23, rps3, rpl18, accD, rpoC1, clpP, ORF292, ycf4, psaI, and rpl32 share relatively low identity (Figures 3 and S4). V. sepium showed considerable differences from other Fabeae species (with the exception of V. sativa), even V. faba. Therefore, Vicia presents profound genome variation, which is significant for the evolutionary history of the chloroplast genome.
The phylogenetic analysis conducted with the conserved chloroplast protein-coding sequences of rbcL and matK showed that Vicia and Lens were included in the same clade (Figures 6 and S12). This result is also supported by the synapomorphy that is observable in the currently available research. Vicia and Lens both produce the phytoalexin wyerone, which is not found in Pisum and Lathyrus (Schaefer et al., 2012), and show high average protein richness and in vitro protein digestibility (Pastor-Cavada et al., 2014). However, even within Vicia, different evolutionary directions can be found, resulting in the paraphyly of Vicia. For example, in our study, the pairwise distance between V. sepium and V. sativa was much greater than that between V. sepium and V. faba (Table S6). The former species also showed a gene insertion in the rps12 to rps4 region (Figure S3) and an accelerated evolutionary rate in accD (Figure 5). In addition to chloroplast genome characteristics, the life form, stylar characteristics, and chromosome numbers of these species support this result. Ancestral Vicia species originating from the Mediterranean shared an annual life form, a basic chromosome number of 2n=14 and evenly hairy styles. However, the recent evolutionary reconstruction of Vicia indicates that a perennial life form, a chromosome number of 2n=12 (or 10, 24, 28, 42) and adaxially/abaxially hairy styles have arisen in Vicia (Schaefer et al., 2012). In the comparison of Vicia species in our study, all of the species were found to produce adaxially hairy styles, but V. sepium has evolved a perennial life form, while V. sativa and V. faba share the same characteristic of an annual life form. Nevertheless, the evolution of the life form of Vicia verified that V. sepium and V. sativa had a shared evolutionary history. Therefore, we can infer from all of these results that Vicia species may adopt different evolutionary strategies and that the chloroplast genome provides ideal material for reconstructing the evolutionary history of Vicia.
In summary, a new chloroplast genomic resource for an important wild resource plant, V. sepium, is presented. This study fills the gap in V. sepium genomic resources and provides novel insights into evolutionary dynamics in a poorly studied Vicia clade. Our results reveal that Vicia species may have experienced many instances of positive selection in the chloroplast genome and accelerated evolution of protein-coding genes, which is rare, being found in only a few angiosperm species. Detailed surveys show that V. sepium presents profound genomic variation in terms of ORF292 gene insertion, rpl23 pseudogene detection, lower GC content, CDS length variation, and accelerated evolution of the atpA, accD, and rps2 genes. Analysis of the phylogenetic relationships show that Vicia and Lens are included in the same clade and that the evolutionary direction of V. sepium and V. sativa is different from that of V. faba. Therefore, Vicia species may be a suitable model system for understanding the mechanisms of chloroplast genome evolution. This study is expected to attract researchers toward Vicia species, leading to the identification of further evidence regarding the evolutionary history of the chloroplast genome.
All datasets generated for this study are included in the article/Supplementary Material.
CL, ZX, and GY conceived the study. All authors collected field samples. CL, JP, and XP analyzed the final data. YZ acquired funds (2016NK2148, 2016TP2007) for this study. CL wrote the original manuscript, and all authors commented on an early draft of the manuscript.
This work was supported by the Major Science and Technology Program of Hunan Province (2017NK1014), Key Technology R&D Program of Hunan Province (2016NK2148, 2016TP2007, 2017TP2006), Forestry Science and Technology Project of Hunan Province (XLK201825, XLK201920) and Natural Science Foundation of Hunan Province (2019JJ50027).
The authors declare that the research was conducted in the absence of any commercial or financial relationships that could be construed as a potential conflict of interest.
We would like to thank Wu Liang for providing insightful writing assistance. We would also like to thank the anonymous reviewers for their valuable comments.
The Supplementary Material for this article can be found online at: https://www.frontiersin.org/articles/10.3389/fgene.2020.00073/full#supplementary-material
Figure S1 | Topology of Fabeae lineages obtained from a concatenated data set consisting of matK and rbcL. C. arietinum was selected as the out group.
Figure S2 | Codon usage and relative synonymous codon usage (RSCU) of the V. sepium chloroplast genome. The color of the histogram corresponds to the color of the codon. The size of the histogram corresponds to the RSCU of the codon. The X-axis represents different amino acids and the associated codons.
Figure S3 | Genomic rearrangement of six Fabeae species relative to V. sepium. Locally collinear blocks (LCBs) are colored to indicate syntenic regions. Blocks below the center line indicate regions that align in the reverse complement (inverse) orientation. The small boxes below the LCBs of each chloroplast genome are represented as genes.
Figure S4 | Alignment visualization of twenty-two Fabaceae complete chloroplast genomes using V. sepium as a reference. The vertical scale indicates the percent identity, ranging from 50% to 100%. Arrows indicate the annotated genes and their transcriptional direction. The different colored boxes correspond to exons, tRNA or rRNA, and noncoding sequences (CNSs).
Figure S5 | Alignments of the accD protein sequences from Fabeae species.
Figure S6 | Alignments of the atpA protein sequences from Fabeae species.
Figure S7 | Alignments of the rps2 protein sequences from Fabeae species.
Figure S8 | Alignments of the matK protein sequences from Fabeae species.
Figure S9 | Alignments of the rbcL protein sequences from Fabeae species.
Figure S10 | Phylogenetic relationships based on the complete chloroplast genomes of twenty-two related species obtained by the neighbor joining (NJ) method. C. arietinum was selected as the outgroup.
Figure S11 | Phylogenetic relationships based on rbcL gene sequences of 50 Fabeae species, T. pretense and T. repens obtained by the neighbor joining (NJ) method. T. pretense and T. repens were selected as the outgroup.
Figure S12 | Phylogenetic relationships based on matK gene sequences of 62 Fabeae species, T. pretense and T. repens obtained by the neighbor joining (NJ) method. T. pretense and T. repens were selected as the outgroup.
Alikhan, N. F., Petty, N. K., Ben Zakour, N. L., Beatson, S. A. (2011). BLAST Ring Image Generator (BRIG): simple prokaryote genome comparisons. BMC Genomics 12, 402. doi: 10.1186/1471-2164-12-402
Asaf, S., Khan, A. L., Khan, M. A., Waqas, M., Kang, S. M., Yun, B. W., et al. (2017a). Chloroplast genomes of Arabidopsis halleri ssp gemmifera and Arabidopsis lyrata ssp petraea: structures and comparative analysis. Sci. Rep. 7, 7556. doi: 10.1038/s41598-017-07891-5
Asaf, S., Waqas, M., Khan, A. L., Khan, M. A., Kang, S. M., Imran, Q. M., et al. (2017b). The complete chloroplast genome of Wild Rice (Oryza minuta) and its comparison to related species. Front. Plant Sci. 8, 304. doi: 10.3389/fpls.2017.00304
Benson, G. (1999). Tandem repeats finder: a program to analyze DNA sequences. Nucleic Acids Res. 27, 573–580. doi: 10.1093/nar/27.2.573
Boetzer, M., Henkel, C. V., Jansen, H. J., Butler, D., Pirovano, W. (2011). Scaffolding pre-assembled contigs using SSPACE. Bioinformatics 27, 578–579. doi: 10.1093/bioinformatics/btq683
Bolger, A. M., Lohse, M., Usadel, B. (2014). Trimmomatic: a flexible trimmer for Illumina sequence data. Bioinformatics 30, 2114–2120. doi: 10.1093/bioinformatics/btu170
Butterworth, C. A., Cota-Sanchez, J. H., Wallace, R. S. (2002). Molecular systematics of Tribe Cacteae (Cactaceae: Cactoideae): a phylogeny based on rpl16 intron sequence variation. Syst. Bot. 27, 257–270. doi: 10.1043/0363-6445-27.2.257
Cauz-Santos, L. A., Munhoz, C. F., Rodde, N., Cauet, S., Santos, A. A., Penha, H. A., et al. (2017). The chloroplast genome of passiflora edulis (Passifloraceae) assembled from long sequence reads: structural organization and phylogenomic studies in malpighiales. Front. Plant Sci. 8, 334. doi: 10.3389/fpls.2017.00334
Cavalier-Smith, T. (2002). Chloroplast evolution: secondary symbiogenesis and multiple losses. Curr Biol. 12, R62–R64. doi: 10.1016/S0960-9822(01)00675-3
Darling, A. C., Mau, B., Blattner, F. R., Perna, N. T. (2004). Mauve: multiple alignment of conserved genomic sequence with rearrangements. Genome Res. 14, 1394–1403. doi: 10.1101/gr.2289704
dePamphilis, C. W., Young, N. D., Wolfe, A. D. (1997). Evolution of plastid gene rps2 in a lineage of hemiparasitic and holoparasitic plants: many losses of photosynthesis and complex patterns of rate variation. Proc. Natl. Acad. Sci. U. S. A. 94, 7367–7372. doi: 10.1073/pnas.94.14.7367
Dong, M., Zhou, X., Ku, W., Xui, Z. (2019). Detecting useful genetic markers and reconstructing the phylogeny of an important medicinal resource plant, Artemisia selengensis, based on chloroplast genomics. PloS One 14, e0211340. doi: 10.1371/journal.pone.0211340
Du, Q., Bi, G., Mao, Y., Sui, Z. (2016). The complete chloroplast genome of Gracilariopsis lemaneiformis (Rhodophyta) gives new insight into the evolution of family Gracilariaceae. J. Phycol. 52, 441–450. doi: 10.1111/jpy.12406
Erixon, P., Oxelman, B. (2008). Whole-gene positive selection, elevated synonymous substitution rates, duplication, and indel evolution of the chloroplast clpP1 gene. PloS One 3, e1386–e1386. doi: 10.1371/journal.pone.0001386
Fan, W. B., Wu, Y., Yang, J., Shahzad, K., Li, Z. H. (2018). Comparative Chloroplast Genomics of Dipsacales Species: Insights Into Sequence Variation, Adaptive Evolution, and Phylogenetic Relationships. Front. Plant Sci. 9, 689–689. doi: 10.3389/fpls.2018.00689
Frazer, K. A., Pachter, L., Poliakov, A., Rubin, E. M., Dubchak, I. (2004). VISTA: computational tools for comparative genomics. Nucleic Acids Res 32, W273–W279. doi: 10.1093/nar/gkh458
Gao, X., Zhang, X., Meng, H., Li, J., Zhang, D., Liu, C. (2018). Comparative chloroplast genomes of Paris Sect. Marmorata: insights into repeat regions and evolutionary implications. BMC Genomics 19, 878. doi: 10.1186/s12864-018-5281-x
Huang, D. I., Cronk, Q. C. B. (2015). Plann: a command-line application for annotating plastome sequences. Appl. In Plant Sci. 3, 1500026. doi: 10.3732/apps.1500026
Huang, Y. F., Gao, X. L., Nan, Z. B., Zhang, Z. X. (2017). Potential value of the common vetch (Vicia sativa L.) as an animal feedstuff: a review. J. Anim. Physiol. Anim. Nutrition 101, 807–823. doi: 10.1111/jpn.12617
Huang, L. S., Sun, Y. Q., Jin, Y., Gao, Q., Hu, X. G., Gao, F. L., et al. (2018). Development of high transferability cpSSR markers for individual identification and genetic investigation in Cupressaceae species. Ecol. Evol. 8, 4967–4977. doi: 10.1002/ece3.4053
Iberite, M., Abbate, G., Iamonico, D. (2017). Vicia incisa (Fabaceae): taxonomical and chorological notes. Annali Di Bot. 7, 57–65. doi: 10.4462/annbotrm-13842
Jaaska, V. (2015). Phylogenetic relationships among sections Vicia, Sepium and Lathyroides of Vicia subgenus Vicia: isozyme evidence. Biochem. Syst. Ecol. 62, 186–193. doi: 10.1016/j.bse.2015.08.002
Jansen, R. K., Raubeson, L. A., Boore, J. L., dePamphilis, C. W., Chumley, T. W., Haberle, R. C., et al. (2005). Methods for obtaining and analyzing whole chloroplast genome sequences. Methods In Enzymol. 395, 348–384. doi: 10.1016/s0076-6879(05)95020-9
Jansen, R. K., Cai, Z., Raubeson, L. A., Daniell, H., Depamphilis, C. W., Leebens-Mack, J., et al. (2007). Analysis of 81 genes from 64 plastid genomes resolves relationships in angiosperms and identifies genome-scale evolutionary patterns. Proc. Natl. Acad. Sci. U. S. A. 104, 19369–19374. doi: 10.1073/pnas.0709121104
Jansen, R. K., Wojciechowski, M. F., Sanniyasi, E., Lee, S.-B., Daniell, H. (2008). Complete plastid genome sequence of the chickpea (Cicer arietinum) and the phylogenetic distribution of rps12 and clpP intron losses among legumes (Leguminosae). Mol. Phylogenet. Evol. 48, 1204–1217. doi: 10.1016/j.ympev.2008.06.013
Katoh, K., Standley, D. M. (2013). MAFFT multiple sequence alignment software version 7: improvements in performance and usability. Mol. Biol. Evol. 30, 772–780. doi: 10.1093/molbev/mst010
Kelchner, S. A., Clark, L. G. (1997). Molecular evolution and phylogenetic utility of the chloroplast rpl16 intron in Chusquea and the Bambusoideae (Poaceae). Mol. Phylogenet. Evol. 8, 385–397. doi: 10.1006/mpev.1997.0432
Keller, J., Rousseau-Gueutin, M., Martin, G. E., Morice, J., Boutte, J., Coissac, E., et al. (2017). The evolutionary fate of the chloroplast and nuclear rps16 genes as revealed through the sequencing and comparative analyses of four novel legume chloroplast genomes from Lupinus. DNA Res. 24, 343–358. doi: 10.1093/dnares/dsx006
Kimura, M. (1980). A simple method for estimating evolutionary rates of base substitutions through comparative studies of nucleotide sequences. J. Mol. Evol. 16, 111–120. doi: 10.1007/bf01731581
Kruess, A., Tscharntke, T. (2000). Species richness and parasitism in a fragmented landscape: experiments and field studies with insects on Vicia sepium. Oecologia 122, 129–137. doi: 10.1007/pl00008829
Kumar, S., Stecher, G., Tamura, K. (2016). MEGA7: Molecular Evolutionary Genetics Analysis Version 7.0 for Bigger Datasets. Mol. Biol. Evol. 33, 1870–1874. doi: 10.1093/molbev/msw054
Kurtz, S., Choudhuri, J. V., Ohlebusch, E., Schleiermacher, C., Stoye, J., Giegerich, R. (2001). REPuter: the manifold applications of repeat analysis on a genomic scale. Nucleic Acids Res. 29, 4633–4642. doi: 10.1093/nar/29.22.4633
Lei, W. J., Ni, D. P., Wang, Y. J., Shao, J. J., Wang, X. C., Yang, D., et al. (2016). Intraspecific and heteroplasmic variations, gene losses and inversions in the chloroplast genome of Astragalus membranaceus. Sci. Rep. 6, 21669. doi: 10.1038/srep21669
Lenoir, L., Pihlgren, A. (2006). Effects of grazing and ant/beetle interaction on seed production in the legume Vicia sepium in a seminatural grassland. Ecol. Entomol. 31, 601–607. doi: 10.1111/j.1365-2311.2006.00818.x
Li, B., Lin, F., Huang, P., Guo, W., Zheng, Y. (2017). Complete chloroplast genome sequence of decaisnea insignis: genome organization, genomic resources and comparative analysis. Sci. Rep. 7, 10073. doi: 10.1038/s41598-017-10409-8
Li, C., Zhao, Y., Huang, H., Ding, Y., Hu, Y., Xu, Z. (2018). The complete chloroplast genome of an inverted-repeat-lacking species, Vicia sepium, and its phylogeny. Mitochondrial DNA Part B-Resour. 3, 137–138. doi: 10.1080/23802359.2018.1431071
Liu, C., Shi, L. C., Zhu, Y. J., Chen, H. M., Zhang, J. H., Lin, X. H., et al. (2012). CpGAVAS, an integrated web server for the annotation, visualization, analysis, and GenBank submission of completely sequenced chloroplast genome sequences. BMC Genomics 13, 715. doi: 10.1186/1471-2164-13-715
Lohse, M., Drechsel, O., Kahlau, S., Bock, R. (2013). OrganellarGenomeDRAW-a suite of tools for generating physical maps of plastid and mitochondrial genomes and visualizing expression data sets. Nucleic Acids Res. 41, W575–W581. doi: 10.1093/nar/gkt289
Luo, R. B., Liu, B. H., Xie, Y. L., Li, Z. Y., Huang, W. H., Yuan, J. Y., et al. (2012). SOAPdenovo2: an empirically improved memory-efficient short-read de novo assembler. GigaScience 1, 18. doi: 10.1186/2047-217x-1-18
Magee, A. M., Aspinall, S., Rice, D. W., Cusack, B. P., Semon, M., Perry, A. S., et al. (2010). Localized hypermutation and associated gene losses in legume chloroplast genomes. Genome Res. 20, 1700–1710. doi: 10.1101/gr.111955.110
Maršalkienė, N. (2016). Flowering spectrum diversity of Vicia sepium. Biologija 62, 116–123. doi: 10.6001/biologija.v62i2.3337
Martin, W., Deusch, O., Stawski, N., Grunheit, N., Goremykin, V. (2005). Chloroplast genome phylogenetics: why we need independent approaches to plant molecular evolution. Trends Plant Scie. 10, 203–209. doi: 10.1016/j.tplants.2005.03.007
Maxted, N. (1995). An ecogeographical study of Vicia subgenus vicia (Rome: International Plant Genetic Resources Institute).
Moner, A. M., Furtado, A., Chivers, I., Fox, G., Crayn, D., Henry, R. J. (2018). Diversity and evolution of rice progenitors in Australia. Ecol. Evol. 8, 4360–4366. doi: 10.1002/ece3.3989
Ochman, H., Wilson, A. C. (1987). Evolution in bacteria: evidence for a universal substitution rate in cellular genomes. J. Mol. Evol. 26, 74–86. doi: 10.1007/bf02111283
Pastor-Cavada, E., Juan, R., Pastor, J. E., Alaiz, M., Vioque, J. (2014). Protein and amino acid composition of select wild legume species of tribe Fabeae. Food Chem. 163, 97–102. doi: 10.1016/j.foodchem.2014.04.078
Sabir, J., Schwarz, E., Ellison, N., Zhang, J., Baeshen, N. A., Mutwakil, M., et al. (2014). Evolutionary and biotechnology implications of plastid genome variation in the inverted-repeat-lacking clade of legumes. Plant Biotechnol. J. 12, 743–754. doi: 10.1111/pbi.12179
Saina, J. K., Gichira, A. W., Li, Z. Z., Hu, G. W., Wang, Q. F., Liao, K. (2018). The complete chloroplast genome sequence of Dodonaea viscosa: comparative and phylogenetic analyses. Genetica 146, 101–113. doi: 10.1007/s10709-017-0003-x
Schaefer, H., Hechenleitner, P., Santos-Guerra, A., de Sequeira, M. M., Pennington, R. T., Kenicer, G., et al. (2012). Systematics, biogeography, and character evolution of the legume tribe Fabeae with special focus on the middle-Atlantic island lineages. BMC Evol. Biol. 12, 250. doi: 10.1186/1471-2148-12-250
Schnabel, A., Wendel, J. F. (1998). Cladistic biogeography of Gleditsia (Leguminosae) based on ndhF and rpl16 chloroplast gene sequences. Am. J. Bot. 85, 1753–1765. doi: 10.2307/2446510
Straub, S. C. K., Cronn, R. C., Edwards, C., Fishbein, M., Liston, A. (2013). Horizontal Transfer of DNA from the Mitochondrial to the Plastid Genome and Its Subsequent Evolution in Milkweeds (Apocynaceae). Genome Biol. Evol. 5, 1872–1885. doi: 10.1093/gbe/evt140
Sveinsson, S., Cronk, Q. (2016). Conserved gene clusters in the scrambled plastomes of IRLC legumes (Fabaceae: Trifolieae and Fabeae). bioRxiv 040188. doi: 10.1101/040188
Thiel, T., Michalek, W., Varshney, R. K., Graner, A. (2003). Exploiting EST databases for the development and characterization of gene-derived SSR-markers in barley (Hordeum vulgare L.). TAG. Theoretical and applied genetics. Theoretische und angewandte Genetik. 106, 411–422. doi: 10.1111/j.1556-4029.2011.01810.x
Timmis, J. N., Ayliffe, M. A., Huang, C. Y., Martin, W. (2004). Endosymbiotic gene transfer: organelle genomes forge eukaryotic chromosomes. Nat. Rev. Genet. 5, 123–135. doi: 10.1038/nrg1271
Wang, Y. H., Wicke, S., Wang, H., Jin, J. J., Chen, S. Y., Zhang, S. D., et al. (2018). Plastid Genome Evolution in the Early-Diverging Legume Subfamily Cercidoideae (Fabaceae). Front. Plant Sci. 9, 138. doi: 10.3389/fpls.2018.00138
Waterhouse, A. M., Procter, J. B., Martin, D. M. A., Clamp, M., Barton, G. J. (2009). Jalview Version 2-a multiple sequence alignment editor and analysis workbench. Bioinformatics 25, 1189–1191. doi: 10.1093/bioinformatics/btp033
Wicke, S., Schneeweiss, G. M., dePamphilis, C. W., Muller, K. F., Quandt, D. (2011). The evolution of the plastid chromosome in land plants: gene content, gene order, gene function. Plant Mol.Biol. 76, 273–297. doi: 10.1007/s11103-011-9762-4
Wolfe, K. H., Li, W. H., Sharp, P. M. (1987). Rates of nucleotide substitution vary greatly among plant mitochondrial, chloroplast, and nuclear DNAs. Proc. Natl. Acad. Sci. U. S. A. 84, 9054–9058. doi: 10.1073/pnas.84.24.9054
Wu, Z. Q., Gu, C. H., Tembrock, L. R., Zhang, D., Ge, S. (2017). Characterization of the whole chloroplast genome of Chikusichloa mutica and its comparison with other rice tribe (Oryzeae) species. PLoS One 12, e0177553. doi: 10.1371/journal.pone.0177553
Wu, Y., Liu, F., Yang, D.-G., Li, W., Zhou, X.-J., Pei, X.-Y., et al. (2018). Comparative chloroplast genomics of gossypium species: insights into repeat sequence variations and phylogeny. Front. Plant Sci. 9, 376. doi: 10.3389/fpls.2018.00376
Wyman, S. K., Jansen, R. K., Boore, J. L. (2004). Automatic annotation of organellar genomes with DOGMA. Bioinformatics 20, 3252–3255. doi: 10.1093/bioinformatics/bth352
Xia, X. H. (2017). DAMBE6: new tools for microbial genomics, phylogenetics, and molecular evolution. J. Hered. 108, 431–437. doi: 10.1093/jhered/esx033
Xie, D. F., Yu, Y., Deng, Y. Q., Li, J., Liu, H. Y., Zhou, S. D., et al. (2018). Comparative Analysis of the chloroplast genomes of the Chinese endemic genus urophysa and their contribution to chloroplast phylogeny and adaptive evolution. Int. J. Mol. Sci. 19, 1847. doi: 10.3390/ijms19071847
Yang, Z., Nielsen, R. (1998). Synonymous and nonsynonymous rate variation in nuclear genes of mammals. J. Mol. Evol. 46, 409–418. doi: 10.1007/pl00006320
Yi, X., Gao, L., Wang, B., Su, Y. J., Wang, T. (2013). The complete chloroplast genome sequence of Cephalotaxus oliveri (Cephalotaxaceae): evolutionary comparison of cephalotaxus chloroplast DNAs and Insights into the loss of inverted repeat copies in gymnosperms. Genome Biol. Evol. 5, 688–698. doi: 10.1093/gbe/evt042
Yin, D. M., Wang, Y., Zhang, X. G., Ma, X. L., He, X. Y., Zhang, J. H. (2017). Development of chloroplast genome resources for peanut (Arachis hypogaea L.) and other species of Arachis. Sci. Rep. 7, 11649. doi: 10.1038/s41598-017-12026-x
Yin, K. Q., Zhang, Y., Li, Y. J., Du, F. K. (2018). Different natural selection pressures on the atpF gene in evergreen sclerophyllous and deciduous oak species: evidence from comparative analysis of the complete chloroplast genome of quercus aquifolioides with other oak species. Int. J. Mol. Sci. 19, 1042. doi: 10.3390/ijms19041042
Zhang, W., Zhao, Y. L., Yang, G. Y., Tang, Y. C., Xu, Z. G. (2017). Characterization of the complete chloroplast genome sequence of Camellia oleifera in Hainan, China. Mitochondrial DNA Part B-Resour. 2, 843–844. doi: 10.1080/23802359.2017.1407687
Keywords: chloroplast genome, comparative analysis, phylogenetic analysis, positive selection, Vicia sepium
Citation: Li C, Zhao Y, Xu Z, Yang G, Peng J and Peng X (2020) Initial Characterization of the Chloroplast Genome of Vicia sepium, an Important Wild Resource Plant, and Related Inferences About Its Evolution. Front. Genet. 11:73. doi: 10.3389/fgene.2020.00073
Received: 08 October 2018; Accepted: 22 January 2020;
Published: 20 February 2020.
Edited by:
Ancha Baranova, George Mason University, United StatesReviewed by:
Aleksandar M. Mikich, Independent Researcher, Novi Sad, SerbiaCopyright © 2020 Li, Zhao, Xu, Yang, Peng and Peng. This is an open-access article distributed under the terms of the Creative Commons Attribution License (CC BY). The use, distribution or reproduction in other forums is permitted, provided the original author(s) and the copyright owner(s) are credited and that the original publication in this journal is cited, in accordance with accepted academic practice. No use, distribution or reproduction is permitted which does not comply with these terms.
*Correspondence: Zhenggang Xu, cnNzcTE5ODY3N0AxNjMuY29t
Disclaimer: All claims expressed in this article are solely those of the authors and do not necessarily represent those of their affiliated organizations, or those of the publisher, the editors and the reviewers. Any product that may be evaluated in this article or claim that may be made by its manufacturer is not guaranteed or endorsed by the publisher.
Research integrity at Frontiers
Learn more about the work of our research integrity team to safeguard the quality of each article we publish.