
94% of researchers rate our articles as excellent or good
Learn more about the work of our research integrity team to safeguard the quality of each article we publish.
Find out more
ORIGINAL RESEARCH article
Front. Genet. , 04 February 2020
Sec. Livestock Genomics
Volume 11 - 2020 | https://doi.org/10.3389/fgene.2020.00020
 Jennifer L. Doyle1,2
 Donagh P. Berry1
 Roel F. Veerkamp3Tara R. Carthy1
 Siobhan W. Walsh2Ross D. Evans3,4
 Deirdre C. Purfield1*
Linear type traits describing the skeletal characteristics of an animal are moderately to strongly genetically correlated with a range of other performance traits in cattle including feed intake, reproduction traits and carcass merit; thus, type traits could also provide useful insights into the morphological differences among animals underpinning phenotypic differences in these complex traits. The objective of the present study was to identify genomic regions associated with five subjectively scored skeletal linear traits, to determine if these associated regions are common in multiple beef and dairy breeds, and also to determine if these regions overlap with those proposed elsewhere to be associated with correlated performance traits. Analyses were carried out using linear mixed models on imputed whole genome sequence data separately in 1,444 Angus, 1,129 Hereford, 6,433 Charolais, 8,745 Limousin, 1,698 Simmental, and 4,494 Holstein-Friesian cattle, all scored for the linear type traits. There was, on average, 18 months difference in age at assessment of the beef versus the dairy animals. While the majority of the identified quantitative trait loci (QTL), and thus genes, were both trait-specific and breed-specific, a large-effect pleiotropic QTL on BTA6 containing the NCAPG and LCORL genes was associated with all skeletal traits in the Limousin population and with wither height in the Angus. Other than that, little overlap existed in detected QTLs for the skeletal type traits in the other breeds. Only two QTLs overlapped the beef and dairy breeds; both QTLs were located on BTA5 and were associated with height in both the Angus and the Holstein-Friesian, despite the difference in age at assessment. Several detected QTLs in the present study overlapped with QTLs documented elsewhere that are associated with carcass traits, feed intake, and calving difficulty. While most breeding programs select for the macro-traits like carcass weight, carcass conformation, and feed intake, the higher degree of granularity with selection on the individual linear type traits in a multi-trait index underpinning the macro-level goal traits, presents an opportunity to help resolve genetic antagonisms among morphological traits in the pursuit of the animal with optimum performance metrics.
Linear type traits have been used in both beef and dairy cattle since the early 20th century to characterize the skeletal characteristics of an animal (Berry et al., 2019). These type traits have previously been identified as being moderately to strongly genetically correlated with a range of performance traits in cattle including feed intake (Veerkamp and Brotherstone, 1997; Crowley et al., 2011), reproductive traits (Berry et al., 2004; Wall et al., 2005; Carthy et al., 2016), carcass merit (Mukai et al., 1995; Berry et al., 2019), animal value (Mc Hugh et al., 2010), and health (Ring et al., 2018). As type trait measurements are typically taken when an animal is young (Doyle et al., 2018), they may be useful as early predictors of the correlated traits which are often measured later in life or after the animal is slaughtered. While type traits are also moderately to strongly correlated with live-weight (Mc Hugh et al., 2010; Berry et al., 2019) and carcass weight (Conroy et al., 2010), none of these correlations are unity, implying that two animals with the same weight may be morphologically very different; for example, a tall animal with a short back may have the same (carcass) weight as a short animal with a long back. Therefore, including linear type traits in future genetic and genomic evaluations as part of a multi-trait evaluation including also the goal trait of interest may provide additional information over and above what could be gleaned from the goal trait alone.
While many genomic studies have been carried out on stature in both beef and dairy cattle (Pryce et al., 2011; Bolormaa et al., 2014), few studies have been published on the underlying genomic features contributing to differences in other skeletal linear type traits in either beef (Vallée et al., 2016) or dairy (Cole et al., 2011; Wu et al., 2013; Sahana et al., 2015) cattle. No previous study has attempted to identify quantitative trait loci (QTL) associated with the skeletal traits in multiple breeds or to compare and contrast detected QTLs to previously identified QTLs associated with correlated complex phenotypes such as carcass merit, feed intake and efficiency, and calving performance. Therefore, the objective of the present study was to identify genomic regions associated with five subjectively scored skeletal linear traits to determine if these associated regions are common in multiple beef and dairy breeds and also to determine if these regions overlapped with previously identified QTLs associated with other correlated performance traits.
Animal Care and Use Committee approval was not obtained for the present study as the data were obtained from the existing Irish Cattle Breeding Federation (ICBF) national database1.
Routine scoring of linear type traits is carried out on both registered and commercial beef herds by trained classifiers from the Irish Cattle Breeding Federation as part of the Irish national beef breeding program (Mc Hugh et al., 2010; Berry and Evans, 2014). Five skeletal type traits scored on a scale of 1 to 10 on beef cattle describing the wither height (WH), back length (BL), chest depth (CD), chest width (CW), and hip width (HW) were included for analysis in the present study (Supplementary Table S1). Data on these linear type traits were available on 147,704 purebred Angus (AA), Charolais (CH), Hereford (HE), Limousin (LM), or Simmental (SI) beef cattle, all scored between the ages of 6 and 16 months between the years 2000 and 2016, with only one (i.e., the first) record per animal retained.
Animals were discarded from the dataset if the sire, dam, herd, or classifier was unknown. Only data from classifiers that scored ≥ 100 animals since the year 2000 were kept. Animals were also discarded from the dataset if the parity of the dam was unknown; parity of the dam was subsequently recoded into 1, 2, 3, 4, and ≥ 5. Contemporary group was defined as herd-by-scoring date generated separately per breed. Each contemporary group had to have at least five records. Following edits, data were available on 81,200 animals, aged between 6 and 16 months, consisting of 3,356 AA, 31,049 CH, 3,004 HE, 35,159 LM, and 8,632 SI.
Scoring of linear type traits in the Irish dairy herd is undertaken by trained classifiers from the Irish Holstein-Friesian Association (Berry et al., 2004). For the purpose of the present study, three skeletal linear type traits that closely align to one of the five beef skeletal traits were selected for analysis. These traits were stature (STA which is comparable to WH in beef), rump width (RW which is comparable to HW in beef), and chest width (CWD which is comparable to CW in beef). In dairy cattle, these traits were scored on a scale of 1 to 9 (Supplementary Table S2) with the direction of scale the same as the comparable traits in the beef herd. Linear type trait information on 239,776 first parity cows was available between the years 2000 and 2016; only the first record per cow was retained.
Animals were discarded from the dataset if the sire, dam, herd, or classifier was unknown. Records were also discarded from the data set if scored after 10 months of lactation. Only data from classifiers that scored > 100 animals since the year 2000 were retained. Contemporary group was defined as herd-by-scoring date and each contemporary group had to have at least five records. Following edits, data were available on 117,151 primiparous Holstein-Friesian cows (HF) aged between 23 and 42 months at scoring.
Prior to inclusion in the analysis, all beef cattle phenotypes were adjusted, within breed, in ASREML (Gilmour et al., 2009) using the model:
yijklm = μ + HSDm + Sexj + AMk + DPl + animali + eijklm
where yijklm is the linear type trait, μ represents the population mean, HSDm is the fixed effect of herd-by-scoring date (m = 11,130 levels), Sexj is jth sex of the animal (male or female), AMk is the fixed effect of the age in months of the animal (k = 11 classes from 6 to 16 months), DPl is the fixed effect of the parity of the dam (l = 1, 2, 3, 4, and ≥5), animali is the random additive effect of animal i, and eijklm is the random residual effect. The adjusted phenotype was the raw phenotype less the fixed effect solutions of HSD, Sex, AM, and DP.
The dairy phenotypes were also adjusted in ASREML (Gilmour et al., 2009) using the model:
yijklm = μ + HSDm + AMj + CMk + LSl + animali + eijklm
where yijklm is the linear type trait, μ represents the population mean, HSDm is the fixed effect of herd-by-scoring date (m = 9,591 levels), AMj is the fixed effect of the age in months of the animal at scoring (j = 20 levels from 23 to 42 months), CMk is the fixed effect of the month of calving (k = 12 levels from 1 to 12), LSl if the fixed effect of the stage of lactation of the animals (l = 10 levels from 1 to 10 reflecting number of months of lactation), animali is the random additive effect of animal i, and eijklm is the random residual effect. The adjusted phenotype was the raw phenotype less the fixed effect solutions of HSD, AM, CM, and LS.
Of the edited dataset of 81,200 beef animals and 117,151 dairy animals with linear type trait information, 23,943 animals from six breeds (1,444 AA, 6,433 CH, 1,129 HE, 8,745 LM, 1,698 SI, and 4,494 HF) also had genotype information available. These genotypes were imputed to whole genome sequence (WGS) as part of a larger dataset of 638,662 genotyped animals from multiple breeds as detailed by Purfield et al. (2019). All 638,662 genotyped animals were genotyped using either the Bovine Illumina SNP50 (n = 5,808; 54,001 SNPs), the Illumina High Density (HD; n = 5,504; 777,972 SNPs), the Illumina 3k panel (n = 2,256, 2,900 SNPs), the Illumina LD genotyping panel (n = 15,107, 6,909 SNPs) or a bespoke genotype panel (IDB) developed in Ireland (Mullen et al., 2013) which was either on version 1 (n = 28,288; 17,137 SNPs), version 2 (n = 147,235; 18,004 SNPs) or version 3 (n = 434,464; 53,450 SNPs). Each animal had a call rate ≥ 90%. Only autosomal SNPs, SNPs with a call rate ≥ 90% and those with a known chromosome and position on UMD 3.1 were retained for imputation.
Imputation to HD was carried out on all genotyped animals using a two-step approach in FImpute2 with pedigree information (Sargolzaei et al., 2014); this involved imputing animals genotyped on the 3k, LD, or IDB panels to the Bovine SNP50 density and subsequently imputing all resulting genotypes (including the Bovine SNP50 genotypes) to HD using a multi-breed reference population of 5,504 influential sires genotyped on the HD panel. Imputation to WGS was then undertaken using a reference population of 2,333 Bos Taurus animals of multiple breeds from Run6.0 of the 1000 Bulls Genomes Project by first phasing all 638,662 imputed HD genotypes using Eagle (version 2.3.2; Loh et al., 2016) and subsequently imputing to WGS using minimac3 (Das et al., 2016).
Quality control edits were imposed on the imputed sequence genotypes within each of the six breeds separately; all SNPs with a minor allele frequency (MAF) ≤ 0.002 were removed and regions of poor WGS imputation accuracy, identified using 147,309 verified parent-progeny relationships as previously described by Purfield et al. (2019), were then removed. Following all SNP edits, 16,342,970, 17,733,147, 16,638,022, 17,803,135, 17,762,681, and 15,542,919 autosomal SNPs remained for analysis in the AA, CH, HE, LM, SI and HF populations, respectively.
The association analyses were performed, within each breed separately, using a mixed linear model in Genome-wide Complex Trait Analysis (GCTA) (Yang et al., 2011). Autosomal SNPs from the original HD density panel (i.e., 734,159 SNPs) were used to construct the genomic relationship matrix (Yang et al., 2010). The model used for the within-breed analysis was:
where y is a vector of preadjusted phenotypes, μ is the overall mean, x is the vector of imputed genotypes, b is the additive fixed effect of the candidate SNP to be tested for association, u ∼ N(0,G) is the vector of additive genetic effects, where G is the genomic relationship matrix calculated from the imputed HD SNP genotypes, and is the additive genetic variance, and e ∼ N(0,I) is the vector of random residual effects, with I representing the identity matrix and the residual variance.
A significance threshold of p ≤ 1 × 10⁻⁸ and a suggestive threshold of p ≤ 1 × 10⁻⁵ was applied genome-wide for each SNP in each trait as per Wang et al. (2016). Significant and/or suggestive SNPs that were within 500 kb of each other were classed as being within the same QTL. Genes within these QTLs were then identified using Ensembl 94 (Zerbino et al., 2017) on the UMD 3.1 bovine genome assembly. Cattle QTLdb2 was used to identify if any of the QTLs identified within the present study had previously been associated with any other traits in beef or dairy cattle. To identify QTL regions that were suggestive in more than 1 breed, each chromosome was split into 1 kb genomic windows and windows containing suggestive SNPs (p ≤ 1 × 10⁻⁵) were compared across the breeds.
The proportion of genetic variance of a trait explained by a SNP was calculated as:
where p is the frequency of the minor allele,a is the allele substitution effect and is the genetic variance of the trait in question as calculated from the association analyses.
Following the within breed analyses, meta-analyses were conducted for CD and BL across the five beef breeds and for WH, CW, and HW across all six breeds using the weighted Z-score method in METAL (Willer et al., 2010). METAL uses the p-values and the direction of SNP effects from the individual analysis and weights the individual studies based on the sample size to calculate an overall Z-score:
where w is the square root of the sample size of the ith breed, and z is the z-score for the ith breed calculated as zi = ϕ(−1) (1−Pi/2)Δi, where Φ is the cumulative distribution function, and Pi and Δi are the P-value and direction of effect for breed i, respectively.
Enrichment analysis was carried out among all suggestive and significant SNPs within each trait and each breed separately to estimate if the number of SNPs in each annotation class was greater than what would be expected by chance (Bouwman et al., 2018):
where a is the number of suggestive and/or significant SNPs in the annotation class of interest, b is the total number of suggestive and/or significant SNPs that were associated, c is the total number of SNPs in the annotation class in the association analysis, and d is the overall number of SNPs included in the association analysis.
The scale of measurement, number of records, mean, and standard deviation of the linear type traits in each breed is in the Supplementary Tables S1, S2. The average age of the beef cattle at measurement was 10 months, while the average age of the dairy cows was 28 months; hence there was, on average, an 18-month difference in age at classification between the dairy and beef populations. Significant (p ≤ 1 × 10⁻⁸) and/or suggestive (p ≤ 1 × 10⁻⁵) SNPs were detected for all of the traits in all six breeds; however, the exact locations of these SNPS, and the direction of the effects of these SNPs, differed by breed.
No 1 kb genomic window associated with height was common to all six breeds. There was, however, some overlap in suggestive 1 kb windows between the AA and LM where 79 suggestive windows located on BTA6 were common to both breeds (Supplementary Figure S1). Six genes were identified within these windows on BTA6 including NCAPG and LCORL. There were also two suggestive 1 kb windows located at approximately 94.9 Mb on BTA5 common to both the AA and HF.
The strongest associations in both the AA and LM were intergenic variants located in QTLs surrounding the NCAPG and LCORL genes on BTA6 (Table 1 and Supplementary Figure S2) and accounted for 0.6 and 0.04% of the genetic variation in WH in the AA and LM, respectively. Five intronic variants and three downstream gene variants located within the LCORL gene, and 12 intronic variants located within the NCAPG gene, were suggestively associated in the AA (p < 9.18 × 10⁻⁶) and significantly associated in the LM (p < 1.29 × 10⁻¹²). Interestingly, the positive (i.e., taller) allele of these SNPs occurred at similar frequencies (0.08–0.09) in both the AA and LM and had a similar effect size in both breeds. In comparison, while these SNPs were segregating in both the HE and HF, and had similar allele frequencies in the HE as in the AA and LM, none of these SNPs were near significance in either the HE (p > 0.11) or HF (p > 0.88). However, a suggestive association was detected 21 Mb further upstream of LCORL on BTA6 in the HF where the strongest association within this QTL, rs209851496 (p = 1.94 × 10⁻⁶), was located 1kb upstream of the CHRNA9 gene.
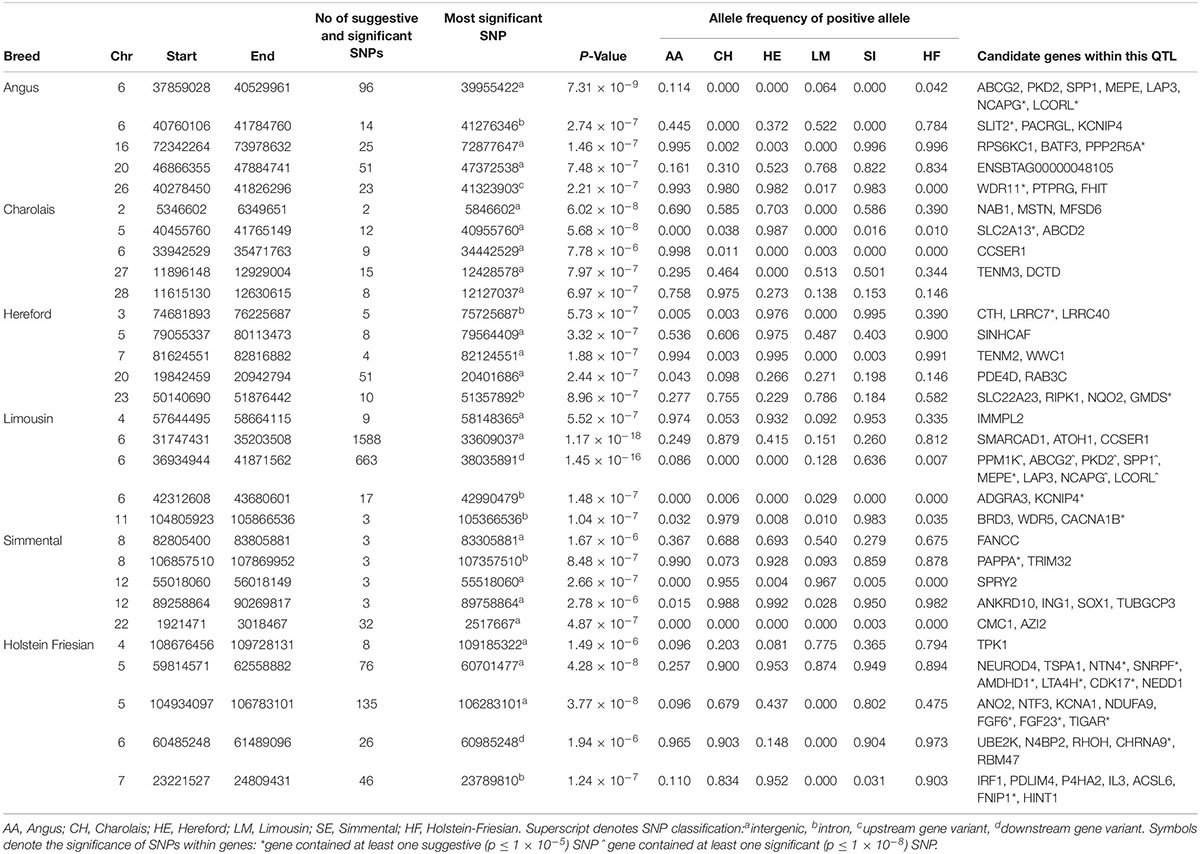
Table 1. The location of the most significant QTLs, limited to the top 5, which were associated with wither height or stature, and the genes located within these QTLs within each breed.
Of the 514 SNPs that were suggestively associated with stature in the HF, 281 were located on BTA5. Both the AA and HF had suggestive associations on this autosome; two intergenic SNPs, rs798298008 (AA) and rs475950607 (HF), located just 17 bp apart and 63 Kb from the PTPRO gene, were associated with WH in these breeds. The strongest associations in the remaining breeds were all intergenic SNPs, although their location differed by chromosome; the strongest association in the CH was on BTA2 in a 1 Mb QTL containing MSTN; the strongest association in the HE was in BTA7, with the strongest association for the SI located on BTA12.
There were 1,055 suggestive and 36 significant SNPs associated with WH in the meta-analysis (Supplementary Table S3). A single QTL on BTA15 containing multiple plausible candidate genes, such as ALKBH8 and RAB39A, was the only QTL identified that had not previously been associated with WH in any of the within-breed analyses.
The window-based analyses revealed no 1 kb genomic region suggestively associated with CW in more than one breed (Supplementary Figure S1). Similar to WH, BTA6 harbored the strongest QTL association with CW in the LM. This QTL, which also encompassed the NCAPG/LCORL complex, contained 34 suggestively associated SNPs, of which the strongest (rs110194711) was in the MEPE gene. A similar genomic region on BTA6 was also associated with CW in the HE, suggesting that the QTL region on BTA6 may harbor an across-breed pleiotropic association since it was also associated with WH in the AA and LM. Although four of the 6 breeds (AA, CH, HE, and HF) had QTLs on BTA10 suggestively associated with CW (Table 2 and Supplementary Figure S3), these all differed in their location across the chromosome which may suggest that BTA10 contains multiple genomic regions influencing CW.
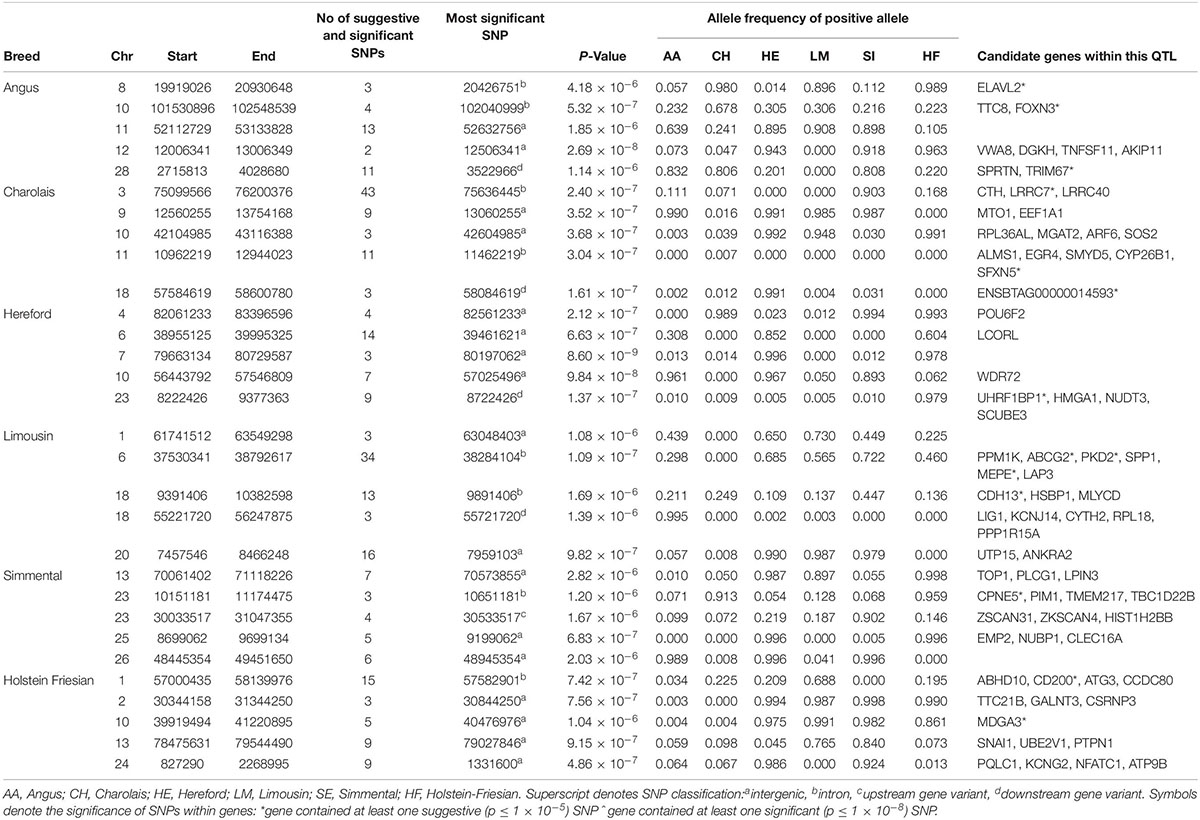
Table 2. The location of the most significant QTLs, limited to the top 5, which were associated with chest width, and the genes located within these QTLs within each breed.
The meta-analysis of all 23,943 animals failed to identify a genomic region significantly associated with CW, but 170 SNPs were suggestively associated (Supplementary Table S3). The majority of these associations were singular SNPs, although peaks of suggestive association were detected on BTA1, BTA2, BTA8, BTA16, and BTA19.
There were no 1 kb suggestive windows common to any of the breeds associated with width of hips. The QTL on BTA6 surrounding the NCAPG and LCORL genes was again significant in the LM although it failed to reach significance in the remaining five breeds (Table 3 and Supplementary Figure S4). Of the 222 SNPs suggestively associated with HW in the HE population, 52% were located in a QTL on BTA4 surrounding the CLEC5A gene. Although MSTN may have been expected to influence HW in the CH, the QTL on BTA2 associated with HW was located much further down-stream, between 30.21 and 31.26 Mb (Table 3). Several plausible candidate genes were located within this QTL on BTA2 including multiple voltage−gated sodium−channel genes, TTC21B, and CSRNP3; nonetheless only 0.07% of the genetic variation in HW was explained by the strongest association within this QTL. In the HF, the most significant SNP associated with RW was an intergenic SNP, rs382714953 (2.03 × 10⁻⁷), located on BTA20.
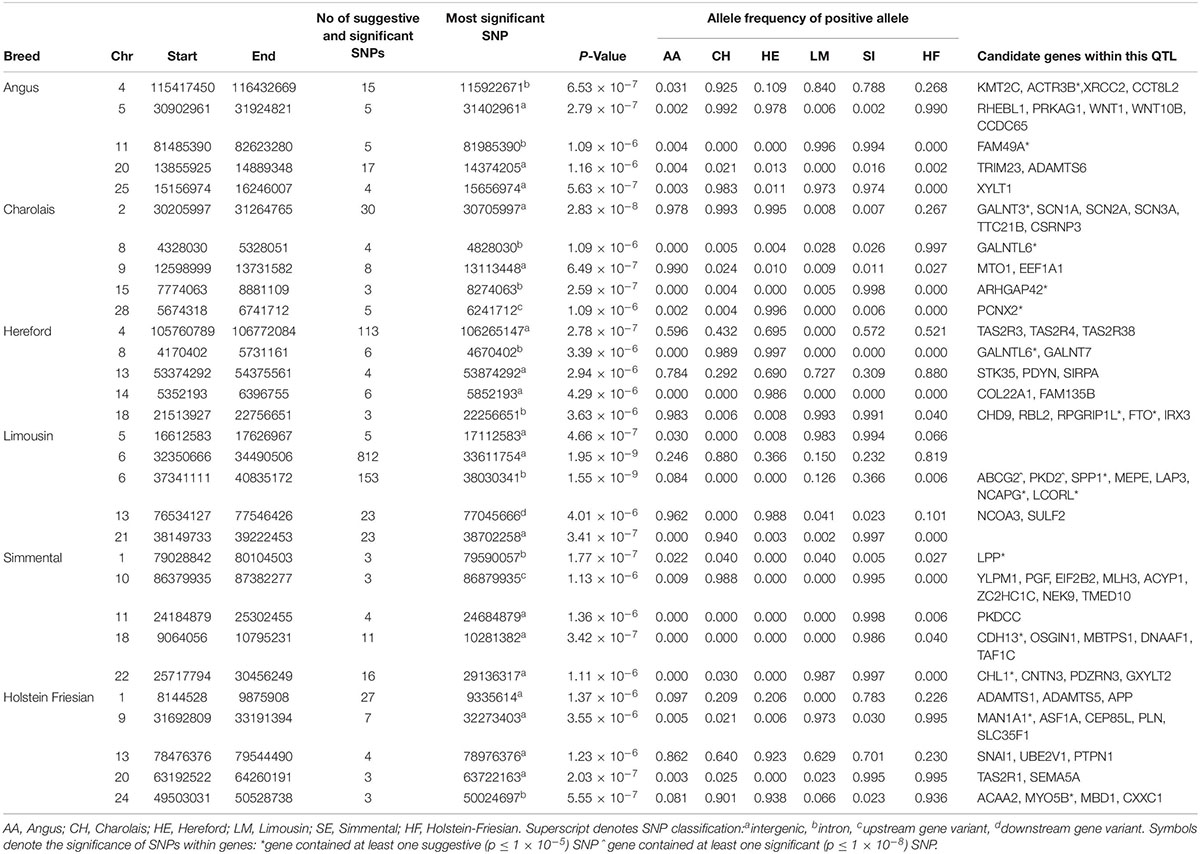
Table 3. The location of the most significant QTLs, limited to the top 5, which were associated with hip width or rump width, and the genes located within these QTLs within each breed.
In comparison to WH and CW, the lead variant within the top five QTLs associated with HW in the AA, CH, HE and SI breeds was near fixation (Table 3). All of the lead variants in the top five QTLs in the SI breed were close to the fixation for the positive (i.e., wider) allele in the SI and fixed for the negative (i.e., narrower) allele in the HE. In contrast, the frequency of the positive alleles for each of the lead variants identified in the LM population ranged from low to moderate.
In the meta-analysis of HW and RW, suggestively associated QTL were located on BTA11, BTA15, BTA18, and BTA23 (Supplementary Table S3); none of these QTL had been previously identified in the individual breed analyses but they contained multiple possible candidate genes including FKBP1P, CDH13, HSPB1, DNAAF1, and PSMB9.
The window-based analyses revealed that no 1kb genomic region was suggestively associated with BL in all breeds, but 40 1 kb windows on BTA6 surrounding the NCAPG and LCORL genes were suggestively associated with BL in both the AA and LM (Supplementary Figure S1). In total, 96 SNPs within a QTL spanning from 37.9 to 40.4 Mb on BTA6 were suggestively associated with BL in the AA, of which 12 SNPs were either intronic SNPs, or downstream or upstream variants of the NCAPG and LCORL genes. In the LM, the most strongly associated SNP, rs110343895 (p = 4.24 × 10⁻¹³), was an intronic SNP located within NCAPG (Table 4 and Supplementary Figure S5). In total, seven SNPs located within the NCAPG gene and 15 SNPs within the LCORL gene were suggestively associated with BL in the LM. Of the 33 potentially disruptive variants within the NCAPG and LCORL complex that were tested for association, six were segregating in the LM population but none were significant. LM animals that had at least one copy of the minor allele for the top three associated SNPs, rs465117501, rs378370406 or rs110343895, within the NCAPG and LCORL complex had a longer back, 0.37 (SE = 0.18) units longer on average, than those with two copies of the major allele.
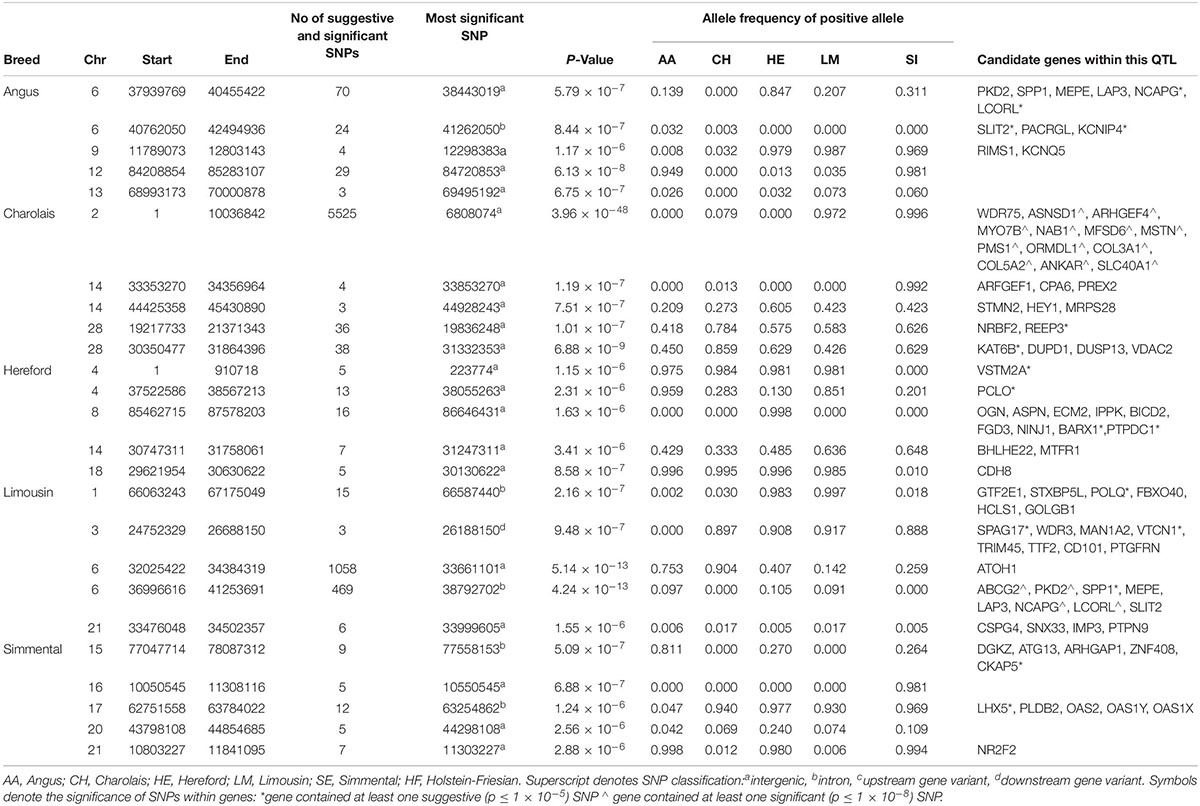
Table 4. The location of the most significant QTLs, limited to the top 5, which were associated with back length, and the genes located within these QTLs within each breed.
A QTL on BTA2 was significantly associated with BL in the CH; this QTL stretched 10 Mb and contained 1,765 significant and 3,760 suggestive SNPs (Table 4). Fifty significant and 12 suggestive SNPs within this QTL were located within the MSTN gene; these SNPs included the well-known Q204X stop-gain mutation, rs110344317 (p = 2.01 × 10⁻³⁵). When Q204X was forced into the model as a fixed effect, the most significant of the remaining SNPs on BTA2 generally reduced in significance relative to when Q204X was not included in the model. The most significant SNP on BTA2 after accounting for the variability in the Q204X genotype was rs41638272, an intergenic SNP located 15 kb from the SLC40A1 gene. The QTL associated with BL also overlapped the QTL on BTA2 associated with WH suggesting this QTL may play a major role in affecting the morphology of an animal. No other significant associations with BL were identified in any of the remaining beef breeds.
In the meta-analysis of BL, significantly associated QTLs were identified on BTA2 and BTA6, similar to what was identified in the CH and LM breeds, respectively (Supplementary Table S3). Other QTLs on BTA12 and BTA13 were also associated with BL; the QTL on BTA13 contained numerous possible candidate genes including DNTTIP1, TNNC2, PLTP, and CDH22 while no obvious candidate genes were identified on BTA12.
No suggestive or significant 1kb window associated with CD was common to more than one breed (Supplementary Figure S1). Only a single QTL on BTA6 containing the NCAPG and LCORL genes in LM was significantly associated with any of the breeds for CD (Table 5 and Supplementary Figure S6), suggesting that CD has a highly polygenic architecture in the beef breeds. Four of the five lead variants identified within the top five QTLs associated with CD in the AA were near fixation for the negative (i.e., narrower) allele while four of the five lead variants associated in the SI were close to fixation for the positive (i.e., deeper) allele. Only 90 SNPs were suggestively associated with CD in the CH, of which 19 were located on BTA10, but the proportion of genetic variance accounted for by the strongest association on this autosome was minimal (0.001%).
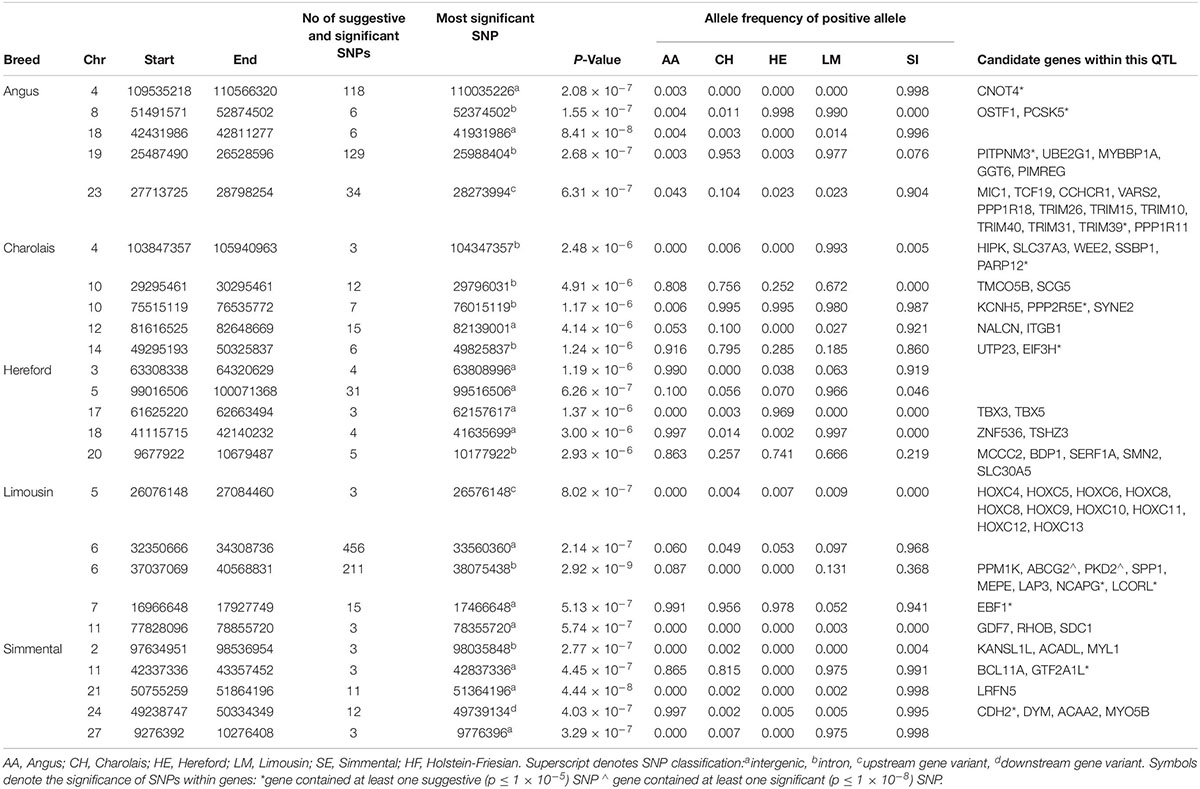
Table 5. The location of the most significant QTLs, limited to the top 5, which were associated with chest depth, and the genes located within these QTLs within each breed.
In the meta-analysis, three SNPs were identified to be significantly associated with CD while 249 SNPs were suggestively associated. Three QTLs associated with CD in the meta-analysis were not significant in any of the single breed analyses and were located on BTA1, BTA5, and BTA13 (Supplementary Table S3 and Supplementary Figure S7).
Quantitative trait loci associated with two or more skeletal traits were identified within each breed (Supplementary Figures S3, S8). The NCAPG and LCORL genes were identified as pleiotropic genes associated with all five traits in the LM breed and with both WH and BL in the AA breed. There were also suggestive genomic windows in common between CW and HW in the AA with five windows on BTA4 and a single window on BTA8 being common to both of these traits. These five windows on BTA4 contained six SNPs that were suggestively associated with both CW and HW; all six of these SNPs were intronic SNPs located within the ENSBTAG00000008032 gene. No gene was located within the 1kb window on BTA8.
A greater overlap in QTLs associated with both WH and BL was identified in the CH and HE. Ten 1 kb windows were associated with both WH and BL in the CH, nine of which were located on BTA28. Eight 1 kb windows overlapped between WH and BL in the HE with 6 windows located on BTA23 encompassing the GMDS gene. Further overlap among traits was identified in the CH breed where three windows on BTA9 and three windows on BTA19 were associated with both WH and CW. The SI breed had the fewest number of pleiotropic associations of all beef breeds, as only one window on BTA12 near the SPRY2 gene was suggestively associated with both WH and BL. The only overlap in associated QTLs between the beef and dairy breeds was in WH/Stature between the AA and HF. These breeds had two overlapping 1 kb windows on BTA5 but no obvious candidate genes were identified in this region.
Intergenic SNPs were the most common annotation class of SNPs associated with each trait in each breed. This annotation class was enriched for all traits in the HE, four traits in the LM (WH, BL, CD, and HW), three traits in the SI (WH, CW, and CD) and AA (WH, BL, and HW), and two in both the CH (WH and BL) and HF (CWD and RW; Table 6). The second most common annotation was the intronic SNPs; this class was enriched for three traits in the AA (CW, CD, and HW) and CH (BL, CW, and HW) and two traits in the SI (BL and HW). Downstream gene variants were enriched in all breeds for CW and at least one breed for all the remaining traits (Table 6). Stop-gain SNPs that were significantly associated with BL were enriched in all breeds in which they were associated.
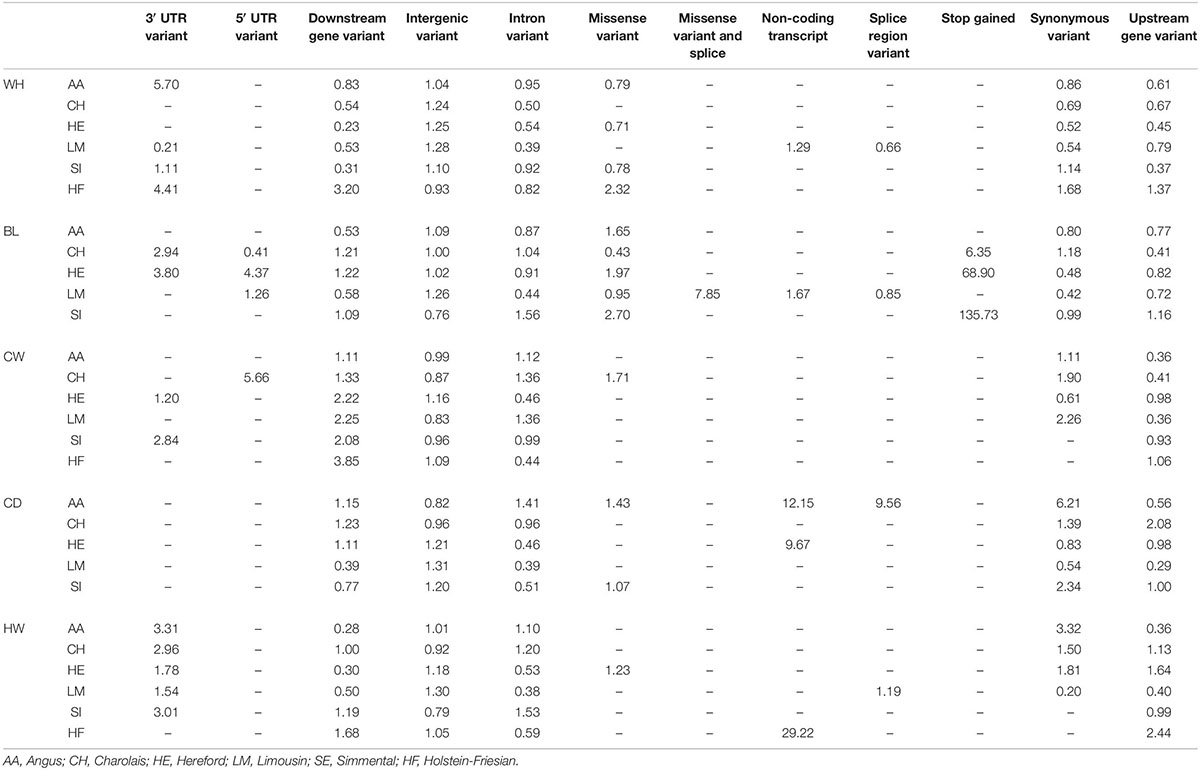
Table 6. Fold enrichment/depletion of SNPs in each annotation class in each trait in each breed.
Several QTLs were discovered in the present study to be associated with each of the skeletal type traits although the majority of these regions, excluding the NCAPG/LCORL locus in the LM population, were unique to a single trait or a single breed. This indicates the existence of breed-specific and trait-specific QTL for skeletal traits, which has implications for the usefulness of such QTL in across-breed genomic evaluations where only purebreds are used. Previous studies have documented both across-breed and breed-specific QTL associated with carcass traits, birth weight, weaning weight, and mature weight (Saatchi et al., 2014b), as well as dry matter intake, growth and feed efficiency (Saatchi et al., 2014a), carcass traits (Purfield et al., 2019), and muscular type traits (Doyle et al., 2020) in beef cattle. Excluding stature (Bouwman et al., 2018), the present study is the first published genome study on the skeletal linear type traits in beef cattle using imputed sequence data and is one of few genome-based studies comparing QTLs across multiple breeds of cattle. The present study, however, also incorporated imputed genome sequence information on 4,494 dairy cattle to compare to the beef animals. This comparison is rarely carried out (Purfield et al., 2015) as such multi-breed data are not always readily available for incorporation into the same study. Nonetheless, the difference in age at classification between the beef and dairy animals varied substantially with the beef animals all being < 16 months and the dairy animals > 23 months when assessed. Previous heritability estimates of the linear type traits assessed in the dairy cows were all ≥ 0.26 (Berry et al., 2004) indicating these traits are expected to be moderately to highly repeatable over time. This was substantiated by the fact that some common QTL were detected for Angus and Holstein-Friesian.
An earlier study on the beef cattle population from the dataset used in the present study (Doyle et al., 2018) summarized the heritability estimates of, and genetic correlations among, the skeletal type traits in each breed. In general, the genetic variance within each trait and the correlations between each trait differed by breed indicating that breed-specific and trait-specific QTL may be underlying these traits. Similarities were observed between the CH and LM in terms of heritability estimates and genetic correlations (Doyle et al., 2018); from this it was theorized that the genetic architecture of these breeds may be quite similar. The present study is an advanced version of this study (Doyle et al., 2018) where the contributors to the genetic variation within and across breeds have been identified.
Type traits have previously been proposed as potential early predictors of carcass weight and conformation (Conroy et al., 2010) and of overall carcass merit (Berry et al., 2019) given the genetic correlations between these traits and linear type traits are generally moderate to strong. However, as these correlations are not unity, two animals with the same live-weight may be morphologically very different which may lead to very different carcass value owing to the distribution of primal cuts (Berry et al., 2019). Therefore, type traits may be useful in future multi-trait genetic and genomic evaluations as they provide more information than live-weight alone. Consequently, knowledge of the QTLs associated with the skeletal traits could be used in these genome-based evaluations as part of a multi-trait evaluation targeting the altering of the morphology of an animal to increase the output of the goal trait (high quality primal cuts) thus improving the profitability of the farm system.
In total, over 90% of the QTLs identified in the present study have been previously documented to be associated with other production traits in beef or dairy cattle when compared to those within the Cattle QTLdb database (Accessed 08 January 2019). Of the top 140 QTLs associated with the skeletal type traits (Tables 2–6), 80 of these had previously been identified as being associated with body weight at either birth (Lu et al., 2013), as a yearling (Snelling et al., 2010), as a weanling (Saatchi et al., 2014b), at slaughter (Sherman et al., 2008), or at maturity (Saatchi et al., 2014b). Furthermore, some of the top 140 QTLs were also previously associated with carcass weight (McClure et al., 2010; Saatchi et al., 2014a) and residual feed intake (Nkrumah et al., 2007; Lu et al., 2013; Saatchi et al., 2014a) in cattle. Nineteen QTLs identified in the present study have also been identified previously as being associated with linear type traits describing the muscular characteristics of cattle (Doyle et al., 2020).
With the exception of the NCAPG and LCORL genes, the majority of QTLs associated with the skeletal type traits were breed-specific and in many cases, also trait specific. The differences observed in associated QTLs among the breeds may be due to epistatic or gene-by-environment interactions, or simply due to differences in the power to detect significance due to the large differences in population sizes among the breeds (Saatchi et al., 2014b). The age difference between the dairy and beef animals when classified may also have contributed to some of the inconsistencies in discovered QTL between the dairy and beef cattle. In many cases, the SNPs detected to associate with a trait in one breed were not segregating in all five breeds. Observed differences in detected QTL among the breeds may also be due to limitations in imputation where the imputed genotypes may not be perfect; this may result in the causal SNP not being identified as the most significant association especially if that SNP is rare in the populations (Bouwman et al., 2018).
Both NCAPG and LCORL are widely accepted as being associated with stature in many mammals including cattle (Bouwman et al., 2018), humans (Gudbjartsson et al., 2008), and horses (Tetens et al., 2013); therefore it was not unexpected that these genes were associated with all the skeletal traits in the LM population and with BL and WH in the AA. The NCAPG and LCORL genes have also been previously linked to growth and carcass traits in the SI (Zhang et al., 2018), carcass weight in the AA, CH, and LM (Purfield et al., 2019), and with both feed intake and body weight gain in a population containing 14 different breeds of cattle (Lindholm-Perry et al., 2011). Interestingly, the QTL containing NCAPG and LCORL was not associated with any of the skeletal traits evaluated in the SI or HF even though SNPs within these regions were segregating in both breeds. Although imputed sequence variants were used, we were unable to identify which of the two genes is causal; indeed none of the segregating missense variants within either gene were suggestively associated with any trait. However, a previous study that associated LCORL with growth and carcass traits in cattle, proposed that it is the non-coding and regulatory expression of LCORL that influences a trait (Han et al., 2017). This theory is further substantiated by the significant over-representation of the intergenic variant SNP class within the present study which suggests that it is the regulatory expression of many genes that influence animal morphology rather than the causative disruption of gene functionality.
Some skeletal linear type traits in beef cattle are moderately genetically correlated with carcass traits including carcass cut weights (Pabiou et al., 2012), primal cut yields (Berry et al., 2019), and rib and subcutaneous fat thickness (Mukai et al., 1995). Thus, it is not surprising that there was overlap among some of the QTLs associated with linear type traits in the present study with those previously reported for carcass traits. Across all breeds and traits, there were 22 QTLs associated with the skeletal type traits in the present study that have been previously associated with carcass weight (McClure et al., 2010; Nishimura et al., 2012; Sharma et al., 2014). Twelve of these QTLs were located on BTA6 and incorporated the NCAPG and LCORL genes. Interestingly, the NCAPG and LCORL genes, while being associated with size have also been associated with subcutaneous fat thickness in beef cattle (Lindholm-Perry et al., 2011). More overlap among the QTLs associated with the skeletal type traits and fat thickness was on BTA2, where a QTL containing MSTN which was associated with BL and WH in the CH has also been documented to be associated with fat thickness at the 12th rib (Casas et al., 1998).
In general, if an allele was associated with a wider or longer skeletal type trait, it also had the same effect direction on the other traits, i.e., if an allele was associated with wider CW it tended to be associated with deeper CD and vice versa. Interestingly, this was not always the case for the alleles associated with WH and BL indicating that some alleles associated with taller WH were associated with shorter BL; thus, the correlation between these two traits (Doyle et al., 2018) could be broken leading to a morphologically different animal. The knowledge of SNPs and QTLs that influence one or more traits of interest (e.g., a longer back but with better muscling) would enable the selection for the desired trait combinations despite any genetic antagonisms. Furthermore, including traits such as WH and BL in a multi-trait genetic evaluation for terminal beef cattle, along with the other trait of interests (e.g., carcass weight, carcass conformation, and carcass fat) would provide more information on an animal’s carcass and conformation than what is possible from the carcass traits alone.
Feed intake is both genetically and phenotypically correlated with body weight and average daily gain (Arthur et al., 2001; Crowley et al., 2010); on average, bigger, heavier cattle tend to eat more. Feed is generally the greatest cost associated with beef production (Montano-Bermudez et al., 1990); thus, improvements in the efficiency of which feed is utilized should contribute to greater economic returns in the whole beef production system (Archer et al., 1999). Difficulty in selection for feed efficiency is mainly due to a lack of genetic evaluations for feed intake; data are generally readily available for the energy sink components of feed efficiency and thus selection for feed efficiency is being hindered by data on feed intake (or correlated traits). Feed intake is linked to the morphology of an animal (Crowley et al., 2011). While genomic evaluations for feed intake could be useful, the reference population required to generate accurate genomic evaluations are few. Having knowledge of potential QTLs associated with feed intake, discovered using much larger datasets on correlated traits (i.e., the present study), could be used as prior information in such genomic evaluations (MacLeod et al., 2016); the correlated traits could also be considered in a multi-trait genomic evaluation.
Among the QTLs associated with at least one of the skeletal type traits, 51 QTLs were previously identified as being associated with feed intake (Nkrumah et al., 2007; Sherman et al., 2010; Lindholm-Perry et al., 2011; Lu et al., 2013; Saatchi et al., 2014a) while 80 were previously identified as being associated with body weight at various stages of the animal’s life (Sherman et al., 2008; Snelling et al., 2010; Saatchi et al., 2014a) and body weight gain (Snelling et al., 2010). Given the generally small dataset sizes used in genomic analyses of feed intake traits, the QTL detected from the present study could actually be used as prior information in Bayesian-type analyses for genomic analyses (including genomic predictions) for traits like feed intake where the dataset size is limiting; such an approach could be deployed using models similar to those proposed by MacLeod et al. (2016).
The difficulty or ease of calving has long been thought to be related to the conformation of the dam (Ali et al., 1984) and the size of the calf (Sieber et al., 1989). Cows with wider hips and long rumps generally have larger internal pelvic openings which in turn lead to an easier calving; cows with smaller pelvic areas have more difficulty calving (Ali et al., 1984). Moreover, bigger, heavier calves are often more difficult to calve than their smaller, lighter counterparts (Sieber et al., 1989). It is, therefore, no surprise that 58 QTLs associated with the skeletal (i.e., size) type traits have previously been documented to be associated with calving difficulty in cattle (Purfield et al., 2015; Sahana et al., 2015). Seven of these 58 QTLs were associated with HW or RW in the present study; these QTLs were located on BTA1 in AA, BTA14 in HE, BTA6, BTA13, and BTA21 in LM, BTA10 in SI, and BTA1 in HF. None of the lead SNPs in these QTLs were segregating in all six breeds and a number of the lead SNPs were close to fixation for either the positive (i.e., wider hips) or negative (i.e., narrower hips) allele depending on the breed. Knowledge of the underlying quantitative trait variant associated with different morphological characteristics facilitates the development of more precise mating advice systems, over and above consideration of the holistic calving difficulty estimate breeding values based on genome-wide quantitative trait variants. For example, the choice of mate for a female with a genetic predisposition for a wide pelvic area is likely to differ from that of a female with a narrower pelvic area; knowledge of genetic merit of the mate for different skeletal characteristics, even with the same estimated breeding value for calving difficulty, should be exploited in the decision.
It has long been hypothesized that many genes, each with a small effect size, underlie complex traits that do not exhibit simple Mendelian inheritance (Fisher, 1918). In recent years, and with the advancement of genomic technology, many studies have reported that even the most significant loci across the genome associated with a trait have small effect sizes and only explain a small percentage of the predicted genetic variance (Wood et al., 2014; Boyle et al., 2017). The term omnigenic has been used to describe the phenomenon whereby a very large number of genes with seemingly no relevance to the trait of interest are associated with that trait due to being in the same regulatory networks as the relevant genes (Boyle et al., 2017). The results of the individual genome-based analyses in the present study, where many SNPs of small effect, often located within regulatory regions were associated with each trait within each breed, confirms that a complex omnigenic genetic architecture underlies the skeletal type traits in the six cattle breeds.
Despite millions of SNPs being tested for associations with each of the skeletal traits investigated, only 140 of the SNPs suggestively or significantly associated with a trait were located within the coding regions of the genome. The majority (i.e., 57.2%) of SNPs associated with any trait were intergenic SNPs; the number of intergenic SNPs and also 3′ UTR and 5′ UTR variants were enriched for the majority of traits they were associated with in each breed, demonstrating the importance of regulatory networks within the genome to the cattle skeletal traits. Inference could also be drawn, therefore, on the contribution of regulatory regions to the correlated traits like carcass merit and feed intake. Downstream and upstream gene variants were also enriched in many of the traits. In general, the SNPs located within, or close to, the genes identified as candidate genes were located within these non-coding or regulatory regions. For example, 22 SNPs that were suggestively or significantly associated with WH in the LM were located within the LCORL/NCAPG gene; 19 of these were intronic variants and three were downstream gene variants. Thus regulatory non-coding regions, while not having an effect on the coding sequence of a gene, may be of particular importance for cattle skeletal development via the proposed omnigenic model (Boyle et al., 2017).
While many QTLs were identified as being associated with each trait in each breed, a large-effect QTL on BTA6 containing the NCAPG and LCORL genes was the only QTL associated with more than two traits and in more than one breed. This indicates that while the NCAPG and LCORL genes may affect multiple traits in multiple breeds, the majority of QTLs underlying the skeletal type traits are both trait-specific and breed-specific. This has implications on the perceived usefulness of across-breed genomic evaluations for the component traits as well as possibly for their correlated economically important traits (e.g., carcass merit, feed intake) based solely on purebreds. Many of the QTLs identified in the present study have previously been documented to be associated with a number of other performance traits in cattle, including carcass traits, feed intake and calving difficulty.
Sequence variant genotypes were provided by participation in the 1000 Bulls Consortium and a subset of the sequences can be found at NCBI BioProject PRJNA238491, PRJEB9343, PRJNA176557, PRJEB18113, PRNJA343262, PRJNA324822, PRJNA324270, PRJNA277147, PRJNA474946, and PRJEB5462.
Ethical review and approval was not required for the animal study because as the data were obtained from the existing Irish Cattle Breeding Federation (ICBF) national database (http://www.icbf.com).
JD, DB, RV, and DP participated in the design of the study and were involved in the interpretation of the results. JD performed the analyses and wrote the first draft of the manuscript. All authors read and approved the final manuscript.
This work was funded in part by a research grant from Science Foundation Ireland, award number 14/IA/2576, as well as a research grant from Science Foundation Ireland and the Department of Agriculture, Food and the Marine on behalf of the Government of Ireland under the Grant 16/RC/3835 (VistaMilk, Dublin, Ireland).
The authors declare that the research was conducted in the absence of any commercial or financial relationships that could be construed as a potential conflict of interest.
The authors would like to thank the 1000 Bull Genomes Consortium for the reference population used to impute genotypes to sequence.
The Supplementary Material for this article can be found online at: https://www.frontiersin.org/articles/10.3389/fgene.2020.00020/full#supplementary-material
Ali, T. E., Burnside, E., and Schaeffer, L. (1984). Relationship between external body measurements and calving difficulties in Canadian Holstein-Friesian cattle. J. Dairy Sci. 67, 3034–3044. doi: 10.3168/jds.s0022-0302(84)81669-0
Archer, J., Richardson, E., Herd, R., and Arthur, P. (1999). Potential for selection to improve efficiency of feed use in beef cattle: a review. Aust. J. Agric. Res. 50, 147–162.
Arthur, P., Archer, J., Johnston, D., Herd, R., Richardson, E., and Parnell, P. (2001). Genetic and phenotypic variance and covariance components for feed intake, feed efficiency, and other postweaning traits in Angus cattle. J. Anim. Sci. 79, 2805–2811.
Berry, D. P., Buckley, R., Dillon, P., Evans, R. D., and Veerkamp, R. F. (2004). Genetic relationships among linear type traits, milk yield, body weight, fertility and somatic cell count in primiparous dairy cows. Ir. J. Agric. Food Res. 43, 161–176.
Berry, D. P., and Evans, R. D. (2014). Genetics of reproductive performance in seasonal calving beef cows and its association with performance traits. J. Anim. Sci. 92, 1412–1422. doi: 10.2527/jas2013-6723
Berry, D. P., Pabiou, T., Fanning, R., Evans, R. D., and Judge, M. M. (2019). Linear classification scores in beef cattle as predictors of genetic merit for individual carcass primal cut yields. J. Anim. Sci. 97, 2329–2341. doi: 10.1093/jas/skz138
Bolormaa, S., Pryce, J. E., Reverter, A., Zhang, Y., Barendse, W., Kemper, K., et al. (2014). A multi-trait, meta-analysis for detecting pleiotropic polymorphisms for stature, fatness and reproduction in beef cattle. PLoS Genet. 10:e1004198. doi: 10.1371/journal.pgen.1004198
Bouwman, A. C., Daetwyler, H. D., Chamberlain, A. J., Ponce, C. H., Sargolzaei, M., Schenkel, F. S., et al. (2018). Meta-analysis of genome-wide association studies for cattle stature identifies common genes that regulate body size in mammals. Nat. gen. 50, 362–367. doi: 10.1038/s41588-018-0056-5
Boyle, E. A., Li, Y. I., and Pritchard, J. K. (2017). An expanded view of complex traits: from polygenic to omnigenic. Cell 169, 1177–1186. doi: 10.1016/j.cell.2017.05.038
Carthy, T., Ryan, D., Fitzgerald, A., Evans, R., and Berry, D. P. (2016). Genetic relationships between detailed reproductive traits and performance traits in Holstein-Friesian dairy cattle. J. Dairy Sci. 99, 1286–1297. doi: 10.3168/jds.2015-9825
Casas, E., Keele, J., Shackelford, S., Koohmaraie, M., Sonstegard, T., Smith, T., et al. (1998). Association of the muscle hypertrophy locus with carcass traits in beef cattle. J. Anim. Sci. 76, 468–473.
Cole, J. B., Wiggans, G. R., Ma, L., Sonstegard, T. S., Lawlor, T. J., Crooker, B. A., et al. (2011). Genome-wide association analysis of thirty one production, health, reproduction and body conformation traits in contemporary U.S. Holstein cows. BMC Genomics 12:408. doi: 10.1186/1471-2164-12-408
Conroy, S., Drennan, M., Kenny, D., and McGee, M. (2010). The relationship of various muscular and skeletal scores and ultrasound measurements in the live animal, and carcass classification scores with carcass composition and value of bulls. Livestock Sci. 127, 11–21. doi: 10.1016/j.livsci.2009.06.007
Crowley, J., Evans, R., Mc Hugh, N., Pabiou, T., Kenny, D., McGee, M., et al. (2011). Genetic associations between feed efficiency measured in a performance test station and performance of growing cattle in commercial beef herds. J. Anim. Sci. 89, 3382–3393. doi: 10.2527/jas.2011-3836
Crowley, J., McGee, M., Kenny, D., Crews, D. Jr., Evans, R., and Berry, D. (2010). Phenotypic and genetic parameters for different measures of feed efficiency in different breeds of Irish performance-tested beef bulls. J. Anim. Sci. 88, 885–894. doi: 10.2527/jas.2009-1852
Das, S., Forer, L., Schönherr, S., Sidore, C., Locke, A. E., Kwong, A., et al. (2016). Next-generation genotype imputation service and methods. Nat. Genet. 48:1284. doi: 10.1038/ng.3656
Doyle, J. L., Berry, D. P., Veerkamp, R. F., Carthy, T. R., Evans, R. D., and Walsh, S. W., et al. (2020). Genomic regions associated with muscularity in beef cattle differ in five contrasting cattle breeds. Genet. Sel. Evol.
Doyle, J. L., Berry, D. P., Walsh, S. W., Veerkamp, R. F., Evans, R. D., and Carthy, T. R. (2018). Genetic covariance components within and among linear type traits differ among contrasting beef cattle breeds. J. Anim. Sci. 96, 1628–1639. doi: 10.1093/jas/sky076
Fisher, R. A. (1918). The correlation between relatives on the supposition of Mendelian inheritance. Earth Environ. Sci. Trans. R. Soc. Edinburgh 52, 399–433. doi: 10.1017/s0080456800012163
Gilmour, A. R., Gogel, B. J., Cullis, B. R., and Thompson, R. (2009). ASReml User Guide Release 3.0. United Kingdom: VSN International Ltd.
Gudbjartsson, D. F., Walters, G. B., Thorleifsson, G., Stefansson, H., Halldorsson, B. V., Zusmanovich, P., et al. (2008). Many sequence variants affecting diversity of adult human height. Nat. Genet. 40:609. doi: 10.1038/ng.122
Han, Y., Chen, Y., Liu, Y., and Liu, X. (2017). Sequence variants of the LCORL gene and its association with growth and carcass traits in Qinchuan cattle in China. J. Genet. 96, 9–17. doi: 10.1007/s12041-016-0732-0
Lindholm-Perry, A. K., Sexten, A. K., Kuehn, L. A., Smith, T. P., King, D. A., Shackelford, S. D., et al. (2011). Association, effects and validation of polymorphisms within the NCAPG-LCORL locus located on BTA6 with feed intake, gain, meat and carcass traits in beef cattle. BMC Genet. 12:103. doi: 10.1186/1471-2156-12-103
Loh, P.-R., Danecek, P., Palamara, P. F., Fuchsberger, C., Reshef, Y. A., Finucane, H. K., et al. (2016). Reference-based phasing using the Haplotype Reference Consortium panel. Nat. Genet. 48:1443. doi: 10.1038/ng.3679
Lu, D., Miller, S., Sargolzaei, M., Kelly, M., Vander Voort, G., Caldwell, T., et al. (2013). Genome-wide association analyses for growth and feed efficiency traits in beef cattle. J. Anim. Sci. 91, 3612–3633. doi: 10.2527/jas.2012-5716
MacLeod, I., Bowman, P., Vander Jagt, C., Haile-Mariam, M., Kemper, K., Chamberlain, A., et al. (2016). Exploiting biological priors and sequence variants enhances QTL discovery and genomic prediction of complex traits. BMC Genomics 17:144. doi: 10.1186/s12864-016-2443-6
Mc Hugh, N., Fahey, A., Evans, R., and Berry, D. P. (2010). Factors associated with selling price of cattle at livestock marts. Animal 4, 1378–1389. doi: 10.1017/S1751731110000297
McClure, M., Morsci, N., Schnabel, R., Kim, J., Yao, P., Rolf, M., et al. (2010). A genome scan for quantitative trait loci influencing carcass, post-natal growth and reproductive traits in commercial Angus cattle. Anim. Genet. 41, 597–607. doi: 10.1111/j.1365-2052.2010.02063.x
Montano-Bermudez, M., Nielsen, M., and Deutscher, G. (1990). Energy requirements for maintenance of crossbred beef cattle with different genetic potential for milk. J. Anim. Sci. 68, 2279–2288.
Mukai, F., Oyama, K., and Kohno, S. (1995). Genetic relationships between performance test traits and field carcass traits in Japanese Black cattle. Livestock Product. Sci. 44, 199–205. doi: 10.1016/0301-6226(95)00069-0
Mullen, M. P., McClure, M. C., Kearney, J. F., Waters, S. M., Weld, R., Flynn, P., et al. (2013). “Development of a custom SNP chip for dairy and beef cattle breeding, parentage and research,” in Proceedings of the Interbull Meeting, Nantes.
Nishimura, S., Watanabe, T., Mizoshita, K., Tatsuda, K., Fujita, T., Watanabe, N., et al. (2012). Genome-wide association study identified three major QTL for carcass weight including the PLAG1-CHCHD7 QTN for stature in Japanese Black cattle. BMC Genet. 13:40. doi: 10.1186/1471-2156-13-40
Nkrumah, J., Sherman, E., Li, C., Marques, E., Crews, D. Jr., Bartusiak, R., et al. (2007). Primary genome scan to identify putative quantitative trait loci for feedlot growth rate, feed intake, and feed efficiency of beef cattle. J. Anim. Sci. 85, 3170–3181. doi: 10.2527/jas.2007-0234
Pabiou, T., Fikse, W., Amer, P., Cromie, A., Näsholm, A., and Berry, D. P. (2012). Genetic relationships between carcass cut weights predicted from video image analysis and other performance traits in cattle. Animal 6, 1389–1397. doi: 10.1017/S1751731112000705
Pryce, J. E., Hayes, B. J., Bolormaa, S., and Goddard, M. E. (2011). Polymorphic regions affecting human height also control stature in cattle. Genetics 187, 981–984. doi: 10.1534/genetics.110.123943
Purfield, D. C., Bradley, D. G., Evans, R. D., Kearney, F. J., and Berry, D. P. (2015). Genome-wide association study for calving performance using high-density genotypes in dairy and beef cattle. Genet. Sel. Evol. 47:47. doi: 10.1186/s12711-015-0126-4
Purfield, D. C., Evans, R. D., and Berry, D. P. (2019). Reaffirmation of known major genes and the identification of novel candidate genes associated with carcass-related metrics based on whole genome sequence within a large multi-breed cattle population. BMC Genomics 20:720. doi: 10.1186/s12864-019-6071-9
Ring, S., Twomey, A., Byrne, N., Kelleher, M., Pabiou, T., Doherty, M., et al. (2018). Genetic selection for hoof health traits and cow mobility scores can accelerate the rate of genetic gain in producer-scored lameness in dairy cows. J. Dairy Sci. 101, 10034–10047. doi: 10.3168/jds.2018-15009
Saatchi, M., Beever, J. E., Decker, J. E., Faulkner, D. B., Freetly, H. C., Hansen, S. L., et al. (2014a). QTLs associated with dry matter intake, metabolic mid-test weight, growth and feed efficiency have little overlap across 4 beef cattle studies. BMC Genomics 15:1004. doi: 10.1186/1471-2164-15-1004
Saatchi, M., Schnabel, R. D., Taylor, J. F., and Garrick, D. J. (2014b). Large-effect pleiotropic or closely linked QTL segregate within and across ten US cattle breeds. BMC Genomics 15:442. doi: 10.1186/1471-2164-15-442
Sahana, G., Höglund, J. K., Guldbrandtsen, B., and Lund, M. S. (2015). Loci associated with adult stature also affect calf birth survival in cattle. BMC Genet. 16:47. doi: 10.1186/s12863-015-0202-3
Sargolzaei, M., Chesnais, J. P., and Schenkel, F. S. (2014). A new approach for efficient genotype imputation using information from relatives. BMC Genomics 15:478. doi: 10.1186/1471-2164-15-478
Sharma, A., Dang, C., Kim, K., Kim, J., Lee, H., Kim, H., et al. (2014). Validation of genetic polymorphisms on BTA 14 associated with carcass trait in a commercial H anwoo population. Anim. Genet. 45, 863–867. doi: 10.1111/age.12204
Sherman, E., Nkrumah, J., and Moore, S. (2010). Whole genome single nucleotide polymorphism associations with feed intake and feed efficiency in beef cattle. J. Anim. Sci. 88, 16–22. doi: 10.2527/jas.2008-1759
Sherman, E., Nkrumah, J., Murdoch, B., Li, C., Wang, Z., Fu, A., et al. (2008). Polymorphisms and haplotypes in the bovine neuropeptide Y, growth hormone receptor, ghrelin, insulin-like growth factor 2, and uncoupling proteins 2 and 3 genes and their associations with measures of growth, performance, feed efficiency, and carcass merit in beef cattle. J. Anim. Sci. 86, 1–16. doi: 10.2527/jas.2006-799
Sieber, M., Freeman, A., and Kelley, D. (1989). Effects of body measurements and weight on calf size and calving difficulty of Holsteins. J. Dairy Sci. 72, 2402–2410. doi: 10.3168/jds.s0022-0302(89)79373-5
Snelling, W., Allan, M., Keele, J., Kuehn, L., Mcdaneld, T., Smith, T., et al. (2010). Genome-wide association study of growth in crossbred beef cattle. J. Anim. Sci. 88, 837–848. doi: 10.2527/jas.2009-2257
Tetens, J., Widmann, P., Kühn, C., and Thaller, G. (2013). A genome-wide association study indicates LCORL/NCAPG as a candidate locus for withers height in German Warmblood horses. Anim. Genet. 44, 467–471. doi: 10.1111/age.12031
Vallée, A., Daures, J., van Arendonk, J., and Bovenhuis, H. (2016). Genome-wide association study for behavior, type traits, and muscular development in Charolais beef cattle. J. Anim. Sci. 94, 2307–2316. doi: 10.2527/jas.2016-0319
Veerkamp, R. F., and Brotherstone, S. (1997). Genetic correlations between linear type traits, food intake, live weight and condition score in Holstein Friesian dairy cattle. Anim. Sci. 64, 385–392. doi: 10.1017/S1357729800015976
Wall, E., White, I., Coffey, M., and Brotherstone, S. (2005). The relationship between fertility, rump angle, and selected type information in Holstein-Friesian cows. J. Dairy Sci. 88, 1521–1528. doi: 10.3168/jds.s0022-0302(05)72821-6
Wang, X., Tucker, N. R., Rizki, G., Mills, R., Krijger, P. H., de Wit, E., et al. (2016). Discovery and validation of sub-threshold genome-wide association study loci using epigenomic signatures. eLife 5:e10557. doi: 10.7554/eLife.10557
Willer, C. J., Li, Y., and Abecasis, G. R. (2010). METAL: fast and efficient meta-analysis of genomewide association scans. Bioinformatics 26, 2190–2191. doi: 10.1093/bioinformatics/btq340
Wood, A. R., Esko, T., Yang, J., Vedantam, S., Pers, T. H., Gustafsson, S., et al. (2014). Defining the role of common variation in the genomic and biological architecture of adult human height. Nat. Genet. 46:1173. doi: 10.1038/ng.3097
Wu, X., Fang, M., Liu, L., Wang, S., Liu, J., Ding, X., et al. (2013). Genome wide association studies for body conformation traits in the Chinese Holstein cattle population. BMC Genomics 14:897. doi: 10.1186/1471-2164-14-897
Yang, J., Benyamin, B., McEvoy, B. P., Gordon, S., Henders, A. K., Nyholt, D. R., et al. (2010). Common SNPs explain a large proportion of the heritability for human height. Nat. Genet. 42:565. doi: 10.1038/ng.608
Yang, J., Lee, S. H., Goddard, M. E., and Visscher, P. M. (2011). GCTA: a tool for genome-wide complex trait analysis. Am. J. Hum. Genet. 88, 76–82. doi: 10.1016/j.ajhg.2010.11.011
Zerbino, D. R., Achuthan, P., Akanni, W., Amode, M. R., Barrell, D., Bhai, J., et al. (2017). Ensembl 2018. Nucleic Acids Res. 46, D754–D761.
Keywords: cattle, genome-wide association study, linear type traits, single nucleotide polymorphism, skeletal, sequence
Citation: Doyle JL, Berry DP, Veerkamp RF, Carthy TR, Walsh SW, Evans RD and Purfield DC (2020) Genomic Regions Associated With Skeletal Type Traits in Beef and Dairy Cattle Are Common to Regions Associated With Carcass Traits, Feed Intake and Calving Difficulty. Front. Genet. 11:20. doi: 10.3389/fgene.2020.00020
Received: 27 October 2019; Accepted: 07 January 2020;
Published: 04 February 2020.
Edited by:
Tad Stewart Sonstegard, Recombinetics (United States), United StatesReviewed by:
Matthew Charles McClure, United States Department of Agriculture, United StatesCopyright © 2020 Doyle, Berry, Veerkamp, Carthy, Walsh, Evans and Purfield. This is an open-access article distributed under the terms of the Creative Commons Attribution License (CC BY). The use, distribution or reproduction in other forums is permitted, provided the original author(s) and the copyright owner(s) are credited and that the original publication in this journal is cited, in accordance with accepted academic practice. No use, distribution or reproduction is permitted which does not comply with these terms.
*Correspondence: Deirdre C. Purfield, ZGVpcmRyZS5wdXJmaWVsZEBjaXQuaWU=
Disclaimer: All claims expressed in this article are solely those of the authors and do not necessarily represent those of their affiliated organizations, or those of the publisher, the editors and the reviewers. Any product that may be evaluated in this article or claim that may be made by its manufacturer is not guaranteed or endorsed by the publisher.
Research integrity at Frontiers
Learn more about the work of our research integrity team to safeguard the quality of each article we publish.