 Jiahui Wan
94% of researchers rate our articles as excellent or good
Learn more about the work of our research integrity team to safeguard the quality of each article we publish.
Find out more
ORIGINAL RESEARCH article
Front. Genet. , 21 February 2020
Sec. Computational Genomics
Volume 10 - 2019 | https://doi.org/10.3389/fgene.2019.01377
Long noncoding RNAs (lncRNAs) play important roles in the regulation of gene expression by acting as competing endogenous RNAs (ceRNAs). However, the roles of lncRNA-associated ceRNAs in oncogenesis are not fully understood. The present study aims to determine whether a ceRNA network can serve as a prognostic marker in human prostate cancer (PCa). In order to identify a ceRNA network and the key lncRNAs in PCa, we constructed a differentially expressed lncRNAs (DELs)–differentially expressed miRNAs (DEMis)–differentially expressed mRNAs (DEMs) regulatory network based on the ceRNA theory using data from the Cancer Genome Atlas (TCGA). We found that the DELs–DEMis–DEMs network was composed of 27 DELs nodes, seven DEMis nodes, and three DEMs nodes. The 27 DELs were further analyzed with several public databases to provide meaningful information for understanding the functional roles of lncRNAs in regulatory networks in PCa. We selected ADAMTS9-AS1 to determine its role in PCa and found that ADAMTS9-AS1 significantly influences tumor cell growth and proliferation, suggesting that it plays a tumor suppressive role. In addition, ADAMTS9-AS1 functioned as ceRNA, effectively becoming a sponge for hsa-mir-96 and modulating the expression of PRDM16. These results suggest that ceRNAs could accelerate biomarker discovery and therapeutic strategies for PCa.
Prostate cancer (PCa) is a common malignancy of the urinary and reproductive systems. Since the late 1980s and early 1990s, the incidence and mortality of PCa have soared worldwide (Bray et al., 2013; Smith et al., 2017). The Cancer Statistics report has revealed an expected 174,650 new cases of PCa and 31,620 deaths in the United States (Siegel et al., 2019). In China, poor dietary habits including excessive consumption of animal fat and reduced fiber intake have led to an increasing number of PCa patients. PCa ranks 7th in incidence and 10th in mortality among malignant tumors in China (Zhang et al., 2017). Due to the lack of obvious symptoms during early-stage PCa, it is often overlooked, which results in reduced treatment success. Unfortunately, the molecular mechanisms underlying PCa metastasis are not known and thus relevant targets to effectively predict PCa progression are lacking. Therefore, investigating the molecular mechanisms of PCa has gained much attention.
Long noncoding RNAs (lncRNAs) are longer than 200 nucleotides in length and are of much recent interest (Ling et al., 2015). LncRNAs play important roles in cancer, such as chromatin remodeling and transcriptional and post-transcriptional regulation (Fatima et al., 2015; Yarmishyn and Kurochkin, 2015; Wu and Hann, 2018). The most recognized molecular mechanism of lncRNA is to act as a microRNA “sponge” that regulates the activity of mRNAs, and thus lncRNAs are also referred to as competing endogenous RNAs (ceRNAs) (Salmena et al., 2011; Karreth et al., 2015). ceRNAs are involved in the pathology of various tumors, including colorectal cancer (Chen et al., 2017), breast cancer (Wang et al., 2017), and non-small cell lung cancer (Qu et al., 2017). However, the role of ceRNAs in PCa remains unclear.
To investigate the significance of lncRNAs, miRNAs, and mRNAs in PCa, we downloaded gene expression data from the TCGA project webpage (https://www.cancer.gov/about-nci/organization/ccg/research/structural-genomics/tcga), including 499 PCa samples and 52 matched normal samples up to April 9th, 2018.
TCGA RNA-Seq raw data was performed with package edgeR. The P-value was set at 0.01 and the log2 fold change was set at 2. The data was presented as a heatmap plot and volcano map. Based on the analysis of DELs, DEMis, and DEMs, a correlation analysis was conducted on each significant DELs, DEMis, and DEMs.
Based on the relationship between DELs, DEMis, and DEMs, the ceRNA network was constructed in three steps: 1) PCa-specific RNA (DELs, DEMis, and DEMs) filtration: to maximize data reliability, gene matrix was converted to gene ID by Ensembl (http://asia.ensembl.org/index.html); 2)DELs-DEMis interactions were predicted using miRcode (http://www.mircode.org/); 3) miRDB (http://www.mirdb.org/), miRTarBase (http://mirtarbase.mbc.nctu.edu.tw/), and Targetscan (http://www.targetscan.org/) were used to predict the DEMs targeted by DEMis. Furthermore, DEMis that regulated the expression of both DELs and DEMs were selected for construction of the ceRNA network. The ceRNA relationships were integrated using an in-house Perl script and R package. Cytoscape v3.0 was used to construct and visualize the ceRNA network.
The online database GEPIA (http://gepia.cancer-pku.cn) is an interactive web server for analyzing RNA sequencing expression based on TCGA and GTEx projects. We obtained the significant lncRNA ADAMTS9-AS1 in PCa via the database. The gene ontology (GO) analysis was performed for the functional annotation of ADAMTS9-AS1. The pathways that ADAMTS9-AS1 mainly participated in were investigated by KEGG pathway analysis. GO terms and pathways with a P value < 0.01 were considered significant. Both GO and KEGG pathway analyses were carried out in the Database for circlncRNAnet (http://app.cgu.edu.tw/circlnc/).
The human PCa cell line DU145 was obtained from the Cell Bank of the Chinese Academy of Science (Shanghai, China). The cell lines were cultured in RPMI1640 medium supplemented with 10% fetal bovine serum (Gibco), 100 U/ml penicillin, and 100 mg/ml streptomycin (Gibco) at 37°C in humidified air containing 5% of CO2.
Total RNA was isolated using Trizol reagent (Invitrogen). First strand cDNA was generated using the Reverse EasyScript One Step gDNA Removal and cDNA Synthesis SuperMix (Trangene). qRT-PCR was performed using SYBR Green Master Mixture (Roche) reagent in an ABI7500 real-time PCR instrument. GAPDH was used as an internal control. The relative levels of gene expression were calculated by the 2−ΔΔCt method. qRT-PCR primers were as follows: ADAMTS9-AS1 forward 5’-CTCAGACCACAACTCTCCACCTTG-3’, reverse 5’-CAGATGCTGCCTGGCTGATGG-3’; PRDM16 forward: 5’-ATGTATGAGCCCAACCGGGA-3’, reverse 5’-AGCTCGAAGTCTGCTGGGAT’; GAPDH forward 5’-GAAGGTCGGAGTCAACGGATT-3’, reverse 5’-CGCTCCTGGAAGATGGTGAT-3’. All experiments were performed in triplicate.
Small interfering siRNAs specifically targeting ADAMTS9-AS1 were synthesized by Shanghai Gene Pharma Co, Ltd. siRNA sequences for ADAMTS9-AS1: siRNA 1, 5′-GGAATTCAAGCTTCTACAA-3′; siRNA 2, 5′-CCACTGAACACATAAACAT-3′; siRNA 3, 5′-GGACTTGCAACTGTGACTT-3′; negative control: 5′-UUCUCCGAACGUGUCACGUTT-3′. siRNA plasmids were transfected into cells using Lipofectamine TM 2000 (Invitrogen, Carlsbad, CA, USA) and were incubated for 24 h according to the manufacturer’s instructions.
Cell proliferation was assessed using the Cell Counting Kit-8 (Dojindo) according to the manufacturer’s protocol. Briefly, 1 × 10⁵ cells were seeded into each well of 24-well plates. Before proliferation assessment, CCK-8 reagent (30 μl) and phenol-free RPMI-1640 medium (300 μl) were added to each well, and incubated at 37°C for 24, 48, 72, and 96 h. Viable cells were evaluated by absorbance measurements at 450 nm at each time point. Each experiment was performed in triplicate and repeated three times.
To verify the binding site of ADAMTS9-AS1-hsa-mir-96-RDM16, the fragment of ADAMTS9-AS1 containing the predicted hsa-mir-96 binding site and the 3’UTR of RDM16 were amplified from human cell genomic DNA and then cloned into psi-CHECK-2 vector (Promega, Madison, WI). Mutant plasmids were generated by deleting the predicted binding site. The appropriate plasmid and hsa-mir-96 mimic or negative control were co-transfected into HEK293T cells (1.0 × 10⁵), and the luciferase assay was evaluated 48 h after transfection using the dual-luciferase reporter assay system (Promega). Renilla luciferase activity was used as a control.
Data are presented as mean ± standard deviation (SD). T-tests were used to measure statistically significant differences. The Pearson’s correlation coefficient was used to analyze the correlation between ADAMTS9-AS1 in cancer tissues. Survival plots were generated by Kaplan–Meier analysis, and the log-rank test was used to assess statistical significance. P < 0.05 was considered statistically significant. All statistical analyses were performed using GraphPad Prism 5.0 (GraphPad Software, Inc., La Jolla, CA). Each experiment was performed three times.
In 499 PCa patients from the TCGA database, we initially performed differential expression analysis by comparing the expression of 14,447 lncRNAs in PCa and adjacent normal prostate tissue. The edgeR package (fold change >2, P < 0.01) identified 381 DELs (215 upregulated and 166 downregulated) (Supplementary Table 1) in PCa and adjacent normal prostate tissue. A total of 500 miRNAs and 19,676 mRNAs were identified and 35 miRNAs (24 upregulated and 11 downregulated) and 689 mRNAs (333 upregulated and 556 downregulated) were found to be differentially expressed between PCa and adjacent normal prostate tissue (fold change >2, P < 0.01) (Supplementary Tables 2 and 3). The distribution of all the significant DELs, DEMis, and DEMs is shown in a volcano map in Figure 1 and a heat map is shown in Supplementary Figure S1.
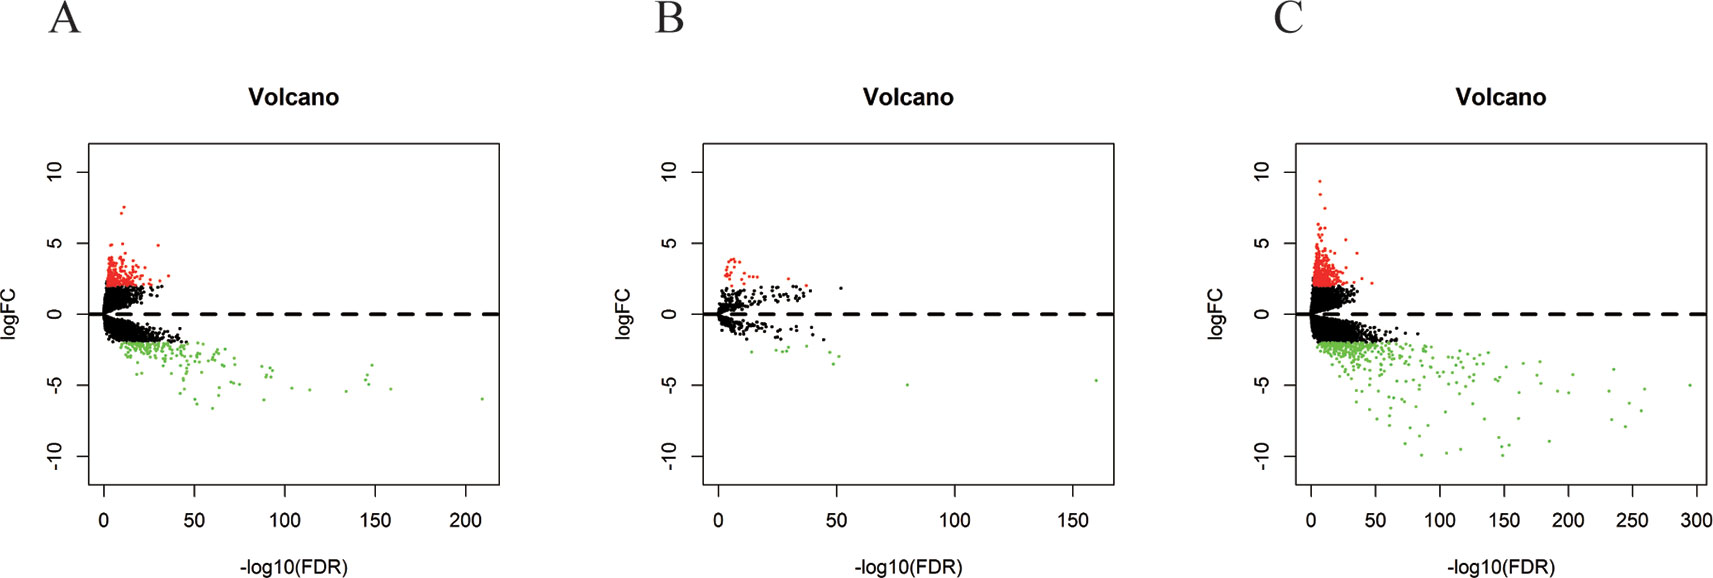
Figure 1 Volcano plots of DELs (A), DEMis (B), and DEMs (C) in PCa and adjacent normal prostate tissue.
As we found 381 DELs, miRcode and Perl were used to predict DELs-targeted DEMis in the 381 DELs and indicated that 27 DELs might target seven DEMis (Table 1).
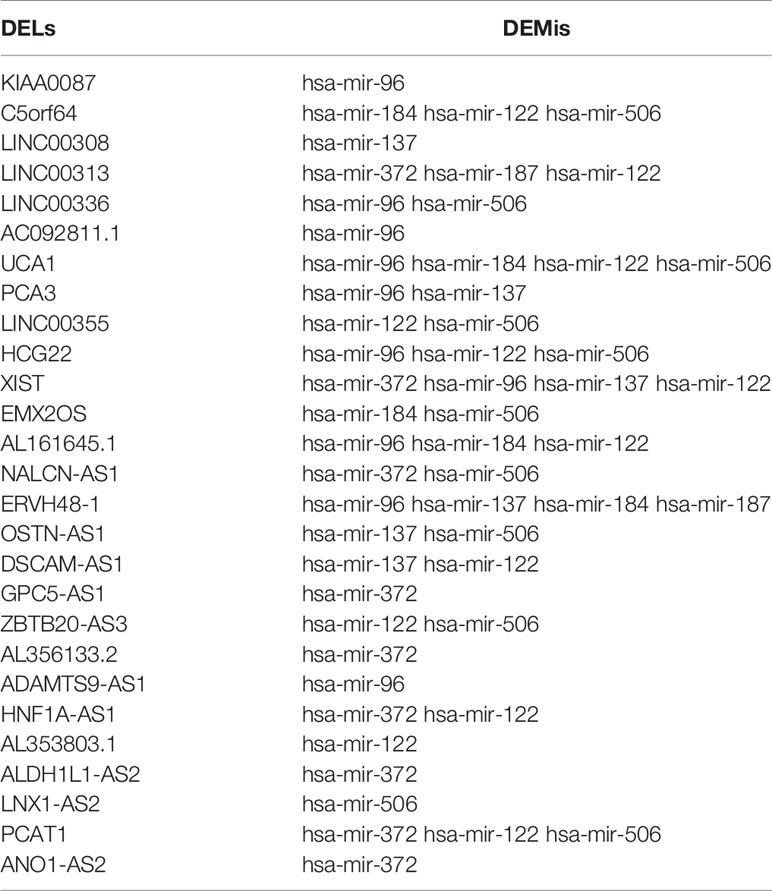
Table 1 DEMis targeted by DELs.
The 7 DEMis discovered included hsa-mir-96, hsa-mir-184, hsa-mir-122, hsa-mir-506, hsa-mir-137, hsa-mir-372, and hsa-mir-187. Perl was used to modify DEMis 3p and 5p by starBase (Table 2). Subsequently, miRDB, miRTarBases, and TargetScan were used to predict DEMis-targeted DEMs (Table 3). Then, the edgeR package identified three DEMis-targeted DEMs and differentially expressed mRNA, including PRDM16, PTGS2, and DUSP2 (Figure 2A).
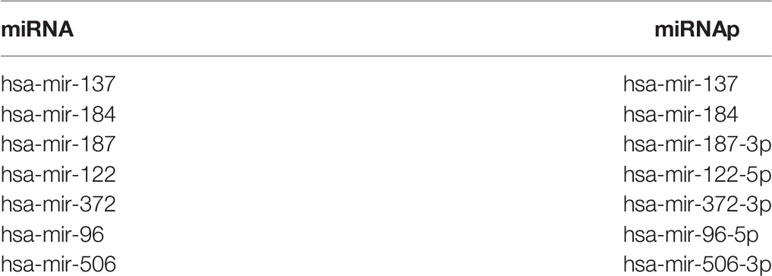
Table 2 The modification of DEMis 3p and 5p.
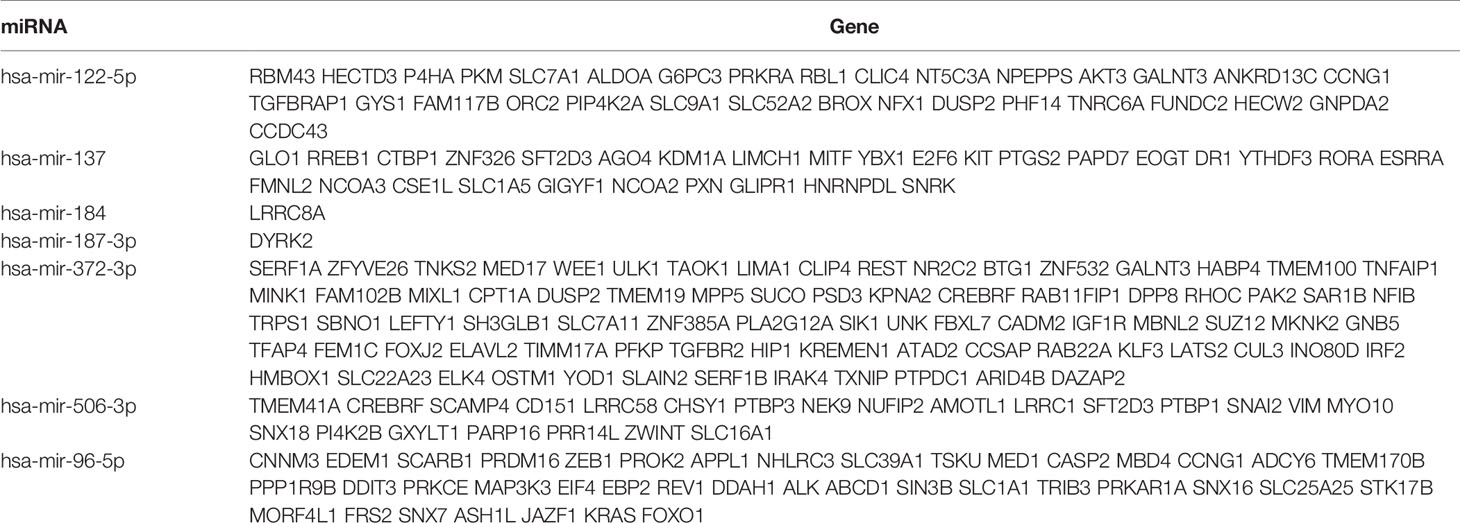
Table 3 DEMs targeted by DEMis.
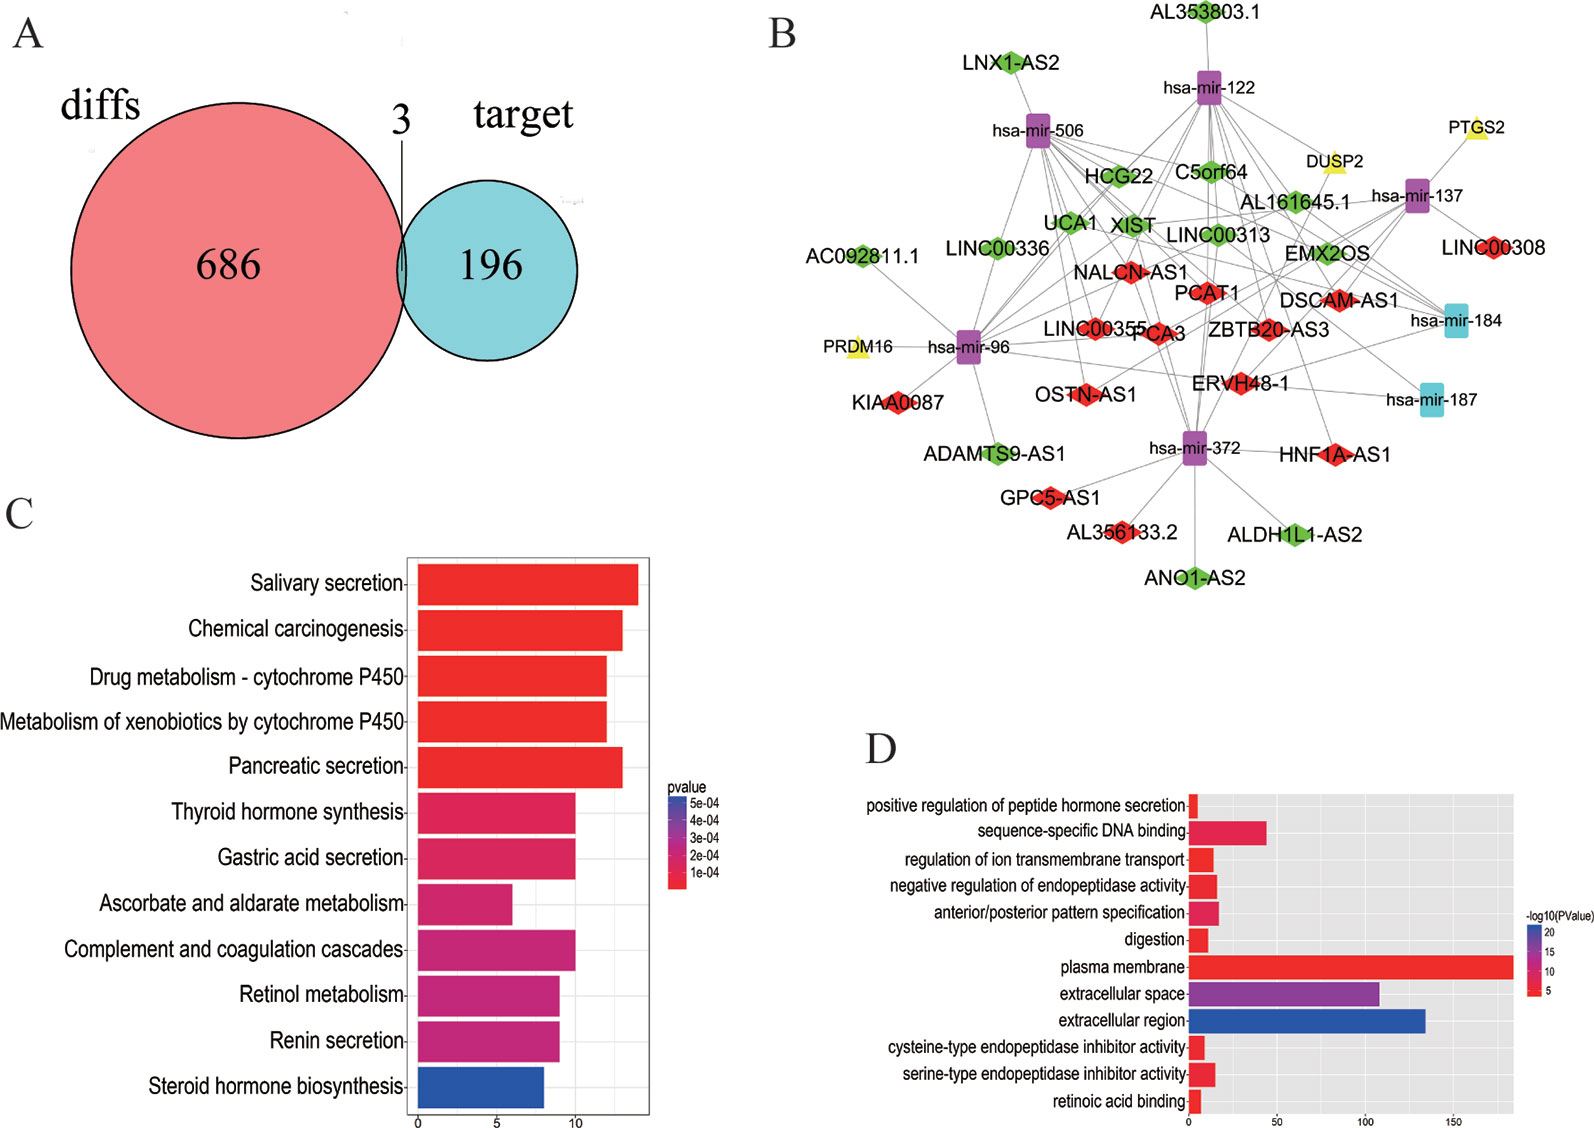
Figure 2 Distribution of differentially expressed genes. (A) 686 DEMs, 196 DEMis-targeted DEMs, and three DELs that intersect with DEMs and DEMis-targeted DEMs were found. (B) The DELs–DEMis–DEMs regulator network in PCa contains 27 DELs nodes, seven DEMis nodes, and three DEMs nodes. Down DELs (green rhombus), up DELs (red rhombus), up DEMs (yellow triangle), up DEMis (purple square), down DEMis (blue square). (C, D) The KEGG pathway and GO enrichment analyses with the 12 most significant p-values. The x-axis denotes the number of DEmRNAs involved in the pathway.
To better understand the functions of lncRNAs acting as miRNA targets, a network among DELs, DEMis, and DEMs was first constructed and then visualized. The DELs–DEMis–DEMs network was composed of 27 DELs nodes, seven DEMis nodes, and three DEMs nodes (Figure 2B). To explore the pathway analysis of lncRNA, the mRNAs of the ceRNA network in PCa were analyzed by KEGG pathways and GO terms. Next, the top 12 most significant KEGG pathways and the 12 most significantly enriched GO terms were selected (Figures 2C, D). Several of these pathways are reported to be involved in the pathogenesis of cancers, including positive regulation of peptide hormone (Liu et al., 2018), sequence-specific DNA binding (Nardini et al., 2013), salivary secretion (Pedersen et al., 2018), and chemical carcinogenesis (Poirier, 2016).
To find a potential prognostic lncRNA, the 27 DELs obtained from TCGA were used for further analysis with the database GEPIA. Only three DELs exhibited significant prognostic value for PCa, including ADAMTS9-AS1, PCA3, and PCAT1 (Figure 3). Moreover, recent accumulating evidence has demonstrated that PCAT1 and PCA3 play important roles in the regulation of gene expression by acting as ceRNAs in PCa (Prensner et al., 2014; Jeske et al., 2017). Significant ceRNA correlations were observed between ADAMTS9-AS1, PRDM16, and hsa-mir-96. Original data on ADAMTS9-AS1, PRDM16, and hsa-mir-96 was extracted from the TCGA platform (Figures 4A, B). ADAMTS9-AS1 exhibited high diagnostic value for distinguishing PCa from non-cancer prostate tissues with an AUC of 0.9063 (Figure 4C). More interestingly, disease-free survival analysis of ADAMTS9-AS1 with a low TPM exhibited poorer survival compared to ADAMTS9-AS1 with a high TPM (P = 0.0025, Figure 4D). These results suggest that ADAMTS9-AS1 may be a potential biomarker for PCa.
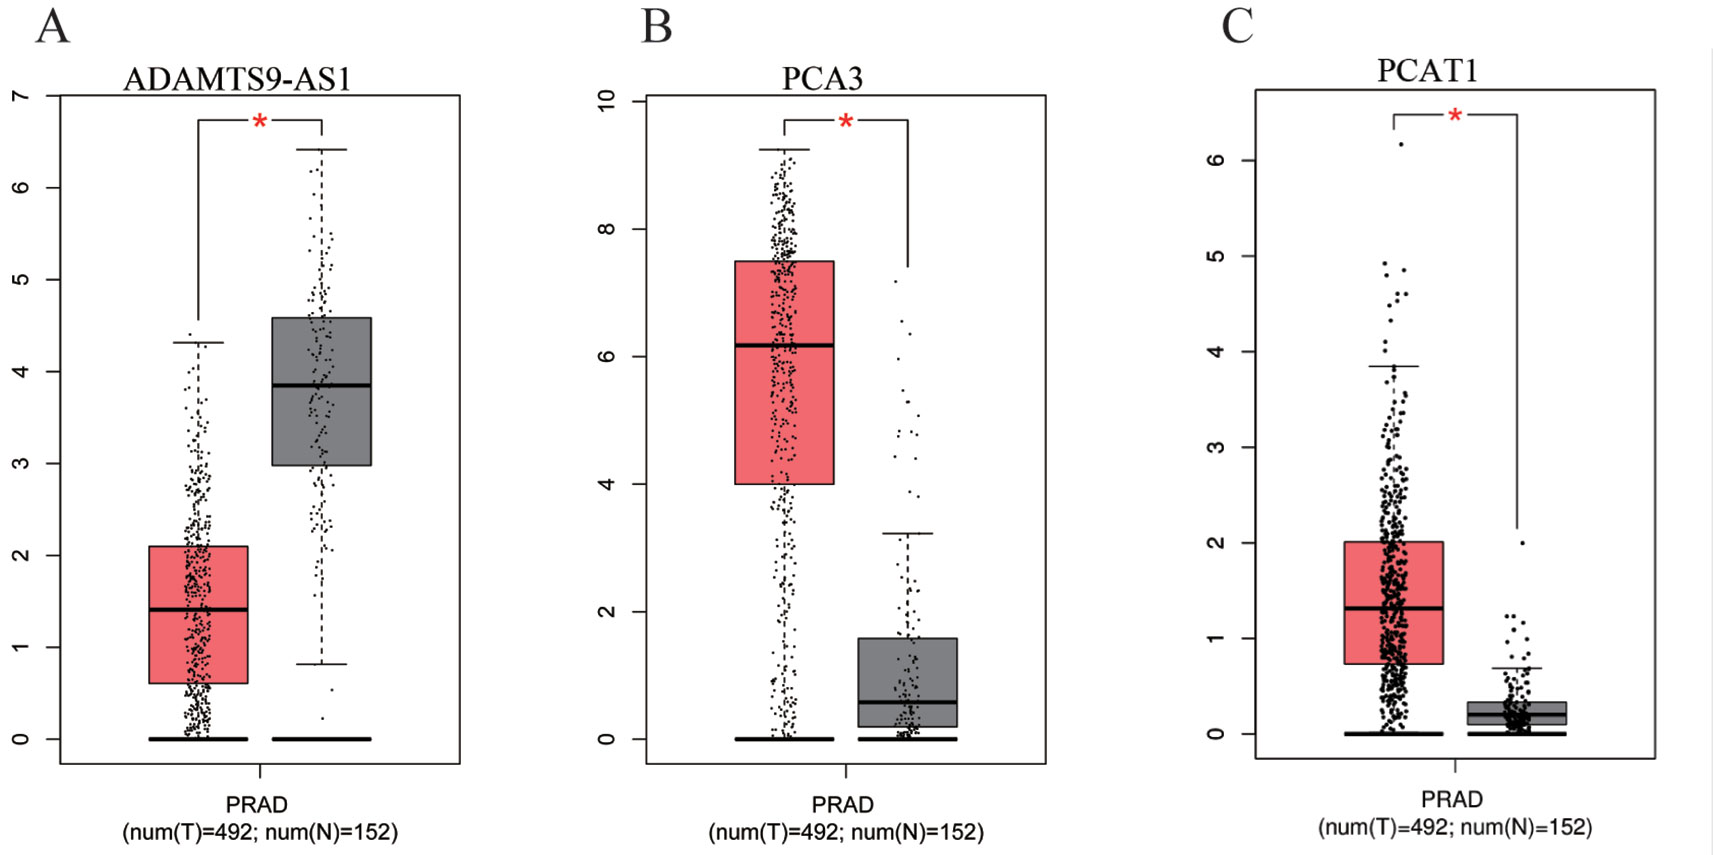
Figure 3 Box plots of three DELs. The cases were divided into a high and low expression group by mean DEL level (*P < 0.05). (A) ADAMTS9-AS1, (B) PCA3, (C) PCAT1.
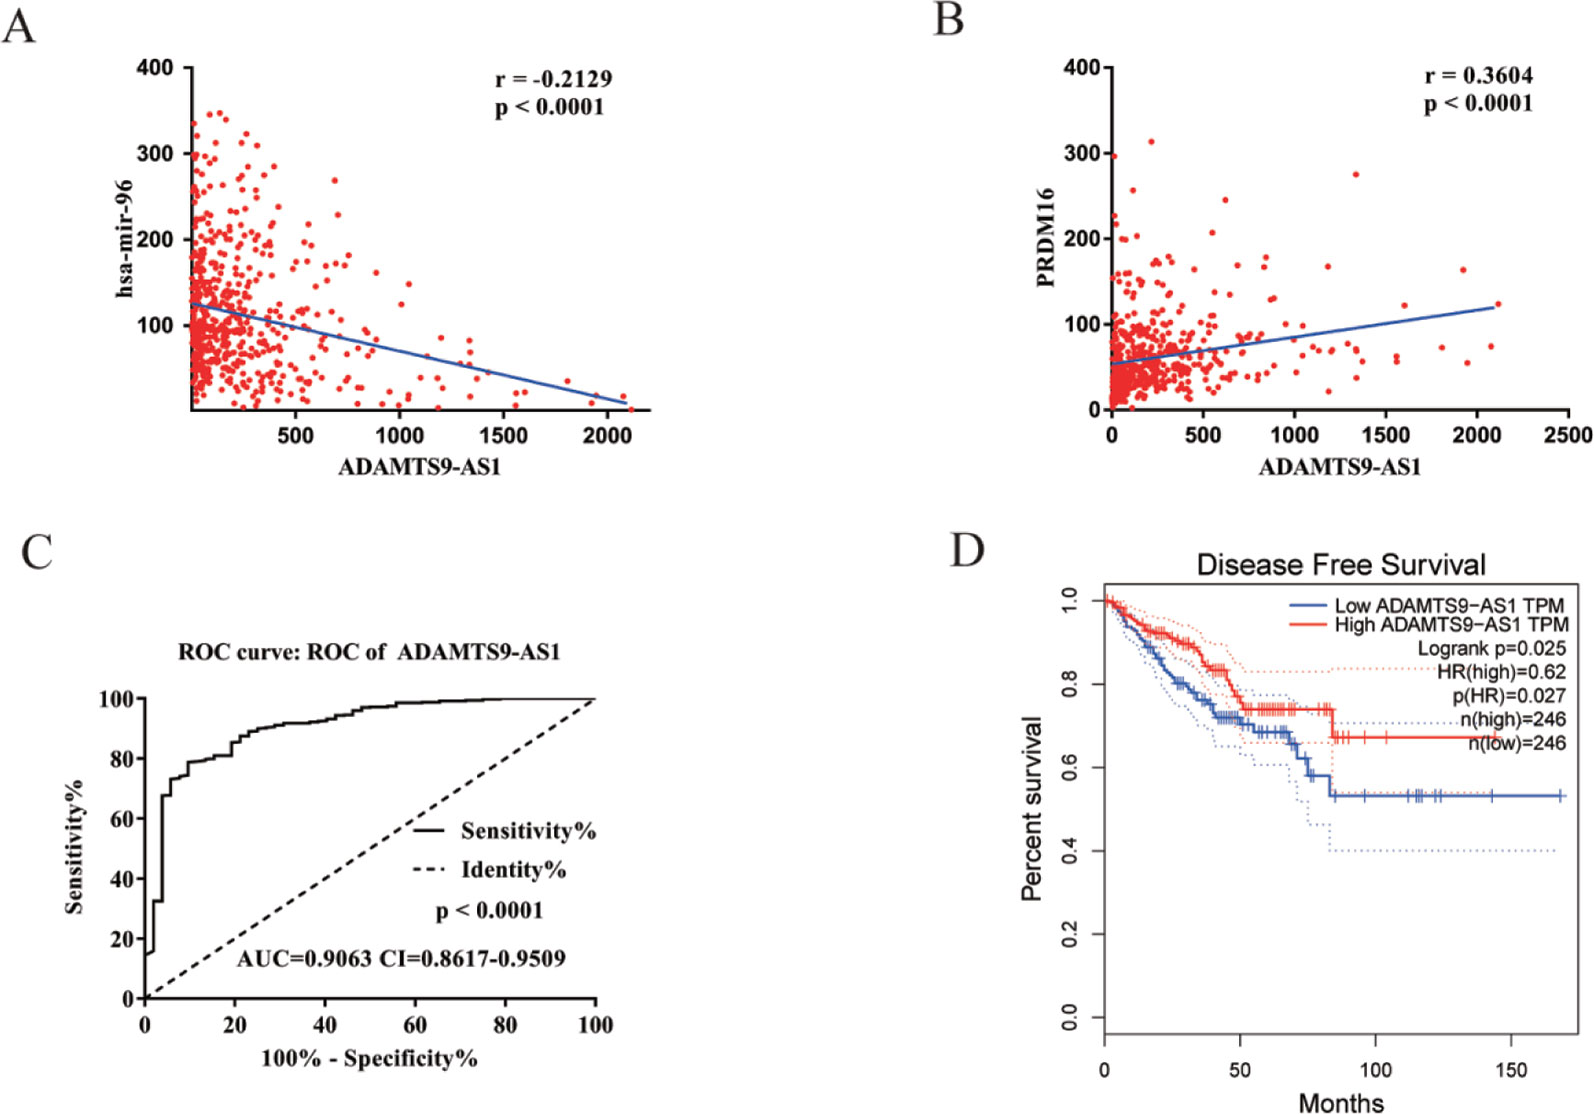
Figure 4 Clinical significance of ADAMTS9-AS1. (A) The expression of ADAMTS9-AS1 was negatively correlated with hsa-mir-96 in PCa based on the TCGA dataset. (B) The expression of ADAMTS9-AS1 was positively correlated with PRDM16 in PCa based on the TCGA dataset. (C) ROC curves of ADAMTS9-AS1 sorted by AUC in PCa; sensitive curve (solid line) and identity curve (dotted line). The X axis denotes the false positive rate: “1-Specificity”. The Y axis denotes the true positive rate: “Sensitivity”. These curves were provided by GraphPad Prism6. (D) Disease-free survival analysis of ADAMTS9-AS1 with low and high ADAMTS9-AS1 TPM. The X axis denotes disease-free survival time (months) and the Y axis denotes the survival rate. These curves were generated by GEPIA.
GO enrichment and KEGG pathway analyses of ADAMTS9-AS1 were conducted using circlncRNAnet. GO enrichment may directly reflect the distribution of ADAMTS9-AS1 for each enriched GO term of a significant biological process (BP), cellular component (CC), molecular function (MF), or transcription factor (TF) (Table 4). The most significant results of the KEGG pathway enrichment analysis show that ADAMTS9-AS1 is mainly involved in the cGMP-PKG signaling pathway, calcium signaling pathway, and Ras signaling pathway (Table 5). GO enrichment and KEGG pathway analyses were closely related to the mechanism of cancer.
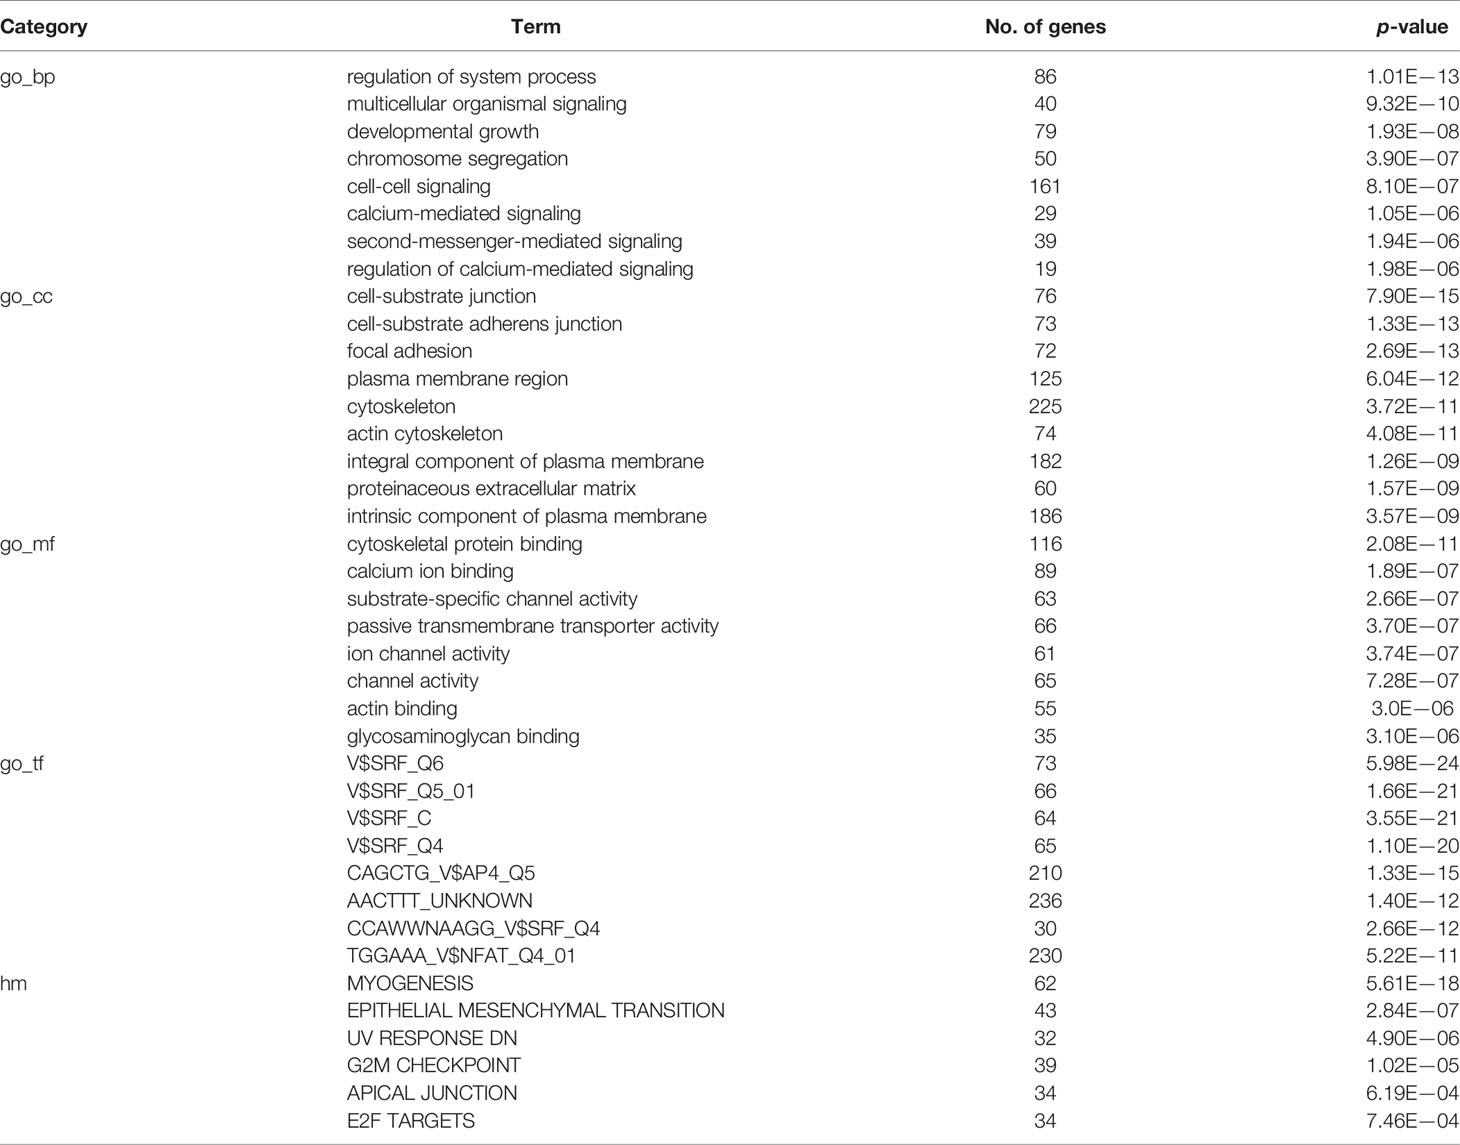
Table 4 GO terms analyses with the correlative genes of ADAMTS9-AS1.
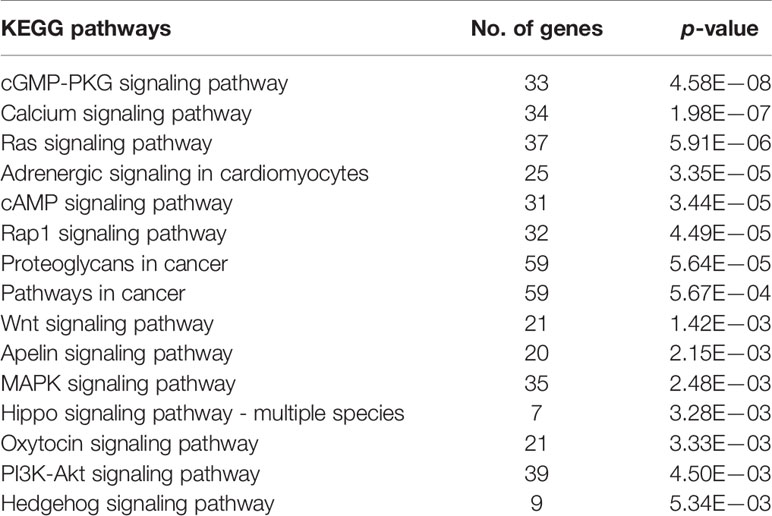
Table 5 KEGG pathways analyses with the correlative genes of ADAMTS9-AS1.
Bioinformatics methods were used to predict the binding sequence between ADAMTS9-AS1, hsa-mir-96, and PRDM16 (Figure 5A). To investigate the biological functions of ADAMTS9-AS1 in PCa cells, we knocked down ADAMTS9-AS1 in DU145 cells by transfecting with specific siRNA. ADAMTS9-AS1 expression was significantly downregulated (P < 0.001) in the si-ADAMTS9-AS1 transfected cells compared to control cells. siRNA1 exhibited the largest downregulation and was thus selected for subsequent experiments (Figure 5B). Growth curves from CCK8 proliferation assays showed that ADAMTS9-AS1 knockdown significantly promoted DU145 cell proliferation (Figure 5C). These findings suggest that ADAMTS9-AS1 behaves as a tumor suppressor gene that influences PCa cell proliferation. To investigate the molecular mechanism of the ceRNA network between ADAMTS9-AS1, hsa-mir-96, and PRDM16 in PCa, we detected the mRNA level of hsa-mir-96 and PRDM16 in si-ADAMTS9-AS1 PCa cells. We found that knockdown of ADAMTS9-AS1 also significantly reduced PRDM16 mRNA levels; however, hsa-mir-96 expression was increased in DU145 cells (Figures 5D, E). These results suggest that ADAMTS9-AS1 functions as a ceRNA for hsa-mir-96, thereby leading to the regulation of its endogenous target PRDM16.
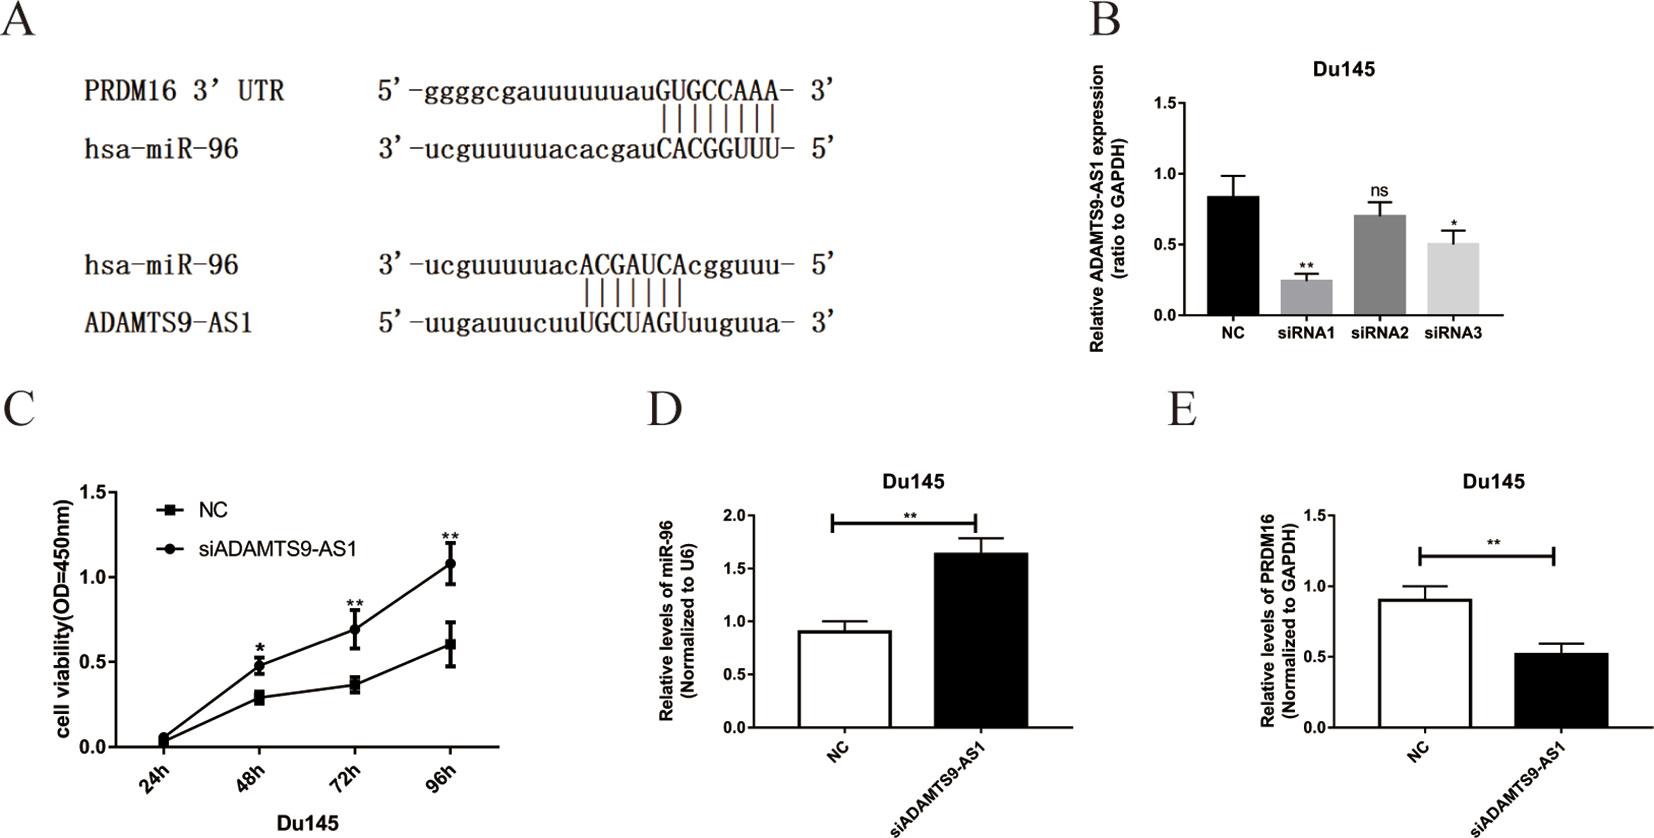
Figure 5 The functions of ADAMTS9-AS1 as ceRNA in PCa cells. (A) Complementary binding site of ADAMTS9-AS1, hsa-mir-96, and PRDM16. (B) qRT-PCR results of ADAMTS9-AS1 expression levels in DU145 cells transfected with ADAMTS9-AS1-specific siRNA (**P < 0.01). (C) CCK-8 assays show that ADAMTS9-AS1 knockdown promoted the proliferation of DU145 cells (**P < 0.01). (D) The expression of PRDM16 in DU145 cells following the knockdown of ADAMTS9-AS1 (**P < 0.01). (E) hsa-mir-96 expression varied with ADAMTS9-AS1 expression (ns: no significance, *P < 0.05, **P < 0.01).
To elucidate the ceRNA network among ADAMTS9-AS1, hsa-mir-96, and its targets in PCa, we conducted luciferase reporter assays. The ADAMTS9-AS1 sequence containing the predicted hsa-mir-96 binding site was cloned downstream of the luciferase gene and named ADAMTS9-AS1 wild-type (WT). The hsa-mir-96 binding site was deleted, resulting in the ADAMTS9-AS1 mutant (MUT). Both WT and MUT were transfected together with hsa-mir-96 mimic. Overexpression of hsa-mir-96 reduced the luciferase activity of the ADAMTS9-AS1 WT reporter vector, but not the ADAMTS9-AS1 MUT vector (Figure 6A). In addition, the WT 3’UTR sequence of PRDM16 (containing the predicted hsa-mir-96 binding site) or mutant constructs (containing a deletion in the hsa-mir-96 binding sites) were cloned downstream of the luciferase gene. These plasmids were transfected into HEK293T cells together with control miRNA, hsa-mir-96 mimic. Transfection with hsa-mir-96 mimic reduced the luciferase activity of the PRDM16 reporter vector, but not the mutated vector, indicating that hsa-mir-96 regulates PRDM16 expression in PCa cells by directly binding to the predicted site in the 3’ UTR of PRDM16 (Figure 6B). Collectively, these data suggest that ADAMTS9-AS1 modulates the expression of PRDM16 by post-transcriptional regulation of hsa-mir-96.
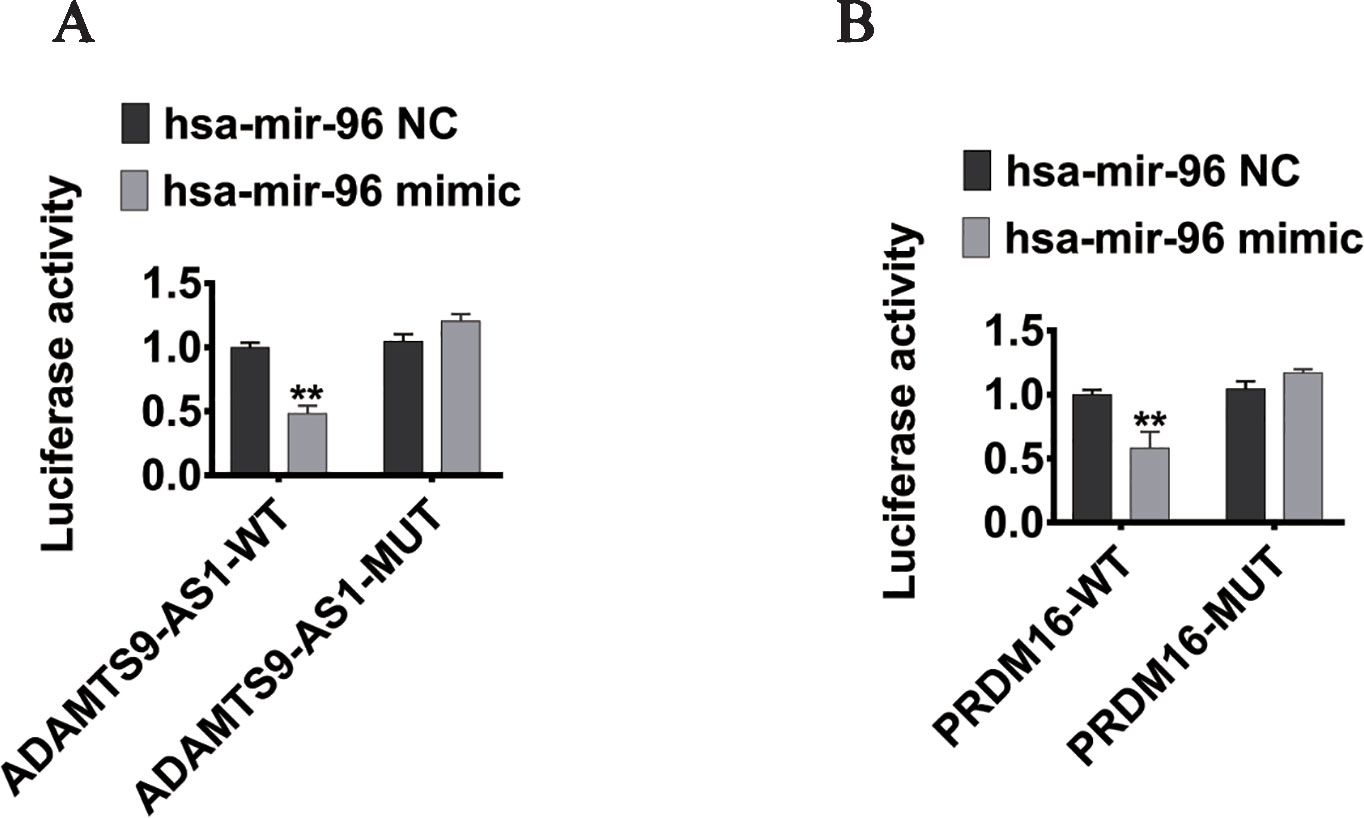
Figure 6 PRDM16 is an hsa-mir-96 target gene and is indirectly regulated by ADAMTS9-AS1. (A) The luciferase reporter plasmid containing wild type (AC-WT) or mutant (AC-MUT) ADAMTS9-AS1 was co-transfected into HEK-293T cells with hsa-mir-96 mimic or NC. (B) The luciferase reporter plasmid containing wild type (PRDM16-WT) or mutant (PRDM16-MUT) 3’UTR of PRDM16 was co-transfected into HEK-293T cells with hsa-mir-96 mimic or NC (**P < 0.01).
Recently, many studies have supported a novel regulatory mechanism of lncRNA in human cancers, mainly represented by the interaction between lncRNA and miRNA. LncRNA can act as a ceRNA or molecular sponge to regulate miRNA expression and regulate the occurrence and progression of many cancers (Tu et al., 2019; Ao et al., 2019; Yu et al., 2019). For example, lncRNA Unigene 56159 promotes the epithelial-mesenchymal transition of hepatoma cells by acting as a ceRNA of miR-140-5p (Lv et al., 2016). MEG3 inhibits the invasion of bladder cancer cells by competing with PHLPP2 to bind to miR-27a and negatively regulates c-Myc as a ceRNA (Huang et al., 2019). PVT1 regulates the expression of HK2 in gallbladder cancer cells by competitive binding to miR-143, and controls aerobic glucose metabolism to promote cell proliferation and metastasis (Chen et al., 2019).
Although there have been great advances in therapeutic strategies for PCa, almost all patients develop castration-resistant PCa (Cheng et al., 2018). According to the ceRNA hypothesis, lncRNAs can act as miRNA sponges to construct a complex ceRNA network with miRNAs and mRNAs (Zhou et al., 2014). LncRNA has received extensive attention in recent years, however, miRNAs and mRNAs also deserve more attention. As few studies have reported the role of PRDM16 in PCa, the molecular mechanism of PRDM16 in PCa was the focus of our study. We found that PRDM16 expression was significant for the survival curves of PCa patients with different Gleason scores from TCGA database (Chandrashekar et al., 2017) (P < 0.0001, Supplementary Figure S2A). ROC curves for hsa-mir-96 and PRDM16 were generated to distinguish PCa tissue from normal tissue (Supplementary Figures S2B—C). hsa-mir-96 and PRDM16 expression exhibited high diagnostic values to distinguish PCa from non-PCa tissues, with an AUC of 0.9338 and 0.7523, respectively. Dysregulated hsa-mir-96 expression is reported to play various roles in tumorigenesis, f.e., colon cancer (Huang and Pan, 2019), lung adenocarcinoma (Zhao et al., 2018), and breast cancer (Lee and Jiang, 2017). Undoubtedly, hsa-mir-96 regulation is crucial in cancer-related signaling pathways.
To explore the molecular mechanism of ceRNA in PCa, we downloaded the gene expression of a large number of PCa patients from the TCGA database, and identified 381 DELs, 35 DEMis, and 689 DEMs using R analysis. Cytoscape was used to perform network visualization for the regulatory relationship of the DELs–DEMis–DEMs network, including 27 DELs, seven DEMis, and three DEMs. Further analysis with GEPIA found that PCAT1, PCA3, and ADAMTS9-AS1 may serve as molecular markers in 27 DELs. Recently, several scholars have indicated that PCAT1 and PCA3 are important genomic biomarkers for PCa. PCAT1 may accelerate PCa cell proliferation, migration, and invasion as well as suppress apoptosis by upregulating FSCN1 via miR-145-5p (Xu et al., 2017). PCAT1 has attracted attention as a potential prognostic marker and therapeutic target in multiple types of human cancer (Prensner et al., 2014; Qiao et al., 2017; Cui et al., 2017). The levels of PCA3 and PSA proteolytic activity in prostatic secretions provide an effective pre-surgical biochemical predictor of early PCa recurrence (Jeske et al., 2017). ADAMTS9-AS1 functions as a ceRNA, effectively becoming a sponge for hsa-mir-96 and modulating the expression of PRDM16. Thus, it provides clinicians and patients with independent, clinically useful information to make more informed decisions regarding the need for biopsies. Additionally, we were also surprised to find that ADAMTS9-AS1 acts as a ceRNA that regulates the occurrence and development of tumors in breast cancer (Fan et al., 2018), bladder cancer (Xu et al., 2019), and colon adenocarcinoma (Xing et al., 2018).
To identify novel diagnostic markers for PCa, ADAMTS9-AS1 was selected for further functional assessment with circlncRNAnet. In the present study, GO analysis revealed that a number of GO terms were significant with P < 0.05. These significant GO terms involved biological process (BP), cellular component (CC), molecular function (MF), transcription factor (TF), and HM. The pathway analysis revealed the cGMP-PKG signaling pathway, calcium signaling pathway, ras signaling pathway, adrenergic signaling in cardiomyocytes, cAMP signaling pathway, Rap1 signaling pathway, and proteoglycans in cancer. In addition, our data demonstrated that si-ADAMTS9-AS1 promotes cell growth and proliferation. ADAMTS9-AS1 acted as an anti-oncogene ceRNA by binding and sequestering hsa-mir-96 to regulate PRDM16. Moreover, we performed dual luciferase reporter assay to confirm that ADAMTS9-AS1 functions as a ceRNA and competitively binds to hsa-mir-96, thus regulating PRDM16. The main cause of death due to malignant tumors is distant metastases. Competitive endogenous RNAs regulate gene expression and play an important role in the occurrence and development of malignant tumors. LncRNA, as a ceRNA, regulates target genes by competitively binding microRNA, thereby affecting the invasion and metastasis of malignant tumors. Thus, ADAMTS9-AS1 may not only serve as a biomarker, but also as a potential therapeutic target.
In summary, this study revealed the PCa ceRNA expression profile and demonstrated that ADAMTS9-AS1 may serve as a candidate diagnostic biomarker or potential therapeutic target in PCa. Our results may provide a better understanding of the role that the lncRNA–miRNA-mRNA ceRNA network plays during PCa development. This study has provided insight regarding molecular therapeutic strategies for PCa. Nevertheless, our results are preliminary and further studies are needed to explore the biological functions and molecular mechanisms of the ADAMTS9-AS1-hsa-mir-96-PRDM16 ceRNA network in PCa.
The raw data supporting the conclusions of this article will be made available by the authors, without undue reservation, to any qualified researcher.
JW, RC, and SJ wrote the main manuscript text. WM and XjW prepared all figures. XlW and ZH designed the experiments, YJ provided funding for the subject, and all authors reviewed the manuscript.
This work was supported by grants from Postgraduate Innovation Research Project of Mudanjiang Medical University (No.2018YJSCX-02MY) and Operation Expenses Research Project for Universities’ basic Scientific Research of Heilongjiang Provincial (No.2018KYYWFMY-0034).
The authors declare that the research was conducted in the absence of any commercial or financial relationships that could be construed as a potential conflict of interest.
The Supplementary Material for this article can be found online at: https://www.frontiersin.org/articles/10.3389/fgene.2019.01377/full#supplementary-material
Ao, X., Jiang, M., Zhou, J., Liang, H., Xia, H., Chen, G. (2019). lincRNA-p21 inhibits the progression of non-small cell lung cancer via targeting miR-17-5p. Oncol. Rep. 41, 789–800. doi: 10.3892/or.2018.6900
Bray, F., Ren, J. S., Masuyer, E., Ferlay, J. (2013). Global estimates of cancer prevalence for 27 sites in the adult population in 2008. Int. J. Cancer 132, 1133–1145. doi: 10.1002/ijc.27711
Chandrashekar, D. S., Bashel, B., Balasubramanya, S. A. H., Creighton, C. J., Ponce-Rodriguez, I., Chakravarthi, B. V. S. K., et al. (2017). UALCAN: a portal for facilitating tumor subgroup gene expression and survival analyses. Neoplasia 19, 649–658. doi: 10.1016/j.neo.2017.05.002
Chen, D. L., Lu, Y. X., Zhang, J. X., Wei, X. L., Wang, F., Zeng, Z. L., et al. (2017). Long non-coding RNA UICLM promotes colorectal cancer liver metastasis by acting as a ceRNA for microRNA-215 to regulate ZEB2 expression. Theranostics 7, 4836–4849. doi: 10.7150/thno.20942
Chen, J., Yu, Y., Li, H., Hu, Q., Chen, X., He, Y., et al. (2019). Long non-coding RNA PVT1 promotes tumor progression by regulating the miR-143/HK2 axis in gallbladder cancer. Mol. Cancer 18, 33. doi: 10.1186/s12943-019-0947-9
Cheng, K., Liu, X., Chen, L., Lv, J. M., Qu, F. J., Pan, X. W., et al. (2018). α-Viniferin activates autophagic apoptosis and cell death by reducing glucocorticoid receptor expression in castration-resistant prostate cancer cells. Med. Oncol. 7, 105. doi: 10.1007/s12032-018-1163-y
Cui, W. C., Wu, Y. F., Qu, H. M. (2017). Up-regulation of long non-coding RNA PCAT1 correlates with tumor progression and poor prognosis in gastric cancer. Eur. Rev. Med. Pharmacol. Sci. 21, 3021–3027.
Fan, C. N., Ma, L., Liu, N. (2018). Systematic analysis of lncRNA-miRNA-mRNA competing endogenous RNA network identifies four-lncRNA signature as a prognostic biomarker for breast cancer. J. Transl. Med. 16, 264. doi: 10.1186/s12967-018-1640-2
Fatima, R., Akhade, V. S., Pal, D., Rao, S. M. (2015). Long noncoding RNAs in development andcancer: potential biomarkers and therapeutic targets. Mol. Cell Ther. 3, 5. doi: 10.1186/s40591-015-0042-6
Huang, Q. R., Pan, X. B. (2019). Prognostic lncRNAs, miRNAs, and mRNAs Form a Competing Endogenous RNA Network in Colon Cancer. Front. Oncol. 9, 712. doi: 10.3389/fonc.2019.00712
Huang, C., Liao, X., Jin, H., Xie, F., Zheng, F., Li, J., et al. (2019). MEG3, as a competing endogenous RNA, binds with miR-27a to promote PHLPP2 protein translation and impairs bladder cancer invasion. Mol. Ther. Nucleic Acids 16, 51–62. doi: 10.1016/j.omtn.2019.01.014
Jeske, D. R., Linehan, J. A., Wilson, T. G., Kawachi, M. H., Wittig, K., Lamparska, K., et al. (2017). Two-stage classifiers that minimize PCA3 and the PSA proteolytic activity testing in the prediction of prostate cancer recurrence after radical prostatectomy. Can. J. Urol. 24, 9089–9097.
Karreth, F. A., Reschke, M., Ruocco, A., Ng, C., Chapuy, B., Léopold, V., et al (2015). The BRAF pseudogene functions as a competitive endogenous RNA and induces lymphoma in vivo. Cell 161, 319–332. doi: 10.1016/j.cell.2015.02.043
Lee, S., Jiang, X. (2017). Modeling miRNA-mRNA interactions that cause phenotypic abnormality in breast cancer patients. PloS One 12, e0182666. doi: 10.1371/journal.pone.0182666
Ling, H., Vincent, K., Pichler, M., Fodd, R., Berindan-Neagoe, I., Slack, F. J., et al. (2015). Junk DNA and the long non-coding RNA twist in cancer genetics. Oncogene 34, 5003–5011. doi: 10.1038/onc.2014.456
Liu, Y., Liu, Y., Li, G., Chen, Z., Gu, G. (2018). Ghrelin protects the myocardium with hypoxia/reoxygenation treatment through upregulating the expression of growth hormone, growth hormone secretagogue receptor and insulin-like growth factor-1, and promoting the phosphorylation of protein kinase B. Int. J. Mol. Med. 42, 3037–3046. doi: 10.3892/ijmm.2018.3886
Lv, J., Fan, H. X., Zhao, X. P., Lv, P., Fan, J. Y., Zhang, Y., et al. (2016). Long non-coding RNA Unigene56159 promotes epithelial-mesenchymal transition by acting as a ceRNA of miR-140-5p in hepatocellular carcinoma cells. Cancer Lett. 382, 166–175. doi: 10.1016/j.canlet.2016.08.029
Nardini, M., Gnesutta, N., Donati, G., Gatta, R., Forni, C., Fossati, A., et al. (2013). Sequence-specific transcription factor NF-Y displays histone-like DNA binding and H2B-like ubiquitination. Cell 152, 132–143. doi: 10.1016/j.cell.2012.11.047
Pedersen, A. M. L., Sørensen, C. E., Proctor, G. B., Carpenter, G. H., Ekström, J., et al. (2018). Salivary secretion in health and disease. J. Oral. Rehabil. 45, 730–746. doi: 10.1111/joor.12664
Poirier, M. C. (2016). Linking DNA adduct formation and human cancer risk in chemical carcinogenesis. Environ. Mol. Mutagen. 57, 499–507. doi: 10.1002/em.22030
Prensner, J. R., Chen, W., Iyer, M. K., Cao, Q., Ma, T., Han, S., et al. (2014). PCAT-1, a long noncoding RNA, regulates BRCA2 and controls homologous recombination in cancer. Cancer Res. 74, 1651–1660. doi: 10.1158/0008-5472.CAN-13-3159
Prensner, J. R., Chen, W., Han, S., Iyer, M. K., Cao, Q., Kothari, V., et al. (2014). The long non-coding RNA PCAT-1 pro-motes prostate cancer cell proliferation through cMyc. Neoplasia 16, 900–908. doi: 10.1016/j.neo.2014.09.001
Qiao, L., Liu, X., Tang, Y., Zhao, Z., Zhang, J., Feng, Y., et al. (2017). Down regulation of the long non-coding RNA PCAT-1 induced growth arrest and apoptosis of colorectal cancer cells. Life Sci. 188, 37–44. doi: 10.1016/j.lfs.2017.08.024
Qu, C. H., Sun, Q. Y., Zhang, F. M., Jia, Y. M. (2017). Long non-coding RNA ROR is a novel prognosis factor associated with non-small-cell lung cancer progression. Eur. Rev. Med. Pharmacol. Sci. 21, 4087–4091.
Salmena, L., Poliseno, L., Tay, Y., Kats, L., Pandolfi, P. P., et al. (2011). A ceRNA hypothesis: the Rosetta Stone of a hidden RNA language? Cell 146, 353–358. doi: 10.1016/j.cell.2011.07.014
Siegel, R. L., Miller, K. D., Jemal, A. (2019). Cancer Statistics, 2019. CA Cancer J. Clin. 69, 7–34. doi: 10.3322/caac.21551
Smith, R. A., Andrews, K. S., Brooks, D., Fedewa, S. A., Manassaram-Baptiste, D., Saslow, D., et al. (2017). Cancer screening in the United States, 2017: A review of current American Cancer Society guidelines and current issues in cancer screening. CA Cancer J. Clin. 2, 100–121. doi: 10.3322/caac.21392
Tu, J., Zhao, Z., Xu, M., Chen, M., Weng, Q., Wang, J., et al. (2019). LINC00707 contributes to hepatocellular carcinoma progression via sponging miR-206 to increase CDK14. J. Cell Physiol. 234, 10615–10624. doi: 10.1002/jcp.27737
Wang, J., Wang, X., Chen, T., Jiang, L., Yang, Q., et al. (2017). Huaier extract inhibits breast cancer progression through a LncRNA-H19/MiR-675-5p pathway. Cell Physiol. Biochem. 44, 581–593. doi: 10.1159/000485093
Wu, J., Hann, S. S. (2018). Functions and Roles of Long-Non-Coding RNAs in Human Nasopharyngeal Carcinoma. Cell Physiol. Biochem. 45, 1191–1204. doi: 10.1159/000487451
Xing, Y., Zhao, Z., Zhu, Y., Zhao, L., Zhu, A., Piao, D., et al. (2018). Comprehensive analysis of differential expression profiles of mRNAs and lncRNAs and identification of a 14-lncRNA prognostic signature for patients with colon adenocarcinoma. Oncol. Rep. 39, 2365–2375. doi: 10.3892/or.2018.6324
Xu, W., Chang, J., Du, X., Hou, J. (2017). Long non-coding RNA PCAT-1 contributes to tumorigenesis by regulating FSCN1 via hsa-mir-96 in prostate cancer. Biomed. Pharmacother. 95, 1112–1118. doi: 10.1016/j.biopha.2017.09.019
Xu, Z., Wang, C., Xiang, X., Li, J., Huang, J. (2019). Characterization of mRNA expression and endogenous RNA profiles in bladder cancer based on the cancer genome atlas (TCGA) database. Med. Sci. Monit. 25, 3041–3060. doi: 10.12659/MSM.915487
Yarmishyn, A. A., Kurochkin, I. V. (2015). Long noncoding RNAs: a potential novel class of cancer biomarkers. Front. Genet. 6, 145. doi: 10.3389/fgene.2015.00145
Yu, W., Li, D., Ding, X., Sun, Y., Liu, Y., Cong, J., et al. (2019). LINC00702 suppresses proliferation and invasion in non-small cell lung cancer through regulating miR-510/PTEN axis. Aging (Albany NY) 11, 1471–1485. doi: 10.18632/aging.101846
Zhang, Y., Su, X., Kong, Z., Fu, F., Zhang, P., Wang, D., et al. (2017). An androgen reduced transcript of LncRNA GAS5 promoted prostate cancer proliferation. PloS One 12, e0182305. doi: 10.1371/journal.pone.0182305
Zhao, J., Cheng, W., He, X., Liu, Y., Li, J., Sun, J., et al. (2018). Construction of a specific SVM classifier and identification of molecular markers for lung adenocarcinoma based on lncRNA-miRNA-mRNA network. Onco. Targets Ther. 11, 3129–3140. doi: 10.2147/OTT.S151121
Keywords: prostate cancer, ADAMTS9-AS1, ceRNA, Hsa-miR-96, PRDM16
Citation: Wan J, Jiang S, Jiang Y, Ma W, Wang X, He Z, Wang X and Cui R (2020) Data Mining and Expression Analysis of Differential lncRNA ADAMTS9-AS1 in Prostate Cancer. Front. Genet. 10:1377. doi: 10.3389/fgene.2019.01377
Received: 20 July 2019; Accepted: 17 December 2019;
Published: 21 February 2020.
Edited by:
Marco Pellegrini, Italian National Research Council, ItalyReviewed by:
Zhiyun Guo, Southwest Jiaotong University, ChinaCopyright © 2020 Wan, Jiang, Jiang, Ma, Wang, He, Wang and Cui. This is an open-access article distributed under the terms of the Creative Commons Attribution License (CC BY). The use, distribution or reproduction in other forums is permitted, provided the original author(s) and the copyright owner(s) are credited and that the original publication in this journal is cited, in accordance with accepted academic practice. No use, distribution or reproduction is permitted which does not comply with these terms.
*Correspondence: Rongjun Cui, jkl305@163.com
Disclaimer: All claims expressed in this article are solely those of the authors and do not necessarily represent those of their affiliated organizations, or those of the publisher, the editors and the reviewers. Any product that may be evaluated in this article or claim that may be made by its manufacturer is not guaranteed or endorsed by the publisher.
Research integrity at Frontiers
Learn more about the work of our research integrity team to safeguard the quality of each article we publish.