 Jamal S. M. Sabir1,2†Abdelfatteh El Omri1,2†
 Babajan Banaganapalli3Majed A. Al-Shaeri1Naser A. Alkenani4Mumdooh J. Sabir5Nahid H. Hajrah1,2Houda Zrelli1,2Lukasz Ciesla6Khalidah K. Nasser7
 Ramu Elango3
 Noor Ahmad Shaik3*
 Muhummadh Khan1,2*
- 1Center of Excellence in Bionanoscience Research, King Abdulaziz University, Jeddah, Saudi Arabia
- 2Genomics and Biotechnology Section and Research Group, Department of Biological Sciences, Faculty of Science, King Abdulaziz University, Jeddah, Saudi Arabia
- 3Department of Genetic Medicine, Faculty of Medicine, King Abdulaziz University, Jeddah, Saudi Arabia
- 4Biology–Zoology Division, Department of Biological Sciences, Faculty of Science, King Abdulaziz University, Jeddah, Saudi Arabia
- 5Department of Computer Sciences, Faculty of Computers and Information Technology, King Abdulaziz University, Jeddah, Saudi Arabia
- 6Department of Biological Sciences, Science and Engineering Complex, The University of Alabama, Tuscaloosa, AL, United States
- 7Department of Medical Laboratory Technology, Faculty of Applied Medical Sciences, King Abdulaziz University, Jeddah, Saudi Arabia
Rheumatoid arthritis (RA) is a chronic synovial autoinflammatory disease that destructs the cartilage and bone, leading to disability. The functional regulation of major immunity-related pathways like nuclear factor kappa B (NF-κB), which is involved in the chronic inflammatory reactions underlying the development of RA, remains to be explored. Therefore, this study has adopted statistical and knowledge-based systemic investigations (like gene correlation, semantic similarity, and topological parameters based on graph theory) to study the gene expression status of NF-κB protein family (NKPF) and its regulators in synovial tissues to trace the molecular pathways through which these regulators contribute to RA. A complex protein–protein interaction map (PPIM) of 2,742 genes and 37,032 interactions was constructed from differentially expressed genes (p ≤ 0.05). PPIM was further decomposed into a Regulator Allied Protein Interaction Network (RAPIN) based on the interaction between genes (5 NKPF, 31 seeds, 131 hubs, and 652 bottlenecks). Pathway network analysis has shown the RA-specific disturbances in the functional connectivity between seed genes (RIPK1, ATG7, TLR4, TNFRSF1A, KPNA1, CFLAR, SNW1, FOSB, PARVA, CX3CL1, and TRPC6) and NKPF members (RELA, RELB, NFKB2, and REL). Interestingly, these genes are known for their involvement in inflammation and immune system (signaling by interleukins, cytokine signaling in immune system, NOD-like receptor signaling, MAPK signaling, Toll-like receptor signaling, and TNF signaling) pathways connected to RA. This study, for the first time, reports that SNW1, along with other NK regulatory genes, plays an important role in RA pathogenesis and might act as potential biomarker for RA. Additionally, these genes might play important roles in RA pathogenesis, as well as facilitate the development of effective targeted therapies. Our integrative data analysis and network-based methods could accelerate the identification of novel drug targets for RA from high-throughput genomic data.
Introduction
Rheumatoid arthritis (RA) is a complex systemic autoinflammatory disorder causing chronic destructive inflammation in synovial joints resulting in severe physical disability in millions of patients worldwide (Dargham et al., 2018). Molecular basis of this disease is not well defined. But, genetic background (polymorphisms or inherited mutations), hormones, cytokines, and environmental factors are believed to be some of the contributing factors (Okada et al., 2019). Among the genetic factors, human leukocyte antigen (HLA) loci (HLA-DRB1) and non-HLA genes (PTPN22, PADI4, TRAF1/C5, TNFAIP3, CCR6, REL, etc.) are the main susceptibility risk factors for RA across multiple ethnic groups (Barton et al., 2008; Raychaudhuri et al., 2012; Kochi et al., 2014; Mcgonagle et al., 2018; Shaik and Banaganapalli, 2019). However, these genetic markers, whether single or as a group, are unable to fully explain complex pathogenic mechanisms underlying the disease and are also not robust in acting as systemic biomarkers for diagnosing or monitoring RA.
On the contrary, studying genome-wide gene expression provided a deeper insight into the molecular patterns of different autoimmune diseases (Pimentel-Santos et al., 2011; Rezaei Tavirani et al., 2018; Yin et al., 2019). Gene expression assays provide a quantitative measure of thousands of mRNA molecules in one single experiment. It can also generate a global picture of cell function and also contributes to a stratified medicine application (Smith et al., 2013). But understanding and interpreting the massive amount of genomics data (for around 20,000 genes) generated by high-throughput technologies like microarray-based gene expression is complex and challenging. In recent decades, gene networking based on graph topological parameters and subsequent functional enrichment has revolutionized the disease-centric candidate gene approaches (Sabir et al., 2019). One such highly attractive gene set with strong influence on RA synovial tissues is nuclear factor kappa B (NF-κB) (Noort et al., 2015). Activated NF-κB is detected in human synovial tissues during the early and late stages of inflammation (Gilston et al., 1997).
The NF-κB belongs to a group of transcription factors (NF-κB1, NF-κB2, RelA, RelB, and c-Rel) which controls the expression of many genes involved in immunity and inflammatory processes (Liu et al., 2017). These genes mediate the target gene transcription by binding to NF-κB enhancer, a key DNA element either in hetero- or homo-dimeric form (Oeckinghaus and Ghosh, 2009). Molecular pathways related to the translocation of NF-κB from the nucleus and its function are often strongly regulated, but act in synergy with the activation of NF-κB-dependent gene expression (Makarov, 2001). NF-κB is activated by different pathogenic stimuli, including Toll-like receptors (TLR3, TLR7, TLR8, TL9, TLR1, TLR2, TLR4, and TLR6), growth factors, cytokines, radiation, and oxidative stress. Activated NF-κB is detected in human synovial tissues during both early and late stages of inflammation (Gilston et al., 1997).
In innate immunity, activation of the NF-κB pathway upregulates the expression of defensins, pro-inflammatory proteins like cytokines (IL-1, IL-6, and TNF-α), and proteins involved in leukocyte migration (VCAM1 and ICAM1). In adaptive immunity, NF-κB is involved in the proliferation of B- and T-cells as well as in the maturation of dendritic cells (Verma et al., 2019). Although NF-κB is ubiquitous and rigorously studied, some questions about this pathway including transcription machinery, stimulus-specific gene expression, and cell types are yet to be explored. Keeping in view of the above-described facts, this study has adopted statistical and knowledge-based systemic investigations (like gene correlation, semantic similarity, and topological parameters based on graph theory) to study the expression status of NF-κB regulators in synovial tissues and to trace the molecular pathways through which these regulators contribute to RA.
Materials and Methods
Selection of NF-κb Regulators
The top 20 known NF-κB pathway regulators controlling the immune response to independent TNF-α and lipopolysaccharide (LPS) antigenic treatments were identified from a large-scale secondary RNAi screening on differentiated human THP-1 monocyte cell lines (Verma et al., 2019). These top 40 NF-κB regulators were chosen based on the significant reductions in luciferase activity of their siRNAs upon both TNF-α and LPS treatments and did not cause significant loss of cell viability in vitro. For ease of description, regulators of NF-κB protein family are termed as “seed genes” and the NF-κB protein family as “NKPF.”
Microarray Gene Expression Data
The microarray gene expression profile of RA patients’ synovial tissues with series identifier GSE77298 was taken from the GEO database (www.ncbi.nlm.nih.gov/geo). Total number of samples in the dataset was 23 (Table S1). Gene expression data was generated with U133Plus 2.0 oligonucleotide array (Affymetrix, Santa Clara, CA, USA) from 16 end-stage RA synovial biopsies and seven synovial biopsies from healthy individuals without a joint disease (healthy control, HC) (Broeren et al., 2016). Genes with a fold change threshold of 1.2 (−1.2 ≥ FC ≥ +1.2) with P value ≤ 0.05 in RA vs. HC were selected from the analysis. Information about the patient samples are given in the supplementary file (Supplementary Table 1).
Data Normalization and Analysis
Analysis of microarray gene expression data was carried out by using R/Bioconductor (Carvalho and Irizarry, 2010; Ritchie et al., 2015). For the standardization and noise reduction of the probe data, CEL files were loaded into R package-Affy and raw signal values for each probe sets were normalized. Normalization of the microarray dataset was performed using Robust Multiarray Average (RMA) algorithm (Carvalho and Irizarry, 2010). Statistically significant differentially expressed genes between normal and RA samples were computed by applying t-statistic. False discovery rate (FDR) of Benjamini and Hochberg with p value ≤ 0.05 was applied on the significant gene data to remove false positives (Benjamini and Hochberg, 2001).
Protein-Protein Interaction Mapping
An experimentally validated protein–protein interaction map (PPIM) was constructed using a Cytoscape plugin, Bisogenet, which extracts the interaction among queried genes from the data deposited in the Biomolecular Interaction Network Database (BIND), Biological General Repository for Interaction Datasets (BioGRID), The Molecular Interaction Database (MINT), Database of Interacting Proteins (DIP), Human Protein Reference Database (HPRD), and IntAct database (Xenarios et al., 2000; Bader et al., 2003; Chatr-Aryamontri et al., 2007; Keshava Prasad et al., 2009; Aranda et al., 2010; Chatr-Aryamontri et al., 2017). Selected differentially expressed genes (DEGs) from the microarray data are used as input in Bisogenet to generate PPIM (Sabir et al., 2019). Construction of the interactome was built from the DEGs. The output is in the form of graph, which represents gene as node and interaction between genes as edge (Martin et al., 2010; George et al., 2019).
Construction of Sub-Network
A sub-network of Regulator Allied Protein Interaction Network (RAPIN) was constructed from PPIM by implementing well-established theories like degree centrality (DC) and betweenness centrality (BC) in network biology. From the PPIM, we identified those genes that fit to: a) hubs which are dependent on DC, b) bottlenecks based on BC, and c) NF-κB proteins and regulators. The centrality parameters or network properties were scaled using ‘Network Analyzer’, a Cytoscape plugin (Shannon et al., 2003; Assenov et al., 2008).
a) Identification of Hub Proteins
We used a method developed by Rakshit et al. (2014) to detect the hubs in the biological network. The formula for picking hubs is as follows:
where Avg is the mean DC of all genes in the biological network PPIM and SD denotes their standard deviation.
b) Identification of Bottlenecks
BC was introduced to scale the bottleneck genes in the interactome. The formula for calculating BC is as follows:
where s and t are nodes in the network other than n, σst represents the number of shortest paths from s to t, and σst(n) is the number of shortest paths from s to t that n lies on. Genes located in the top 25% of betweenness were extracted as bottleneck genes.
Building of Weighted Correlation Map
Pearson’s correlation algorithm was applied to the genes of RAPIN to create a weighted gene correlation map. The Pearson’s correlation coefficient (PCC) of pairs of genes is measured using the following formula:
where x and y are the averages of sample expression values in healthy and RA conditions of the two genes, respectively.
Functional Similarity Between Gene Pairs
Functional resemblance among two genes is evaluated using prearranged data available in Gene Ontology. To evaluate the functional similarity between two genes, Wang’s measure of semantic similarity was applied to molecular function (MF) hierarchy as MF, which specifically defines a particular gene in terms of functional ontology. The semantic score of functional similarity between genes range from 0 to 1. Higher semantic score between genes represents a stronger functional relationship among the genes (Wang et al., 2007). The semantic score of functional similarity between gene pairs is measured as follows;
where TX is the set of all its ancestor ontology as well as ontology X itself and SX(t) represents the contribution of a term t ∈ TX to the semantics of X based on the relative locations of t and X in the graph. A single gene can be annotated by multiple gene ontology (GO) relationships. Best-match average (BMA) approach was implemented integrating semantic similarity of multiple GO annotations and evaluates the mean of all maximum similarities. Based on this model, we used R package, GoSemSim (Yu et al., 2010), to quantify the semantic similarity between co-expressed gene pairs.
Functional Enrichment Analysis
Functional annotation is performed to gain insights into the high-throughput biological data. This method not only authenticates the new genes found in biological experiment as functionally significant but also uncovers the biological interactions among them. We used ToppGene Suite to conduct functional enrichment analysis of the filtered gene sets (Chen et al., 2009). The input for ToppGene Suite is the list of DEGs that are identified from gene expression profiles. We applied parameters of gene limits ranging from 2 (minimum interaction) to maximum with statistical significance of p ≤ 0.01 and FDR less than 0.05. This suite retrieves information from many public databases which identify key biological processes, cellular components, molecular functions, diseases, and biological pathways.
GWAS Comparative Analysis
Genome-wide association studies (GWAS) are a dominant and broadly used tool to map the susceptibility loci, genes, and genetic markers in complex traits and diseases. GWAS based on pathway analysis is extensively used to unravel novel multigenic functional relationships. In this study, an attempt was made to explore the pathways commonly enriched between RA-GWAS catalog (https://www.ebi.ac.uk/gwas/) and co-expressed seed genes in our dataset (Macarthur et al., 2017). The list of filtered co-expressed genes was mapped against the data in the GWAS database with p ≤ 0.01. Further, we extracted the reported traits of these co-expressed genes from GWAS catalog to identify their association to RA.
Results
Selected NF-κb Regulators
We collected the top 20 hits each from TNF-α and LPS secondary screen analysis and the five genes from NF-κB family. We identified that eight genes are common to both TNF-α and LPS secondary screen analysis and gene RELA was part of all three categories (Figure 1). Hence, the collected genes for our analysis included 31 seed genes and five genes from NKPF without any redundancy. The list of the selected 36 genes for the analysis is in Table 1.
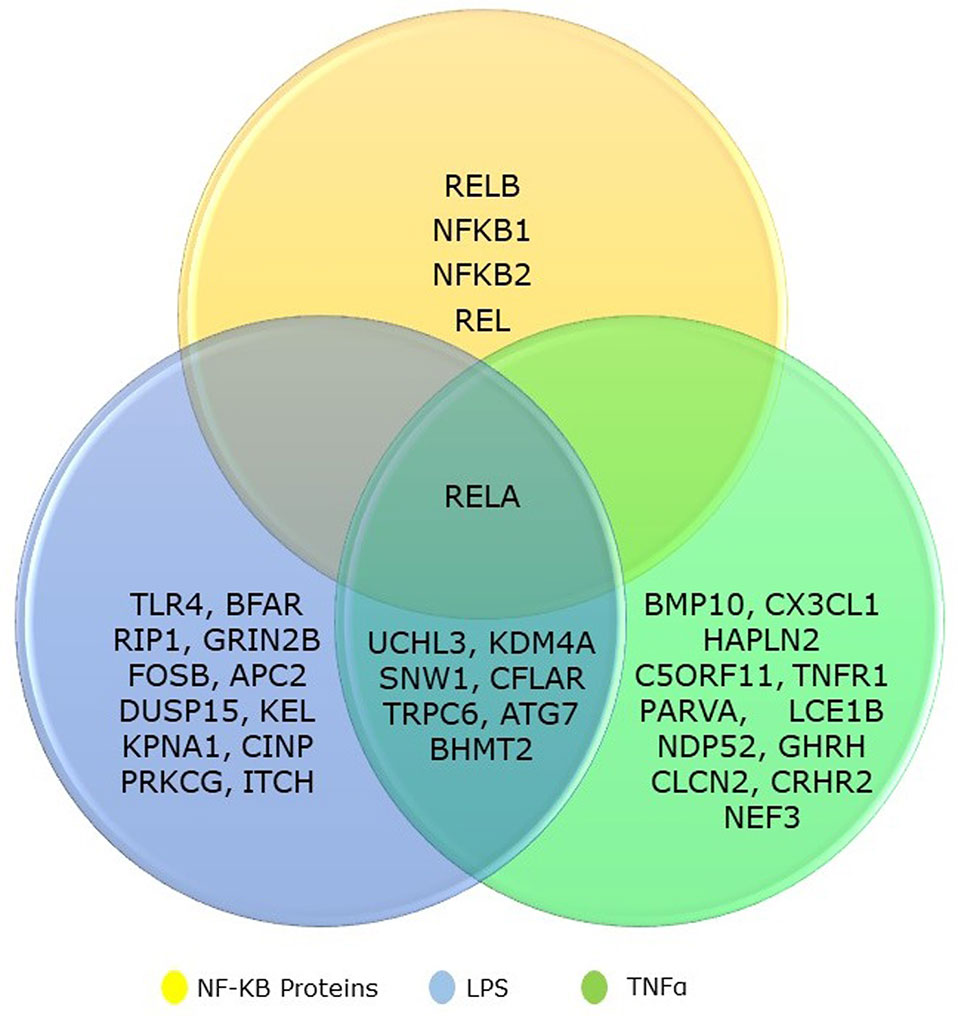
Figure 1 Venn diagram showing the overlapping between NF-kB gene family and its regulatory genes identified from TNFα and LPS secondary screen analysis.

Table 1 List of seed and NKPF genes screened in RA samples.
Pre-Processed Data and DEGs
High-throughput experimental gene expression profiles of synovial tissues, which are affected in RA, were retrieved from the GEO database. The raw signal intensities of 45,056 probes were standardized by means of RMA algorithm, which bring about 3,573 non-redundant DEGs with a statistically significant p ≤ 0.05 and fold change of 1.2 (−1.2 ≥ FC ≥ +1.2). The normalization plot of standardized genes is given in Supplementary File 1 (Figure S1). The DEGs comprise 2,577 upregulated and 996 downregulated genes. The volcano plot representing the separation of significant DEGs is depicted in Figure 2. Gene expression profiles of seed genes and NKPF extracted and depicted in Figure 3.
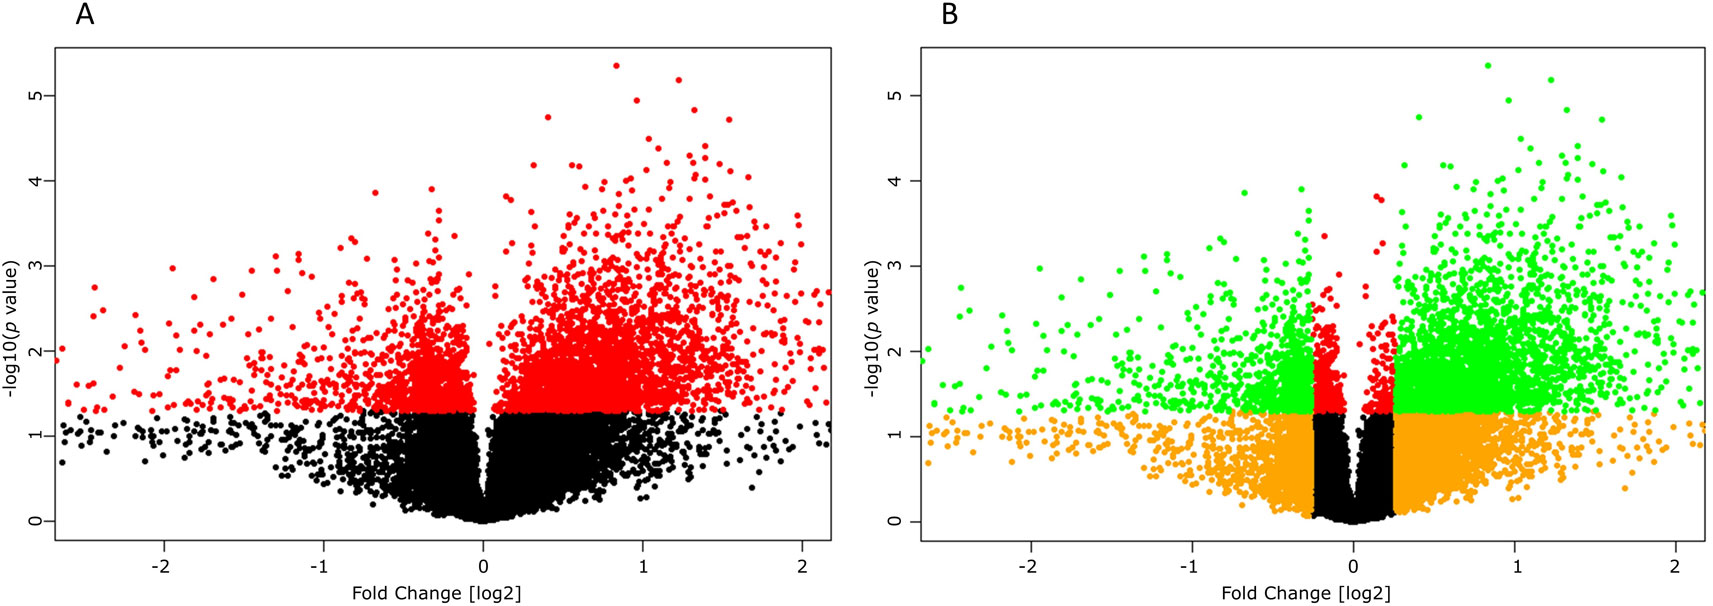
Figure 2 Volcano plots depicting significant differentially expressing genes (DEGs). (A) Plot displaying the significant (red, p ≤ 0.05) and non-significant (black, p ≥ 0.05) genes. (B) Plot displaying the DEGs (green, −1.2 ≥ FC ≥ +1.2) and non-significant (orange, −1.2 ≤ FC ≤ 1.2) genes.
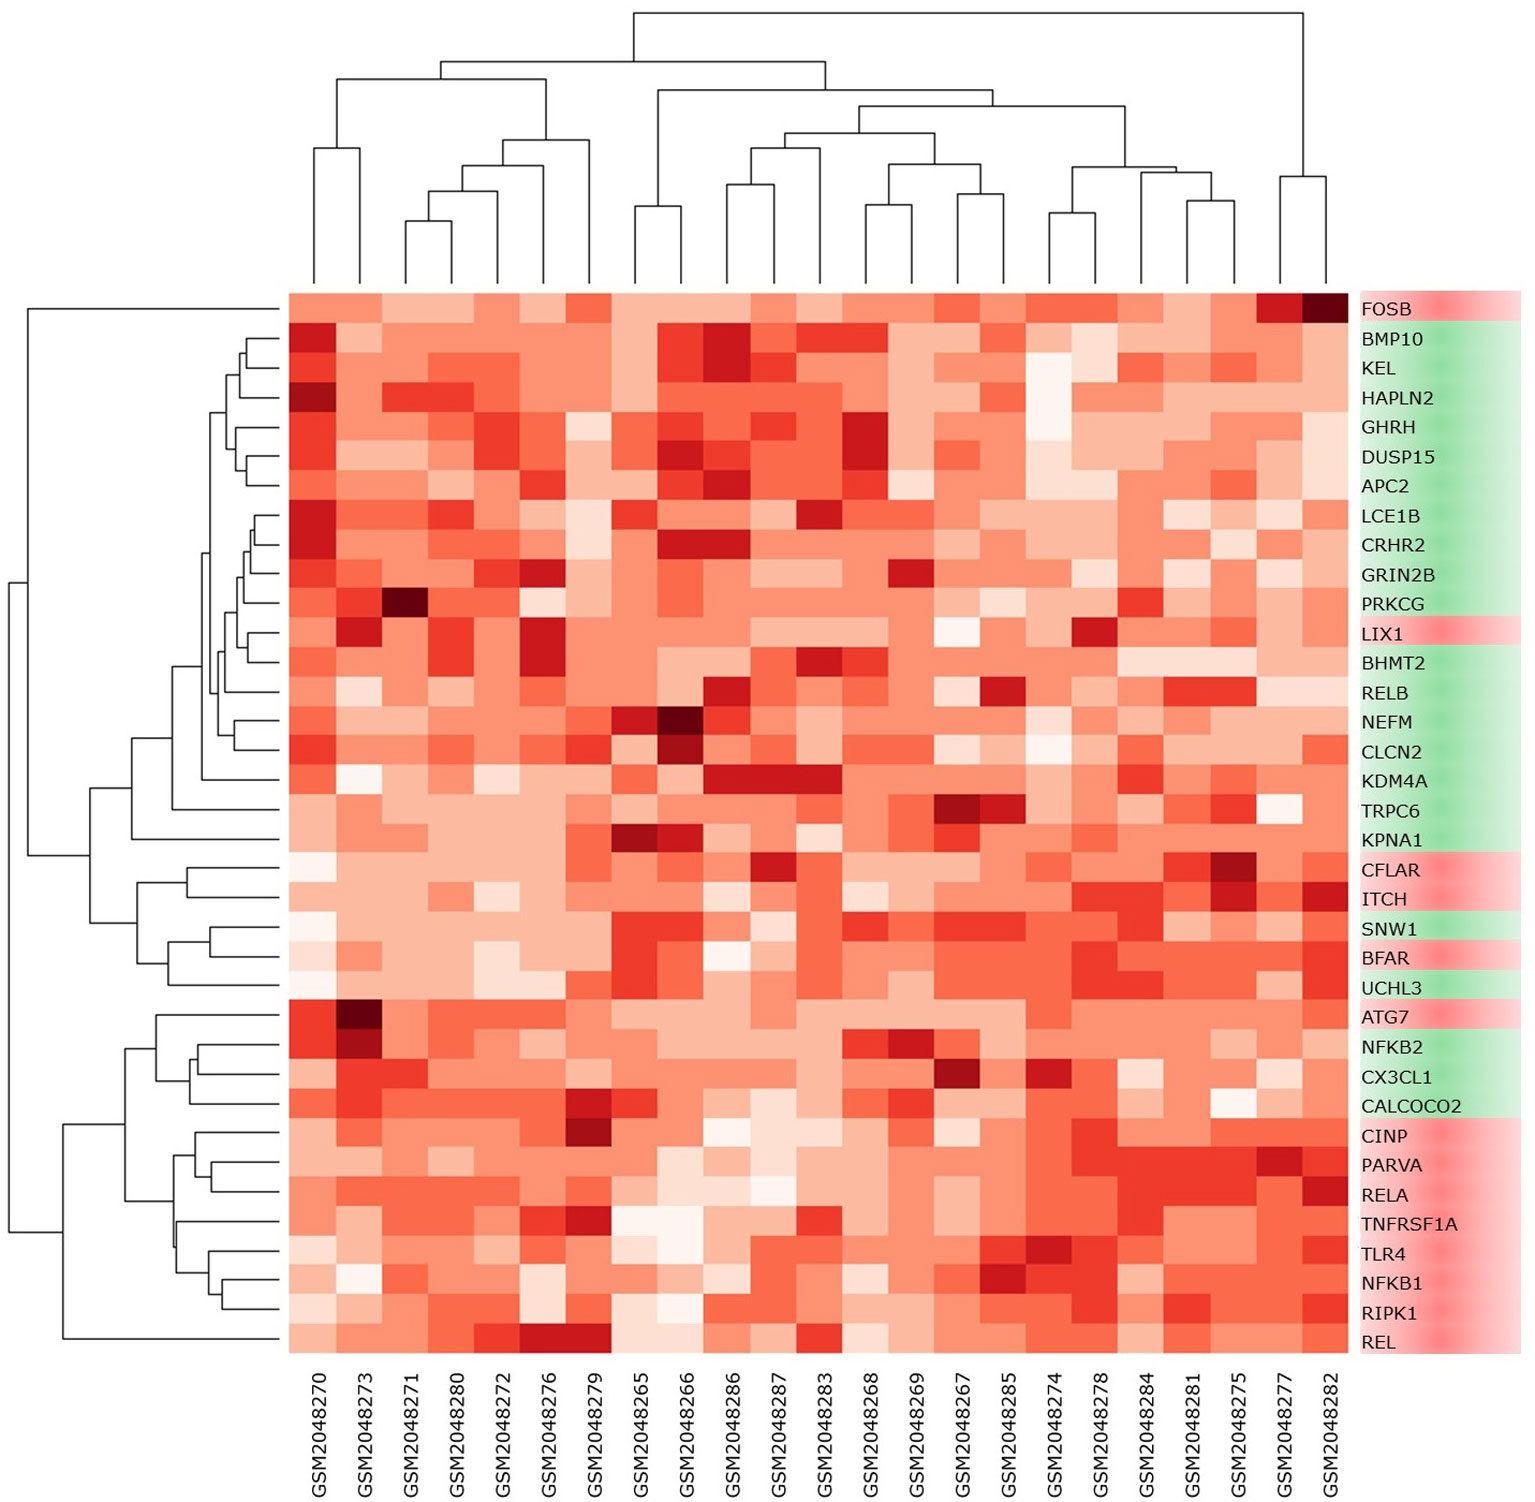
Figure 3 Heat map of NKPF and seed genes in individual sample. The darker the square, the higher the gene expression in that sample.
Analysis of extracted seed genes and NKPF profiles revealed that majority of the seed genes are downregulated. Overall, of 36 genes, 14 are upregulated and 22 are downregulated. Figure 4 shows the expression of each gene in the sample. Among the NKPF category, NFKB1, REL, and RELA are found to be upregulated, with FC ≥ 1.2 in the RA sample, whereas NFKB2 and RELB are downregulated, with FC ≤ −1.2. The most upregulated gene is REL, with FC of 3.04, and the most downregulated gene is KPNA1, with FC of −1.85. It is interesting to note that the most upregulated gene, REL, falls into the NKPF group, whereas most downregulated gene, KPNA1, comes from the seed gene category.
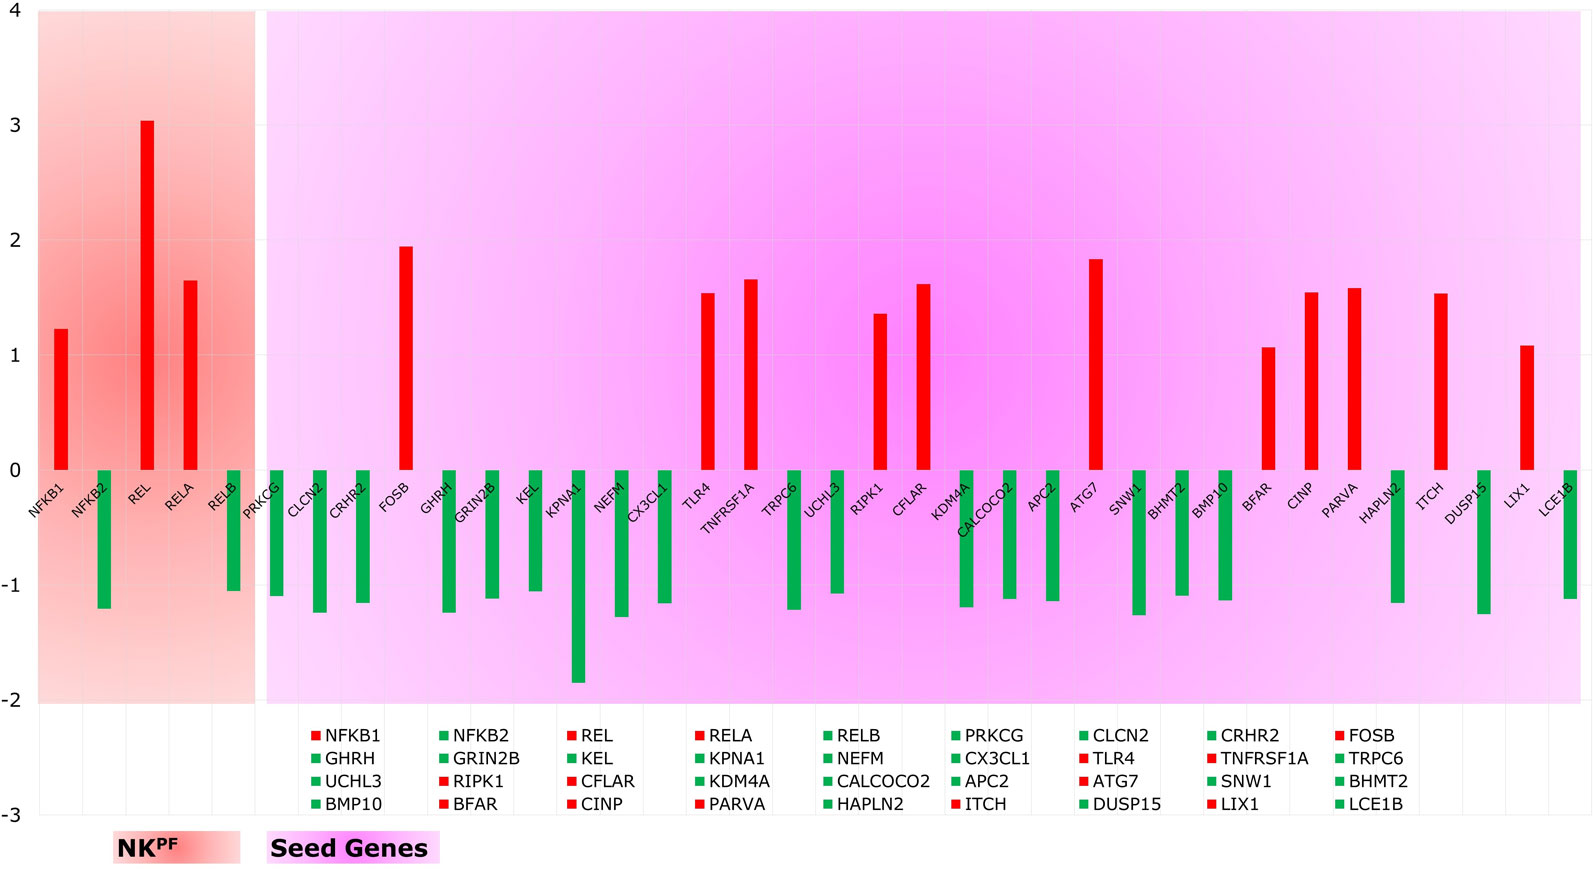
Figure 4 Expression profile of NKPF and seed genes. Red and green colors are the up- and downregulated genes, respectively.
The Protein–Protein Interaction Map
Significant DEGs, 3,573 genes, from the microarray data were used in Bisogenet to build PPIM by extracting all relationships between the queried genes. The PPIM was made stable by eliminating self-loops and repeated edges to calculate the standardized centrality parameters of the whole interactome. Bisogenet produced a complex PPIM which included 2,742 genes and 37,032 interactions, with 13.51 mean edge–node fraction, as given in the supplementary file (Supplementary File 2, Figure S1). The Cytoscape “Network Analyzer” plugin was employed to measure the DC and BC of the interactome.
Regulator Allied Protein Interaction Network
The DEGs in the PPIM were classified into bottlenecks and hubs based on centrality properties for the construction of RAPIN. The threshold cutoff value for bottlenecks (based on BC) and hubs (based on DC) were set based on Eqs. (2) and (1), respectively. A total of 652 genes were categorized as bottlenecks and 131 genes as hubs. Interestingly, seed and NKPF genes like NFKB1, REL, RELA, TLR4, TNFRSF1A, and SNW1 were in the category of hubs and GRIN2B, KPNA1, NFKB2, PRKCG, RELB, CX3CL1, RIPK1, CFLAR, CALCOCO2, ATG7, and ITCH were detected in the bottleneck group (Table 2). The hubs, bottlenecks, NKPF, and seed genes together constitute non-redundant 801 nodes. Interactions among those 801 genes were extracted from the main PPIM to construct regulator specific subnetwork, RAPIN (Supplementary File 2, Figure S2). Subnetwork RAPIN encompasses 801 nodes and 19,050 edges, with 23.75 average edge–node ratio.
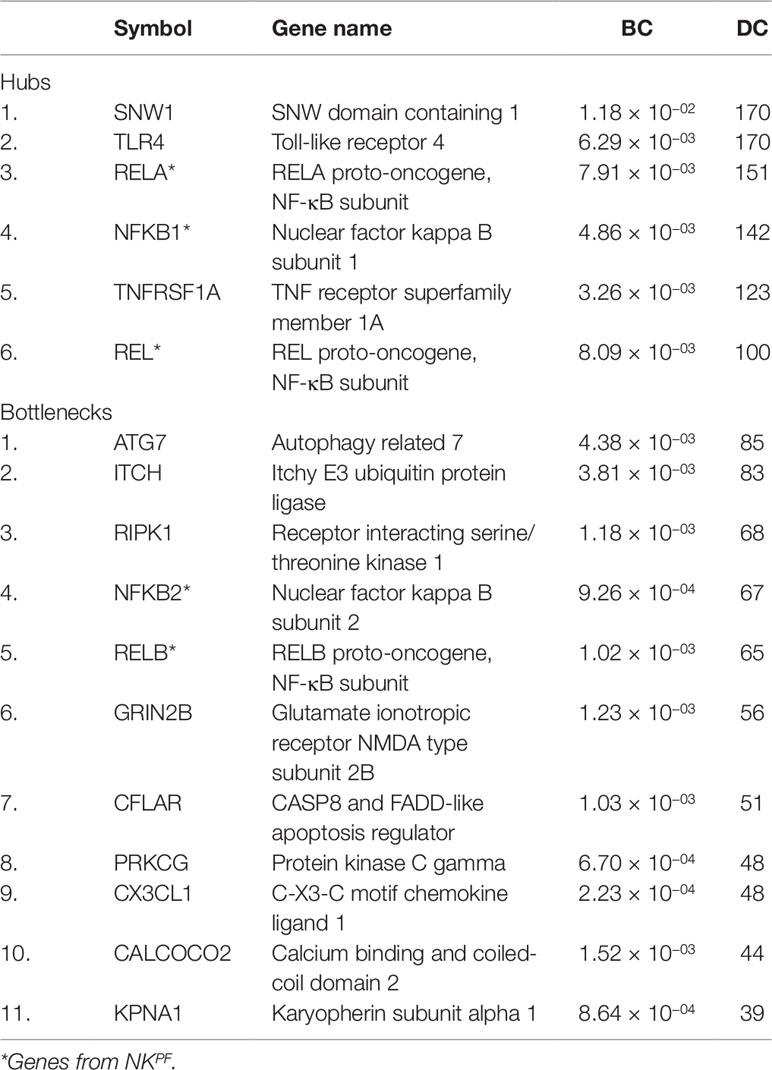
Table 2 The NKPF and seed genes in the hub and bottleneck categories.
Co-Expression Pattern Among the RAPIN Genes
The expression level similarity across 801 genes of RAPIN was created and ranked for both disease and sample data sets using Pearson’s correlation algorithm (Figure 5). Pearson’s correlation algorithm applied to the gene sets created PCC for 320,400 gene pairs from 801 genes belonging to both disease and control samples (Eq. 3). Here, we selected pairs of genes using the following well-established concepts. 1) Expression of gene pairs with high positive correlation. 2) Genes of similar patterns of expression are more likely to interact with one another. Gene pairs with r ≥ 0.8 from the correlation map were chosen for the analysis for both healthy and disease, as a higher r score represents stronger association (Rakshit et al., 2014). Corresponding gene pairs were extracted from the normal and RA correlation map to identify the variation in the co-expression from control to affected tissues.
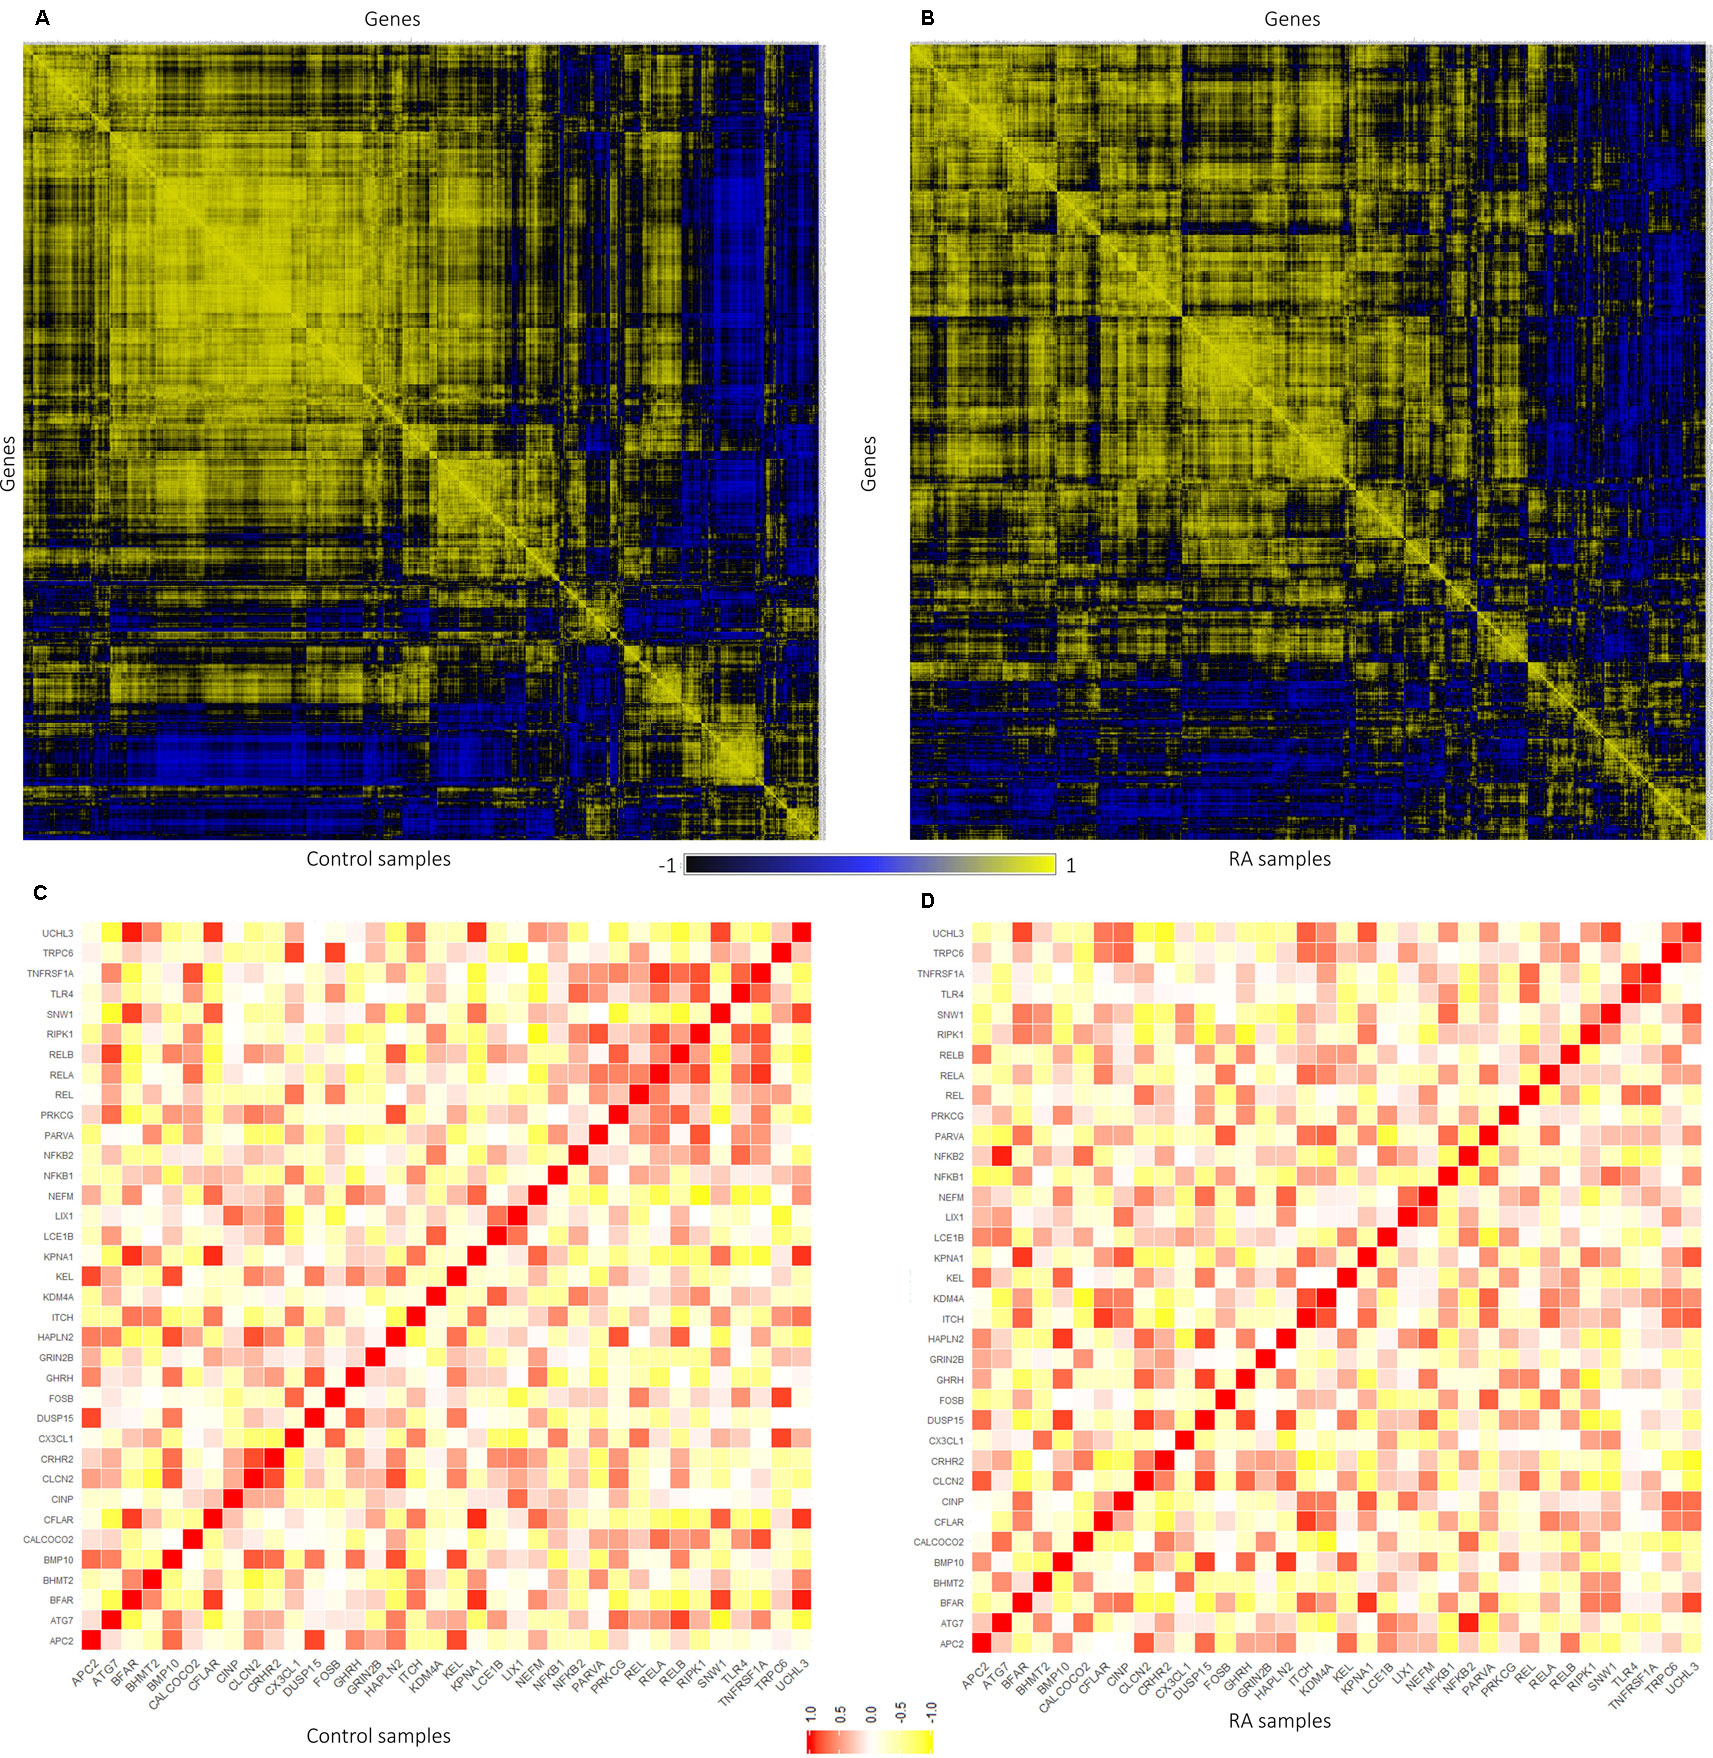
Figure 5 Representation of gene–gene correlation plots for healthy and rheumatoid arthritis (RA) samples. (A) Correlation of gene pairs in control samples (normal). (B) Correlation of gene pairs in RA samples. (C) Gene–gene correlation of NKPF and seed genes in control samples. (D) Gene–gene correlation of NKPF and seed genes in RA samples.
In normal samples, 601 genes were found to have higher correlation and 461 were co-expressed in disease samples (Figure 6). Interestingly, all seed genes were co-expressed in the RA sample, whereas seed genes KDM4A and LIX1 were not co-expressed in normal samples. The total number of gene pairs with higher correlation in normal condition was 28,350 and in RA was 8,747. The correlation loss from normal to RA condition indicates a functional disruption at the genome level.
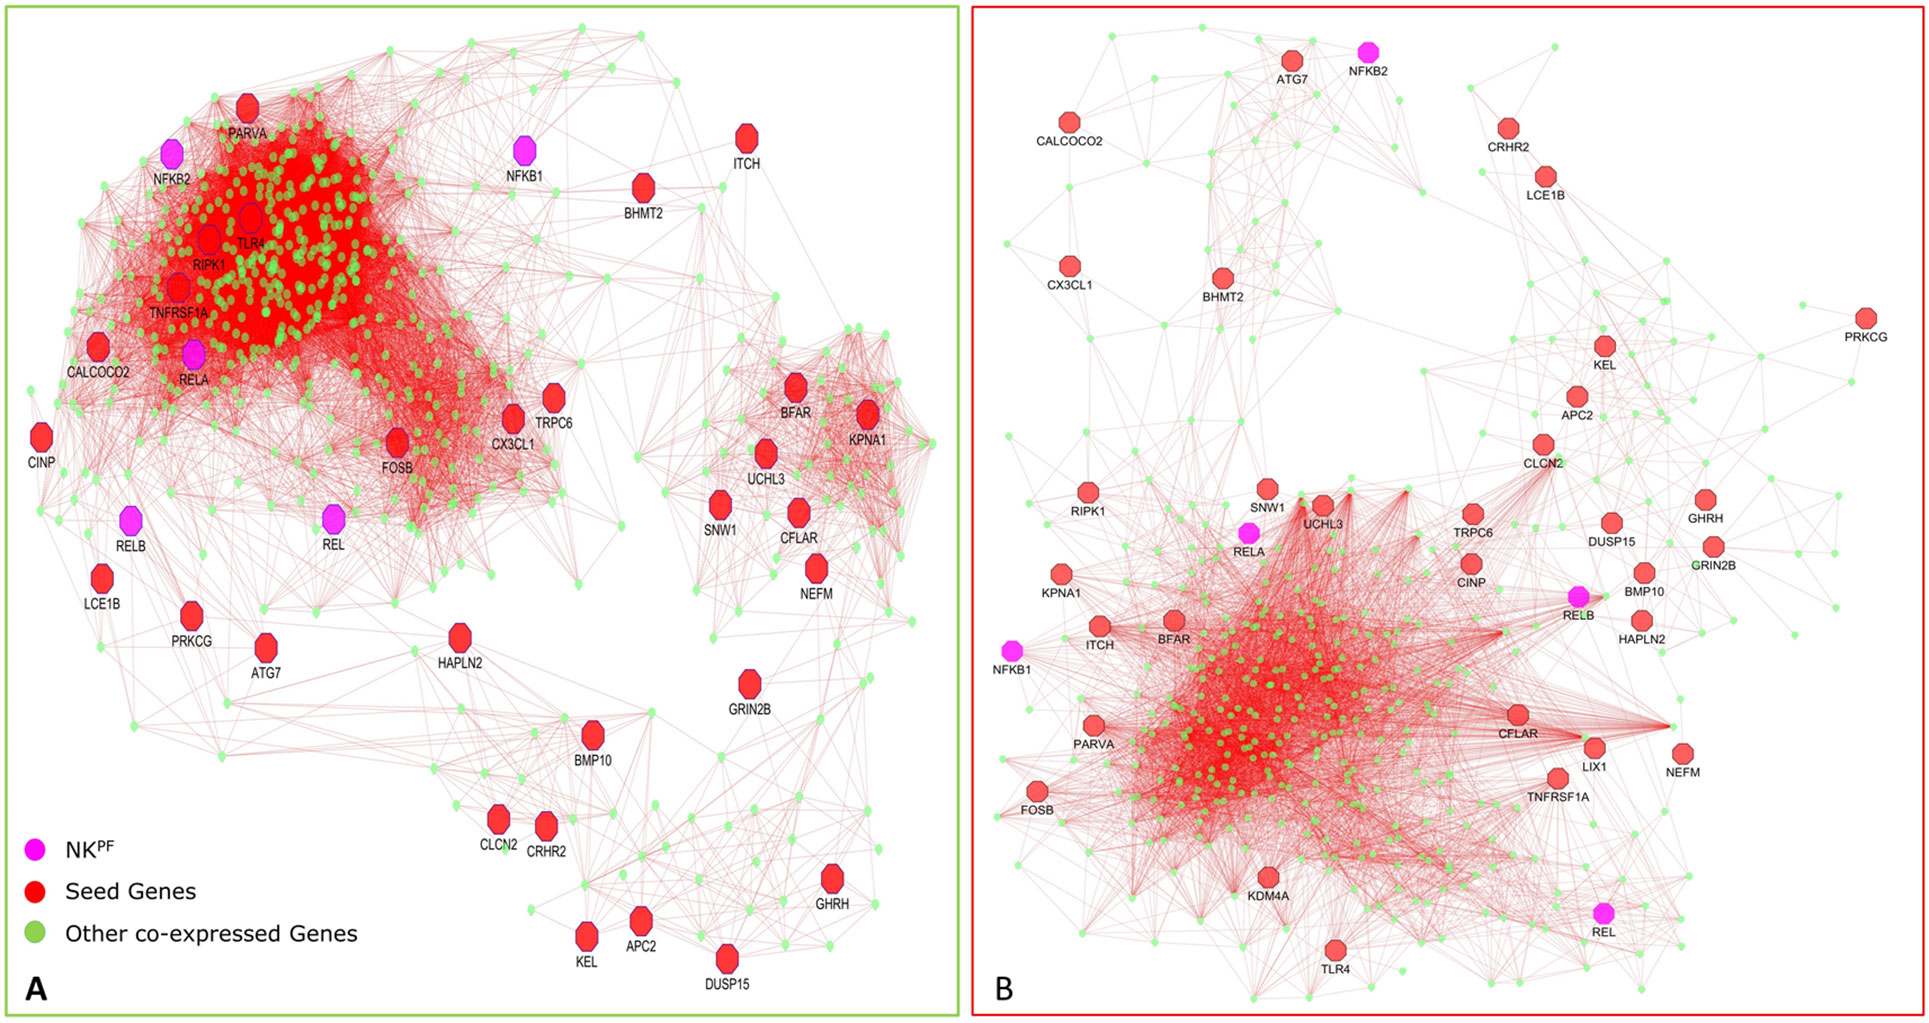
Figure 6 Network of co-expressed RAPIN genes in healthy controls (A) and in RA (B).
Highly co-expressed 28,350 gene pairs in normal samples were mapped to RA to extract the correlation of the same gene pairs to understand the critical variation from normal to RA. Similarly, 8,747 co-expressed gene pairs of RA samples were mapped to normal samples. The absolute difference of correlation was calculated for the gene pairs in both normal and RA conditions. The value of absolute difference ranged from 0 to 2. As the difference value increases, distinction of these gene pairs also increases from one condition to another. Next, we focused on the genes interacting with seed genes and NKPF with distinct variation. We considered a cutoff absolute value of 0.5 to select the gene pairs with distinct variations. We obtained 746 gene pairs (476 genes) in the normal condition that have critical variation of expression from RA. Similarly, 453 gene pairs (318 genes) in RA had distinct deviation from normal condition. Further, we extracted only the connectivity of seed genes and NKPF from the aforesaid interactome. We found 227 genes co-expressed with NKPF and seed genes in normal condition and 171 co-expressed genes in RA condition (Figure 7). We observed a drastic change of connectivity among NF-κB family of proteins with NF-κB regulators (genes from TNF-α and LPS antigenic treatment) from normal to RA condition, which clearly indicates disruption of the NF-κB signaling pathway.
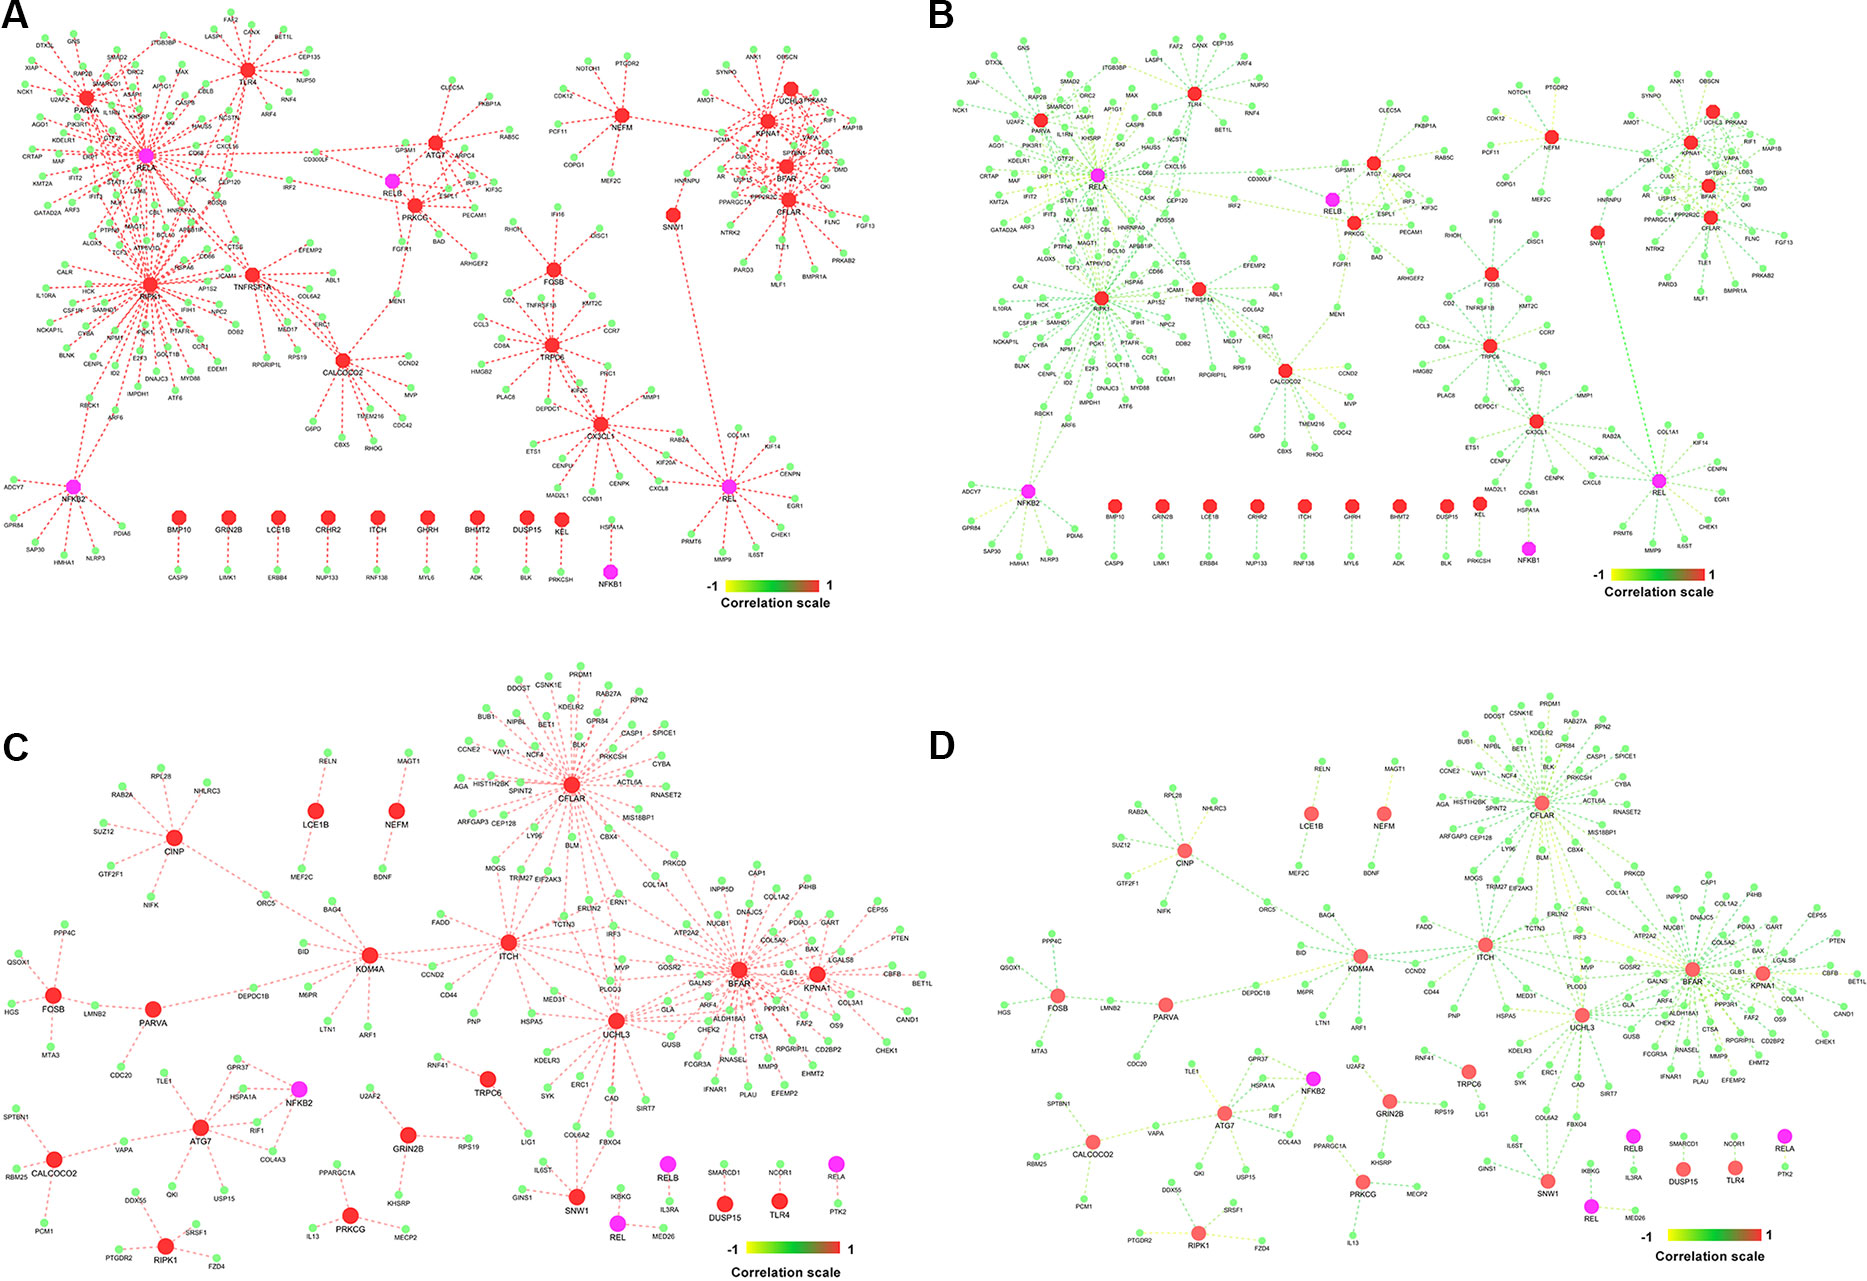
Figure 7 Gene–gene correlation of seed genes, NKPF, and their partners. (A) Co-expression of gene pairs in normal condition. (B) Corresponding correlation of same gene pairs (in A) in rheumatoid arthritis (RA). (C) Co-expression of gene pairs in RA. (D) Corresponding correlation of gene pairs (in C) in healthy controls.
Semantic Similarity Between Co-Expressed Gene Pairs
The co-expressed gene pairs were selected from the RAPIN and semantic similarity of Wang’s measure was applied (Wang et al., 2007). Functional similarity was generated based on the semantic score for co-expressed gene pairs by implementing GoSemSim module in R. Figure 8 depicts the list of top 10 gene pairs with their corresponding correlation and semantic scores for both control and RA samples. Next, we filtered 203 gene pairs (156 genes) from normal condition and 115 gene pairs (101 genes) from RA condition with robust functional relationship depending on a semantic score of ≥0.5.
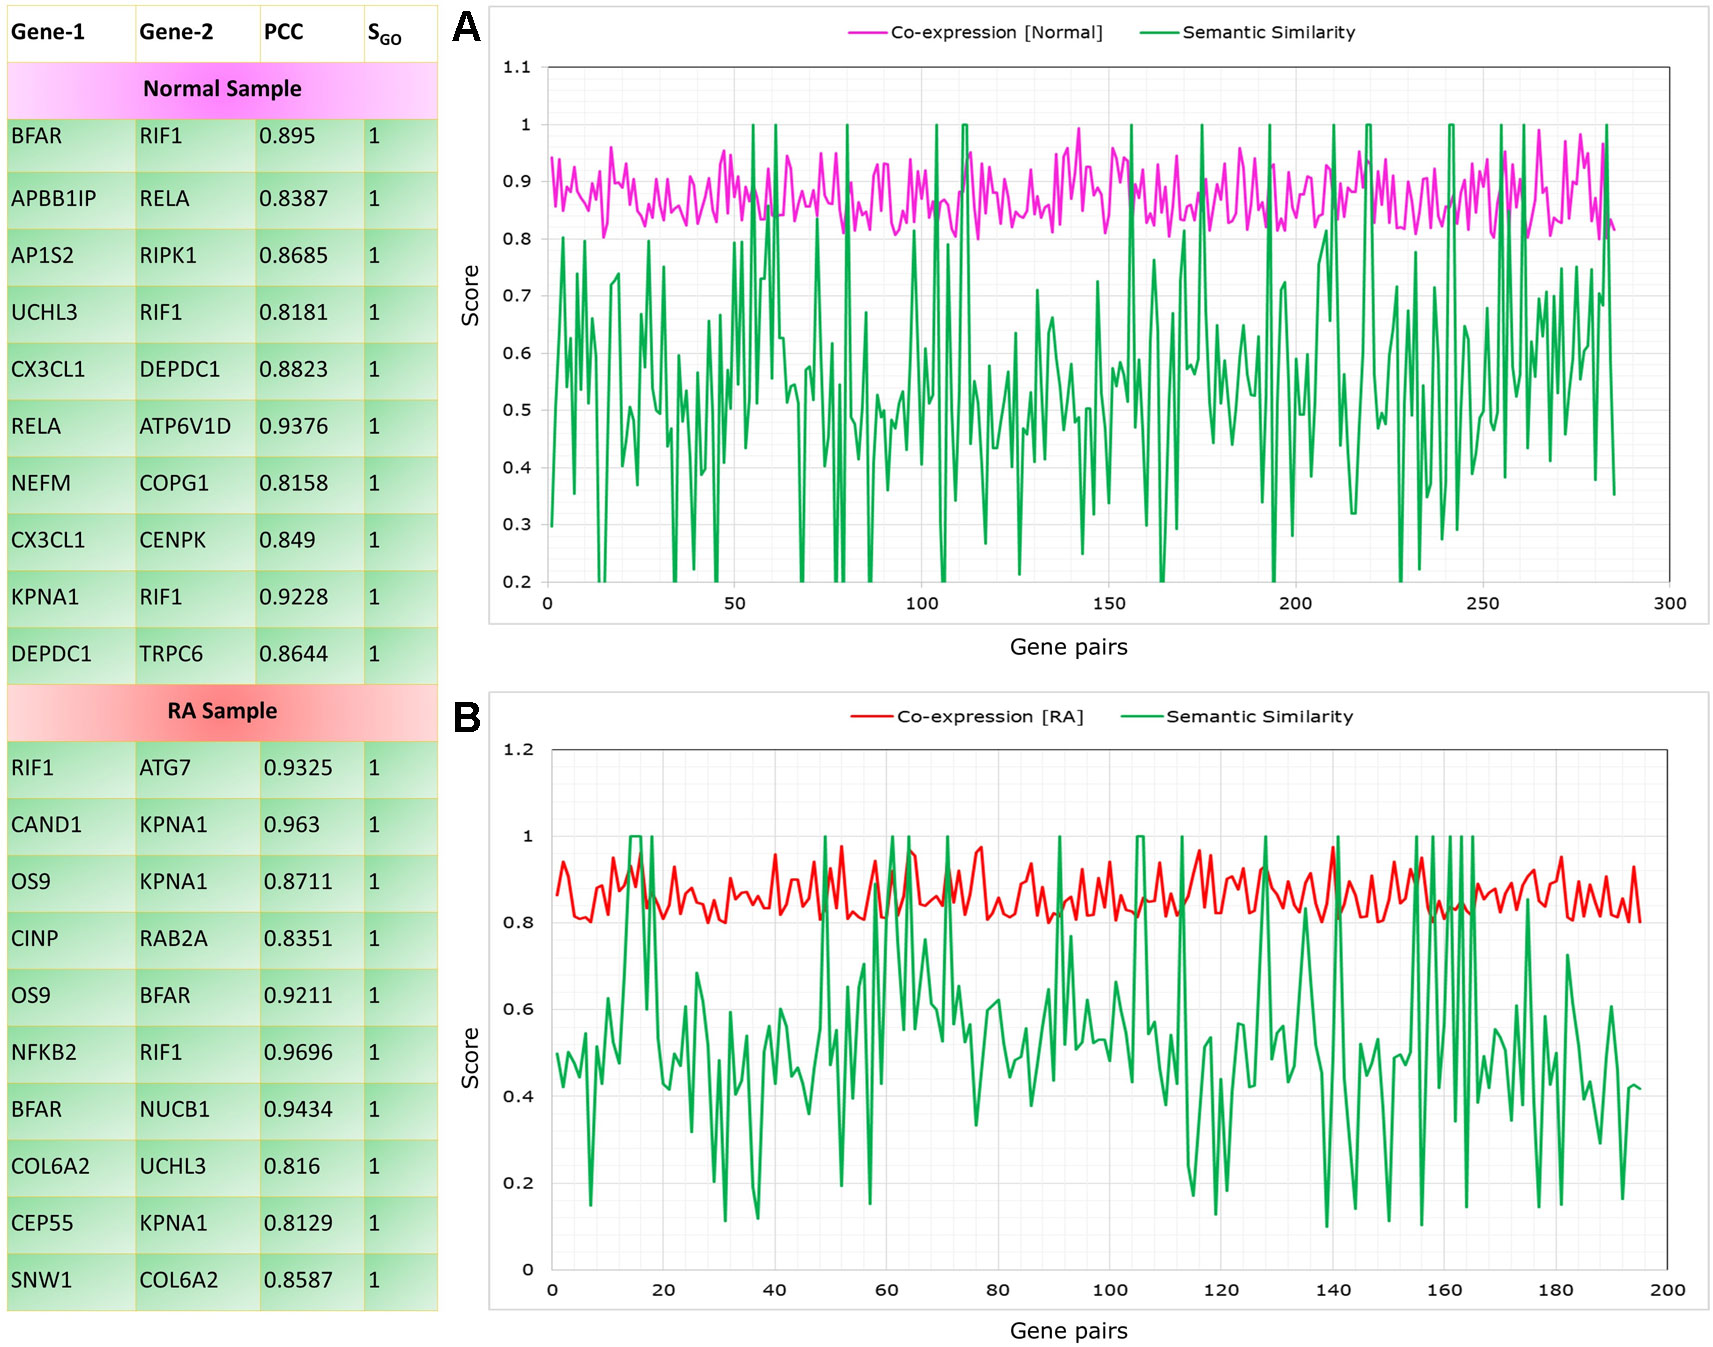
Figure 8 Top gene pairs with their corresponding correlation and semantic scores for both control and rheumatoid arthritis (RA) samples. The graph shows correlation and semantic scores for significantly correlated gene pairs in control (A) and RA samples (B).
In normal condition, the seed genes are directly or indirectly connected to NF-κB protein family with high correlation, whereas there is a serious disruption in the connectivity of NKPF with seed genes or vice versa in RA. To pinpoint the dysregulation among NKPF and seed genes, we performed functional enrichment of connected genes in the normal sample.
Functional Enrichment of Co-Expressed Genes
Gene set enrichment analysis of interconnected genes in the normal sample was performed using ToppGene Suite. The gene sets were enriched in few molecular functions, biological processes, cellular components, and pathways. Fifty-four genes fall into the category of “enzyme binding” (FDR = 8.57 × 10⁻¹⁸), 47 in the category of “protein-containing complex binding” (FDR = 7.59 × 10⁻¹⁶), and nine in the category of “identical protein binding” (FDR = 1.82 × 10−07), which were the top 3 terms of GO molecular function (MF). The top 10 MF among the enriched genes are listed in Table 3. GO cellular component (CC) enrichment showed that the gene products mainly are in “cytoskeletal part” (FDR = 9.60 × 10−09), with a count of 34 genes, followed by “cell junction” (FDR = 7.13 × 10−09) and “neuron part” (FDR = 5.23 × 10−06), with gene counts of 30 and 29, respectively. The top 10 CC among the enriched genes are represented in Table 4. As to the biological process (BP) enrichment, “programmed cell death” (FDR = 1.39 × 10⁻¹⁵), “positive regulation of gene expression” (FDR = 1.76 × 10⁻¹³), and “immune response” (FDR = 4.48 × 10⁻¹⁵) were the most annotated terms, with gene counts of 51, 47, and 45, respectively. The top 10 BP enriched terms are listed in Table 5.
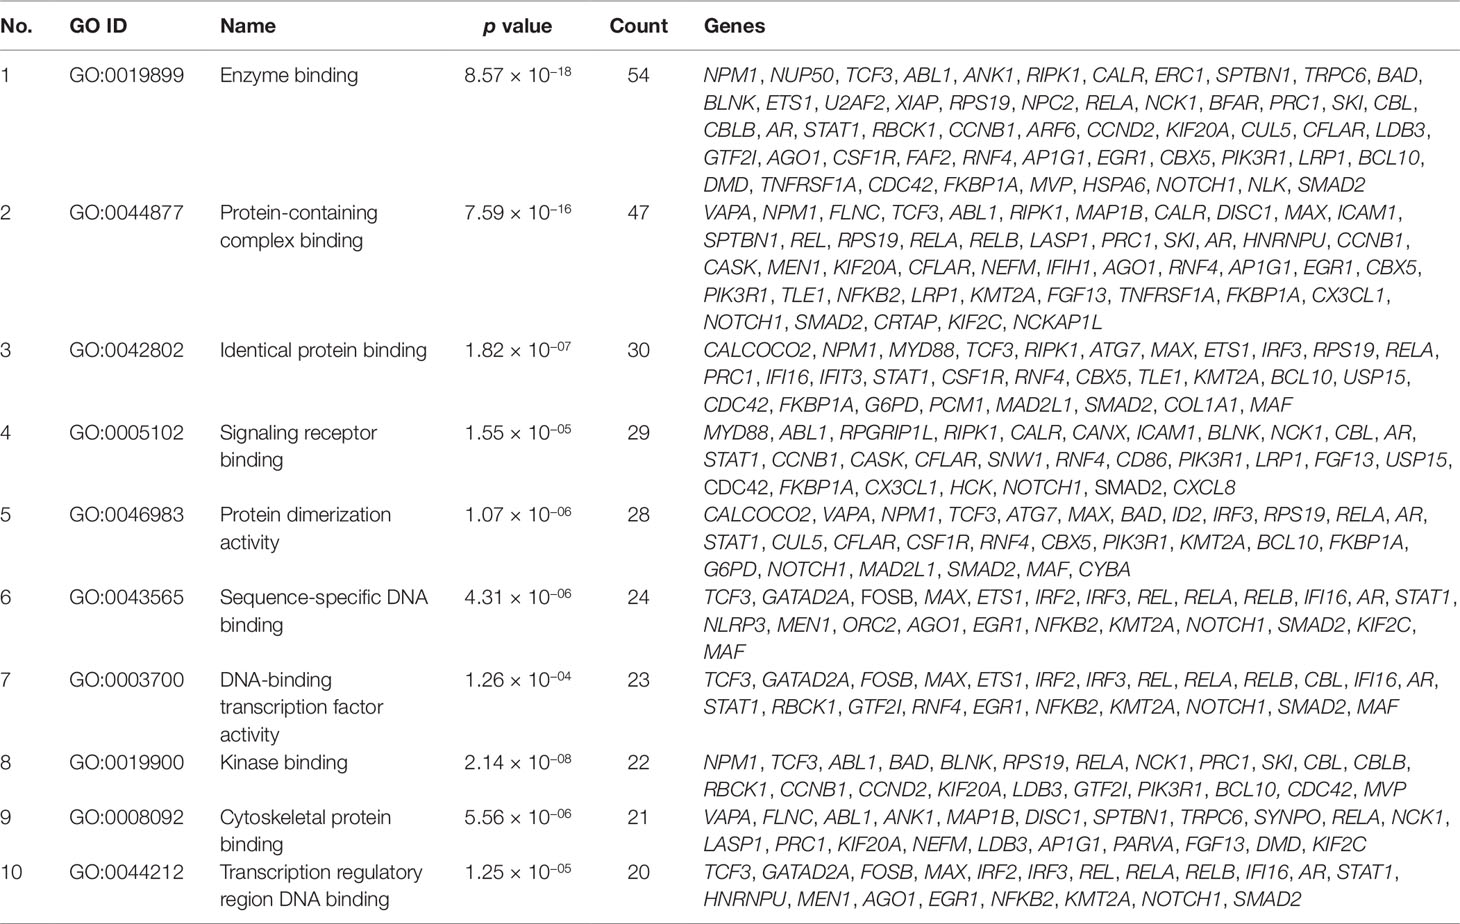
Table 3 Top 10 molecular functions enriched with their respective gene ontology terms and genes.
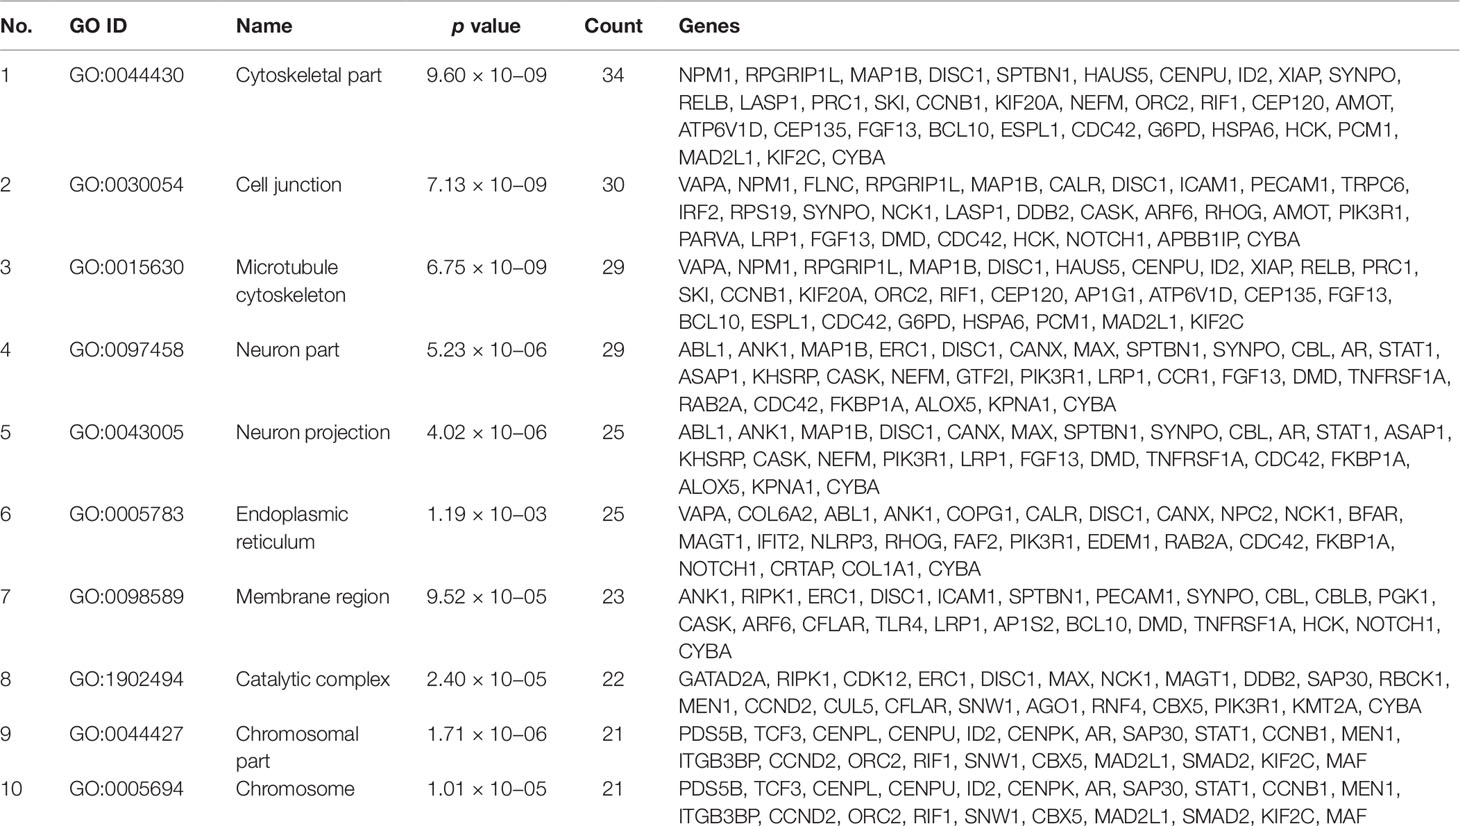
Table 4 Top 10 cellular components enriched with their respective gene ontology terms and genes.
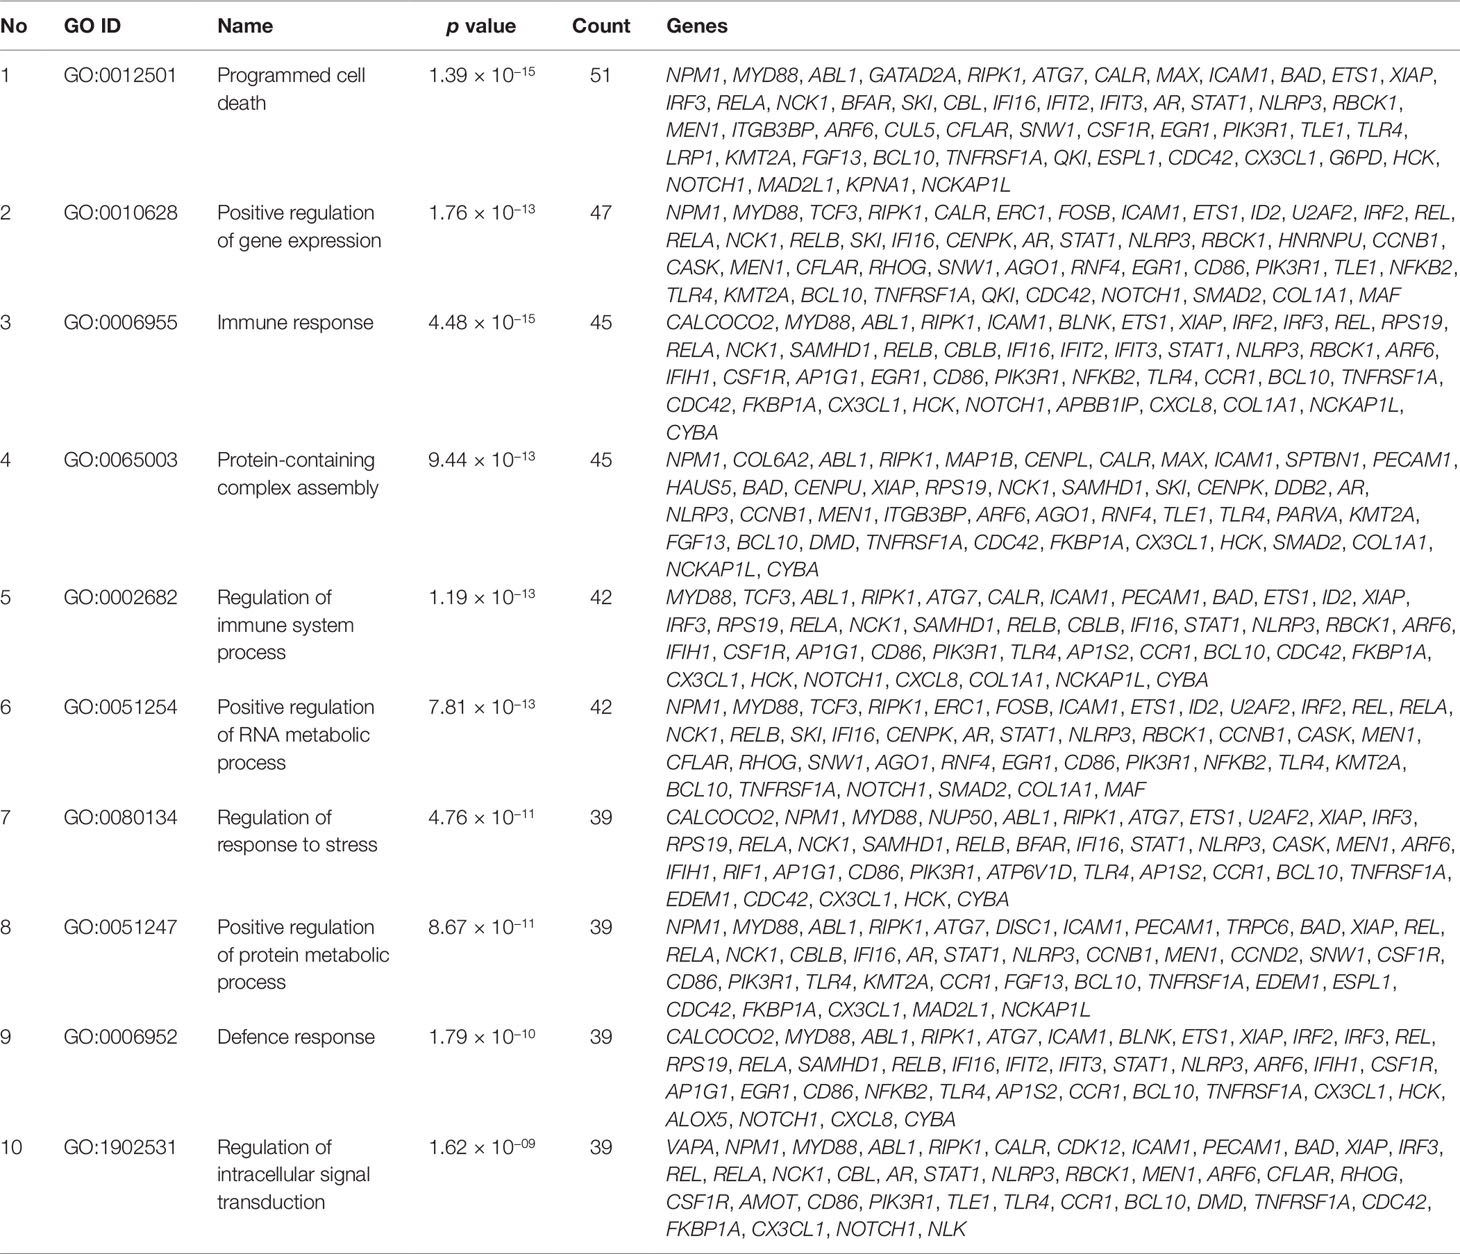
Table 5 Top 10 biological processes enriched with their respective gene ontology terms and genes.
Most of the gene sets are involved in immune- and inflammation-related pathways, like “innate immune system” (FDR = 3.21 × 10−07), “cytokine signaling in immune system” (FDR = 9.88 × 10−08), “adaptive immune system” (FDR = 4.84 × 10−07), “signaling by interleukins” (FDR = 3.04 × 10−05), and “NF kappa B signaling pathway” (FDR = 2.78 × 10⁻¹²), with gene counts ranging from 14 to 36. Details of the top 10 pathways enriched by the gene sets are represented in Table 6.
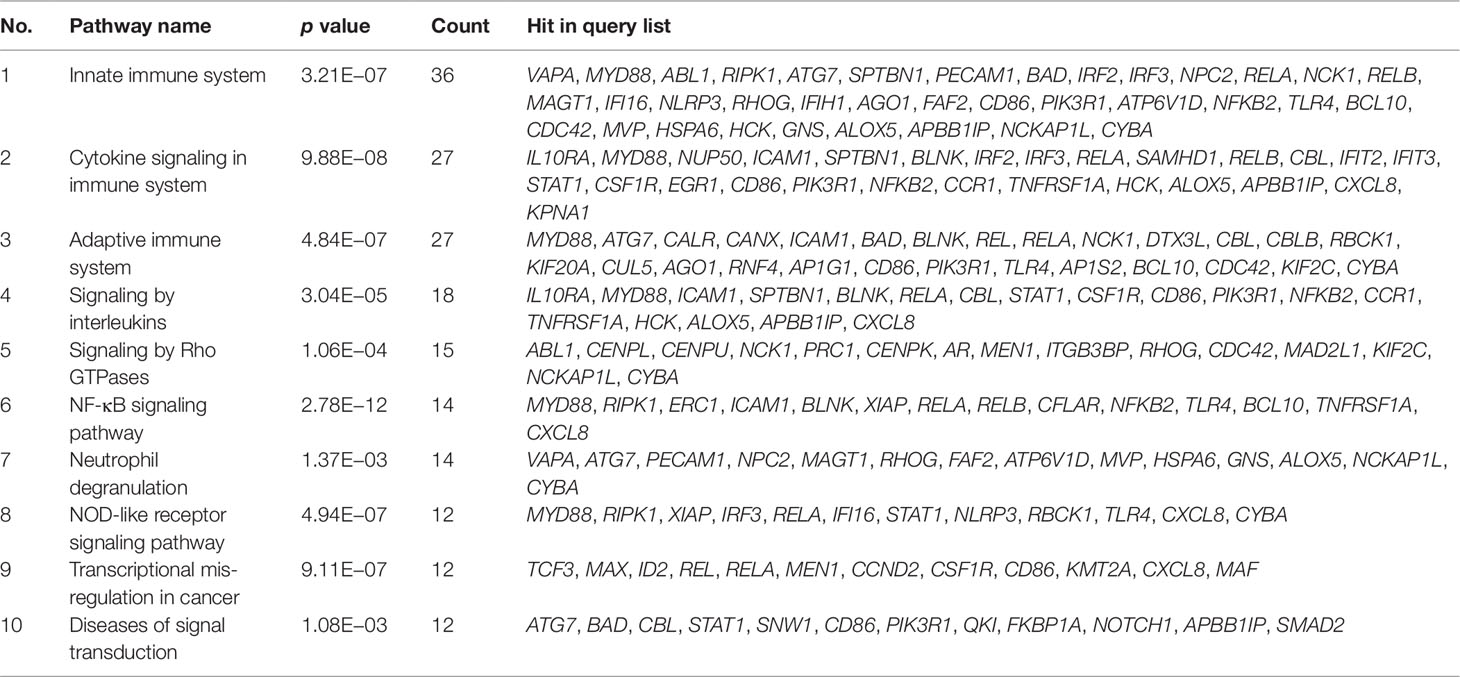
Table 6 Top 10 pathways enriched and number of genes.
By analyzing the pathway interaction network, we observed that seed genes like RIPK1, ATG7, TLR4, TNFRSF1A, KPNA1, CFLAR, SNW1, FOSB, PARVA, CX3CL1, and TRPC6 interact with NKPF category RELA, RELB, NFKB2, and REL in the normal condition and regulate the immune- and inflammatory-related pathways. But this connectivity among the genes are disrupted in the RA condition, leading to deregulation of the pathways. For ease of description, we termed these genes as “driver genes,” which include the NKPF category as well. Notably, they are also involved in “signaling by interleukins,” “cytokine signaling in immune system,” “NOD-like receptor signaling pathway” (FDR = 4.93 × 10−07), “diseases of signal transduction” (FDR = 1 × 10−04), “MAPK signaling pathway” (FDR = 6.4 × 10−05), “Toll-like receptor signaling pathway” (FDR = 2.6 × 10⁻⁹), and “TNF signaling pathway” (FDR = 2.2 × 10⁻⁵). These pathways are also associated with inflammation and immune systems.
GWAS Comparative Analysis
Herein, an effort was made to relate susceptibility loci of inflammation-associated disease conditions in GWAS catalog to the driver genes of RA. We extracted the reported traits of these driver genes from GWAS catalog to detect their association to inflammatory conditions (Supplementary File 2, Table S2). There were 164 hits mapped to driver genes, but genes SNW1 and NFKB2 did not give any result. The GWAS-reported associations for genes of interest are presented in Table 7. We found a set of genes, TNFRSF1A, TLR4, NFKB1, REL, RELA, ATG7, FOSB, KPNA1, and TRPC6, significantly associated with RA. The GWAS overlap to these genes and their significant associated terms are represented in Figure 9. We also performed a literature survey for driver genes to understand whether they are previously linked to RA. This analysis by integrating GWAS studies also substantiates the role of identified genes have support from the genetic data. Outcome from this analysis provides new indications for clarifying the genetic mechanism of RA.
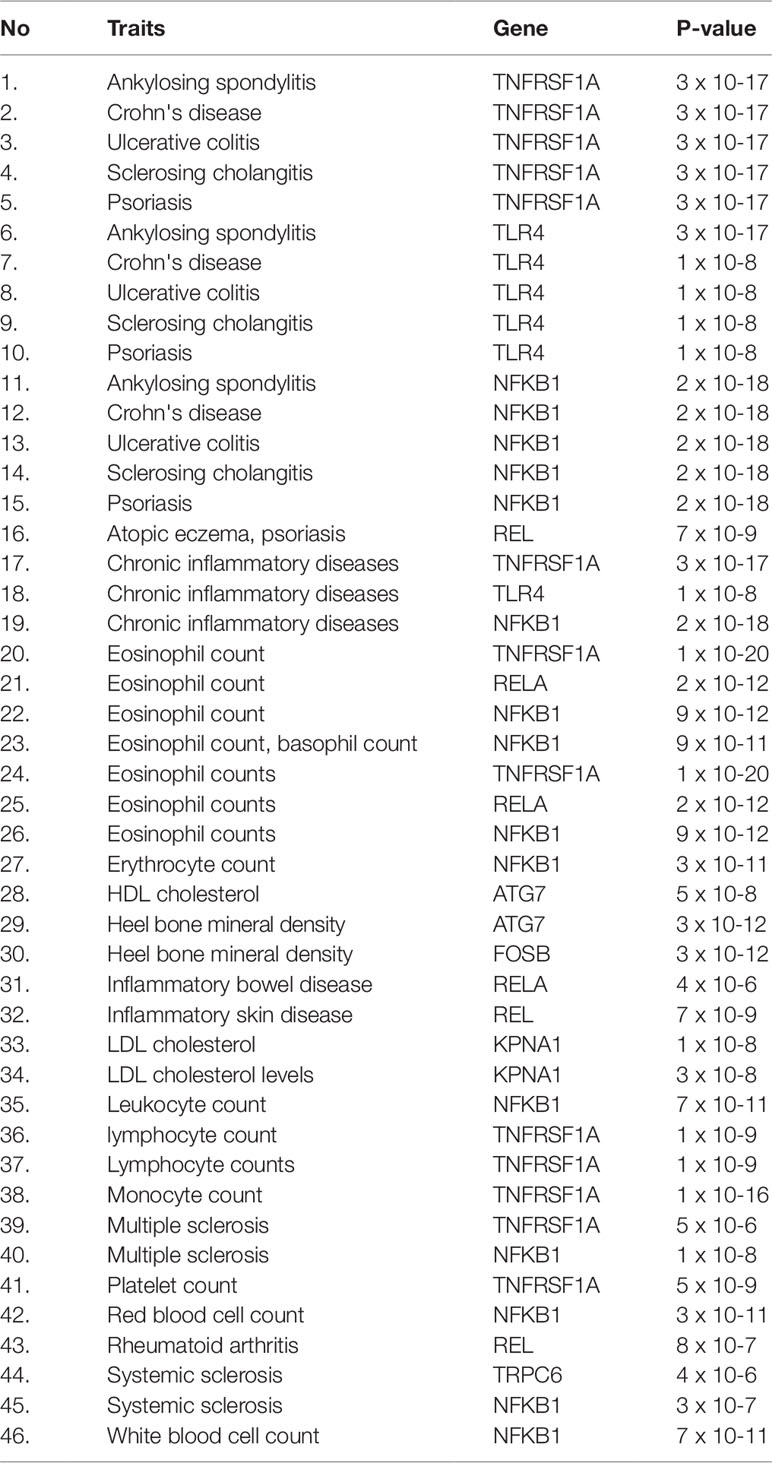
Table 7 The hits from GWAS analysis showing associations to inflammatory conditions.
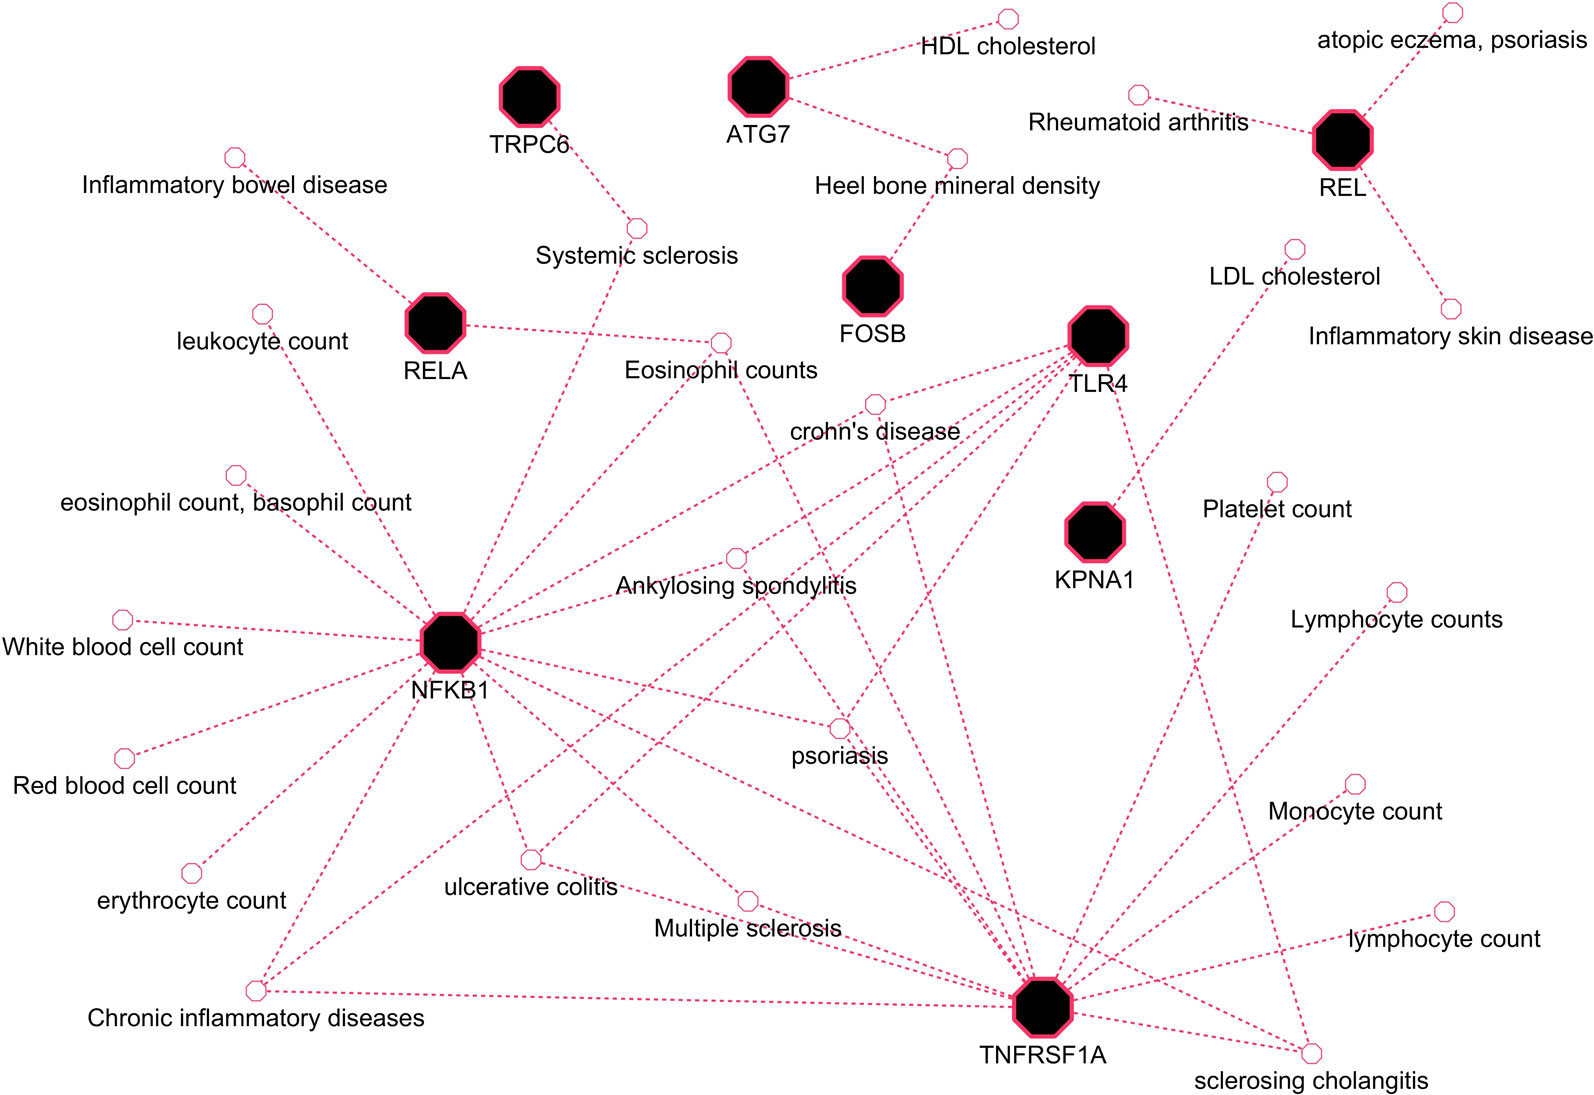
Figure 9 GWAS trait association to driver genes of RA.
Discussion
Classical gene expression techniques generally focus on identifying the single gene that shows a differential expression between two different conditions of interest. Although it is a valuable approach, it often fails to detect metabolic pathways, stress reactions, biological processes, and transcriptional regulations which arise from coordinated activities of a cluster of gene networks (Ghazalpour et al., 2005). Systems biology techniques try to unravel the multifaceted complex conditions or diseases, which usually will not develop due to the instabilities in a single gene function, but instead from changes in several pathways through various intra- and inter-relationships. In addition, different processes occurring inside the body are regulated by specific group of protein complexes. It is well known that in disease condition, protein interaction networks are often altered, stimulating diverse molecular events via a series of processes initiated by the dysregulated protein molecules in the biological network. Network biology provides a great platform to understand the biological mechanisms that can trigger a disease. Present study explores the ideas of correlation, co-expression, and semantic similarity integrated with network biology of genes to identify specific changes in RA condition. We used local and global parameters, DC and BC, respectively, to dissect the complex interactome—PPIM. The DC of a gene is the number of partners that are connected to that specific gene. On other hand, betweenness centrality, BC, of a node exerts control over other nodes which are functionally relevant in the network. The constructed network follows the characteristics of a scale-free network as the connectivity of nodes is in a heterogeneous distribution. The heterogeneous distribution of nodes represents a large number of nodes with few connectivities and few nodes have large number of interactions (Albert, 2005). An edge between the nodes can be a functional or physical connection, which can be a regulatory crosstalk, protein binding, or metabolic action (Barabasi et al., 2011). We observed significant variations in the expression of selected prioritized genes in both the healthy and affected tissues in RA. Initially, a complex network of significant genes from synovial tissue was created which was further disintegrated into a Regulator Allied Protein Interaction Network (RAPIN) based on hubs and bottlenecks. Hubs are considered as key features, and they point to crucial intersections among clusters of genes in a network such that the network is disordered when hub nodes are detached (Csermely et al., 2013). In the biological interactome RAPIN, essential genes are indicated as nodes with high connectivity or degree. Several research investigations have reported that genes involved in disease conditions have higher number of interactions or connectivity when compared to other genes not connected to the disease. We obtained 131 hubs with an average connectivity of 132.54 edges. This supports the significance of hub genes in the biological interactome (Khosravi et al., 2014).
Interestingly, NFKB1, REL, and RELA of the NKPF group and genes like TLR4, TNFRSF1A, and SNW1 of the seed gene set were found in hubs. Functional enrichment and GWAS analysis revealed that the aforesaid hub genes except SNW1 were directly linked with RA. Thus, pinpointing hub genes in the biological interactome can provide improved understanding of disease pathogenesis. On other hand, betweenness centrality of a gene is the control of a gene that indicates the connectivity of other genes which are functionally significant in the interactome. Bottleneck genes show higher betweenness centrality and favor genes which are connected to compact networks instead of genes that are positioned inside the compact cluster (Yoon et al., 2006). GRIN2B, KPNA1, PRKCG, CX3CL1, RIPK1, CFLAR, CALCOCO2, ATG7, and ITCH of seed genes and NFKB2 and RELB of the NKPF category were present in the bottleneck group. The functional enrichment and GWAS analysis revealed that NFKB2, RELB, CX3CL1, RIPK1, and ATG7 are associated with RA. The gene list which emerged after all filtering methods was considered as “driver genes.”
The established theory of network medicine is that primary interacting partners of disease-causing genes may play a role in related diseases. In addition, in a network of disease genes, the non-disease genes tend to have a higher tendency to interact with other disease genes (Csermely et al., 2013). We explored this hypothesis with diseases and pathways related to the driver genes.
NFKB1, REL, RELA, TLR4, TNFRSF1A, and SNW1 act as a central hub in the network with high number functional partners. In the functional enrichment analysis and literature survey, NFKB1, REL, RELA, TLR4, and TNFRSF1A are functionally contributing to RA These genes are also involved in pathways of innate immune system, cytokine signaling in immune system, NF kappa B signaling pathway, osteoclast differentiation, TNF signaling pathway, etc. The role of NF-κB in RA and its potential to become a therapeutic target is extensively reported. Earlier study reveals the role of NF-κB and its significance to RA and inflammation (Simmonds and Foxwell, 2008). Other studies support the hypothesis that NF-κB triggers the pathogenesis of RA and plays a dominant role in eliciting chronic inflammation (Noort et al., 2015; Liu et al., 2017). The molecular stimulating event that initiates this process is not known, but may possibly contain molecules on the surface of T cell receptors and/or Toll-like receptor family ligands. These stimulate macrophage molecules in the synovium, resulting in the phosphorylation of the inhibitor of κB by the complex of IκB kinase that leads to destruction by the proteasome. This discharges NF-κB dimers such as p50/p65 that bring the expression of several pro-inflammatory chemokines and cytokines and results in inflammation and penetration of high amount of immune-related elements into the synovium. Inflammatory mediators, mainly TNF-α, stimulate cells in the synovium in a paracrine and autocrine manner, which is NF-κB-dependent. Fibroblasts trigger various NF-κB-induced genes by reacting to TNF-α or IL-1, together with chemokines, which results in more inflammatory infiltrates and matrix metalloproteinases that initiate joint destruction. Genes of NKPF (family of NF-κB proteins) have a critical role in RA by regulating inflammation and immune system (Makarov, 2001; Feldmann et al., 2002; Roman-Blas and Jimenez, 2006; Noort et al., 2015).
Evidence for the role of another hub gene, TNFRSF1A in RA is extensive. Four GWAS in RA have strongly identified 12p13 as a susceptibility locus, where TNFRSF1A is mapped (Cornelis et al., 1998; Shiozawa et al., 1998; Jawaheer et al., 2001; Osorio et al., 2004). Mutations in the TNFRSF1A gene are dominantly inherited in TRAP syndrome (TRAPS), signifying the association of TNFRSF1A to auto-inflammatory diseases. The R92Q mutation in TNFRSF1A could be involved in RA, as was seen in 5.2% of 135 patients with early arthritis (Aksentijevich et al., 2001; Nowlan et al., 2006; Dieude et al., 2007; Mewar and Wilson, 2011).
Next, we considered the involvement of bottleneck genes (RIPK1, ATG7, NFKB2, RELB, KPNA1, CFLAR, and CX3CL1) in RA. More interestingly, two genes of the NKPF category, NFKB2 and RELB, are found in the bottleneck group. This implies that both hubs and bottlenecks comprised NKPF gene category.
We identified SNW1, a hub gene, and RIPK1 and ATG7, bottleneck genes, which are part of the NKPF group. RIPK1 and ATG7 are also seen in RA pathways. RIPK1 is co-expressed with RELA and is also connected to another RA-associated gene, TLR4 (Figure 7). Recent study reveals that inhibition of RIPK1 reduces the severity of the experimental autoimmune arthritis through osteoclastogenesis suppression (Jhun et al., 2019). The process of osteoclastogenesis is linked to the NF-κB activity. Activation of NF-κB is essential for the formation of osteoclasts (Boyce et al., 2015). There is supporting evidence for inactivating RIPK1 to develop inflammatory response and reduce death of necroptotic cell in vitro and in vivo. A recent study reported RIPK1 as a promising therapeutic target for the treatment of a wide range of human autoimmune and inflammatory diseases (Degterev et al., 2019). They also revealed that RIPK1 is a significant mediator of inflammatory pathways (Degterev et al., 2019). This provides significant support to the network medicine theory that the primary interacting partners of disease genes are contributing to related diseases as well.
The ATG7 gene is co-expressed with RELB, another NKPF gene. This gene codes for E1-like stimulating enzyme that is essential for autophagy and to vacuole transport. Autophagy is a process of degradation whereby cells reutilize cytoplasmic constituents to produce energy. Dysregulation of autophagy pathway is implicated in the pathogenesis of RA. Autophagy controls apoptosis resistance, increases cell division in synovial fibroblasts, and endorses osteoclastogenesis leading to RA (Dai and Hu, 2016). Autophagy may contribute to RA development through multiple processes, e.g., in continuing autoimmune response by cytokine production, survival of inflammatory and autoreactive cells, and presentation of citrullinated antigens to the major histocompatibility complex (Foulquier et al., 2007; Vomero et al., 2018). Also, autophagy inhibits the development of autoimmunity process by removing intracellular pathogens and preserves immune cell homeostasis, with the regulation of immunological tolerance processes. In experimental mouse models of RA, autophagy inhibition decreased symptoms of bone destruction and the quantity of osteoclasts. In this context, drugs that can downregulate autophagy can be used to inhibit resorption of bone in RA patients (Lin et al., 2013).
One of the important findings in our study is the novel association of SNW1 with REL. Till date, the role SNW1 in RA is not reported. This gene becomes significant as it is a hub gene with more functional partners and a strong correlation with REL. Hubs specify significant connectivity among clusters in the biological interactome such that the biological interactions are disordered when hub nodes are detached (Khosravi et al., 2014). Genes involved in disease conditions have higher number of interactions or connectivity when compared to non-diseased genes (Csermely et al., 2013). More interestingly, a recent study has described the critical role of SNW1 in the NF-κB pathway and reports SNW1 as a novel transcriptional regulator of the NF-κB pathway. They also demonstrate that SNW1 is indispensable for the transcriptional elongation of NF-κB target genes like interleukin 8 and tumor necrosis factor genes (Verma et al., 2019). Hence, SNW1’s role in RA can be considered as a novel finding which may act as potential biomarker or drug target for RA as they are found together with other key genes of RA.
Our approach, however, has certain limitations. First, as experimentally proven protein interactions are extracted using Bisogenet plugin, which utilizes interactions from various protein interaction databases, any interactions that are not included in the databases are missing in our work. Furthermore, there are insufficient evidences for few genes engaged in molecular functions or biological processes in gene ontology (GO). In order to overcome these limitations, we tried to include protein interaction based on co-expression. Overall, our research analysis has presented the effectiveness of linking gene expression with their functional relationships in the identification of RA candidate genes. Future experimental validation is required to demonstrate the direct or indirect involvement of the novel candidate genes uncovered in the current study in RA.
Conclusion
This work systematically and scientifically outlines an integrated bioinformatics pipeline to find the most indispensable key signatures from the interactome Regulators Allied Protein Interaction Network (RAPIN). A detailed parametric downstream analysis based on biological insights highlights 11 candidate genes that can act as potential biomarkers or drug targets for RA. One of the remarkable highlights of this analysis is the identification of SNW1 as potential biomarker for RA. Overall, our research analysis has presented the effectiveness of linking genetic expression with their functional relationship in the identification of RA candidate genes. By experimentally authenticating the results using in vitro and in vivo experiments, this can be further extended in order to pinpoint more selective therapeutic agents.
Data Availability Statement
All datasets analyzed for this study are included in the article/Supplementary Material.
Author Contributions
Conceptualization: JS, RE, NS, and MK. Data curation: AE, BB, MS, and HZ. Formal analysis: MA-S, NH, LC, KN, and MK. Funding acquisition: JS. Methodology: BB. Project administration: NA. Resources: MK. Software: BB. Supervision: RE, NS, and MK. Validation: HZ. Visualization: BB. Writing, Original draft: BB, NS, and MK. Writing, review and editing: JS, AE, MA-S, NA, MS, NH, KN, NH, RE, NS, LC, and MK.
Funding
This work was supported by King Abdulaziz City for Science and Technology (KACST), Riyadh, Saudi Arabia, research grant no. AT-35-140.
Acknowledgments
The authors thank KACST and the Deanship of Scientific Research (DSR), Department of Biological Sciences, Faculty of Science, King Abdulaziz University (KAU), Jeddah, Saudi Arabia, for providing services and assistance during the course of the project.
Supplementary Material
The Supplementary Material for this article can be found online at: https://www.frontiersin.org/articles/10.3389/fgene.2019.01163/full#supplementary-material
References
Aksentijevich, I., Galon, J., Soares, M., Mansfield, E., Hull, K., Oh, H. H., et al. (2001). The tumor-necrosis-factor receptor-associated periodic syndrome: new mutations in TNFRSF1A, ancestral origins, genotype-phenotype studies, and evidence for further genetic heterogeneity of periodic fevers. Am. J. Hum. Genet. 69, 301–314. doi: 10.1086/321976
Albert, R. (2005). Scale-free networks in cell biology. J. Cell Sci. 118, 4947–4957. doi: 10.1242/jcs.02714
Aranda, B., Achuthan, P., Alam-Faruque, Y., Armean, I., Bridge, A., Derow, C., et al. (2010). The IntAct molecular interaction database in 2010. Nucleic Acids Res. 38, D525–D531. doi: 10.1093/nar/gkp878
Assenov, Y., Ramirez, F., Schelhorn, S. E., Lengauer, T., Albrecht, M. (2008). Computing topological parameters of biological networks. Bioinf. 24, 282–284. doi: 10.1093/bioinformatics/btm554
Bader, G. D., Betel, D., Hogue, C. W. (2003). BIND: the biomolecular interaction network database. Nucleic Acids Res. 31, 248–250. doi: 10.1093/nar/gkg056
Barabasi, A. L., Gulbahce, N., Loscalzo, J. (2011). Network medicine: a network-based approach to human disease. Nat. Rev. Genet. 12, 56–68. doi: 10.1038/nrg2918
Barton, A., Thomson, W., Ke, X., Eyre, S., Hinks, A., Bowes, J., et al. (2008). Re-evaluation of putative rheumatoid arthritis susceptibility genes in the post-genome wide association study era and hypothesis of a key pathway underlying susceptibility. Hum. Mol. Genet. 17, 2274–2279. doi: 10.1093/hmg/ddn128
Benjamini, Y., Hochberg, J. (2001). Controlling the false discovery rate: a practical and powerful approach to multiple testing. J. R. Stat. Soc. Ser. B. 57 (1), 289–300.
Boyce, B. F., Xiu, Y., Li, J., Xing, L., Yao, Z. (2015). NF-kappaB-mediated regulation of osteoclastogenesis. Endocrinol. Metab. (Seoul) 30, 35–44. doi: 10.3803/EnM.2015.30.1.35
Broeren, M. G., De Vries, M., Bennink, M. B., Arntz, O. J., Blom, A. B., Koenders, M. I., et al. (2016). Disease-Regulated gene therapy with anti-inflammatory Interleukin-10 under the control of the CXCL10 promoter for the treatment of rheumatoid arthritis. Hum. Gene Ther. 27, 244–254. doi: 10.1089/hum.2015.127
Carvalho, B. S., Irizarry, R. A. (2010). A framework for oligonucleotide microarray preprocessing. Bioinf. 26, 2363–2367. doi: 10.1093/bioinformatics/btq431
Chatr-Aryamontri, A., Ceol, A., Palazzi, L. M., Nardelli, G., Schneider, M. V., Castagnoli, L., et al. (2007). MINT: the Molecular INTeraction database. Nucleic Acids Res. 35, D572–D574. doi: 10.1093/nar/gkl950
Chatr-Aryamontri, A., Oughtred, R., Boucher, L., Rust, J., Chang, C., Kolas, N. K., et al. (2017). The BioGRID interaction database: 2017 update. Nucleic Acids Res. 45, D369–D379. doi: 10.1093/nar/gkw1102
Chen, J., Bardes, E. E., Aronow, B. J., Jegga, A. G. (2009). ToppGene Suite for gene list enrichment analysis and candidate gene prioritization. Nucleic Acids Res. 37, W305–W311. doi: 10.1093/nar/gkp427
Cornelis, F., Faure, S., Martinez, M., Prud’homme, J. F., Fritz, P., Dib, C., et al. (1998). New susceptibility locus for rheumatoid arthritis suggested by a genome-wide linkage study. Proc. Natl. Acad. Sci. U. S. A 95, 10746–10750. doi: 10.1073/pnas.95.18.10746
Csermely, P., Korcsmaros, T., Kiss, H. J., London, G., Nussinov, R. (2013). Structure and dynamics of molecular networks: a novel paradigm of drug discovery: a comprehensive review. Pharmacol. Ther. 138, 333–408. doi: 10.1016/j.pharmthera.2013.01.016
Dai, Y., Hu, S. (2016). Recent insights into the role of autophagy in the pathogenesis of rheumatoid arthritis. Rheumatol. (Oxford) 55, 403–410. doi: 10.1093/rheumatology/kev337
Dargham, S. R., Zahirovic, S., Hammoudeh, M., Al Emadi, S., Masri, B. K., Halabi, H., et al. (2018). Epidemiology and treatment patterns of rheumatoid arthritis in a large cohort of Arab patients. PloS One 13, e0208240. doi: 10.1371/journal.pone.0208240
Degterev, A., Ofengeim, D., Yuan, J. (2019). Targeting RIPK1 for the treatment of human diseases. Natl. Acad. Sci. U. S. A 116, 9714–9722. doi: 10.1073/pnas.1901179116
Dieude, P., Goossens, M., Cornelis, F., Michou, L., Bardin, T., Tchernitchko, D. O., et al. (2007). The TNFRSF1A R92Q mutation is frequent in rheumatoid arthritis but shows no evidence for association or linkage with the disease. Ann. Rheum. Dis. 66, 1113–1115. doi: 10.1136/ard.2006.060764
Feldmann, M., Andreakos, E., Smith, C., Bondeson, J., Yoshimura, S., Kiriakidis, S., et al. (2002). Is NF-kappaB a useful therapeutic target in rheumatoid arthritis?. Ann. Rheum. Dis. 61 Suppl 2, ii13–ii18. doi: 10.1136/ard.61.suppl_2.ii13
Foulquier, C., Sebbag, M., Clavel, C., Chapuy-Regaud, S., Al Badine, R., Mechin, M. C., et al. (2007). Peptidyl arginine deiminase type 2 (PAD-2) and PAD-4 but not PAD-1, PAD-3, and PAD-6 are expressed in rheumatoid arthritis synovium in close association with tissue inflammation. Arthritis Rheum. 56, 3541–3553. doi: 10.1002/art.22983
George, G., Valiya Parambath, S., Lokappa, S. B., Varkey, J. (2019). Construction of Parkinson’s disease marker-based weighted protein-protein interaction network for prioritization of co-expressed genes. Gene 697, 67–77. doi: 10.1016/j.gene.2019.02.026
Ghazalpour, A., Doss, S., Sheth, S. S., Ingram-Drake, L. A., Schadt, E. E., Lusis, A. J., et al. (2005). Genomic analysis of metabolic pathway gene expression in mice. Genome Biol. 6, R59. doi: 10.1186/gb-2005-6-7-r59
Gilston, V., Jones, H. W., Soo, C. C., Coumbe, A., Blades, S., Kaltschmidt, C., et al. (1997). NF-kappa B activation in human knee-joint synovial tissue during the early stage of joint inflammation. Biochem. Soc. Trans. 25, 518S. doi: 10.1042/bst025518s
Jawaheer, D., Seldin, M. F., Amos, C. I., Chen, W. V., Shigeta, R., Monteiro, J., et al. (2001). A genomewide screen in multiplex rheumatoid arthritis families suggests genetic overlap with other autoimmune diseases. Am. J. Hum. Genet. 68, 927–936. doi: 10.1086/319518
Jhun, J., Lee, S. H., Kim, S. Y., Ryu, J., Kwon, J. Y., Na, H. S., et al. (2019). RIPK1 inhibition attenuates experimental autoimmune arthritis via suppression of osteoclastogenesis. J. Transl. Med. 17, 84. doi: 10.1186/s12967-019-1809-3
Keshava Prasad, T. S., Goel, R., Kandasamy, K., Keerthikumar, S., Kumar, S., Mathivanan, S., et al. (2009). Human protein reference database–2009 update. Nucleic Acids Res. 37, D767–D772. doi: 10.1093/nar/gkn892
Khosravi, P., Gazestani, V. H., Asgari, Y., Law, B., Sadeghi, M., Goliaei, B. (2014). Network-based approach reveals Y chromosome influences prostate cancer susceptibility. Comput. Biol. Med. 54, 24–31. doi: 10.1016/j.compbiomed.2014.08.020
Kochi, Y., Suzuki, A., Yamamoto, K. (2014). Genetic basis of rheumatoid arthritis: a current review. Biochem. Biophys. Res. Commun. 452, 254–262. doi: 10.1016/j.bbrc.2014.07.085
Lin, N. Y., Beyer, C., Giessl, A., Kireva, T., Scholtysek, C., Uderhardt, S., et al. (2013). Autophagy regulates TNFalpha-mediated joint destruction in experimental arthritis. Ann. Rheum. Dis. 72, 761–768. doi: 10.1136/annrheumdis-2012-201671
Liu, T., Zhang, L., Joo, D., Sun, S. C. (2017). NF-kappaB signaling in inflammation. Signal Transduct Target Ther. 2, 17023. doi: 10.1038/sigtrans.2017.23
Macarthur, J., Bowler, E., Cerezo, M., Gil, L., Hall, P., Hastings, E., et al. (2017). The new NHGRI-EBI catalog of published genome-wide association studies (GWAS Catalog). Nucleic Acids Res. 45, D896–D901. doi: 10.1093/nar/gkw1133
Makarov, S. S. (2001). NF-kappa B in rheumatoid arthritis: a pivotal regulator of inflammation, hyperplasia, and tissue destruction. Arthritis Res. 3, 200–206. doi: 10.1186/ar300
Martin, A., Ochagavia, M. E., Rabasa, L. C., Miranda, J., Fernandez-De-Cossio, J., Bringas, R. (2010). BisoGenet: a new tool for gene network building, visualization and analysis. BMC Bioinf. 11, 91. doi: 10.1186/1471-2105-11-91
Mcgonagle, D., Watad, A., Savic, S. (2018). Mechanistic immunological based classification of rheumatoid arthritis. Autoimmun. Rev. 17, 1115–1123. doi: 10.1016/j.autrev.2018.06.001
Mewar, D., Wilson, A. G. (2011). Treatment of rheumatoid arthritis with tumour necrosis factor inhibitors. Br. J. Pharmacol. 162, 785–791. doi: 10.1111/j.1476-5381.2010.01099.x
Noort, A. R., Tak, P. P., Tas, S. W. (2015). Non-canonical NF-kappaB signaling in rheumatoid arthritis: Dr Jekyll and Mr Hyde? Arthritis Res. Ther. 17, 15. doi: 10.1186/s13075-015-0527-3
Nowlan, M. L., Drewe, E., Bulsara, H., Esposito, N., Robins, R. A., Tighe, P. J., et al. (2006). Systemic cytokine levels and the effects of etanercept in TNF receptor-associated periodic syndrome (TRAPS) involving a C33Y mutation in TNFRSF1A. Rheumatol. (Oxford) 45, 31–37. doi: 10.1093/rheumatology/kei090
Oeckinghaus, A., Ghosh, S. (2009). The NF-kappa B family of transcription factors and its regulation. Cold Spring Harb. Perspect. Biol. 1, a000034. doi: 10.1101/cshperspect.a000034
Okada, Y., Eyre, S., Suzuki, A., Kochi, Y., Yamamoto, K. (2019). Genetics of rheumatoid arthritis: 2018 status. Ann. Rheum. Dis. 78, 446–453. doi: 10.1136/annrheumdis-2018-213678
Osorio, Y. F. J., Bukulmez, H., Petit-Teixeira, E., Michou, L., Pierlot, C., Cailleau-Moindrault, S., et al. (2004). Dense genome-wide linkage analysis of rheumatoid arthritis, including covariates. Arthritis Rheum. 50, 2757–2765. doi: 10.1002/art.20458
Pimentel-Santos, F. M., Ligeiro, D., Matos, M., Mourao, A. F., Costa, J., Santos, H., et al. (2011). Whole blood transcriptional profiling in ankylosing spondylitis identifies novel candidate genes that might contribute to the inflammatory and tissue-destructive disease aspects. Arthritis Res. Ther. 13, R57. doi: 10.1186/ar3309
Rakshit, H., Rathi, N., Roy, D. (2014). Construction and analysis of the protein-protein interaction networks based on gene expression profiles of Parkinson’s disease. PloS One 9, e103047. doi: 10.1371/journal.pone.0103047
Raychaudhuri, S., Sandor, C., Stahl, E. A., Freudenberg, J., Lee, H. S., Jia, X., et al. (2012). Five amino acids in three HLA proteins explain most of the association between MHC and seropositive rheumatoid arthritis. Nat. Genet. 44, 291–296. doi: 10.1038/ng.1076
Rezaei Tavirani, M., Bashash, D., Tajik Rostami, F., Rezaei Tavirani, S., Nikzamir, A., Rezaei Tavirani, M., et al. (2018). Celiac disease microarray analysis based on System Biology Approach. Gastroenterol. Hepatol. Bed Bench 11, 216–224. doi: 10.5812/ijcm.65701
Ritchie, M. E., Phipson, B., Wu, D., Hu, Y., Law, C. W., Shi, W., et al. (2015). limma powers differential expression analyses for RNA-sequencing and microarray studies. Nucleic Acids Res. 43, e47. doi: 10.1093/nar/gkv007
Roman-Blas, J. A., Jimenez, S. A. (2006). NF-kappaB as a potential therapeutic target in osteoarthritis and rheumatoid arthritis. Osteoarthr. Cartilage 14, 839–848. doi: 10.1016/j.joca.2006.04.008
Sabir, J. S. M., El Omri, A., Shaik, N. A., Banaganapalli, B., Al-Shaeri, M. A., Alkenani, N. A., et al. (2019). Identification of key regulatory genes connected to NF-kappaB family of proteins in visceral adipose tissues using gene expression and weighted protein interaction network. PloS One 14, e0214337. doi: 10.1371/journal.pone.0214337
Shaik, N. A., Banaganapalli, B. (2019). Computational molecular phenotypic analysis of PTPN22 (W620R), IL6R (D358A), and TYK2 (P1104A) gene mutations of rheumatoid arthritis. Front. Genet. 10, 168. doi: 10.3389/fgene.2019.00168
Shannon, P., Markiel, A., Ozier, O., Baliga, N. S., Wang, J. T., Ramage, D., et al. (2003). Cytoscape: a software environment for integrated models of biomolecular interaction networks. Genome Res. 13, 2498–2504. doi: 10.1101/gr.1239303
Shiozawa, S., Hayashi, S., Tsukamoto, Y., Goko, H., Kawasaki, H., Wada, T., et al. (1998). Identification of the gene loci that predispose to rheumatoid arthritis. Int. Immunol. 10, 1891–1895. doi: 10.1093/intimm/10.12.1891
Simmonds, R. E., Foxwell, B. M. (2008). Signalling, inflammation and arthritis: NF-kappaB and its relevance to arthritis and inflammation. Rheumatol. (Oxford) 47, 584–590. doi: 10.1093/rheumatology/kem298
Smith, S. L., Plant, D., Eyre, S., Barton, A. (2013). The potential use of expression profiling: implications for predicting treatment response in rheumatoid arthritis. Ann. Rheum. Dis. 72, 1118–1124. doi: 10.1136/annrheumdis-2012-202743
Verma, S., De Jesus, P., Chanda, S. K., Verma, I. M. (2019). SNW1, a novel transcriptional regulator of the NF-kappaB Pathway. Mol. Cell Biol. 39 (3), e00415-18. doi: 10.1128/MCB.00415-18
Vomero, M., Barbati, C., Colasanti, T., Perricone, C., Novelli, L., Ceccarelli, F., et al. (2018). Autophagy and rheumatoid arthritis: current knowledges and future perspectives. Front. Immunol. 9, 1577. doi: 10.3389/fimmu.2018.01577
Wang, J. Z., Du, Z., Payattakool, R., Yu, P. S., Chen, C. F. (2007). A new method to measure the semantic similarity of GO terms. Bioinf. 23, 1274–1281. doi: 10.1093/bioinformatics/btm087
Xenarios, I., Rice, D. W., Salwinski, L., Baron, M. K., Marcotte, E. M., Eisenberg, D. (2000). DIP: the database of interacting proteins. Nucleic Acids Res. 28, 289–291. doi: 10.1093/nar/28.1.289
Yin, J., Hu, T., Xu, L., Li, P., Li, M., Ye, Y., et al. (2019). Circular RNA expression profile in peripheral blood mononuclear cells from Crohn disease patients. Med. (Baltimore) 98, e16072. doi: 10.1097/MD.0000000000016072
Yoon, J., Blumer, A., Lee, K. (2006). An algorithm for modularity analysis of directed and weighted biological networks based on edge-betweenness centrality. Bioinf. 22, 3106–3108. doi: 10.1093/bioinformatics/btl533
Keywords: rheumatoid arthritis, auto-inflammatory disease, NF-κB, GEO, gene expression
Citation: Sabir JSM, El Omri A, Banaganapalli B, Al-Shaeri MA, Alkenani NA, Sabir MJ, Hajrah NH, Zrelli H, Ciesla L, Nasser KK, Elango R, Shaik NA and Khan M (2019) Dissecting the Role of NF-κb Protein Family and Its Regulators in Rheumatoid Arthritis Using Weighted Gene Co-Expression Network. Front. Genet. 10:1163. doi: 10.3389/fgene.2019.01163
Received: 24 July 2019; Accepted: 23 October 2019;
Published: 20 November 2019.
Edited by:
Haranatha R. Potteti, University of Illinois at Chicago, Chicago, United StatesReviewed by:
Narasimha Reddy Parine, King Saud University, Saudi ArabiaAli Mokhtar Mahmoud, Italian National Research Council (CNR), Italy
Copyright © 2019 Sabir, El Omri, Banaganapalli, Al-Shaeri, Alkenani, Sabir, Hajrah, Zrelli, Ciesla, Nasser, Elango, Shaik and Khan. This is an open-access article distributed under the terms of the Creative Commons Attribution License (CC BY). The use, distribution or reproduction in other forums is permitted, provided the original author(s) and the copyright owner(s) are credited and that the original publication in this journal is cited, in accordance with accepted academic practice. No use, distribution or reproduction is permitted which does not comply with these terms.
*Correspondence: Noor Ahmad Shaik, bnNoYWlrQGthdS5lZHUuc2E=; Muhummadh Khan, bWtta2hhbkBrYXUuZWR1LnNh
†These authors have contributed equally to this work