
95% of researchers rate our articles as excellent or good
Learn more about the work of our research integrity team to safeguard the quality of each article we publish.
Find out more
ORIGINAL RESEARCH article
Front. Genet. , 19 September 2019
Sec. Computational Genomics
Volume 10 - 2019 | https://doi.org/10.3389/fgene.2019.00864
This article is part of the Research Topic Intelligent Systems for Genome Functional Annotations View all 9 articles
 Y-h. Taguchi1*
 Turki Turki2
Although single-cell RNA sequencing (scRNA-seq) technology is newly invented and a promising one, but because of lack of enough information that labels individual cells, it is hard to interpret the obtained gene expression of each cell. Because of insufficient information available, unsupervised clustering, for example, t-distributed stochastic neighbor embedding and uniform manifold approximation and projection, is usually employed to obtain low-dimensional embedding that can help to understand cell–cell relationship. One possible drawback of this strategy is that the outcome is highly dependent upon genes selected for the usage of clustering. In order to fulfill this requirement, there are many methods that performed unsupervised gene selection. In this study, a tensor decomposition (TD)-based unsupervised feature extraction (FE) was applied to the integration of two scRNA-seq expression profiles that measure human and mouse midbrain development. TD-based unsupervised FE could select not only coincident genes between human and mouse but also biologically reliable genes. Coincidence between two species as well as biological reliability of selected genes is increased compared with that using principal component analysis (PCA)-based FE applied to the same data set in the previous study. Since PCA-based unsupervised FE outperformed the other three popular unsupervised gene selection methods, highly variable genes, bimodal genes, and dpFeature, TD-based unsupervised FE can do so as well. In addition to this, 10 transcription factors (TFs) that might regulate selected genes and might contribute to midbrain development were identified. These 10 TFs, BHLHE40, EGR1, GABPA, IRF3, PPARG, REST, RFX5, STAT3, TCF7L2, and ZBTB33, were previously reported to be related to brain functions and diseases. TD-based unsupervised FE is a promising method to integrate two scRNA-seq profiles effectively.
Single-cell RNA sequencing (scRNA-seq) (Sasagawa et al., 2019) is a newly invented technology that enables us to measure the amount of RNA in a single-cell basis. In spite of its promising potential, it is not easy to interpret the measurements. The primary reason of this difficulty is the lack of sufficient information that characterizes individual cells. In contrast to the huge number of cells measured, which is often as many as several thousands, the number of labeling is limited, for example, measurement of conditions as well as the amount of expression of key genes measured by fluorescence-activated cell sorting, whose number is typically as little as tens. This prevents us from selecting genes that characterize the individual cell properties.
In order to deal with samples without suitable numbers of labeling, unsupervised method is frequently used, since it does not make use of labeling information directly. K-means clustering and hierarchical clustering are popular methodologies that are often applied to gene expression analysis. The popular clustering methods specifically applied to scRNA-seq are t-distributed stochastic neighbor embedding (tSNE) (van der Maaten and Hinton, 2008) and uniform manifold approximation and projection (UMAP) (McInnes et al., 2018), which are known to be useful to get low-dimensional embedding of a set of cells. In spite of that, the obtained clusters are highly dependent upon genes used for clustering. Thus, the next issue is, without labeling (i.e., pre-knowledge), to select genes that might be biologically meaningful.
The various unsupervised gene selection methods applicable to scRNA-seq were invented, for example, highly variable genes, bimodal genes, dpFeature, and principal component analysis (PCA)-based unsupervised feature extraction (FE) (Murakami et al., 2012; Taguchi and Okamoto, 2012; Taguchi and Murakami, 2013; Ishida et al., 2014; Kinoshita et al., 2014; Murakami et al., 2014; Taguchi, 2014; Taguchi and Murakami, 2014; Umeyama et al., 2014; Murakami et al., 2015; Taguchi, 2015; Taguchi et al., 2015a; Taguchi et al., 2015b; Taguchi et al., 2015c; Taguchi et al., 2016; Taguchi, 2016a; Taguchi, 2016b; Taguchi, 2016c; Taguchi, 2016d; Taguchi and Wang, 2017; Taguchi et al., 2017; Taguchi, 2017d; Taguchi and Wang, 2018a; Taguchi, 2018a; Taguchi and Wang, 2018b). Chen et al. (2018) recently compared genes selected by these methods and concluded that the genes selected are very diverse and have their own (unique) biological features. In this sense, it is required to invent more advanced unsupervised gene selection methods that can select more biologically relevant genes.
In this paper, we propose the application of tensor decomposition (TD)-based unsupervised FE (Taguchi, 2017a; Taguchi, 2017b; Taguchi, 2017c; Taguchi, 2017e; Taguchi, 2017f; Taguchi and Ng, 2018; Taguchi, 2018b; Taguchi, 2018c; Taguchi, 2019a). It is an advanced method of PCA-based unsupervised FE for scRNA-seq analysis. For more details about PCA-based unsupervised FE and TD-based unsupervised FE, see the recently published book (Taguchi, 2019b). Especially focusing on the integration of two scRNA-seq profiles, the advantages of TD-based unsupervised FE when compared with PCA-based unsupervised FE are as follows: The former can integrate more than two gene expressions prior to the analysis, while the latter can only integrate the results obtained by applying the method to individual data sets.
In the following, based on the previous study (Taguchi, 2018a) where PCA-based unsupervised FE was employed, we try to integrate human and mouse midbrain development gene expression profiles to obtain key genes that contribute to this process, by applying TD-based unsupervised FE. It turned out that TD-based unsupervised FE can identify biologically more relevant and more common genes between human and mouse than can PCA-based unsupervised FE that outperformed other compared methods.
The first scRNA-seq data used in this study were downloaded from Gene Expression Omnibus (GEO) under the GEO ID GSE76381; the files named “GSE76381_EmbryoMoleculeCounts.cef.txt.gz” (for human) and “SE76381_MouseEmbryoMoleculeCounts.cef.txt.gz” (for mouse) were downloaded. These two gene expression profiles were generated from scRNA-seq data set: One represents human embryo ventral midbrain cells between 6 and 11 weeks of gestation (287 cells for 6 weeks, 131 cells for 7 weeks, 331 cells for 8 weeks, 322 cells for 9 weeks, 509 cells for 10 weeks, and 397 cells for 11 weeks, for a total of 1,977 cells). Another is a set of mouse ventral midbrain cells at six developmental stages between E11.5 and E18.5 (349 cells for E11.5, 350 cells for E12.5, 345 cells for E13.5, 308 cells for E14.5, 356 cells for E15.5, 142 cells for E18.5, and 57 cells for unknown, for a total of 1,907 cells).
The second scRNA-seq data used in this study were downloaded from GEO under GEOID GSE74672; the file named “GSE74672_expressed_mols_with_classes.xlsx.gz” was downloaded. It is generated from scRNA-seq data set that measures mouse hypothalamus with and without acute formalin stress. Various meta-data, which are included in the first 11 rows of the data set, are available. The meta-data available include sex, age, cell types [astrocytes, endothelial, ependymal, microglia, neurons, oligos, and vascular smooth muscle (VSM)], control vs stressed samples, and so on.
TD-based unsupervised FE is a recently proposed method successfully applied to various biological problems. TD-based unsupervised FE can be used for integration of multiple measurements applied to the common set of genes. Suppose xij ∈ ℝN×M and xik ∈ ℝN×K are the ith expression of the jth and kth cells under the two distinct conditions (in the present study, they are human and mouse), respectively. Then the three-mode tensor, xijk ∈ ℝN×M×K, where N (= 13,889) is total number of common genes between human and mouse, which share gene symbols, M (= 1,977) is the number of human cells, and K (= 1,907) is total number of mouse cells, is defined as
It is Case II Type I tensor (Taguchi, 2017e). Since it is too large to be decomposed, it is further transformed into Type II tensor, as follows:
where is now not a tensor but a matrix. In this case, TD is equivalent to singular value decomposition (SVD). After applying SVD to xjk , we get SVD,
where and are singular value vectors attributed to cells of human scRNA-seq and those of mouse scRNA-seq, respectively. Here, Case II means that tensor is generated such that two matrices share the genes, while Type II means that summation is taken over as in Eq. (2). On the other hand, the tensor before taking summation as in Eq. (1) is Type I.
Singular value vectors attributed to genes of human and mouse scRNA-seq, and are defined as respectively.
In order to find genes associated with biological functions, we need to select uℓj and vℓk which are coincident with biological meaning. In this study, we employ time points of measurements as biological meanings. In other words, we seek for genes associated with time development. Since we would like to find any kind of time dependence, we simply deal with time points as un-ordered labeling. Thus, we apply categorical regression
(T = 6; t = 1 to T, which correspond to 6, 7, 8, 9, 10, and 11 weeks; see Methods and Materials) or
(T = 7; t = 1 to T, which correspond to E11.5, E12.5, E13.5, E14.5, F15.5, E18.5, and unknown; see Methods and Materials), where when the jth (kth) cell is taken from the tth time point otherwise . aℓ, aℓt, bℓ and bℓt are the regression coefficients.
P-values are attributed to ℓth singular value vectors using the above categorical regression [lm function in R (R Core Team, 2018) is used to compute P-values]. P-values attributed to singular value vectors are corrected by Benjamini-Hochberg (BH) criterion (Benjamini and Hochberg, 1995). Singular value vectors associated with corrected P-values of less than 0.01 are selected for the download analysis. Hereafter, the set of selected singular value vectors of human and mouse is denoted as and , respectively.
P-values are attributed to genes with assuming χ2 distribution for the gene singular value vectors, uℓi and vℓi, corresponding to the cell singular value vectors selected by categorical regression as
for human genes and
for mouse genes, respectively. Here,
and
and are the standard deviations of ℓth gene singular value vectors for human and mouse, respectively, and are sets of ℓs, selected by categorical regression for human [Eq. (6)] and mouse [Eq.(7)], respectively. is the cumulative probability of χ2 distribution when the argument takes values larger than x. and are corrected by BH criterion, and genes associated with corrected P-values of less than 0.01 are selected.
The application of TD-based unsupervised FE to mouse hypothalamus is quite similar to that of mouse and human midbrain. There are also two matrices, and which correspond to the ith expression of the jth and kth cells under the two distinct conditions (in the present case, they are without and with acute formalin stress, respectively); N=24,341,M=1,785 and K=1,096. Case II Type II tensor, xjk, was also generated using Eqs. (1) and (2), and SVD was applied to xjk as Eq. (3). Then singular value vectors attributed to genes of samples without and with acute formalin stress, uℓi and vℓi, were computed by Eqs. (4) and (5). We also applied categorical regressions to uℓi. and vℓi, although categories considered here are not time points but cell types. Then categorical regressions applied to uℓi and vℓi in mouse hypothalamus without and with acute formalin stress are
where s stands for one of seven cell types mentioned in Methods and Materials and when the jth (kth) cell is taken from the sth cell types otherwise . Table 1 lists the number of cells in these categories. The remaining procedures to select genes associated with identified cell type dependency are exactly the same as those in midbrain case.
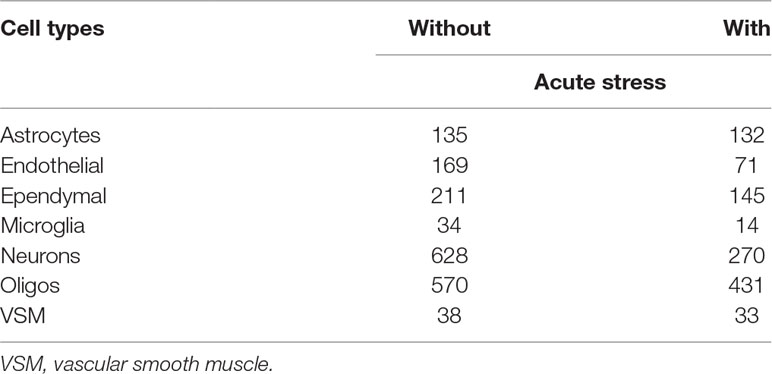
Table 1 The number of cells that belong to either without or with acute formalin stress or cell types.
Various enrichment analysis methods are performed with separate uploading selected human and mouse gene symbols, or genes selected commonly between samples without and samples with acute formalin stress, to Enrichr (Kuleshov et al., 2016).
As a result, following the procedure described in the Methods and Materials, we identified 55 and 44 singular value vectors attributed to cells, uℓjs and vℓks for human and mouse, respectively. One possible validation of selected uℓjs and vℓks is coincidence. Although cells measured are not related between human and mouse at all, if SVD works well, corresponding singular value vectors (i.e., uℓj and vℓk sharing the same ℓs) attributed to cells should share something biological, for example, time dependence. This suggests that it is more likely that corresponding singular value vectors attributed to cells, uℓj and vℓk, are simultaneously associated with significant P-values computed by categorical regression. As expected, they are highly significantly correlated. Table 2 shows confusion matrix of the coincidence of selected singular value vectors between human and mouse. For human cells, only the top 1,907 singular value vectors among all 1,977 singular value vectors are considered, since the total number of singular value vectors attributed to mouse cells is 1,907.
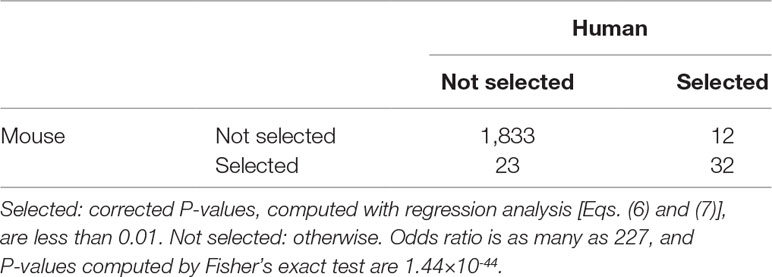
Table 2 Confusion matrix of coincidence between selected 55 singular value vectors selected among all 1,977 singular value vectors, uℓj, attributed to human cells and 44 singular value vectors selected among all 1907 singular value vectors, vℓk, attributed to mouse cells.
Figure 1 shows the coincidence of selected singular value vectors between human and mouse. Singular value vectors with smaller ℓs, that is, with more contributions, are more likely selected and coincident between human and mouse. This can be the side evidence that guarantees that TD-based unsupervised FE successfully integrated human and mouse scRNA-seq data.
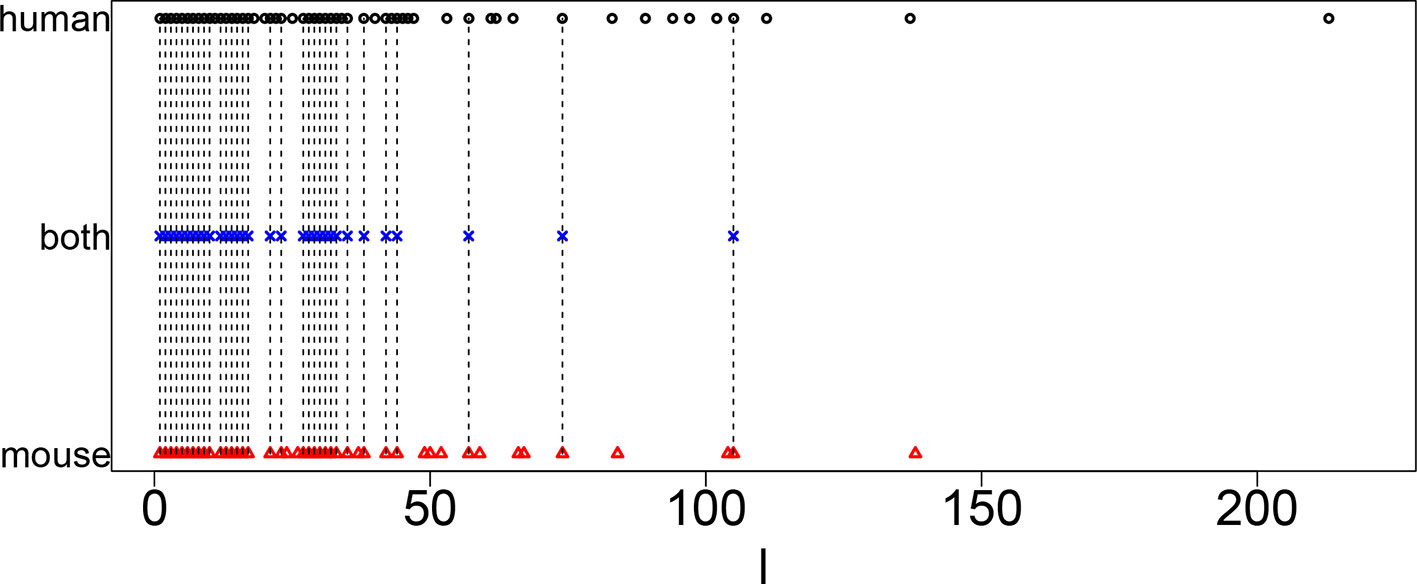
Figure 1 Coincidence between singular value vectors shown in Table 2. Horizontal axis: singular value vector numbering ℓ. Black open circles, ℓ selected for human; blue crosses, ℓ selected for both human and mouse; red open triangles, ℓ selected for mouse. Vertical black broken lines connect ℓ selected for both human and mouse.
Next, we selected genes with following the procedures described in Methods and Materials. (The list of genes is available as Supplementary Data Sheet 1 and 2). The first validation of selected genes is the coincidence between human and mouse. In Taguchi’s previous study (Taguchi, 2018a), more number of common genes were selected by PCA-based unsupervised FE than other methods compared, that is, highly variables genes, bimodal genes, and dpFeature. Table 3 shows the confusion matrix that describes the coincidence of selected genes between human and mouse. Odds ratio is as large as 133, and P-value is 0 (i.e., less than numerical accuracy), which is significantly better than coincidence of selected genes between human and mouse (53 common genes between 116 genes selected for human and 118 genes selected mouse), previously achieved by PCA-based unsupervised FE (Taguchi, 2018a), which outperformed other methods, that is, highly variable genes, bimodal genes, and dpFeature.
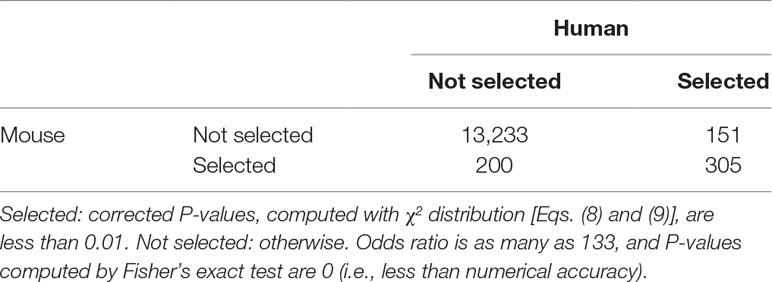
Table 3 Confusion matrix of coincidence between selected 456 genes for human and selected 505 genes for mouse among all 13,384 common genes.
On the other hand, most of the genes selected by PCA-based unsupervised FE in the previous study (Taguchi, 2018a) are included in the genes selected by TD-based unsupervised FE in the present study. One hundred two genes are selected by TD-based unsupervised FE among 116 human genes selected by PCA-based unsupervised FE in the previous study (Taguchi, 2018a), while 91 genes are selected by TD-based unsupervised FE among 118 mouse genes by PCA-based unsupervised FE. Thus, TD-based unsupervised FE is quite consistent with PCA-based unsupervised FE.
Biological significance tested by enrichment analysis is further enhanced (Full list of enrichment analysis is available as Supplementary Tables 1 and 2). Most remarkable advance achieved by TD-based unsupervised FE is “Allen Brain Atlas,” to which only downregulated genes were enriched in the previous study (Taguchi, 2018a). As can be seen in Table 4, now much enrichment is associated with upregulated genes. In addition to this, most of the five top-ranked terms are related to paraventricular nucleus, which is adjusted to midbrain. This suggests that TD-based unsupervised FE successfully identified genes related to midbrain.

Table 4 Five top-ranked terms from “Allen Brain Atlas up” by Enrichr for selected 456 human genes and 505 mouse genes.
In addition to this, “Jensen TISSUES” (Table 5) for Embryonic_brain is highly enhanced [i.e., more significant (smaller), with P-values ∼10-100 which were as large as 10-10 to 10-20 in the previous study (Taguchi, 2018a)]. On the other hand, “ARCHS4 tissues” also strongly supports the biological reliability of selected genes (Table 6). The term “MIDBRAIN” is enriched highly, and it is top ranked for both human and mouse.
There is some brain-related enrichment found in other categories, although it is not strong enough compared with that of the top three. Brain-related terms in “GTEx Tissue Sample Gene Expression Profiles up” (Table 7) are also enhanced for mouse brain (top three terms are brain), although no brain terms are enriched within five top-ranked terms for human (this discrepancy cannot be understood at the moment). On the contrary, brain-related terms in “MGI Mammalian Phenotype 2017” (Table 8) are enhanced for human brain (fourth and fifth ranks), although no brain terms are enriched within the five top-ranked terms for mouse (this discrepancy also cannot be understood at the moment). The above observations suggest that TD-based unsupervised FE could identify genes related to mouse and human embryonic midbrain.

Table 7 Five top-ranked terms from “GTEx Tissue Sample Gene Expression Profiles up” by Enrichr for selected 456 human genes and 505 mouse genes. Brain-related terms are asterisked.

Table 8 Five top-ranked terms from “MGI Mammalian Phenotype 2017” by Enrichr for selected 456 human genes and 505 mouse genes. Brain-related terms are asterisked.
We also uploaded selected 456 human genes and 505 mouse genes to STRING server (Szklarczyk et al., 2014), which evaluates protein–protein interaction (PPI) enrichment. Among 456 human genes, 7,488 PPI are reported, while the expected number of PPI is as small as 3,524 (P-value is less than 1×10⁻⁶). Among 505 mouse genes, 6,788 PPI are reported, while the expected number of PPI is as small as 3,290 (P-value is again less than 1×10⁻⁶). Thus, TD-based unsupervised FE can successfully identify significantly interacting protein-coding genes.
Finally, we checked if transcription factors (TFs) that target selected genes are common between human and mouse (Table 9). These TFs are associated with adjusted P-values of less than 0.01 in “ENCODE and ChEA Consensus TFs from ChIP-X” of Enrichr. They are highly overlapped between human and mouse (there are 10 common TFs between 16 TFs found in human and 24 TFs found in mouse). Although selected TFs are very distinct from those in the previous study (Taguchi, 2018a), they are highly interrelated with each other (see below). These TFs are uploaded to the regnetworkweb server (Liu et al., 2015), and TF networks shown in Figure 2 are identified. Clearly, even partially, these TFs interact highly with each other.

Table 9 TFs enriched in “ENCODE and ChEA Consensus TFs from ChIP-X” by Enrichr for human and mouse. Bold TFs are common.
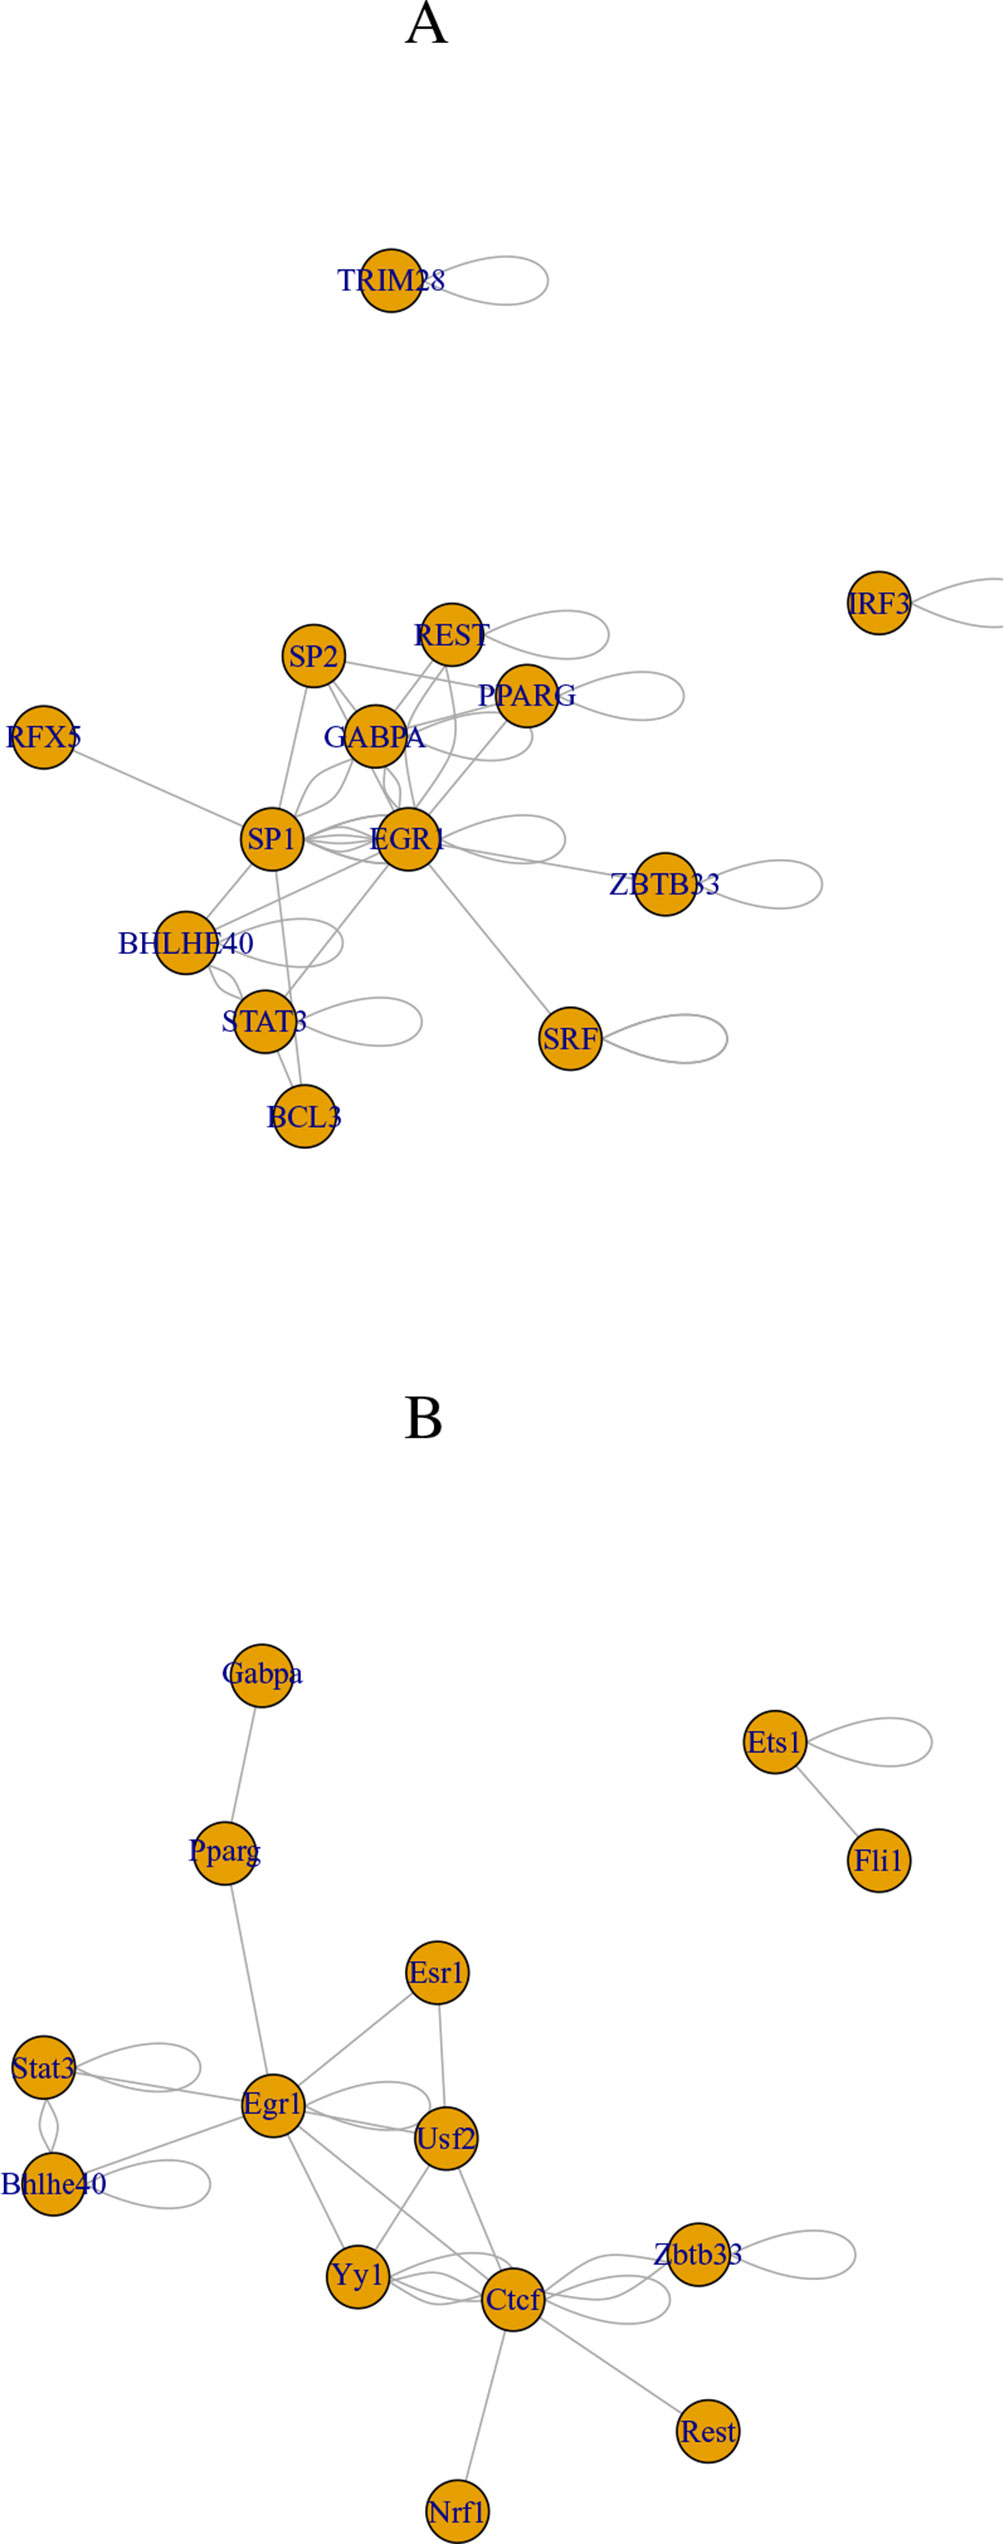
Figure 2 Transcription factor (TF) network identified by regnetworkweb for TFs in Table 9. (A) Human and (B) mouse.
We also checked if the 10 commonly selected TFs (in bold in Table 9) are related to brains. Lack of BHLHE40 was found to result in brain malfunction (Hamilton et al., 2018). The function of EGR1 was found in embryonic rat brain (Wells et al., 2011). GABPA is essential for human cognition (Reiff et al., 2014). IRF3 is related to brain disease (Schultz et al., 2019). PPAR, which PPARG belongs to, is believed to be the therapeutic target of neurodegenerative diseases (Warden et al., 2016). REST is a master regulator of neurogenesis (Mozzi et al., 2017). RFX5 is known to be expressive in fetal brain (Sugiaman-Trapman et al., 2018). STAT3 promotes brain metastasis (Priego et al., 2018). TCF7L2 regulates brain gene expression (Shao et al., 2013). ZBTB33 affects the mouse behavior through regulating brain gene expression (Kulikov et al., 2016). Thus, all 10 commonly selected TFs are related to brains.
Although the effectiveness of the proposed strategy toward scRNA-seq is obvious in the results shown in the previous subsection, one might wonder if it is accidental. In order to dispel such doubts, we apply TD-based unsupervised FE to yet another scRNA-seq data set: mouse hypothalamus with and without acute formalin stress. Contrary to the data set analyzed in the previous subsection where very distant two data sets were analyzed, the data sets analyzed here are very close to each other. Both data sets are taken from the same tissue of mouse, hypothalamus. The only difference is if they are stressed by formalin dope or not. The motivation why we here specifically apply TD-based unsupervised FE to two close data sets is as follows: When two data sets are too close, it might be difficult to identify which genes are commonly altered by additional condition, in this case, the dependence upon cell types, because all genes might behave equally between the two. Thus, it is not a bad idea to check if TD-based unsupervised FE can work well when not only very distant data sets are analyzed but also very close data sets are analyzed.
With following the procedure described in the Materials and Methods, we identified 30 and 24 singular value vectors attributed to cells, uℓjs and vℓks, without and with acute formalin stress, respectively. We again applied Fisher’s exact test (Table 10). Although odds ratio is 10 times larger than that in Table 2, P -value is even smaller than that in Table 2; this suggests that TD-based unsupervised FE could identify not all of genes but only limited genes as being common between two experimental conditions: without and with stress.
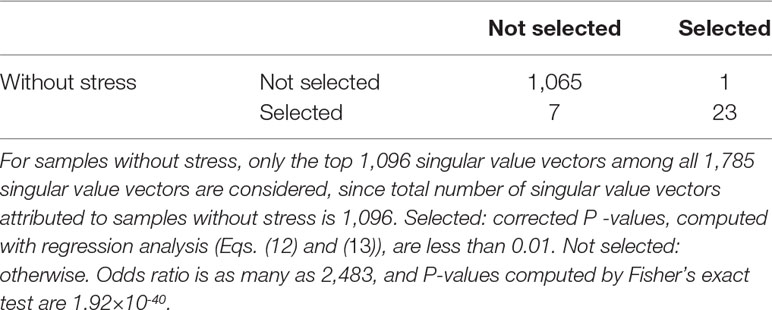
Table 10 Confusion matrix of coincidence between selected 30 singular value vectors selected among all 1,096 singular value vectors, uℓj ,attributed to samples without stress and 24 singular value vectors selected among all 1,096 singular value vectors, vℓk attributed to samples with stress.
Figure 3 shows the coincidence of selected singular value vectors between samples without and with stress. Singular value vectors with smaller ℓs, that is, with more contributions, are more likely selected and coincident between samples without and with stress. This can be the side evidence that guarantees that TD-based unsupervised FE successfully integrated scRNA-seq data taken from samples without and with stress while avoiding to regard that all are coincident between two samples.
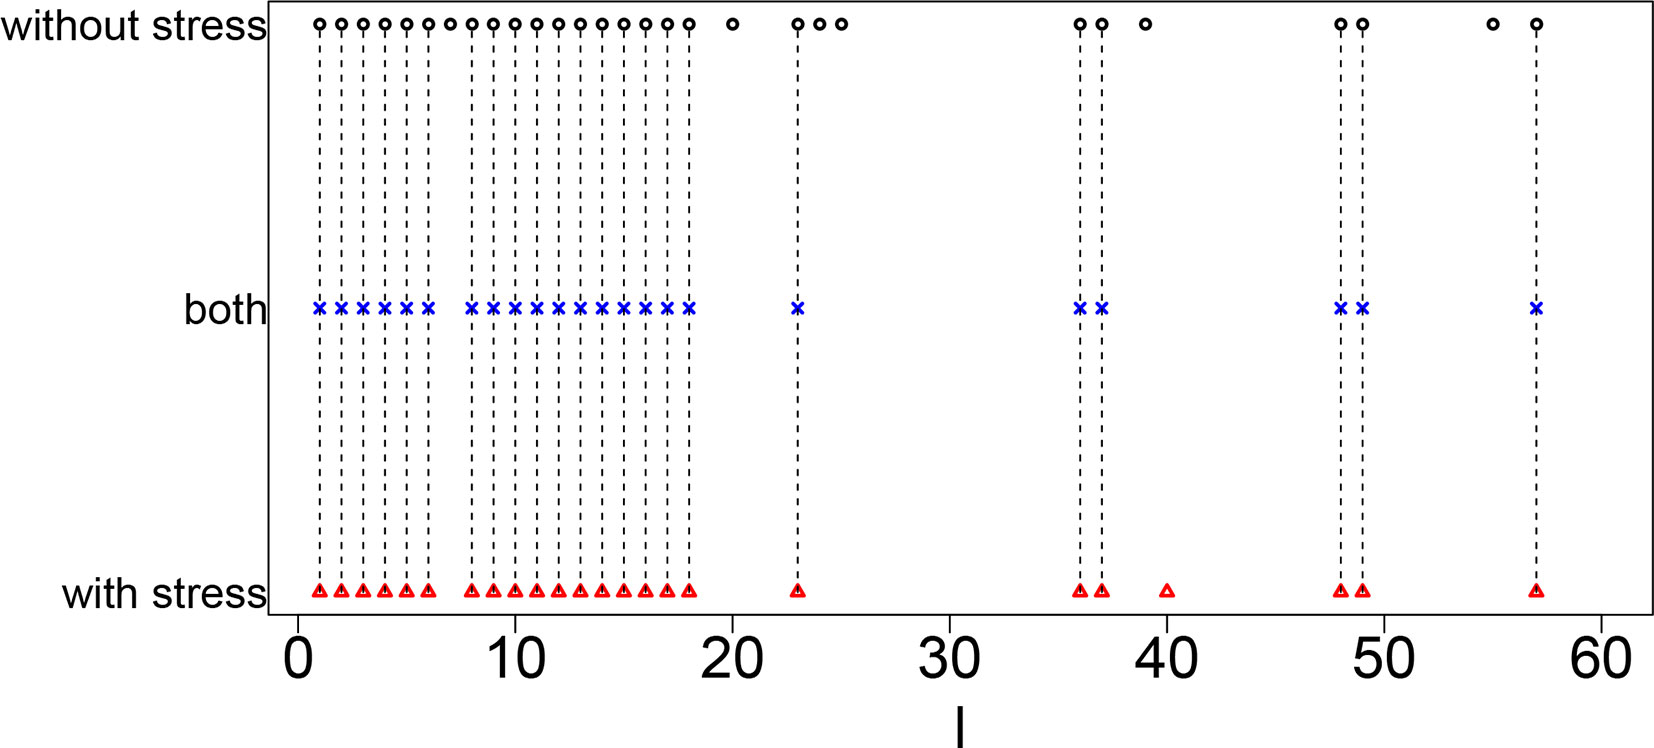
Figure 3 Coincidence between singular value vectors shown in Table 10. Horizontal axis: singular value vector numbering ℓ. Black open circles, ℓs selected for samples without stress; blue crosses, ℓs selected for both samples without and with stress; red open triangles, ℓs selected for samples with stress. Vertical black broken lines connect ℓs selected for both samples without and with stress.
Next, we selected genes with following the procedures described in the Methods and Materials. The first validation of selected genes is the coincidence between human and mouse. Table 11 shows the confusion matrix that describes the coincidence of selected genes between samples without and with stress. Odds ratio is as large as 270, and P-value is 0 (i.e., less than numerical accuracy). Thus, as expected, TD-based unsupervised FE could not identify all genes but only a limited number of genes associated with cell-type dependence.
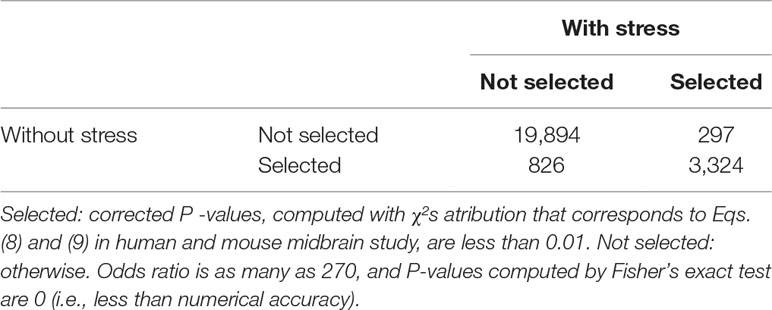
Table 11 Confusion matrix of coincidence between selected 4,150 genes for samples without stress and selected 3,621 genes for samples with stress among all 24,341 genes.
Finally, we tried to evaluate if genes selected are tissue type specific, that is, hypothalamus. We have uploaded 3,324 commonly selected genes to Enrichr. “GTEx Tissue Sample Gene Expression Profiles up” suggest that all five top-ranked terms are brain with high significance (Table 12, adjusted P-values are less than 1×10-130). This suggests that TD-based unsupervised FE successfully identified limited number of genes related to brains even using closely related samples. In order to be more specific, we checked “Allen Brain Atlas up” in Enrichr. Then we found that all five top-ranked terms are hypothalamic (Table 13). It is interesting that TD-based unsupervised FE could successfully identify hypothalamus-specific genes by only using scRNA-seq retrieved from hypothalamus. It is usually required to use data taken from other tissues in order to identify tissue-specific genes because we need to compare targeted tissues and not targeted tissues in order to identify genes expressed specifically in target tissues. The successful identification of genes specific to something without using the comparison with other samples was also observed previously during an attempt to identify tumor-specific genes by TD-based unsupervised FE (Taguchi, 2017c). In this sense, TD-based unsupervised FE methods are effective not only when genes common between two distinct conditions are sought but also when genes common between two closely related conditions are sought. Thus, it is unlikely that the success of a TD-based unsupervised method applied to scRNA-seq is accidental.

Table 12 Five top-ranked terms from “GTEx Tissue Sample Gene Expression Profiles up” by Enrichr for 3,324 genes selected commonly between samples without and with stress.

Table 13 Five top-ranked terms from “Allen Brain Atlas up” by Enrichr for 3,324 genes selected commonly between samples without and with stress.
In this study, we applied TD-based unsupervised FE to the integration of scRNA-seq data sets taken from two species: human and mouse. In the sense of identification of biologically more relevant set of genes, TD-based unsupervised FE can outperform PCA-based unsupervised FE that previously (Taguchi, 2018a) could outperform three more popular methods: highly variable genes, bimodal genes, and dpFeature. Thus, it is expected that TD-based unsupervised FE can do so, too.
For the purpose of integration of two scRNA-seq data sets, TD-based unsupervised FE has many advantages than the other four methods, that is, PCA-based unsupervised FE, highly variable genes, bimodal genes, and dpFeature. At first, TD-based unsupervised FE can integrate two scRNA-seq data sets, not after but before the selection of genes. This enabled us to identify more coincident gene sets between two scRNA-seq in this study of human and mouse. As a result, we were able to identify more coincident results between human and mouse.
The criteria of gene selection are quite robust; they should be dependent upon time points when they are measured. We did not have to specify how they are actually correlated with time. It is another advantage of TD-based unsupervised FE.
By applying enrichment analysis to the genes selected, we found many valuable insights about the biological process. As a result, we identified 10 key TFs that might regulate embryonic midbrain developments. All of the 10 selected TFs turned out to be related to brains.
TD-based unsupervised FE turned out to be quite effective to integrate two scRNA-seq data sets. This method should be applied to various scRNA-seq data sets considering broader scope of investigations.
In future work, we plan to (1) utilize the proposed TD-based unsupervised FE under the transfer learning setting; (2) extend the proposed approach to handle the data integration from multiple related tasks; and (3) investigate the performance of the proposed approach when coupled with machine and deep learning algorithms.
The data sets analyzed for this study can be found in the GEO.
https://www.ncbi.nlm.nih.gov/geo/query/acc.cgi?acc=GSE76381.
https://www.ncbi.nlm.nih.gov/geo/query/acc.cgi?acc=GSE74672
Y-HT planned the research, performed analyses, and wrote a paper. TT discussed the results and wrote a paper.
This study was supported by KAKENHI (17K00417 and 19H05270) and Okawa Foundation (grant number 17-10). This project was also funded by the Deanship of Scientific Research (DSR) at King Abdulaziz University, Jeddah, under grant no. KEP-8-611-38. The authors, therefore, acknowledge with thanks DSR for technical and financial support.
The authors declare that the research was conducted in the absence of any commercial or financial relationships that could be construed as a potential conflict of interest.
The Supplementary Material for this article can be found online at: https://www.frontiersin.org/articles/10.3389/fgene.2019.00864/full#supplementary-material
Benjamini, Y., Hochberg, Y. (1995). Controlling the false discovery rate: a practical and powerful approach to multiple testing. J. R. Stat. Soc. Ser. B (Methodol.) 57, 289–300. doi: 10.1111/j.2517-6161.1995.tb02031.x
Chen, B., Herring, C. A., Lau, K. S. (2018). pyNVR: investigating factors affecting feature selection from scRNA-seq data for lineage reconstruction. Bioinformatics 35, 2335–2337. doi: 10.1093/bioinformatics/bty950
Hamilton, K. A., Wang, Y., Raefsky, S. M., Berkowitz, S., Spangler, R., Suire, C. N., et al. (2018). Mice lacking the transcriptional regulator Bhlhe40 have enhanced neuronal excitability and impaired synaptic plasticity in the hippocampus. PLoS One 13, 1–22. doi: 10.1371/journal.pone.0196223
Ishida, S., Umeyama, H., Iwadate, M., Taguchi, Y.-h. (2014). Bioinformatic screening of autoimmune disease genes and protein structure prediction with FAMS for drug discovery. Protein Pept. Lett. 21, 828–839. doi: 10.2174/09298665113209990052
Kinoshita, R., Iwadate, M., Umeyama, H., Taguchi, Y.-h. (2014). Genes associated with genotype-specific DNA methylation in squamous cell carcinoma as candidate drug targets. BMC Syst. Biol. 8 Suppl 1, S4. doi: 10.1186/1752-0509-8-S1-S4
Kuleshov, M. V., Jones, M. R., Rouillard, A. D., Fernandez, N. F., Duan, Q., Wang, Z., et al. (2016). Enrichr: a comprehensive gene set enrichment analysis web server 2016 update. Nucleic Acids Res. 44, W90–W97. doi: 10.1093/nar/gkw377
Kulikov, A. V., Korostina, V. S., Kulikova, E. A., Fursenko, D. V., Akulov, A. E., Moshkin, M. P., et al. (2016). Knockout zbtb33 gene results in an increased locomotion, exploration and pre-pulse inhibition in mice. Behav. Brain Res. Ser. Test Content1 297, 76–83. doi: 10.1016/j.bbr.2015.10.003
Liu, Z.-P., Wu, C., Miao, H., Wu, H. (2015). RegNetwork: an integrated database of transcriptional and post-transcriptional regulatory networks in human and mouse. Database bav095. doi: 10.1093/database/bav095
McInnes, L., Healy, J., Melville, J. (2018). Umap: uniform manifold approximation and projection for dimension reduction. ArXiv 1802, 03426. doi: 10.21105/joss.00861
Mozzi, A., Guerini, F. R., Forni, D., Costa, A. S., Nemni, R., Baglio, F., et al. (2017). REST, a master regulator of neurogenesis, evolved under strong positive selection in humans and in non human primates. Scie. Rep. 7, 9530. doi: 10.1038/s41598-017-10245-w
Murakami, Y., Toyoda, H., Tanahashi, T., Tanaka, J., Kumada, T., Yoshioka, Y., et al. (2012). Comprehensive miRNA expression analysis in peripheral blood can diagnose liver disease. PLoS One 7, e48366. doi: 10.1371/journal.pone.0048366
Murakami, Y., Tanahashi, T., Okada, R., Toyoda, H., Kumada, T., Enomoto, M., et al. (2014). Comparison of hepatocellular carcinoma miRNA expression profiling as evaluated by next generation sequencing and microarray. PLoS One 9, e106314. doi: 10.1371/journal.pone.0106314
Murakami, Y., Kubo, S., Tamori, A., Itami, S., Kawamura, E., Iwaisako, K., et al. (2015). Comprehensive analysis of transcriptome and metabolome analysis in intrahepatic cholangiocarcinoma and hepatocellular carcinoma. Sci. Rep. 5, 16294. doi: 10.1038/srep16294
Priego, N., Zhu, L., Monteiro, C., Mulders, M., Wasilewski, D., Bindeman, W., et al. (2018). STAT3 labels a subpopulation of reactive astrocytes required for brain metastasis. Nat. Med. 24, 1024–1035. doi: 10.1038/s41591-018-0044-4
R Core Team (2018). R: A Language and Environment for Statistical Computing. Vienna, Austria R: R Foundation for Statistical Computing.
Reiff, R. E., Ali, B. R., Baron, B., Yu, T. W., Ben-Salem, S., Coulter, M. E., et al. (2014). METTL23, a transcriptional partner of GABPA, is essential for human cognition. Hum. Mol. Genet. 23, 3456–3466. doi: 10.1093/hmg/ddu054
Sasagawa, Y., Hayashi, T., Nikaido, I. (2019). Strategies for converting RNA to amplifiable cDNA for single-cell RNA sequencing methods. Singapore: Springer Singapore, 1–17. doi: 10.1007/978-981-13-6037-4
Schultz, K. L. W., Troisi, E. M., Baxter, V. K., Glowinski, R., Griffin, D. E. (2019). Interferon regulatory factors 3 and 7 have distinct roles in the pathogenesis of alphavirus encephalomyelitis. J. Gen. Virol. 100, 46–62. doi: 10.1099/jgv.0.001174
Shao, W., Wang, D., Chiang, Y.-T., Ip, W., Zhu, L., Xu, F., et al. (2013). The Wnt signaling pathway effector TCF7L2 controls gut and brain proglucagon gene expression and glucose homeostasis. Diabetes 62, 789–800. doi: 10.2337/db12-0365
Sugiaman-Trapman, D., Vitezic, M., Jouhilahti, E.-M., Mathelier, A., Lauter, G., Misra, S., et al. (2018). Characterization of the human RFX transcription factor family by regulatory and target gene analysis. BMC Genom. 19, 181. doi: 10.1186/s12864-018-4564-6
Szklarczyk, D., Franceschini, A., Wyder, S., Forslund, K., Heller, D., Huerta-Cepas, J., et al. (2014). STRING v10: protein–protein interaction networks, integrated over the tree of life. Nucleic Acids Res. 43, D447–D452. doi: 10.1093/nar/gku1003
Taguchi, Y.-h. (2014). “Integrative analysis of gene expression and promoter methylation during reprogramming of a non-small-cell lung cancer cell line using principal component analysis-based unsupervised feature extraction,” in Intelligent Computing in Bioinformatics. Eds. Huang, D.-S., Han, K., Gromiha, M. (Heidelberg: Springer International Publishing). vol. 8590 of LNCS. 445–455 ICIC2014. doi: 10.1007/978-3-319-09330-7_52
Taguchi, Y.-h. (2015). Identification of aberrant gene expression associated with aberrant promoter methylation in primordial germ cells between E13 and E16 rat F3 generation vinclozolin lineage. BMC Bioinform. 16 (Suppl 18), S16. doi: 10.1186/1471-2105-16-S18-S16
Taguchi, Y.-h. (2016a). Identification of more feasible microRNA–mRNA interactions within multiple cancers using principal component analysis based unsupervised feature extraction. Int. J. Mol. Sci. 17, E696. doi: 10.3390/ijms17050696
Taguchi, Y. H. (2016b). “MicroRNA–mRNA interaction identification in Wilms tumor using principal component analysis based unsupervised feature extraction,” in 2016 IEEE 16th International Conference on Bioinformatics and Bioengineering (BIBE), 71–78. doi: 10.1109/BIBE.2016.14
Taguchi, Y.-h. (2016c). Principal component analysis based unsupervised feature extraction applied to budding yeast temporally periodic gene expression. BioData Min. 9, 22. pmid27366210. doi: 10.1186/s13040-016-0101-9
Taguchi, Y. H. (2016d). Principal component analysis based unsupervised feature extraction applied to publicly available gene expression profiles provides new insights into the mechanisms of action of histone deacetylase inhibitors. Neuroepigenetics 8, 1–18. doi: 10.1016/j.nepig.2016.10.001
Taguchi, Y.-H. (2017a). “Identification of candidate drugs for heart failure using tensor decomposition-based unsupervised feature extraction applied to integrated analysis of gene expression between heart failure and DrugMatrix datasets,” in Intelligent Computing Theories and Application (Springer International Publishing), 517–528. Taguchi. doi: 10.1007/978-3-319-63312-1_45
Taguchi, Y.-H. (2017b). Identification of candidate drugs using tensor-decomposition-based unsupervised feature extraction in integrated analysis of gene expression between diseases and DrugMatrix datasets. Sci. Rep. 7, 13733. doi: 10.1038/s41598-017-13003-0
Taguchi, Y.-H. (2017c). “One-class differential expression analysis using tensor decomposition-based unsupervised feature extraction applied to integrated analysis of multiple omics data from 26 lung adenocarcinoma cell lines,” in 2017 IEEE 17th International Conference on Bioinformatics and Bioengineering (BIBE), 131–138. doi: 10.1109/BIBE.2017.00-66
Taguchi, Y.-h. (2017d). Principal components analysis based unsupervised feature extraction applied to gene expression analysis of blood from dengue haemorrhagic fever patients. Sci. Rep. 7, 44016. doi: 10.1038/srep44016
Taguchi, Y.-H. (2017e). Tensor decomposition-based unsupervised feature extraction applied to matrix products for multi-view data processing. PLoS One 12, e0183933. doi: 10.1371/journal.pone.0183933
Taguchi, Y.-H. (2017f). Tensor decomposition-based unsupervised feature extraction identifies candidate genes that induce post-traumatic stress disorder-mediated heart diseases. BMC Med. Genom. 10, 67. InCob2017. doi: 10.1186/s12920-017-0302-1
Taguchi, Y.-h. (2018a). “Principal component analysis-based unsupervised feature extraction applied to single-cell gene expression analysis,” in Intelligent Computing Theories and Application. Eds. Huang, D.-S., Jo, K.-H., Zhang, X.-L. (Cham: Springer International Publishing), 816–826. doi: 10.1007/978-3-319-95933-7_90
Taguchi, Y.-H. (2018b). Tensor decomposition-based unsupervised feature extraction can identify the universal nature of sequence-nonspecific off-target regulation of mRNA mediated by microRNA transfection. Cells 7, 54. doi: 10.3390/cells7060054
Taguchi, Y.-H. (2018c). Tensor decomposition/principal component analysis based unsupervised feature extraction applied to brain gene expression and methylation profiles of social insects with multiple castes. BMC Bioinform. 19, 99. APBC2018. doi: 10.1186/s12859-018-2068-7
Taguchi, Y.-h. (2019a). Drug candidate identification based on gene expression of treated cells using tensor decomposition-based unsupervised feature extraction for large-scale data. BMC Bioinform. 19, 388. doi: 10.1186/s12859-018-2395-8
Taguchi, Y.-h. (2019b). Unsupervised Feature Extraction Applied to Bioinformatics. Switzerland: Springer International.
Taguchi, Y.-h., Murakami, Y. (2013). Principal component analysis based feature extraction approach to identify circulating microRNA biomarkers. PLoS One 8, e66714. doi: 10.1371/journal.pone.0066714
Taguchi, Y.-h., Murakami, Y. (2014). Universal disease biomarker: can a fixed set of blood microRNAs diagnose multiple diseases? BMC Res. Notes 7, 581. doi: 10.1186/1756-0500-7-581
Taguchi, Y. H., Ng, K.-L. (2018). “Tensor decomposition-based unsupervised feature extraction for integrated analysis of TCGA data on micrRNA expression and promoter methylation of genes in ovarian cancer,” in 2018 IEEE 18th International Conference on Bioinformatics and Bioengineering (BIBE), 195–200. doi: 10.1109/BIBE.2018.00045
Taguchi, Y.-h., Okamoto, A. (2012). “Principal component analysis for bacterial proteomic analysis,” in Pattern Recognition in Bioinformatics. Eds. Shibuya, T., Kashima, H., Sese, J., Ahmad, S. (Heidelberg: Springer International Publishing). vol. 7632 of LNCS. 141–152 prib2012. doi: 10.1007/978-3-642-34123-6_13
Taguchi, Y. H., Wang, H. (2017). Genetic association between amyotrophic lateral sclerosis and cancer. Genes 8, 243. doi: 10.3390/genes8100243
Taguchi, Y.-h., Wang, H. (2018a). Exploring microRNA biomarker for amyotrophic lateral sclerosis. Int. J. Mol. Sci. 19. doi: 10.3390/ijms19051318
Taguchi, Y.-h., Wang, H. (2018b). Exploring microRNA biomarkers for Parkinson disease from mRNA expression profiles. Cells 7, 245. doi: 10.3390/cells7120245
Taguchi, Y.-h., Iwadate, M., Umeyama, H. (2015a). “Heuristic principal component analysis-based unsupervised feature extraction and its application to gene expression analysis of amyotrophic lateral sclerosis data sets,” in Computational Intelligence in Bioinformatics and Computational Biology (CIBCB), 2015 IEEE Conference on. 1–10. doi: 10.1109/CIBCB.2015.7300274
Taguchi, Y. H., Iwadate, M., Umeyama, H. (2015b). Principal component analysis-based unsupervised feature extraction applied to in silico drug discovery for posttraumatic stress disorder-mediated heart disease. BMC Bioinform. 16, 139. doi: 10.1186/s12859-015-0574-4
Taguchi, Y.-h., Iwadate, M., Umeyama, H., Murakami, Y., Okamoto, A., (2015c). “Heuristic principal component analysis-based unsupervised feature extraction and its application to bioinformatics,” in Big Data Analytics in Bioinformatics and Healthcare. Eds. Wang, B., Li, R., Perrizo, W., 138–162. IGI Global, Pennsylvania. doi: 10.4018/978-1-4666-6611-5.ch007
Taguchi, Y.-h., Iwadate, M., Umeyama, H. (2016). SFRP1 is a possible candidate for epigenetic therapy in non-small cell lung cancer. BMC Med. Genom. 9, 28. doi: 10.1186/s12920-016-0196-3
Taguchi, Y. H., Iwadate, M., Umeyama, H., Murakami, Y. (2017). “Principal component analysis based unsupervised feature extraction applied to bioinformatics analysis,” in Computational Methods with Applications in Bioinformatics Analysis, vol. 8 . Eds. Tsai, J. J. P., Ng, K.-L. (Singapore: World Scientific), 153–182. doi: 10.1142/9789813207981_0008
Umeyama, H., Iwadate, M., Taguchi, Y.-h. (2014). TINAGL1 and B3GALNT1 are potential therapy target genes to suppress metastasis in non-small cell lung cancer. BMC Genom. 15 Suppl 9, S2. doi: 10.1186/1471-2164-15-S9-S2
van der Maaten, L., Hinton, G. (2008). Visualizing Data using t-SNE. J. Mach. Learn. Res. 9, 2579–2605.
Warden, A., Truitt, J., Merriman, M., Ponomareva, O., Jameson, K., Ferguson, L. B., et al. (2016). Localization of PPAR isotypes in the adult mouse and human brain. Scie. Rep. 6, 27618. doi: 10.1038/srep27618
Keywords: tensor decomposition, enrichment analysis, single-cell RNA-sequencing, midbrain development, inter-species analysis
Citation: Taguchi Y- and Turki T (2019) Tensor Decomposition-Based Unsupervised Feature Extraction Applied to Single-Cell Gene Expression Analysis. Front. Genet. 10:864. doi: 10.3389/fgene.2019.00864
Received: 26 June 2019; Accepted: 19 August 2019;
Published: 19 September 2019.
Edited by:
Michael Fernandez, The Vancouver Prostate Centre, CanadaReviewed by:
Yunierkis Perez, University of the Americas, EcuadorCopyright © 2019 Taguchi and Turki. This is an open-access article distributed under the terms of the Creative Commons Attribution License (CC BY). The use, distribution or reproduction in other forums is permitted, provided the original author(s) and the copyright owner(s) are credited and that the original publication in this journal is cited, in accordance with accepted academic practice. No use, distribution or reproduction is permitted which does not comply with these terms.
*Correspondence: Y-h. Taguchi, dGFnQGdyYW51bGFyLmNvbQ==
Disclaimer: All claims expressed in this article are solely those of the authors and do not necessarily represent those of their affiliated organizations, or those of the publisher, the editors and the reviewers. Any product that may be evaluated in this article or claim that may be made by its manufacturer is not guaranteed or endorsed by the publisher.
Research integrity at Frontiers

Learn more about the work of our research integrity team to safeguard the quality of each article we publish.