 Hadas Biran
 Martin Kupiec2
 Roded Sharan
95% of researchers rate our articles as excellent or good
Learn more about the work of our research integrity team to safeguard the quality of each article we publish.
Find out more
METHODS article
Front. Genet. , 22 January 2019
Sec. Computational Genomics
Volume 10 - 2019 | https://doi.org/10.3389/fgene.2019.00004
This article is part of the Research Topic Network Bioscience View all 19 articles
Network propagation is a central tool in biological research. While a number of variants and normalizations have been proposed for this method, each has its own shortcomings and no large scale assessment of those variants is available. Here we propose a novel normalization method for network propagation that is based on evaluating the propagation results against those obtained on randomized networks that preserve node degrees. In this way, our method overcomes potential biases of previous methods. We evaluate its performance on multiple large scale datasets and find that it compares favorably to previous approaches in diverse gene prioritization tasks. We further demonstrate its utility on a focused dataset of telomere length maintenance in yeast. The normalization method is available at http://anat.cs.tau.ac.il/WebPropagate.
Network propagation is a method of choice for diverse analyses such as protein function prediction, gene prioritization and identification of disease modules (Cowen et al., 2017). There are at least 17 available software tools that employ different variants of network propagation for these purposes (Cowen et al., 2017; Biran et al., 2018).
However, the basic propagation technique has some known limitations: First, raw propagation scores do not carry any statistical significance information and can only be used to rank proteins. Second, they are greatly affected by the degrees of initial proteins implicated in the process under study (termed seed set below) and the degree of any candidate protein being scored. This biases the results toward high degree, well studied proteins.
To deal with the second challenge, Erten et al. (2011) suggested the DADA normalization approach. This method normalizes the raw propagation scores with the eigenvector centrality measure for each protein, and then produces ranks based on either these normalizations or the raw propagation scores, depending on the seed set average weighted degree.
Mazza et al. (2016) tackled the first challenge by evaluating propagation scores against those obtained from propagating random seed sets. Nevertheless, none of the methods solves both problems, calling for a more complete solution.
In this work we present a novel normalization technique that tackles both challenges. We developed a new technique, in which the raw propagation scores are normalized through propagation scores obtained in random degree-preserving networks (RDPN). In cross validation tests, our method outperforms previous normalizations in gene prioritization tasks on diverse disease-related and function-related data sets in both human and yeast. Furthermore, it eliminates the degree biases of previous approaches and allows the assessment of statistical significance of the results by providing p-values that are corrected for multiple testing of candidate proteins.
Network propagation is a process in which a preselected set of seed proteins that underlie some phenotype of interest are viewed as “heat sources” in a PPI network. The heat is diffused to the rest of the proteins in the network in an iterative process until a steady-state is attained. Proteins that are relatively close to the seed set get higher propagation scores than distant proteins and are therefore considered to be associated with the phenotype in question. Network propagation is widely used for protein prioritization and related tasks (Cowen et al., 2017).
Formally, given a binary vector P0 denoting seed proteins, a normalized network adjacency matrix W (see below) and a smoothing parameter α controlling the relative importance of the network vs. the seed information, it can be shown that the propagation process converges to a score vector.
Henceforth, we follow (Vanunu et al., 2010) and set α = 0.8 (unless stated otherwise), to allow a fairly high network influence over the prior (seed) knowledge.
There are two main ways by which the adjacency matrix A (which could be weighted or unweighted) is normalized to ensure the convergence of the process: (i) a symmetric variant in, which W = D−1/2AD−1/2 and (ii) a degree-based variant, in which W = AD−1. Here D denotes the diagonal weighted degree matrix.
The raw scores from the propagation process do not carry a statistical meaning, and highly depend on the size of the seed set and the degrees of the proteins involved. It is thus desirable to normalize them. In the following we describe three previous normalization methods and a new hybrid of two of the methods; full details can be found in the Methods.
Erten et al. (2011) suggested the DADA method that builds on normalizing each propagation score by the eigenvector centrality measure of the same protein, which can be calculated by propagating with α = 1 from the same seed set (Brin and Page, 1998; Bryan and Leise, 2006; Erten et al., 2011). Here we analyze both this simple EC method and the full DADA method which uses ranks (rather than the scores themselves) of the regular propagation scores in case the average weighted degree of the seed set exceeds the network average weighted degree, or the logarithm of the EC score otherwise.
Mazza et al. (2016) suggested normalizing propagation scores by comparing them to propagations from random seed sets (RSS). This method produces p-values and is implemented as a web tool at http://anat.cs.tau.ac.il/WebPropagate/ (Biran et al., 2018).
We also examine here a hybrid of RSS and DADA, which we call RSS_SD. This variant produces p-values in the same manner RSS does, but the random seed sets are chosen to be degree-distributed like the original seed set using the method of Erten et al. (2011).
The only previous normalization method we are aware of that assigns statistical significance to the propagation scores is based on propagating random seed sets. Such computations do not take into account the degrees of the seed nodes. To overcome this shortcoming, we propose a novel method that is based on randomizations of the input network rather than the seed sets. Specifically, the propagation score of a protein is compared to the scores the protein attains on random degree-preserving networks under the same seed set. Our normalization method with random degree-preserving networks, RDPN, is schematically depicted in Figure 1.
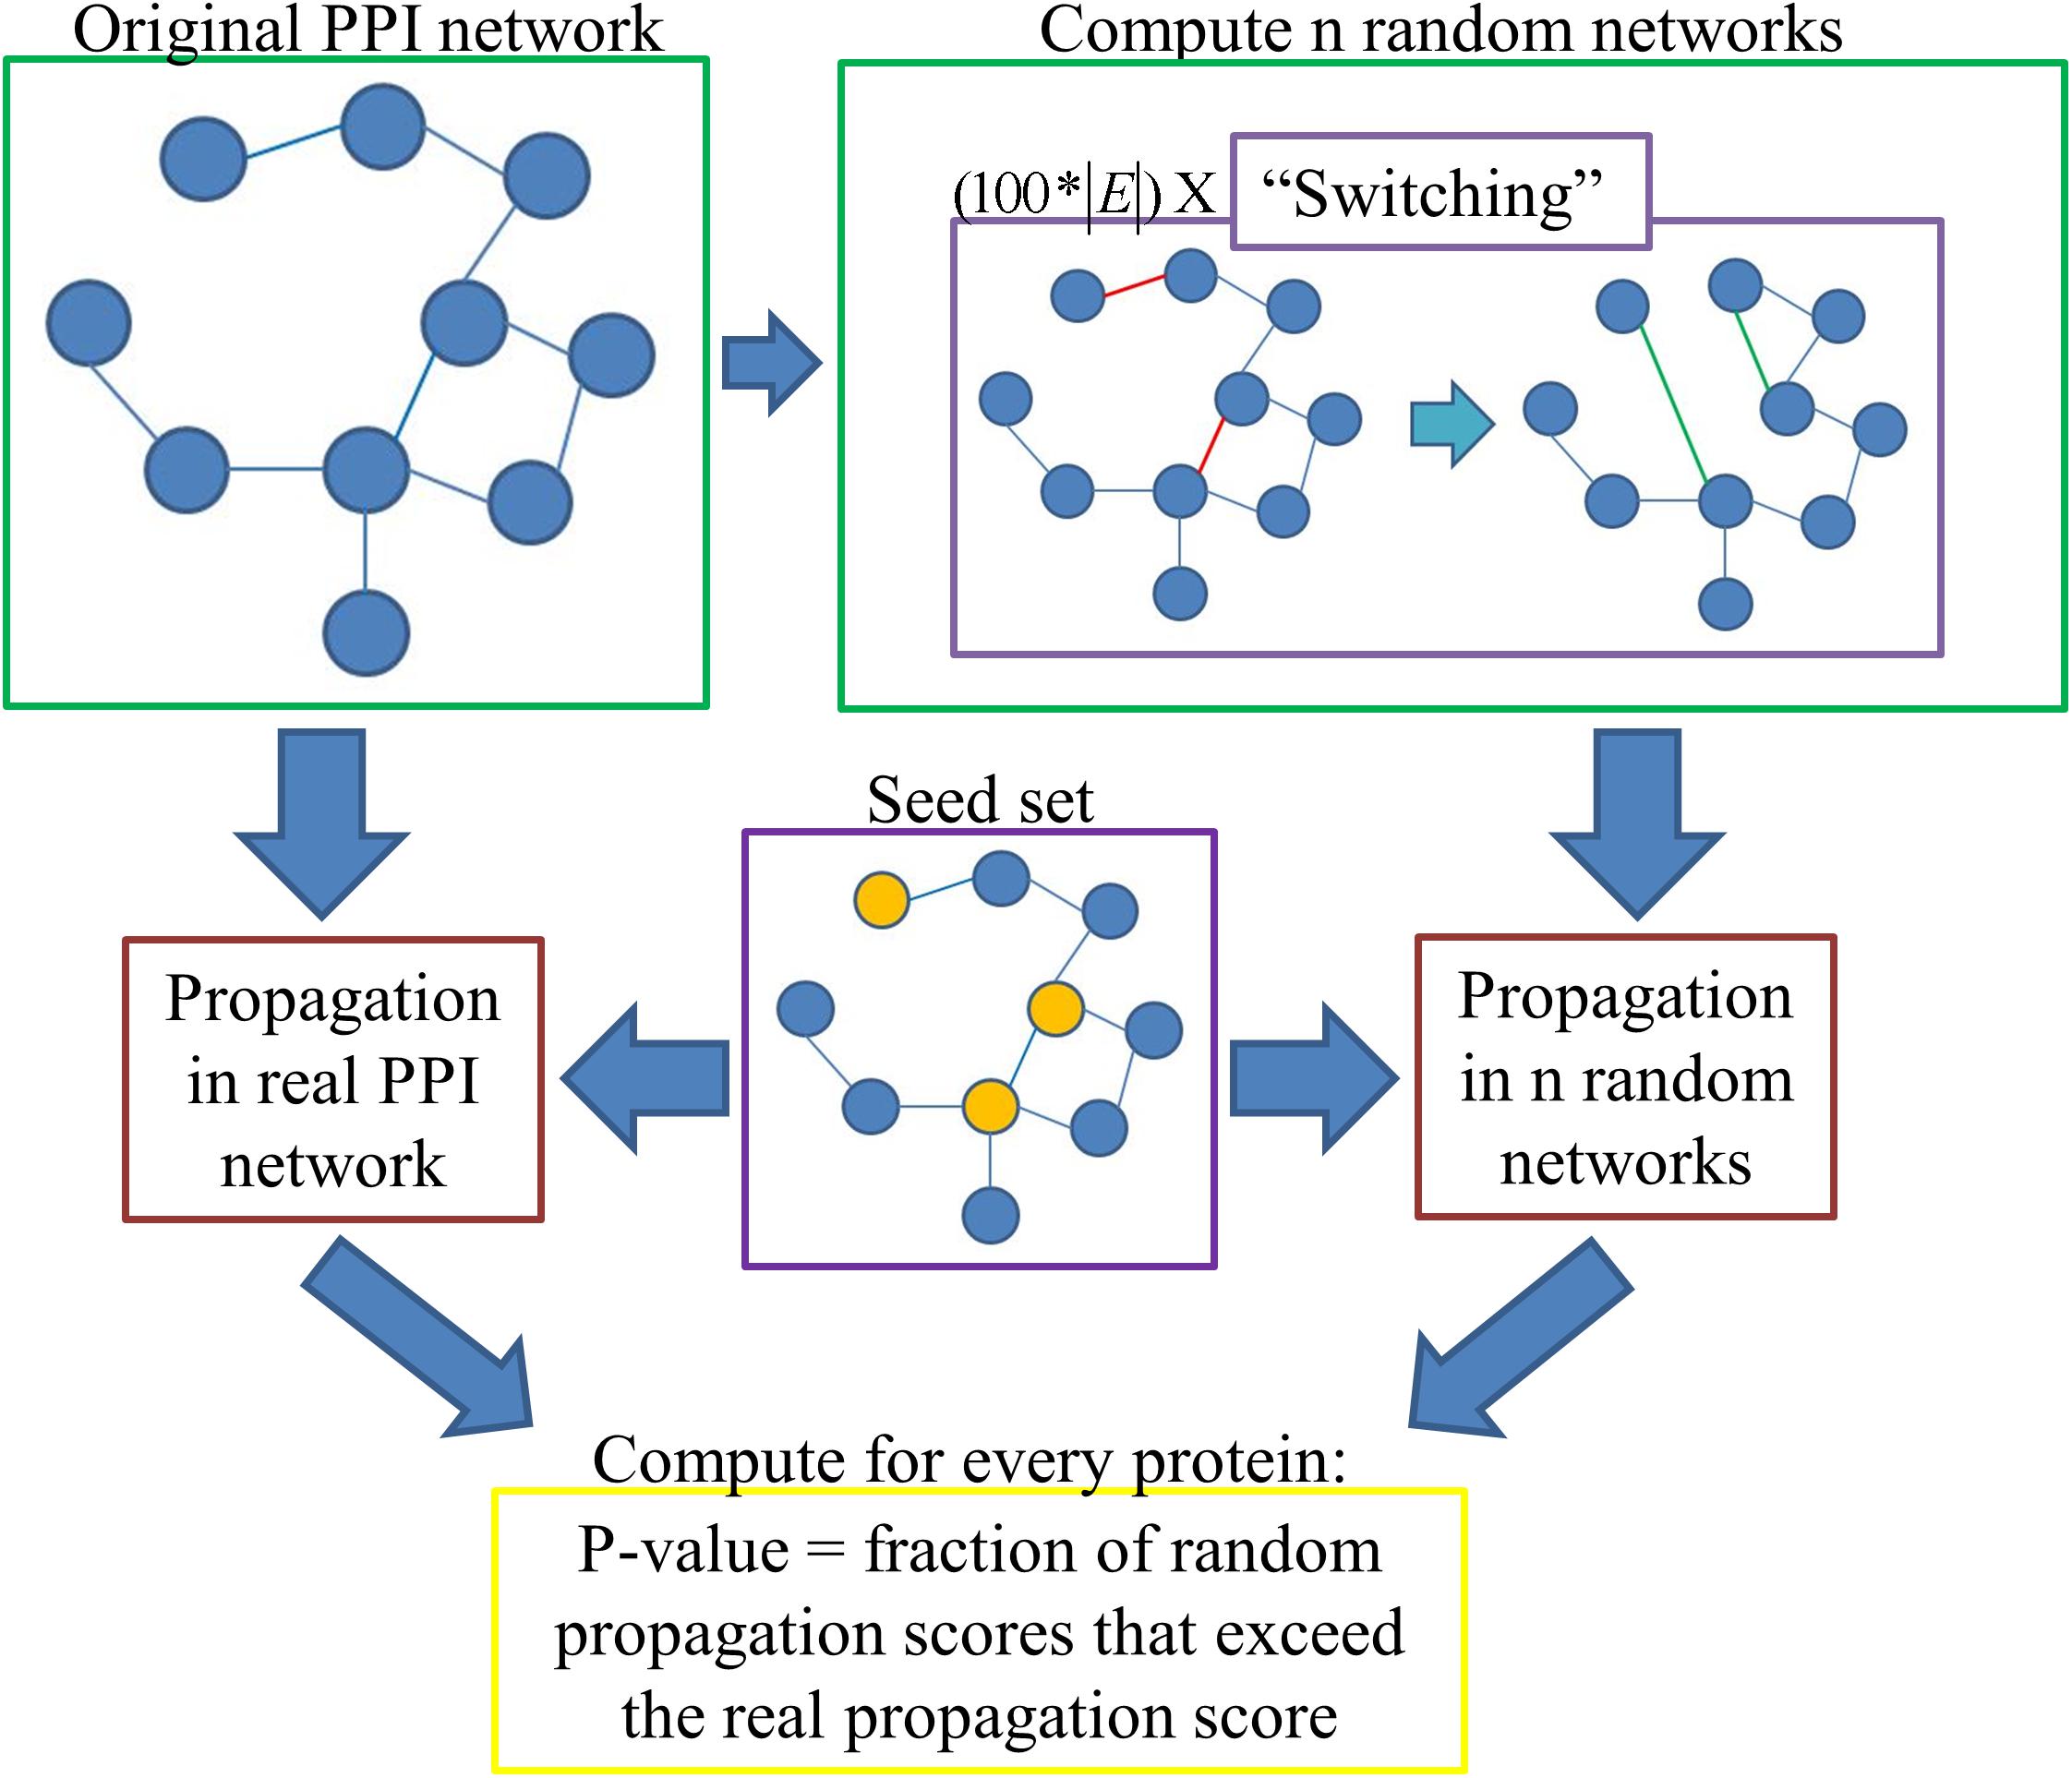
Figure 1. Schematic pipeline of the RDPN method.
In order to execute this method, one first has to compute n random degree-preserving networks (we use n = 100 unless otherwise stated). We implemented the “switching” method, in which in each iteration two edges (u, v) and (s, t) are picked randomly, and if u≠v≠s≠t and the edges (u, t), (s, v) do not already exist, then they are “switched,” namely the edges (u, v) and (s, t) are removed and the edges (u, t) and (s, v) are added. For the construction of one random network, we executed 100∗|E| such iterations, where |E| denotes the number of edges in the network, per the recommendation in Milo et al. (2003).
One issue that immediately emerges is the question of connectivity. Network propagation relies on the fact that all relevant proteins are part of one connected component, otherwise the information will not diffuse in a desired way. For example, suppose that during the randomization process two proteins got disconnected from the main component, creating a very small connected component of their own. If one of them is a seed protein, then the propagation score of the other one will be unreasonably high. However, if none of them is a seed protein, then their propagation scores will be 0. We addressed this issue by considering for each protein only the instances in which it was part of the main connected component in the network.
In detail, p-values are computed as follows: Each protein v gets a “real” propagation score by propagating from the seed set on the original network; it also gets n random scores (0 ≤i ≤n-1) by propagating from the same seed set on the n random networks. Then its p-value is computed as the fraction of random instances in which its score exceeded its real propagation score, i.e.:
To overcome the infrequent case in which a protein has a high tendency to get disconnected and, therefore, its p-value is determined based on an insufficient number of instances, we determined that a protein with less than n/2 relevant instances (instances in which it was part of the main connected component) will be assigned a p-value of one. Empirically, in our pre-computed random networks there was no such protein and therefore this condition was never used.
We compared the basic propagation computation with the three previously suggested normalization techniques (EC, DADA, and RSS), RSS_SD and our own Random Degree-Preserving Networks (RDPN) normalization with respect to their performance in multiple disease-related and function-related prioritization tasks as described below.
We evaluated the performance of the six methods and two matrix normalization variants on four large-scale data sets in a fivefold cross validation setting. Each data set contained multiple groups of function-related or disease-related genes with respect to which the prioritization of each normalization method was evaluated. Each method’s performance was summarized by the area under the ROC curve (AUROC) measure, when using similar-degree negative samples (Methods).
The evaluation results are given in Table 1. Regarding the two variants of adjacency matrix normalization, we found that in 12 out of 24 method-data set pairs (and also on average) the symmetric variant performs better (in 10 of them the degree-based variant performed better, and 2 were ties). Therefore, we focused on this variant in all subsequent evaluations. On average, the three top performing normalization methods were RDPN, RSS_SD, and EC, attaining similar AUROCs across the four data sets.
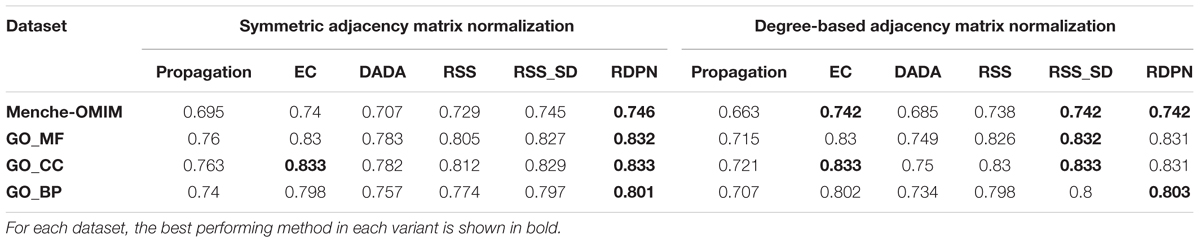
Table 1. Average AUROC of the six methods across four data sets, using two variants of adjacency matrix normalization.
However, when examining the performance on the individual groups within the data sets, we found that the RDPN method greatly outperformed all others with the highest number of groups for which it gave the best results across all data sets (Figure 2).
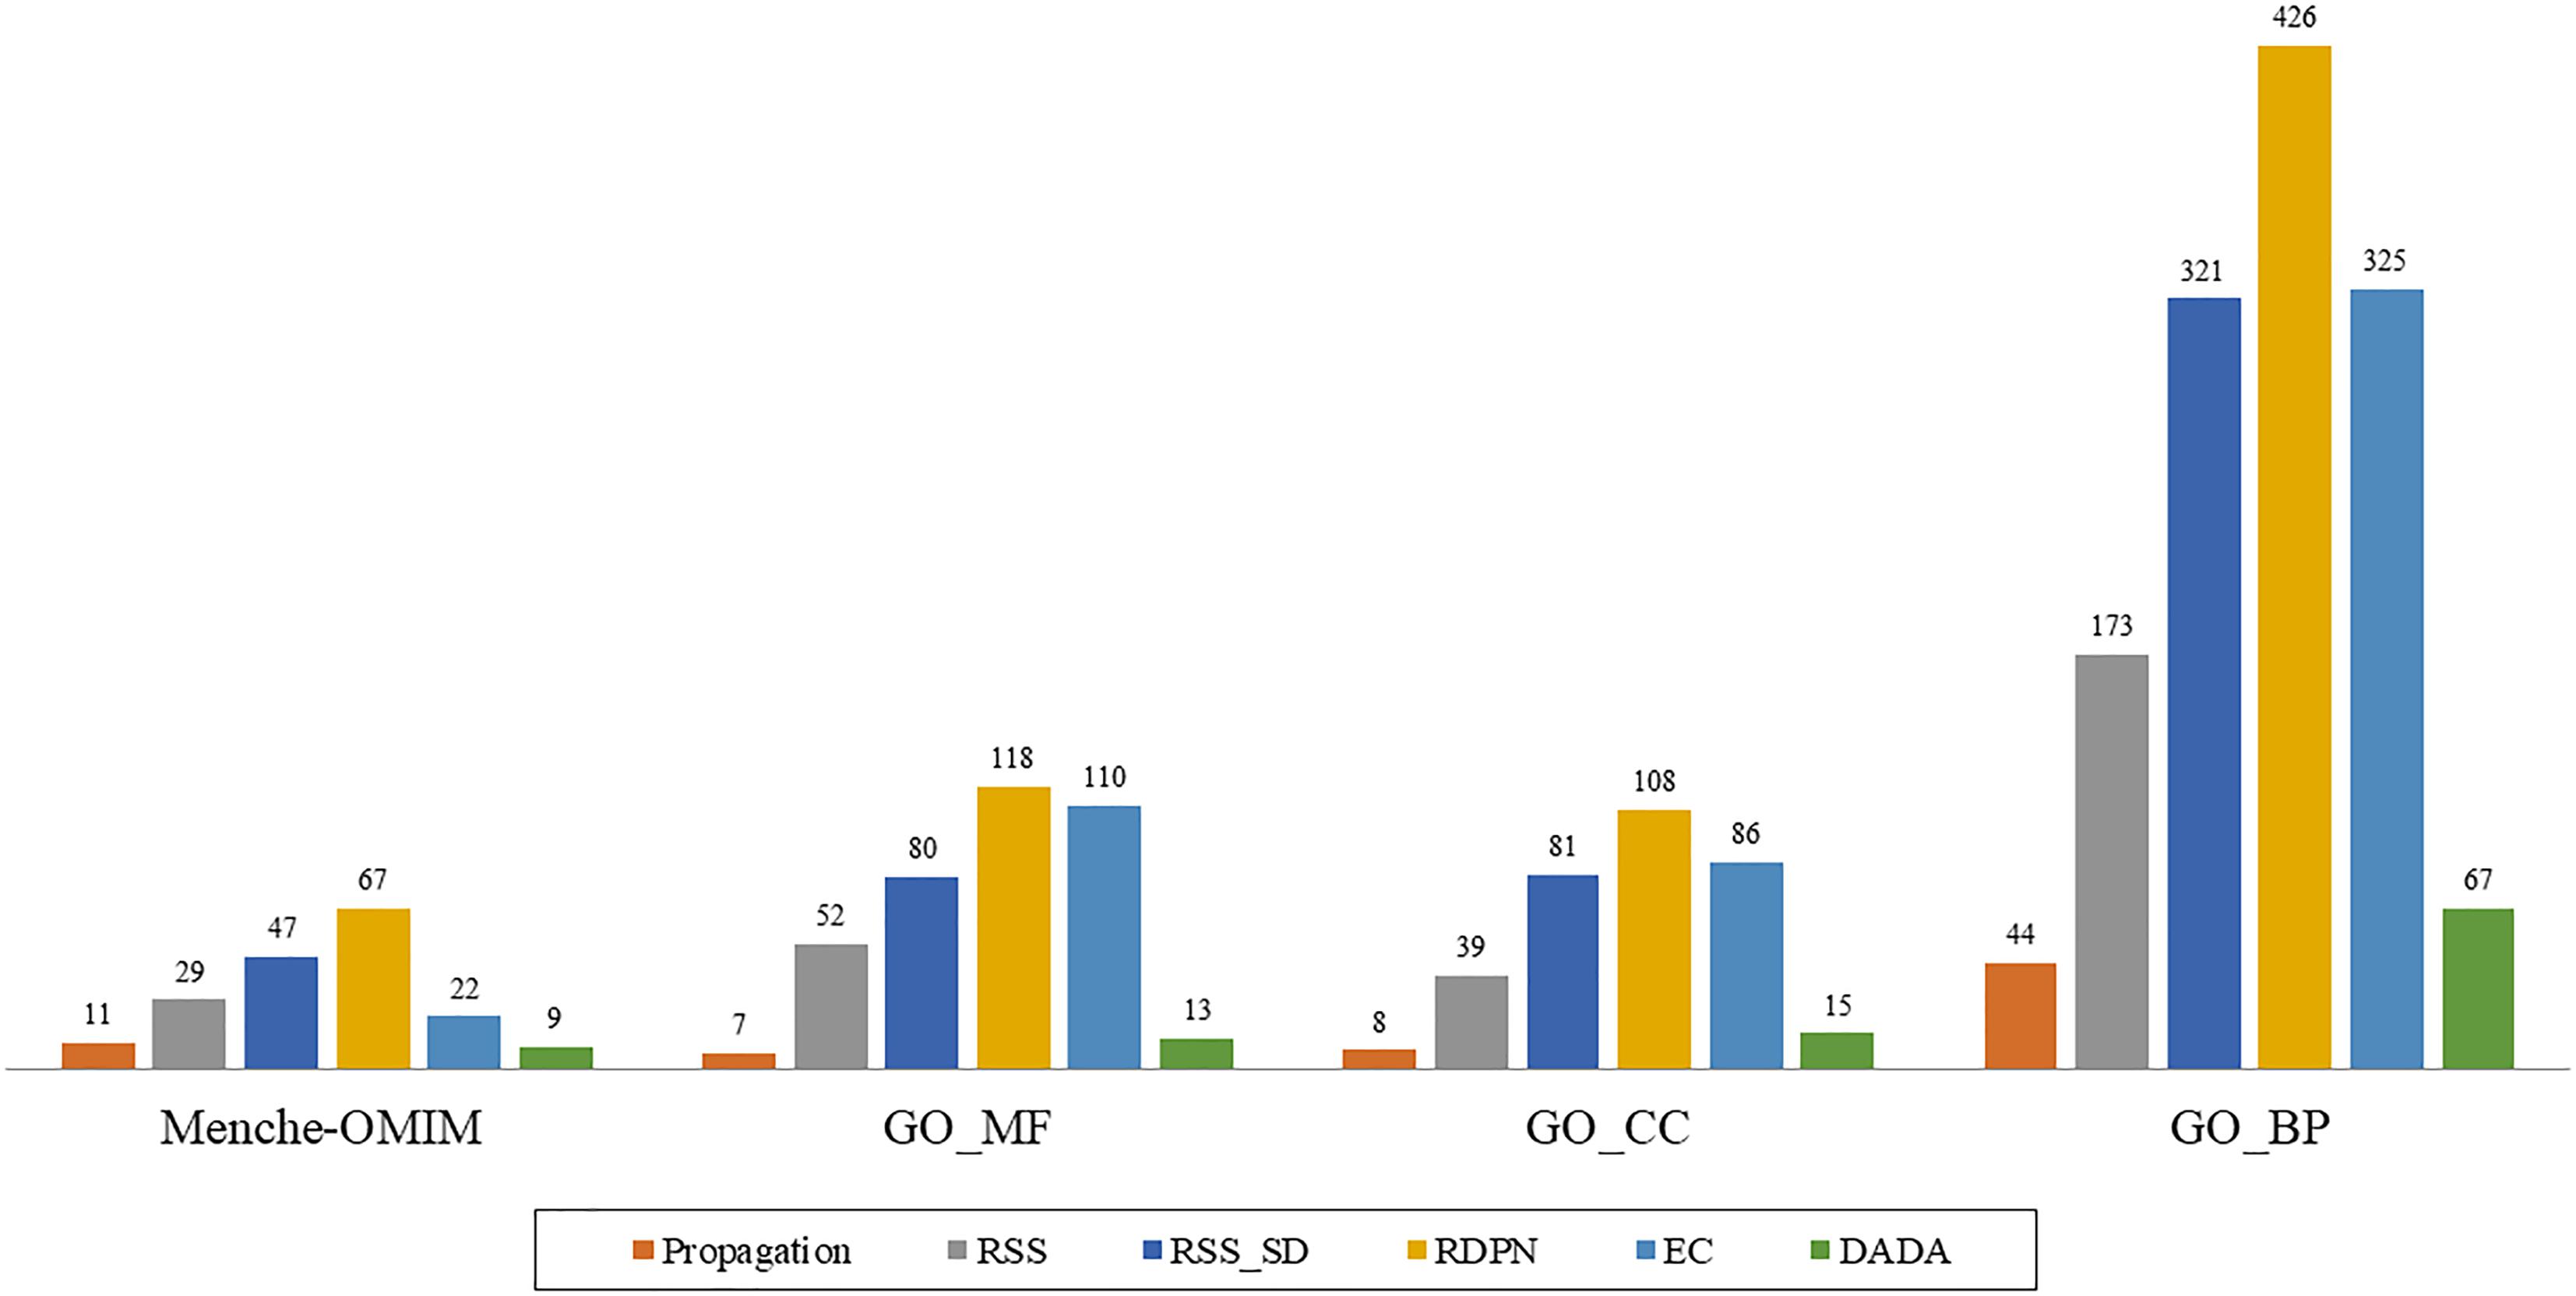
Figure 2. “Best method” counts, based on the AUROC measure, of the six methods across four data sets: Menche-OMIM (173 diseases), GO-MF (358 terms), GO-CC (306 terms), and GO-BP (1237 terms).
A good normalization method should account for the degrees of the candidate proteins, as these influence propagation scores. To test this, we focused on the Menche-OMIM set. Expectedly, the raw propagation scores are highly correlated with the weighted degree of the candidate protein (0.901 Spearman correlation). A similar anti-correlation level (-0.749) was observed for DADA’s ranks. In contrast, EC scores were only weakly correlated with the candidate protein weighted degree (average Spearman coefficient of 0.238), and the p-values computed by RSS, RSS_SD, and RDPN were relatively unbiased (average Spearman coefficients of 0.019, 0.035, and 0.078, respectively). These results are depicted in Figure 3.
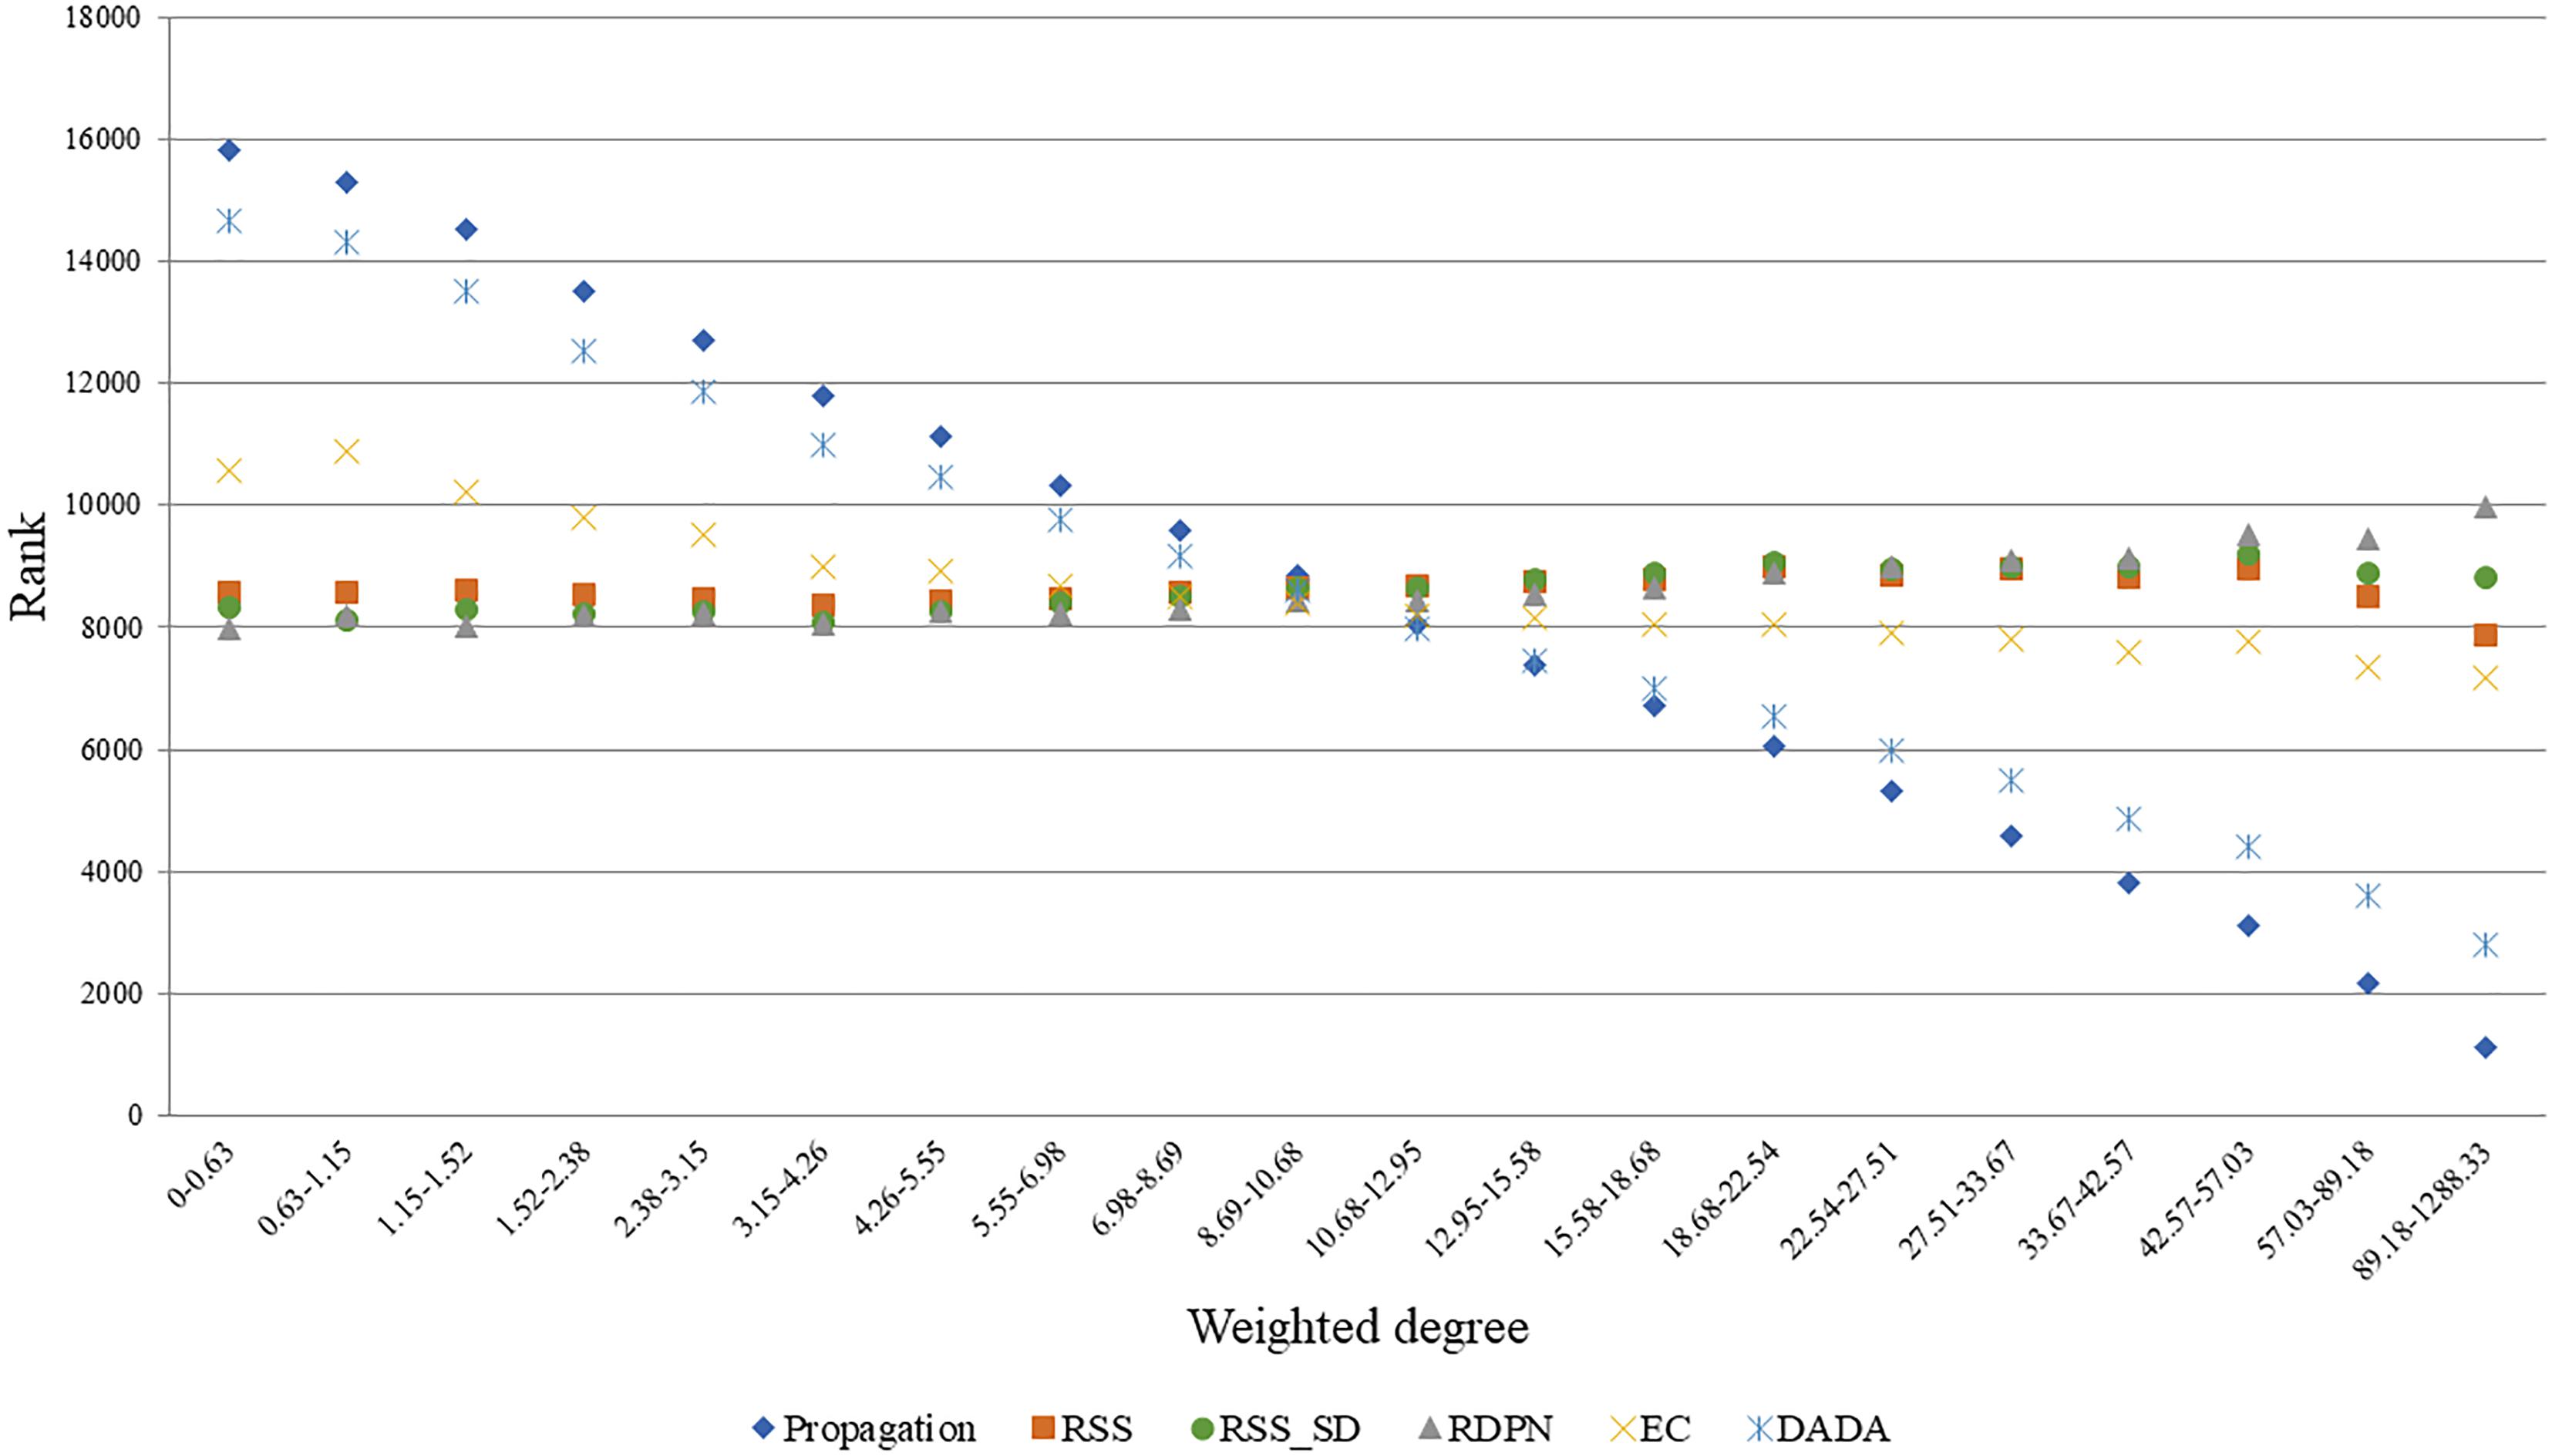
Figure 3. Average rank vs. weighted degree of candidate proteins. Depicted here are ranks based on seed sets from five arbitrary diseases in the Menche-OMIM set (Menche et al., 2015); bins contain approximately equal numbers of proteins. Ranks are derived from the methods’ scores the better the score the lower the rank.
While the regular propagation, EC and DADA produce scores or ranks, which are only expected to be meaningful for ranking proteins within the same run, RSS, RSS_SD, and RDPN produce p-values, which can be thresholded within and across runs to yield statistically significant hits. In order to evaluate the robustness of the assigned p-values, we tested their dependence on the average weighted degree of the seed set, focusing on the Menche-OMIM set. We found that both RDPN’s and RSS_SD’s percents of significant hits (p-value < 0.05) are only mildly affected by the seed set average weighted degree (Spearman correlation coefficients of -0.511 and 0.427, respectively) and are robust across runs (stds of 1.23 and 1.34%, respectively), while RSS’s percent of significant hits is both strongly correlated with the seed set average weighted degree (Spearman 0.945) and much more sensitive to the input seed set (std 12.46%) (Figure 4).
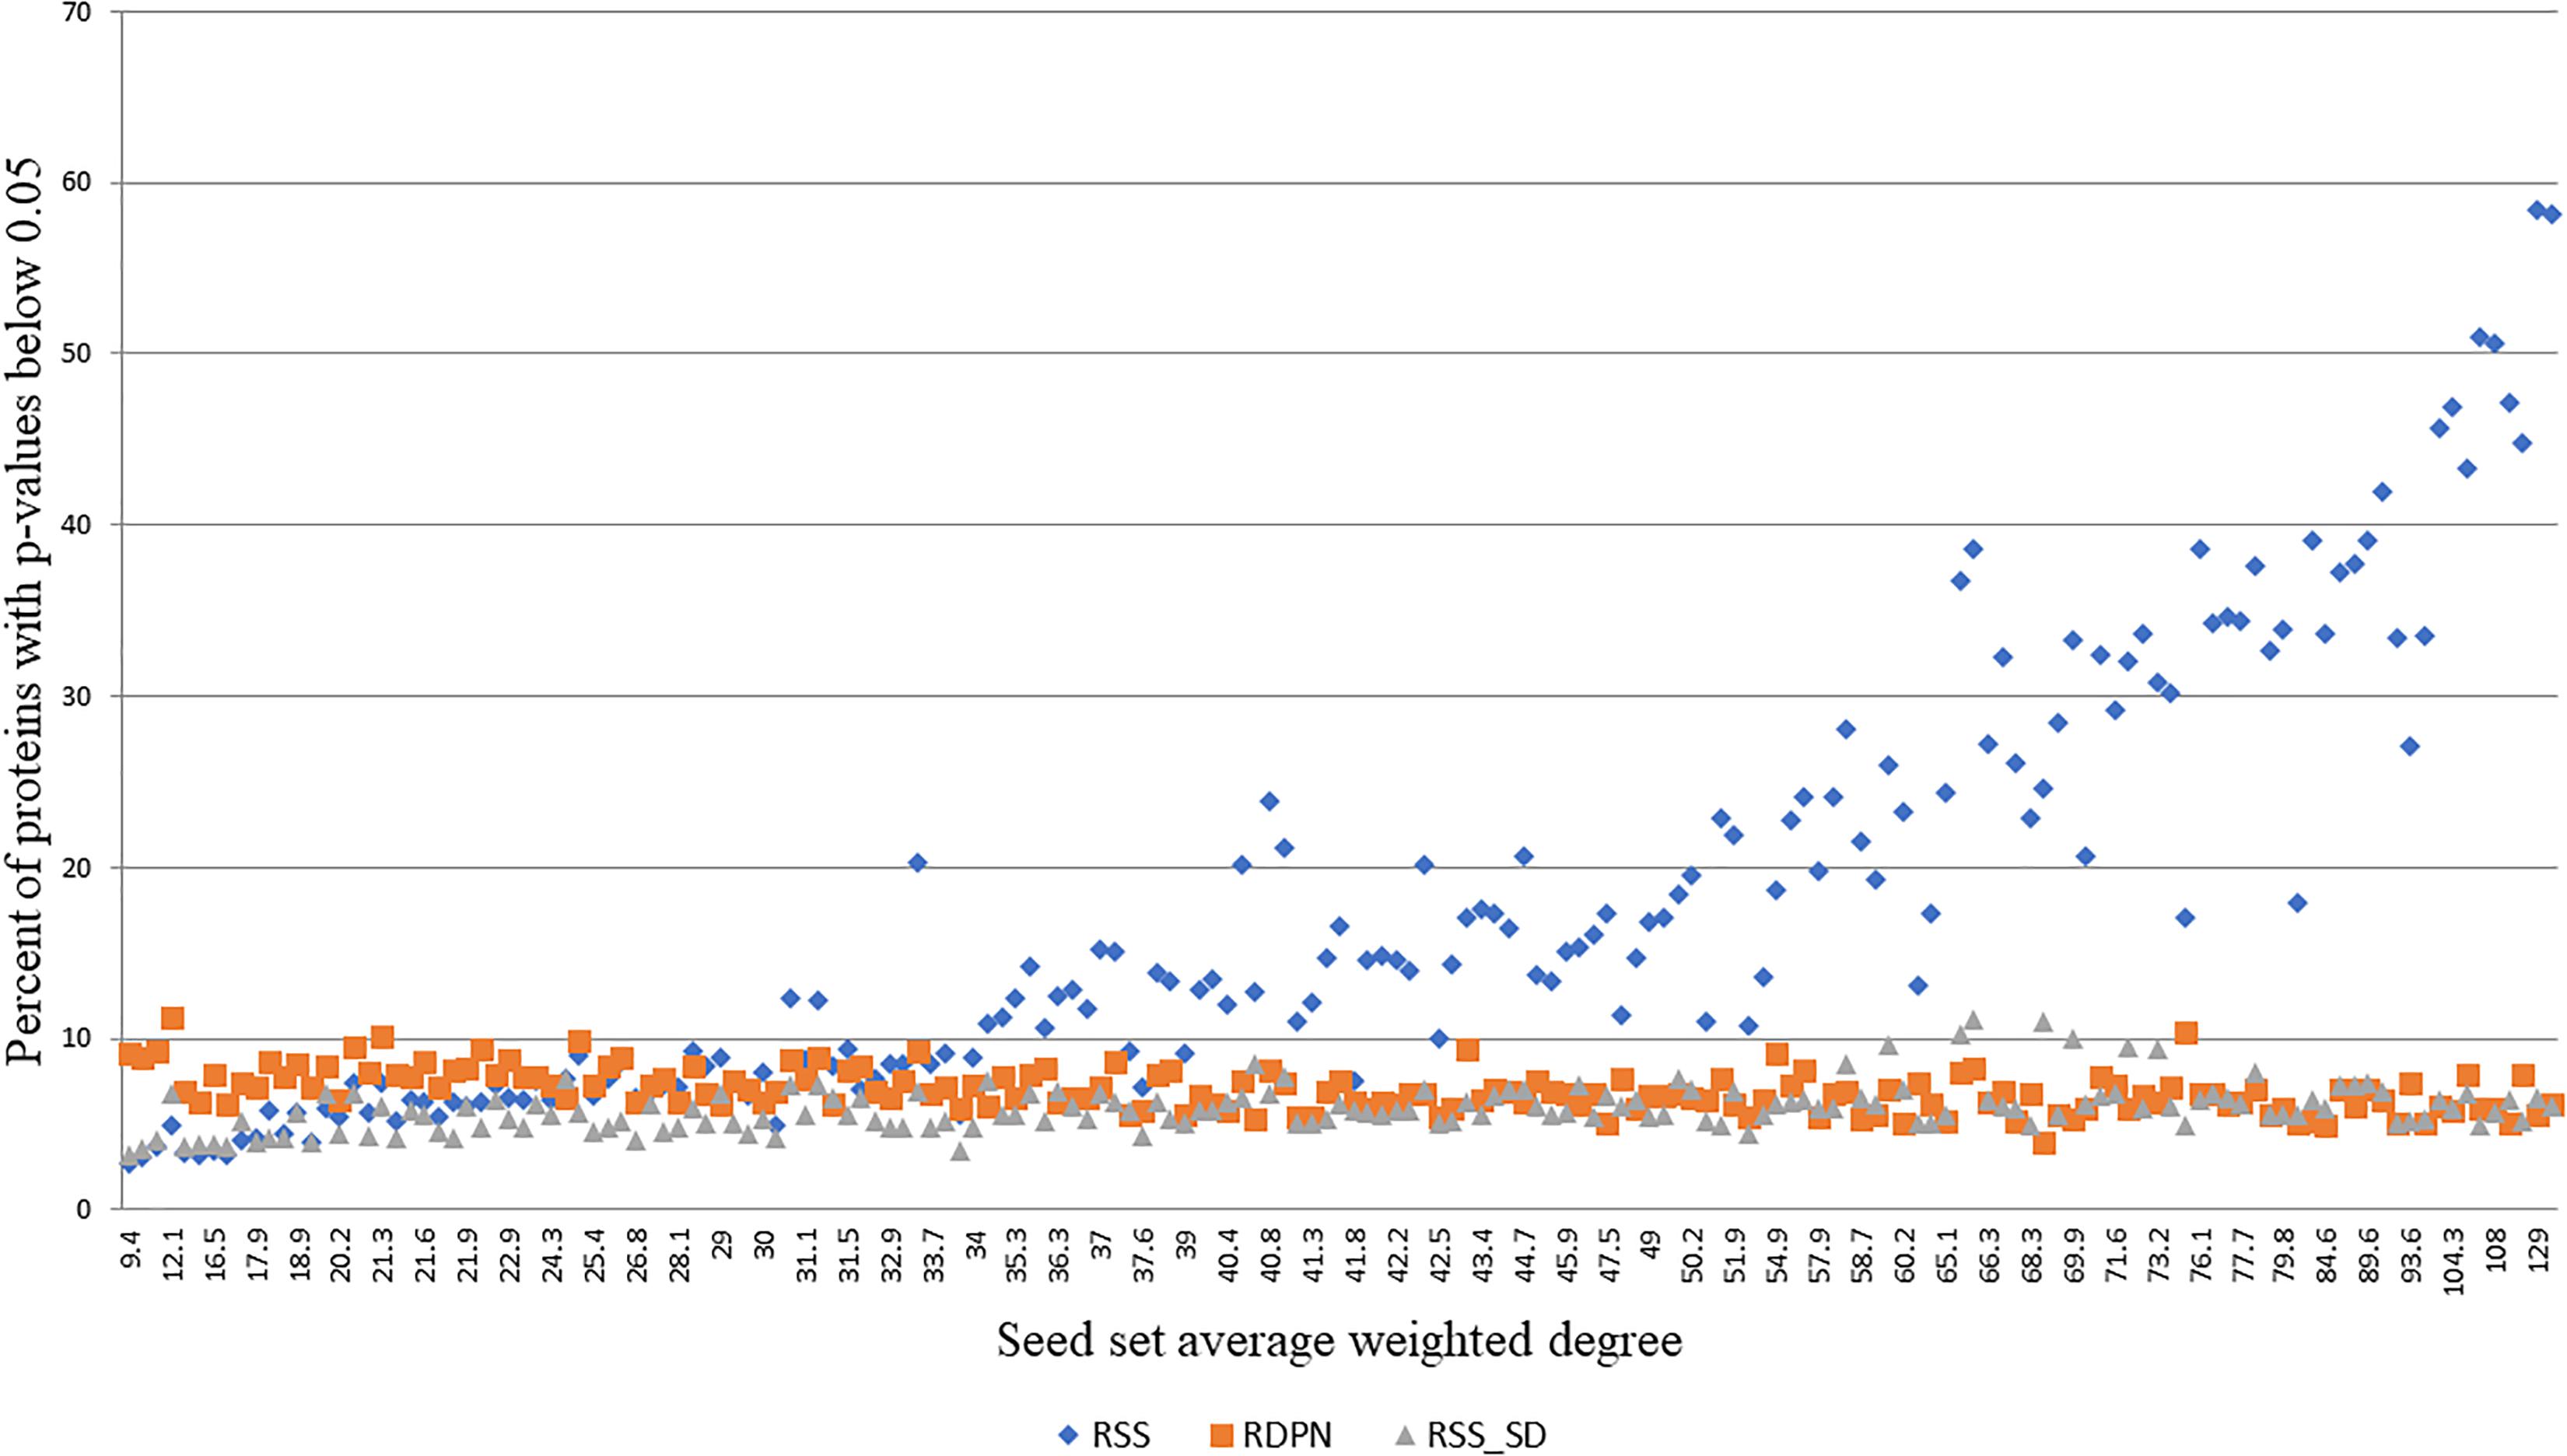
Figure 4. Percent of proteins with p-values below 0.05 vs. seed set average weighted degree, using 173 seed sets from the Menche-OMIM data set (Menche et al., 2015).
In order to study the biological implications of the different normalization methods, we used a telomere length maintenance (TLM) data set from yeast. Specifically, we used a seed set of known TLM genes from Askree et al. (2004) (see Methods and Supplementary Table S1). We compiled lists of top-ranking proteins by looking at the top 30 proteins for each of the methods (for RSS, RSS_SD, and RDPN we used n = 5000 to increase the resolution of p-values produced). We then manually evaluated the relevance of these predicted proteins to telomere length maintenance based on the literature (Table 2). We found that the basic propagation produced 4 TLM-related proteins (out of 30), EC produced 5, DADA produced 11, RSS produced 10, RSS_SD produced 12 and RDPN produced 25. This high specificity (25/30) highlights again the advantage of the newly suggested normalization over previous ones. The newly identified proteins participate in telomere length maintenance as part of large complexes or pathways, such as the VPS pathway, the THO, Mediator and RPD3 complex. The RDPN procedure correctly identified known proteins of these complex previously not characterized. Moreover, out of the 5 proteins not known to be involved in telomere length maintenance, two of them (RNH202 and RNH203) encode subunits of the Rnase H, a nuclease with important roles in genome maintenance, mutated in the human Aicardi-Goutieres syndrome (Crow et al., 2006). Its roles in R-loop repair have suggested possible involvement in telomere biology, although no clear telomere length defect has been detected (Lafuente-Barquero et al., 2017).
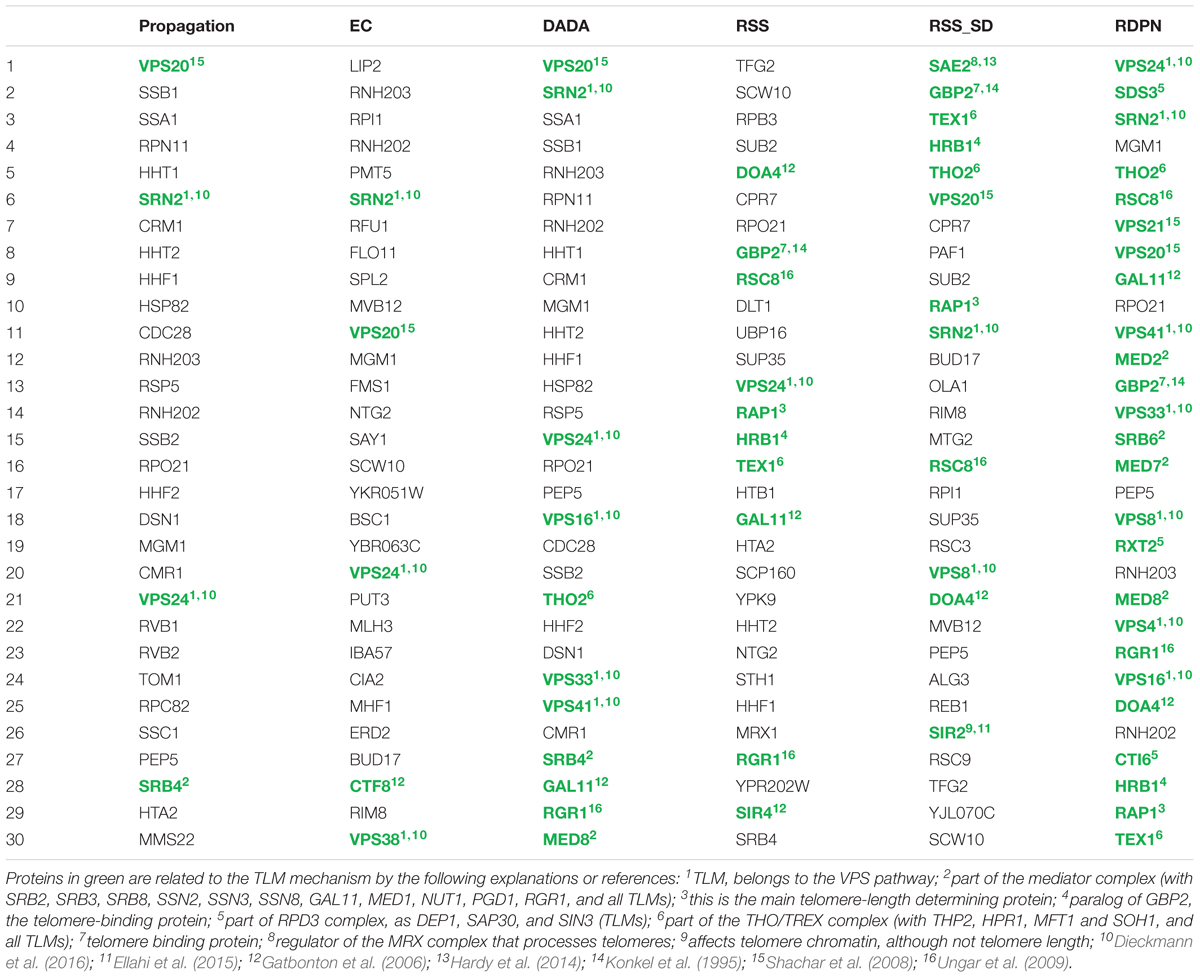
Table 2. Top 30 proteins obtained by the different methods in the telomere-length maintenance case study.
In summary, we have devised a new method (RDPN) for normalizing propagation results that accounts for the degrees of the involved proteins and produces robust p-value estimations. The method was shown to outperform previous ones across diverse disease-related and function-related data sets. Importantly, we have shown that the p-values it assigns do not depend on the degree of the protein being scored, hence this method is less prone to literature biases and more likely to discover new associations. Moreover, we have shown that its assigned p-values are robust to the average degree of the seed set, allowing significance assessment across different data sets. Finally, in testing the biological implications of the method’s predictions, we found that it greatly outperforms previous normalizations and leads to new biological insights.
Considering all evaluated parameters, it seems that three of the tested methods outshine the others: RDPN, which generates robust p-values and displays the best performance, RSS_SD which also generates robust p-values but doesn’t perform as well, and EC which is easy to implement and has good performance although its nominal scores are harder to interpret.
We note that there are many variants in the literature of the basic network propagation methodology, such as random walk with restart and diffusion kernel (Cowen et al., 2017). Our normalization method is readily applicable to all these variants and can be used to eliminate potential degree biases and assign statistical significance values.
This method uses propagation scores from n random seed sets (we use n = 100 unless stated otherwise) to normalize the real propagation scores, as suggested by Mazza et al. (2016). In detail, each protein v has a “real” propagation score the score it got by propagating from the real seed set; and n random scores (0 ≤ i ≤n-1) derived by propagating from n random seed sets (each with the same number of proteins as the real seed set). For every protein v only the instances in which it was not part of the random seed set are considered, and its p-value is the fraction of random instances in which its score exceeded its real propagation score, i.e.:
The EC scores are computed as follows:
where is the propagation score of protein v when propagating from the seed set with α = 0.8, and is its propagation score when propagating from the same seed set with α = 1 (i.e., disregarding the seed set in the computation).
The DADA ranks, as described in Erten et al. (2011), are computed as follows: first EC scores are computed as:
for all the proteins in the network where is the propagation score of protein v when propagating from the seed set with α = 0.7, and is its propagation score when propagating from the same seed set with α = 1. Then each protein gets a rank which is its position in a descending order of EC scores, and also a rank which is its position in a descending order of the regular propagation scores . Finally, if the average weighted degree of the seed set exceeds the network average weighted degree, all proteins final ranks are set to . Otherwise, they are set to .
Following Erten et al. (2011), we first construct seed sets S(i) (0 ≤i ≤ n-1, we use n = 100) that have a degree distribution that is similar to the original seed set S by applying this procedure: We assign each v∈V to a bucket B(u) such that u∈S and |W(v)-W(u)| is minimized (ties are broken randomly).
In case there are two or more seed proteins with an equal weighted degree, there is a possibility that one of their buckets will remain empty. If that happens, we reassign all network proteins (we repeat this step if necessary).
We generate S(i) by choosing a protein from each bucket uniformly at random.
We then propagate from these seed sets, as well as from the original seed set, and proceed to compute p-values as in the RSS method.
Menche et al. (2015) compiled a list of 299 diseases defined by the Medical Subject Headings (MeSH) that have at least 20 associated genes from either the Online Mendelian Inheritance in Man (OMIM) data set or the genome-wide association study (GWAS) data set (or both). We empirically found that all methods perform better when using only the genes from OMIM, so only the 173 diseases out of that list that have at least 20 and up to 1000 associated genes from OMIM in the HIPPIE network were used for evaluation.
We used geneSCF (Subhash and Kanduri, 2016) to get a list of all GO terms (Ashburner et al., 2000; The Gene Ontology Consortium, 2017) (in all three sub-ontologies) with their corresponding genes. We focused the evaluation on terms that included between 20 and 1000 genes (1237 GO Biological Process (BP) terms, 306 GO Cellular Component (CC) terms and 358 GO Molecular Function (MF) terms).
A genome wide-screen study by Askree et al. (2004) found 173 S. cerevisiae genes that affect telomere length. We used 163 of them that are found in the ANAT S. cerevisiae network as the seed set (Supplementary Table S1).
For the performance evaluation section we used the HIPPIE network which has 17335 proteins and 330028 (non self-loops) interactions in its main connected component (Alanis-Lobato et al., 2017) (version 18-Jul-2017).
For the TLM case study we used the ANAT Saccharomyces cerevisiae network which has 5527 proteins and 75678 (non self-loops) interactions in its main connected component (Almozlino et al., 2017).
For each group of disease-related or function-related genes, we randomly split it to five equally sized parts. In each cross-validation iteration we hid one of the parts, used the other four as a seed set, and tested the success of the method in predicting the hidden proteins (serving as positive samples) using the AUROC measure. We then averaged the performance across the five iterations. To compute the AUROC scores, we picked negative samples with similar weighted degrees as the positive samples. This was implemented as follows: for each positive protein with a weighted degree w, we chose the smallest integer r such that there are at least 100 proteins in the network (excluding the seed set, the positive samples and the already chosen negative samples) with weighted degree in the range [w-r, w+r]. We then randomly picked a protein from this group to be used as a negative sample.
HB and RS conceived the RDPN method and designed the computational framework. HB implemented the framework and produced the results. All authors interpreted the results and contributed to the manuscript.
RS was supported by the Israel Science Foundation (Grants No. 715/18 and 757/12). MK was supported by the Israel Science Foundation and the Israel Cancer Research Foundation.
The authors declare that the research was conducted in the absence of any commercial or financial relationships that could be construed as a potential conflict of interest.
The reviewer MK declared a past collaboration with one of the authors RS.
The Supplementary Material for this article can be found online at: https://www.frontiersin.org/articles/10.3389/fgene.2019.00004/full#supplementary-material
Alanis-Lobato, G., Andrade-Navarro, M. A., and Schaefer, M. H. (2017). HIPPIE v2.0: enhancing meaningfulness and reliability of protein–protein interaction networks. Nucleic Acids Res. 45, D408–D414. doi: 10.1093/nar/gkw985
Almozlino, Y., Atias, N., Silverbush, D., and Sharan, R. (2017). ANAT 2.0: reconstructing functional protein subnetworks. BMC Bioinformatics 18:495. doi: 10.1186/s12859-017-1932-1
Ashburner, M., Ball, C. A., Blake, J. A., Botstein, D., Butler, H., Cherry, J. M., et al. (2000). Gene ontology: tool for the unification of biology. the gene ontology consortium. Nat. Genet. 25, 25–29. doi: 10.1038/75556
Askree, S. H., Yehuda, T., Smolikov, S., Gurevich, R., Hawk, J., Coker, C., et al. (2004). A genome-wide screen for Saccharomyces cerevisiae deletion mutants that affect telomere length. Proc. Natl. Acad. Sci. U. S. A. 101, 8658–8663. doi: 10.1073/pnas.0401263101
Biran, H., Almozlino, T., Kupiec, M., and Sharan, R. (2018). WebPropagate: a web-server for network propagation. J. Mol. Biol. 430, 2231–2236. doi: 10.1016/j.jmb.2018.02.025
Brin, S., and Page, L. (1998). The anatomy of a large-scale hypertextual web search engine. Comput. Netw. ISDN Syst. 30, 107–117. doi: 10.1016/S0169-7552(98)00110-X
Bryan, K., and Leise, T. (2006). The $25,000,000,000 eigenvector: the linear algebra behind google. SIAM Rev. 48, 569–581. doi: 10.1137/050623280
Cowen, L., Ideker, T., Raphael, B. J., and Sharan, R. (2017). Network propagation: a universal amplifier of genetic associations. Nat. Rev. Genet. 18:551. doi: 10.1038/nrg.2017.38
Crow, Y. J., Leitch, A., Hayward, B. E., Garner, A., Parmar, R., Griffith, E., et al. (2006). Mutations in genes encoding ribonuclease H2 subunits cause aicardi-goutières syndrome and mimic congenital viral brain infection. Nat. Genet. 38, 910–916. doi: 10.1038/ng1842
Dieckmann, A. K., Babin, V., Harari, Y., Eils, R., König, R., Luke, B., et al. (2016). Role of the ESCRT complexes in telomere biology. mBio 7, e01793–e01816. doi: 10.1128/mBio.01793-16
Ellahi, A., Thurtle, D. M., and Rine, J. (2015). The chromatin and transcriptional landscape of native Saccharomyces cerevisiae telomeres and subtelomeric domains. Genetics 200, 505–521. doi: 10.1534/genetics.115.175711
Erten, S., Bebek, G., Ewing, R. M., and Koyutürk, M. (2011). DADA: degree-aware algorithms for network-based disease gene prioritization. BioData Min. 4:19. doi: 10.1186/1756-0381-4-19
Gatbonton, T., Imbesi, M., Nelson, M., Akey, J. M., Ruderfer, D. M., Kruglyak, L., et al. (2006). Telomere length as a quantitative trait: genome-wide survey and genetic mapping of telomere length-control genes in yeast. PLoS Genet. 2:e35. doi: 10.1371/journal.pgen.0020035
Hardy, J., Churikov, D., Géli, V., and Simon, M. N. (2014). Sgs1 and Sae2 promote telomere replication by limiting accumulation of ssDNA. Nat. Commun. 5:5004. doi: 10.1038/ncomms6004
Konkel, L. M., Enomoto, S., Chamberlain, E. M., McCune-Zierath, P., Iyadurai, S. J., and Berman, J. (1995). A class of single-stranded telomeric DNA-binding proteins required for Rap1p localization in yeast nuclei. Proc. Natl. Acad. Sci. U. S. A. 92, 5558–5562. doi: 10.1073/pnas.92.12.5558
Lafuente-Barquero, J., Luke-Glaser, S., Graf, M., Silva, S., Gómez-González, B., Lockhart, A., et al. (2017). The Smc5/6 complex regulates the yeast Mph1 helicase at RNA-DNA hybrid-mediated DNA damage. PLoS Genet. 13:e1007136. doi: 10.1371/journal.pgen.1007136
Mazza, A., Klockmeier, K., Wanker, E., and Sharan, R. (2016). An integer programming framework for inferring disease complexes from network data. Bioinforma. Oxf. Engl. 32, i271–i277. doi: 10.1093/bioinformatics/btw263
Menche, J., Sharma, A., Kitsak, M., Ghiassian, S. D., Vidal, M., Loscalzo, J., et al. (2015). Disease networks. uncovering disease-disease relationships through the incomplete interactome. Science 347:1257601. doi: 10.1126/science.1257601
Milo, R., Kashtan, N., Itzkovitz, S., Newman, M. E. J., and Alon, U. (2003). On the uniform generation of random graphs with prescribed degree sequences. arXiv:cond-mat/0312028 [Preprint].
Shachar, R., Ungar, L., Kupiec, M., Ruppin, E., and Sharan, R. (2008). A systems-level approach to mapping the telomere length maintenance gene circuitry. Mol. Syst. Biol. 4:172. doi: 10.1038/msb.2008.13
Subhash, S., and Kanduri, C. (2016). GeneSCF: a real-time based functional enrichment tool with support for multiple organisms. BMC Bioinformatics 17:365. doi: 10.1186/s12859-016-1250-z
The Gene Ontology Consortium. (2017). Expansion of the gene ontology knowledgebase and resources. Nucleic Acids Res. 45, D331–D338. doi: 10.1093/nar/gkw1108
Ungar, L., Yosef, N., Sela, Y., Sharan, R., Ruppin, E., and Kupiec, M. (2009). A genome-wide screen for essential yeast genes that affect telomere length maintenance. Nucleic Acids Res. 37, 3840–3849. doi: 10.1093/nar/gkp259
Keywords: network diffusion, protein–protein interaction network, gene prioritization, p-value computation, degree-preserving randomization, telomere length maintenance
Citation: Biran H, Kupiec M and Sharan R (2019) Comparative Analysis of Normalization Methods for Network Propagation. Front. Genet. 10:4. doi: 10.3389/fgene.2019.00004
Received: 01 October 2018; Accepted: 07 January 2019;
Published: 22 January 2019.
Edited by:
Marco Pellegrini, Italian National Research Council, ItalyReviewed by:
Mehmet Koyuturk, Case Western Reserve University, United StatesCopyright © 2019 Biran, Kupiec and Sharan. This is an open-access article distributed under the terms of the Creative Commons Attribution License (CC BY). The use, distribution or reproduction in other forums is permitted, provided the original author(s) and the copyright owner(s) are credited and that the original publication in this journal is cited, in accordance with accepted academic practice. No use, distribution or reproduction is permitted which does not comply with these terms.
*Correspondence: Roded Sharan, cm9kZWRAdGF1LmFjLmls
Disclaimer: All claims expressed in this article are solely those of the authors and do not necessarily represent those of their affiliated organizations, or those of the publisher, the editors and the reviewers. Any product that may be evaluated in this article or claim that may be made by its manufacturer is not guaranteed or endorsed by the publisher.
Research integrity at Frontiers
Learn more about the work of our research integrity team to safeguard the quality of each article we publish.