
95% of researchers rate our articles as excellent or good
Learn more about the work of our research integrity team to safeguard the quality of each article we publish.
Find out more
ORIGINAL RESEARCH article
Front. Genet. , 19 June 2018
Sec. Livestock Genomics
Volume 9 - 2018 | https://doi.org/10.3389/fgene.2018.00220
 Rongrong Ding1†
 Ming Yang2†
 Xingwang Wang1
 Jianping Quan1
 Zhanwei Zhuang1
 Shenping Zhou1Shaoyun Li1Zheng Xu1Enqin Zheng1Gengyuan Cai1,2Dewu Liu1
 Wen Huang3
 Jie Yang1*Zhenfang Wu1,2*
Increasing feed efficiency is a major goal of breeders as it can reduce production cost and energy consumption. However, the genetic architecture of feeding behavior and feed efficiency traits remains elusive. To investigate the genetic architecture of feed efficiency in pigs, three feeding behavior traits (daily feed intake, number of daily visits to feeder, and duration of each visit) and two feed efficiency traits (feed conversion ratio and residual feed intake) were considered. We performed genome-wide association studies (GWASs) of the five traits using a population of 1,008 Duroc pigs genotyped with an Illumina Porcine SNP50K BeadChip. A total of 9 genome-wide (P < 1.54E-06) and 35 suggestive (P < 3.08E-05) single nucleotide polymorphisms (SNPs) were detected. Two pleiotropic quantitative trait loci (QTLs) on SSC 1 and SSC 7 were found to affect more than one trait. Markers WU_10.2_7_18377044 and DRGA0001676 are two key SNPs for these two pleiotropic QTLs. Marker WU_10.2_7_18377044 on SSC 7 contributed 2.16 and 2.37% of the observed phenotypic variance for DFI and RFI, respectively. The other SNP DRGA0001676 on SSC 1 explained 3.22 and 5.46% of the observed phenotypic variance for FCR and RFI, respectively. Finally, functions of candidate genes and gene set enrichment analysis indicate that most of the significant pathways are associated with hormonal and digestive gland secretion during feeding. This study advances our understanding of the genetic mechanisms of feeding behavior and feed efficiency traits and provide an opportunity for increasing feeding efficiency using marker-assisted selection or genomic selection in pigs.
Pork is an important meat source for humans, accounting for nearly 40% of all meat consumed by the world population (Wang et al., 2015). The share of feed cost, which is the highest of the total production cost, remains high, ranging from 50 to 85% (Young et al., 2011). The key to reducing feed cost is to increase feed efficiency. Increasing feed efficiency not only reduces feed consumption while decreasing farming cost and energy use, but also lowers manure production and the total amount of potential greenhouse gas emission (O’Shea et al., 2012; Bartos et al., 2016).
In animal breeding programs, feed efficiency traits are difficult to improve by direct selection because feed efficiency cannot be measured directly (Hoque and Suzuki, 2008). Feed conversion ratio (FCR) and residual feed intake (RFI) are two traits that have been used to evaluate feed efficiency (Lu et al., 2017). FCR (the ratio of feed intake to output) is widely used to estimate feed efficiency in pig breeding because of its simplicity in calculation and its correlation with growth rate and body weight (BW) (Fan et al., 2010; Do et al., 2013a). However, previous genetic studies also show that FCR is not always effective (Webb and King, 1983). For example, pigs with low feed intakes and undesirably low gains may also have high FCRs (Webb and King, 1983; Iwaisaki, 1989; Smith et al., 1991). RFI is defined as the difference of feed intake between the actual feed eaten and the expected feed intake required for production and maintenance (Koch et al., 1963). RFI appears to be a better indicator of feed efficiency as compared to FCR. However, computation of RFI varies widely, depending on the predicted feed requirement for production and maintenance (Hoque et al., 2009; Do et al., 2013a, 2014), which adds to the difficulty of comparing different studies.
Feeding behavior is one of the most important factors affecting feed efficiency. Several studies have shown a strong genetic and phenotypic correlation between feeding behavior and feed efficiency traits in swine (Hoque et al., 2009). For instance, daily feed intake (DFI) has a positive genetic and phenotypic correlation with FCR (0.65 and 0.67, respectively) and RFI (0.95 and 0.90, respectively) (Do et al., 2013a). Therefore, to understand the molecular mechanism and genetic basis of feed efficiency, it is likely helpful to consider both feeding behavior and feed efficiency traits.
Among a total of 26,076 quantitative trait loci (QTL) associated with 647 different traits reported in pigs (PigQTLdb1), 639 QTLs have been identified for feeding behavior and feed efficiency traits. Most of these QTL were identified using linkage mapping. Because of the large intervals of QTLs, directly using them for genetic improvement remains difficult (Tabor et al., 2002). In recent years, with the advent of dense marker panels, association mapping has become a powerful strategy for the detection of genetic variants associated with complex traits. It has been widely used in humans (McCarthy et al., 2008) and domestic animals (Andersson, 2009; Ma et al., 2014; Guo et al., 2016).
Duroc pig population is widely used as the terminal male parent of the DLY (Duroc × Landrace × Yorkshire) commercial pigs thanks to its excellent performance on growth traits. In previous studies, several single nucleotide polymorphisms (SNPs) that were significantly associated with FCR were detected on SSC 12 in a Canadian Duroc population by genome-wide association study (GWAS) (Ding et al., 2017). However, due to the limited sample size (<400), we detected only a few significant SNPs for feeding behavior and feed efficiency traits. In particular, the cost to measure feed efficiency traits has historically been the primary limitation to population-wide selection to improve feed efficiency in pigs (Bai et al., 2017). Here, we perform a GWAS in a larger American Duroc population to identify genetic variants associated with feeding behavior and feed efficiency traits.
The experimental procedures used in this study met the guidelines of the Animal Care and Use Committee of the South China Agricultural University (SCAU) (Guangzhou, China). The Animal Care and Use Committee of the SCAU approved all the animal experiments described in this study.
During the period of 2013–2016, phenotypic data were collected for Duroc pigs (n = 1,008) from the Guangdong Wen’s Foodstuffs Group, Co., Ltd. (Guangdong, China) using the Osborne FIRE Pig Performance Testing System (Osborne, KS, United States) as previously described (Ding et al., 2017). Briefly, pigs were subjected to uniform feeding conditions for measurement of traits during the fattening period (approximately 11 weeks) from 30 to 100 kg live weight. Each animal was labeled a unique electric identification tag on its ear that could be captured by the automatic feeder. The time, duration, feed consumption, and BW of each individual were recorded at every visit to the feeder. Back fat (BF) of each animal was evaluated with a PIGLOG 105B ultrasound machine (SFK Technology, Søborg, Denmark) at the end of the test. The following feeding behavior and feed efficiency traits were defined and recorded for each pig: average DFI (kg/d), total daily time spent in feeder (TPD, min), number of daily visits to feeder (NVD), and FCR (Do et al., 2013a,b, 2014; Ding et al., 2017). RFI was computed using methods similar to those used by Cai et al. (2008). In the model, predicted DFI was estimated using linear regression of DFI on metabolic BW at mid-test (MWT), average daily gain from 30 to 100 kg (ADG), and BF. MWT was equal to [(BW at on-test + BW at off-test)/2]0.75. In summary, 1,008 pigs had phenotypic data for feeding behavior traits (DFI, TPD, and NVD), 981 for FCR and 971 for RFI.
Genotyping was performed as described by Ding et al. (2017). Briefly, genomic DNA was extracted from ear tissue samples using the phenol–chloroform method. Genotyping was performed using the Geneseek Porcine 50K SNP Chip (Neogen, Lincoln, NE, United States), which contains 50,703 SNPs across autosomes and sex chromosomes. Quality control of the SNP data was performed using PLINK software (Purcell et al., 2007). Animals with call rates > 0.95, and SNPs with call rates > 0.99, minor allele frequency > 0.01, and P-value > 10-6 for the Hardy–Weinberg equilibrium test were included. Only autosomal SNPs were considered for subsequent analyses.
GEMMA was used to perform GWAS with a univariate linear mixed model (Zhou and Stephens, 2012, 2014). Prior to GWAS, GEMMA was used to estimate the n × n standardized relatedness matrix (K) between the individuals. The following statistical model in matrix form was used: y = Wα + xβ + u + 𝜀, where y is the vector of phenotypic values for all pigs; W is the incidence matrices of covariates (fixed effects) including sex, pig pen, and year-season effects; α is the vector of corresponding coefficients including the intercept; x is the vector of marker genotypes, and β is the corresponding effect size of the marker; u is the vector of random effects, with u ∼ MVNn(0, λ τ-1K); 𝜀 is the vector of random residuals with 𝜀 ∼ MVNn(0, τ-1In); τ-1 is the variance of the residual errors; λ is the ratio between the two variance components; K is a known n × n relatedness matrix; and I is an n × n identity matrix. MVNn denotes the n-dimensional multivariate normal distribution.
Genome-wide significance was determined using the Bonferroni method by dividing the desired type I error level by the number of SNPs tested. To include additional candidate genes and enable gene set enrichment analysis, we also set a more lenient threshold by multiplying the Bonferroni threshold by a constant of 20 (Yang et al., 2005).
The GCTA tool was used to compute the genomic heritability by dividing the estimated genetic variance by the total variance measured, and phenotypic variances contributed by significant SNPs for each trait (Yang et al., 2010, 2011). Genetic correlation was estimated using GCTA in the bivariate mode.
A number of SNPs that were significantly associated with the target trait by GWAS were detected based on their strong linkage with highly causal mutants. To demarcate the independence of all significant signals in a putative region, conditional and LD analyses were performed in univariate linear mixed models by fitting the genotypes of peak SNPs as covariates (Yang et al., 2012). Moreover, to further detect candidate regions associated with feeding behavior and feed efficiency traits, PLINK (Purcell et al., 2007) and Haploview (Barrett et al., 2005) were utilized for haplotype block analysis. LD blocks were defined using the solid spin algorithm by the criteria of Gabriel et al. (2002).
All SNP location on the Sus scrofa 10.2 genome version were downloaded from Ensembl. The Ensembl annotation of the S. scrofa 10.2 genome version was employed to find genes that were nearest to the significant SNPs1. To annotate significant SNP located in previously mapped QTLs in pigs, all QTL data in pigs were downloaded from http://www.animalgenome.org/cgi-bin/QTLdb/SS/download?file=gbpSS_10.2 (accessed on December 18, 2017) (Hu et al., 2013). For functional annotation, Kyoto Encyclopedia of Genes and Genomes (KEGG) and Gene Ontology analyses were used for the identification of related pathways. KEGG and GO analyses were performed on KOBAS 3.0 (Xie et al., 2011). Fisher’s exact test was used to assess the significance of the enriched terms, and P < 0.05 was selected to explore the genes involved in biological processes (Xing et al., 2016; Wang et al., 2017).
We considered five feeding behavior and feed efficiency traits, including DFI, TPD, NVD, FCR, and RFI. Summary statistics for these traits, and their heritabilities are presented in Table 1. All phenotypic data conformed to the Gaussian distribution based on the Shapiro test before GWAS analysis (Theune, 1973). There existed substantial phenotypic variation, with coefficient of variation (CV) ranging from 10 to 27% for the five traits (Table 1).
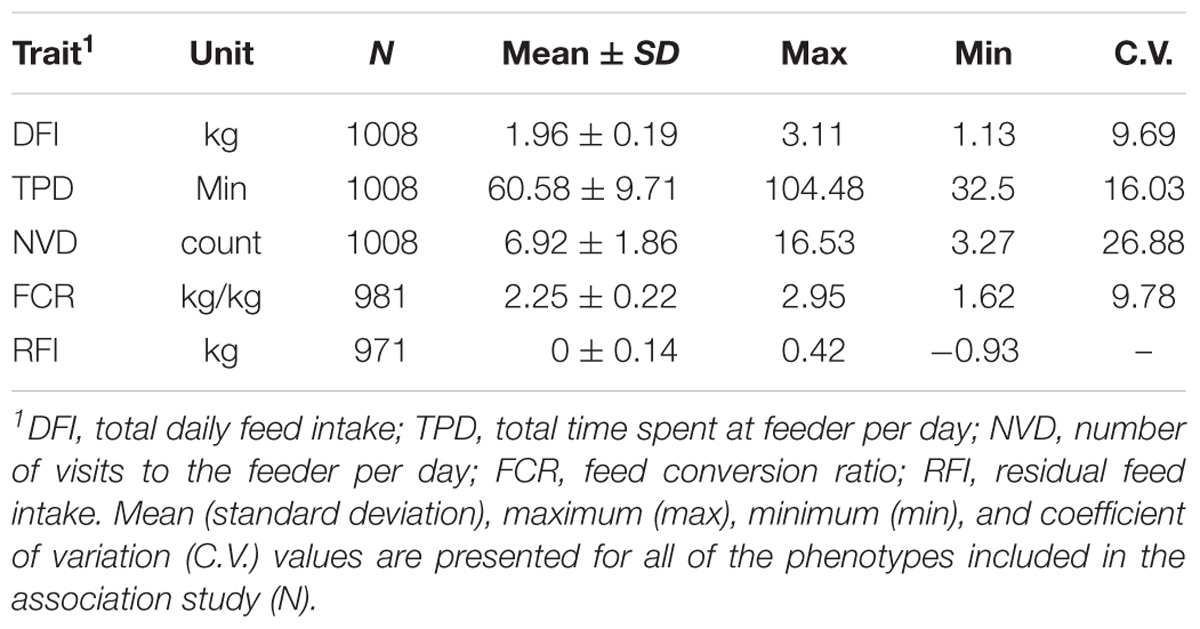
TABLE 1. Summary statistics of feeding behavior and feed efficiency in a Duroc population.
We partitioned the phenotypic variance into genetic and environmental components using genetic relationship matrix computed from genotypes. The genomic heritabilities of the traits are moderate, ranging from 0.28 (DFI) to 0.38 (NVD) (Table 2). Bivariate analysis indicated that the traits are positively correlated with each other, both phenotypically and genetically, except between DFI and NVD. In particular, DFI are strongly positively correlated with FCR and RFI with a genetic correlation of 0.75 and 0.98, respectively (Table 2).
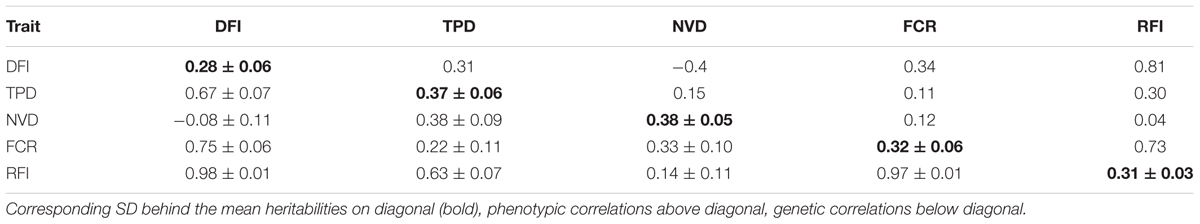
TABLE 2. Heritability, genetic and phenotypic correlations for feeding behavior and feed efficiency traits.
To understand the genetic architecture of the feeding behavior and feed efficiency traits, we performed GWAS for each trait. After a series of filtering steps for quality control, 32,446 SNPs and 1,008 pigs were available for subsequent GWAS. The number of SNPs on each chromosome and the average distances between pairs of SNPs after QC are provided in Supplementary Table S1. The average physical distance between two neighboring SNPs on the same chromosome was approximately 75.3 kb and ranged from 64.5 (SSC11) to 112.3 kb (SSC1).
Single marker tests using mixed model were performed to identify genetic markers associated with the traits. At a stringent genome-wide Bonferroni threshold P < 1.54E-06 (0.05/32,446), 9 SNPs on SSC1 were associated with RFI. At a more lenient threshold (P < 3.08E-05) for suggestive associations, 8 SNPs were associated with DFI, 15 with FCR, 5 with NVD, 2 with TPD, and 14 with RFI (Figure 1 and Table 2). QQ plots of P-values and the computed genomic inflation factors (λ) indicated no evidence of population stratification (Pearson and Manolio, 2008; Utsunomiya et al., 2013) (Supplementary Figure S1).
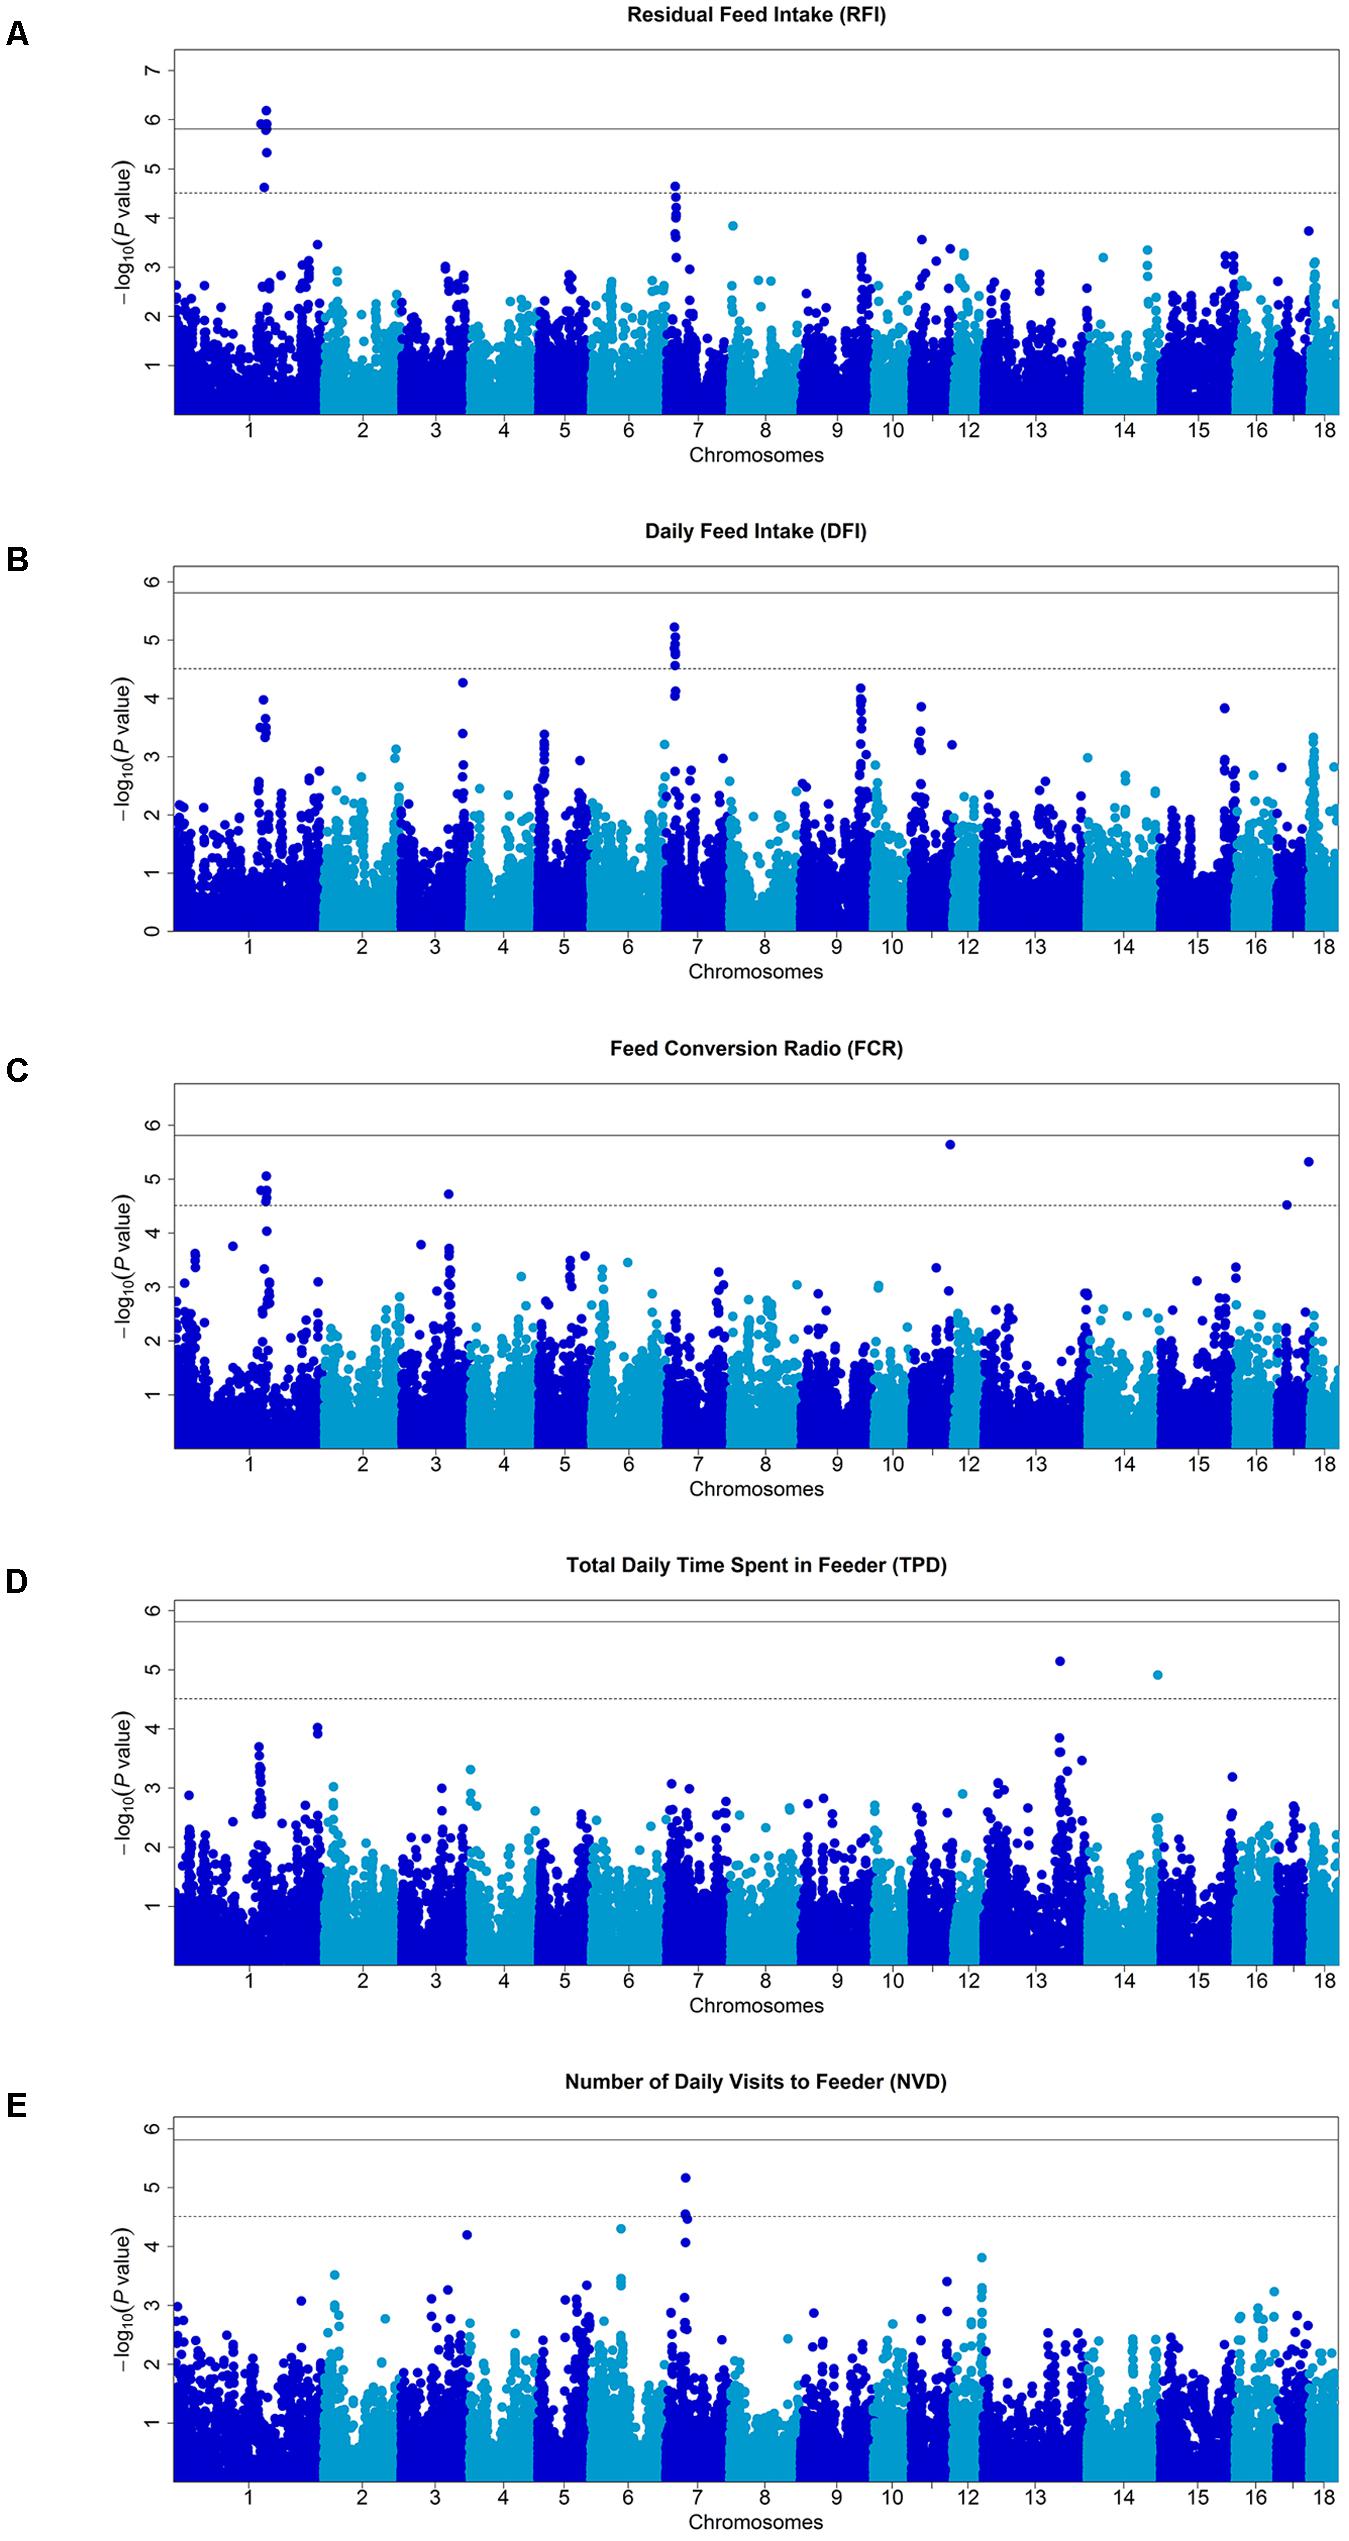
FIGURE 1. Manhattan plots of genome-wide association studies for feeding behavior and feed efficiency in male Duroc pigs. In the Manhattan plots, negative log10 P-values of the quantified SNPs were plotted against their genomic positions. Different colors indicate various chromosomes. The solid and dashed lines indicate the 5% genome-wide and chromosome-wide Bonferroni-corrected thresholds, respectively. On the vertical axis, Manhattan plot for (A) residual feed intake (RFI), (B) total daily feed intake (DFI), (C) feed conversion ratio (FCR), (D) total daily time spent in feeder (TBD), and (E) number of visits to feeder (NVD), respectively.
Multiple SNPs in close proximity were found to be associated with the same traits, possibly due to their linkage and/or linkage disequilibrium. Indeed, LD block analysis showed that the multiple significant SNPs on SSC1 associated with RFI were located within a haplotype block that spanned 2,169 kb (Figure 4). To test whether LD caused the associations, we performed conditional analyses with DFI and RFI in which the lead SNP WU_10.2_7_18377044 on SSC7 was fitted in the model as a covariate and the conditional P-values for other SNPs in the vicinity were obtained. While many SNPs in high LD with the lead SNP were significant in the GWAS for DFI (Figure 2A), their significance almost diminished completely after the lead SNP was included as a fixed effect in the model (Figure 2B). The same pattern was also observed for the same lead SNP for RFI (Figures 2C,D). This is not surprising because the two DFI and RFI were almost perfectly (r = 0.98) correlated genetically (Table 2).
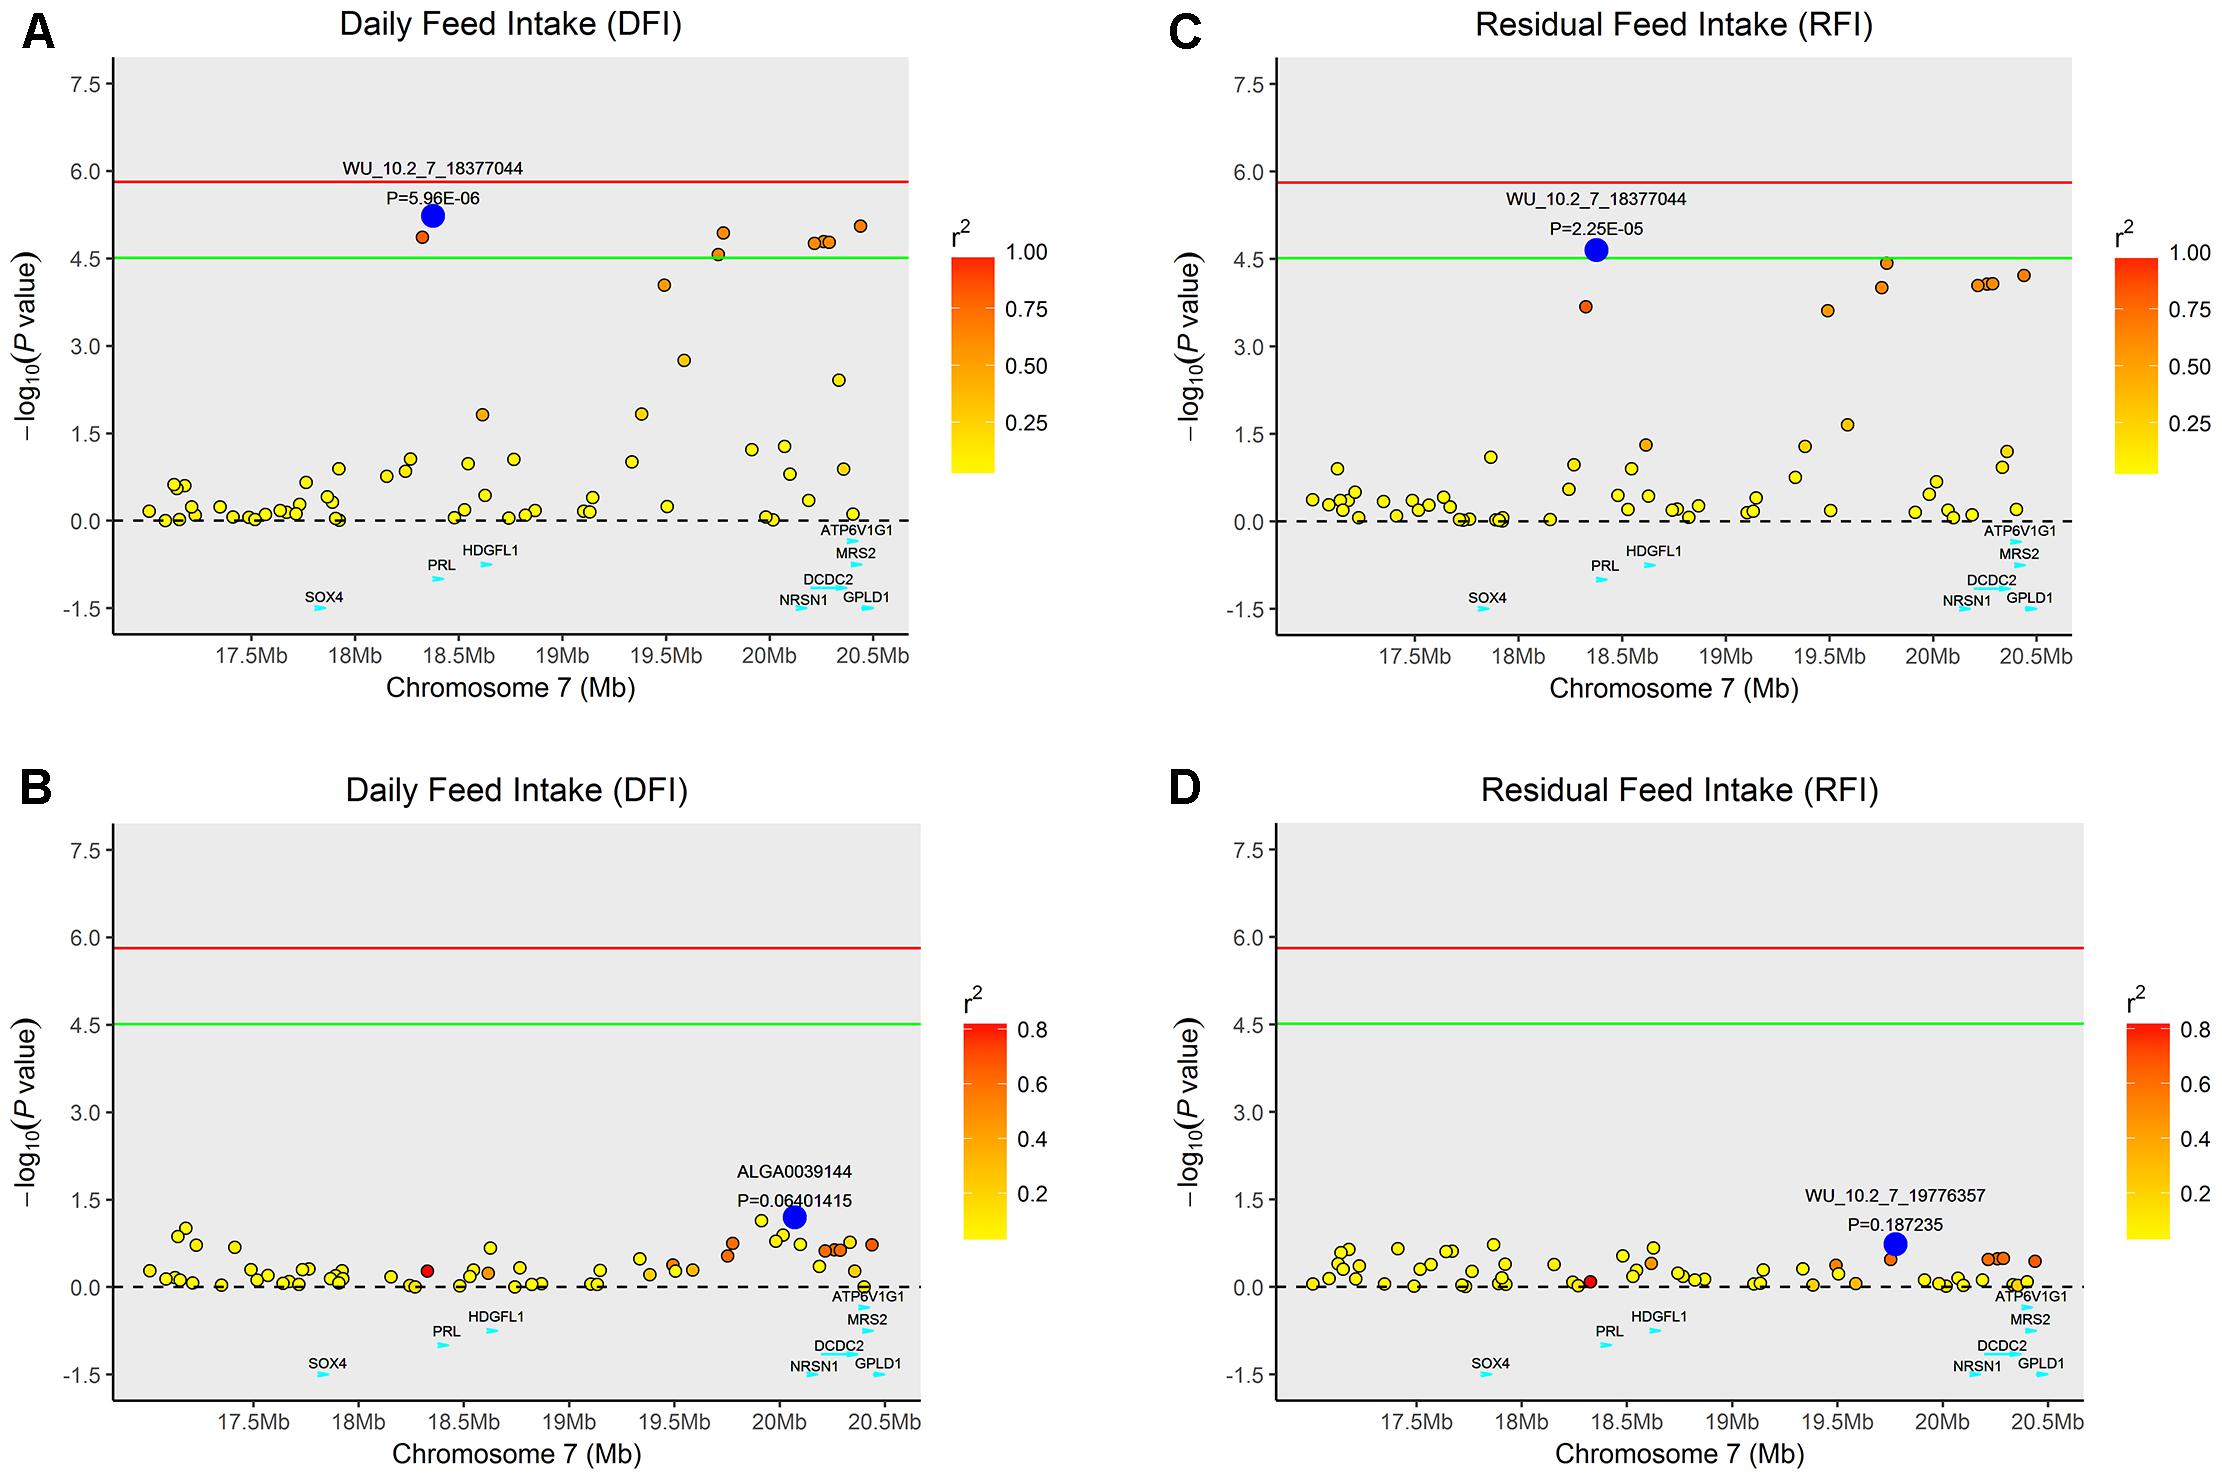
FIGURE 2. Regional association plot of the primary signal (WU_10.2_7_18377044) associated with DFI and RFI at SSC7. For each plot, negative log10 P-values of SNPs (y-axis) are presented according to their chromosomal positions (x-axis). The red line and green line indicate the genome-wide significance level (P < 1.54E-06) and the suggestive level (P < 3.08E-05), respectively. The primary SNP are denoted by large blue circles. SNPs are represented by colored circles according to the target SNP with which they were in strongest LD. The left panel of the figure shows the association results for DFI (A) before and (B) after conditional analysis on WU_10.2_7_18377044. The right panel of the figure shows the association results for RFI (C) before and (D) after conditional analysis on WU_10.2_7_18377044. The P-value of association results for (B) DFI and (D) RFI after conditional analysis on WU_10.2_7_18377044 fell below the predicted threshold.
Similarly, the lead SNP DRGA0001676 significantly associated with RFI and FCR in SSC1 explained the association between multiple SNPs with the traits in the vicinity of DRGA0001676 (Figure 3).
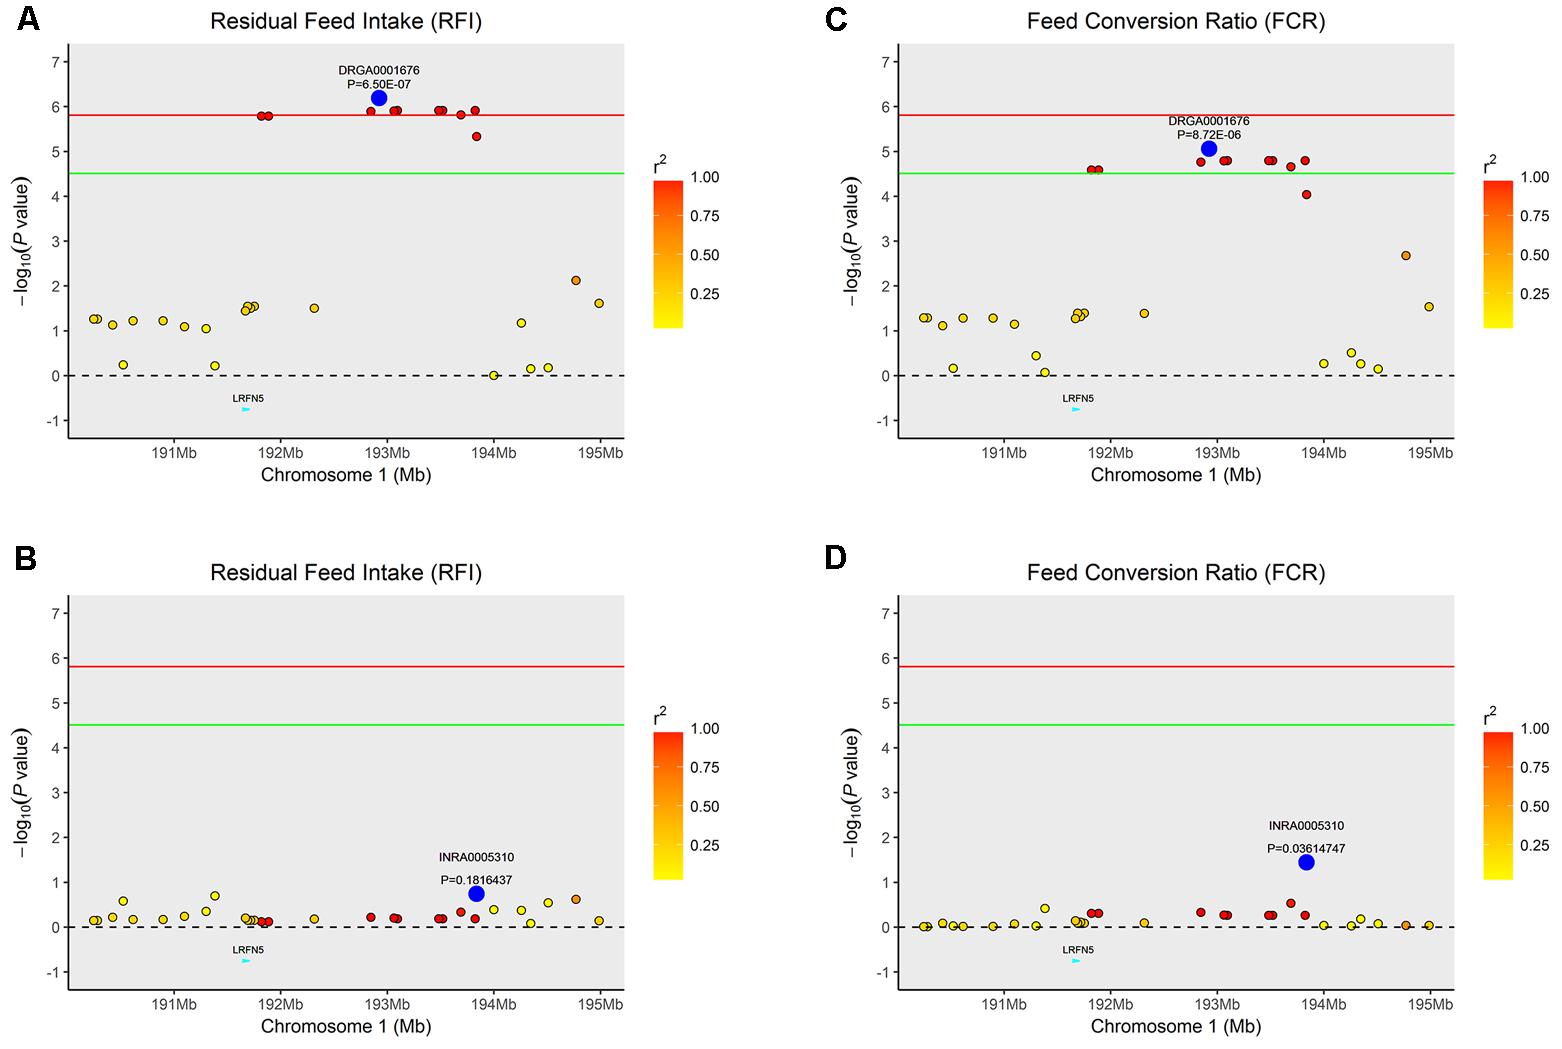
FIGURE 3. Regional association plot of the primary signal (DRGA0001676) associated with FCR and RFI at SSC1. For each plot, negative log10 P-values of SNPs (y-axis) are presented according to their chromosomal positions (x-axis). The red line and green line indicate the genome-wide significance level (P < 1.54E-06) and the suggestive level (P < 3.08E-05), respectively. The primary SNP are denoted by large blue circles. SNPs are represented by colored circles according to the target SNP with which they were in strongest LD. The left panel of the figure shows the association results for FCR (A) before and (B) after conditional analysis on DRGA0001676. The right panel of the figure shows the association results for RFI (C) before and (D) after conditional analysis on DRGA0001676. The P-value of association results for (B) FCR and (D) RFI after conditional analysis on DRGA0001676 fell below the predicted threshold.
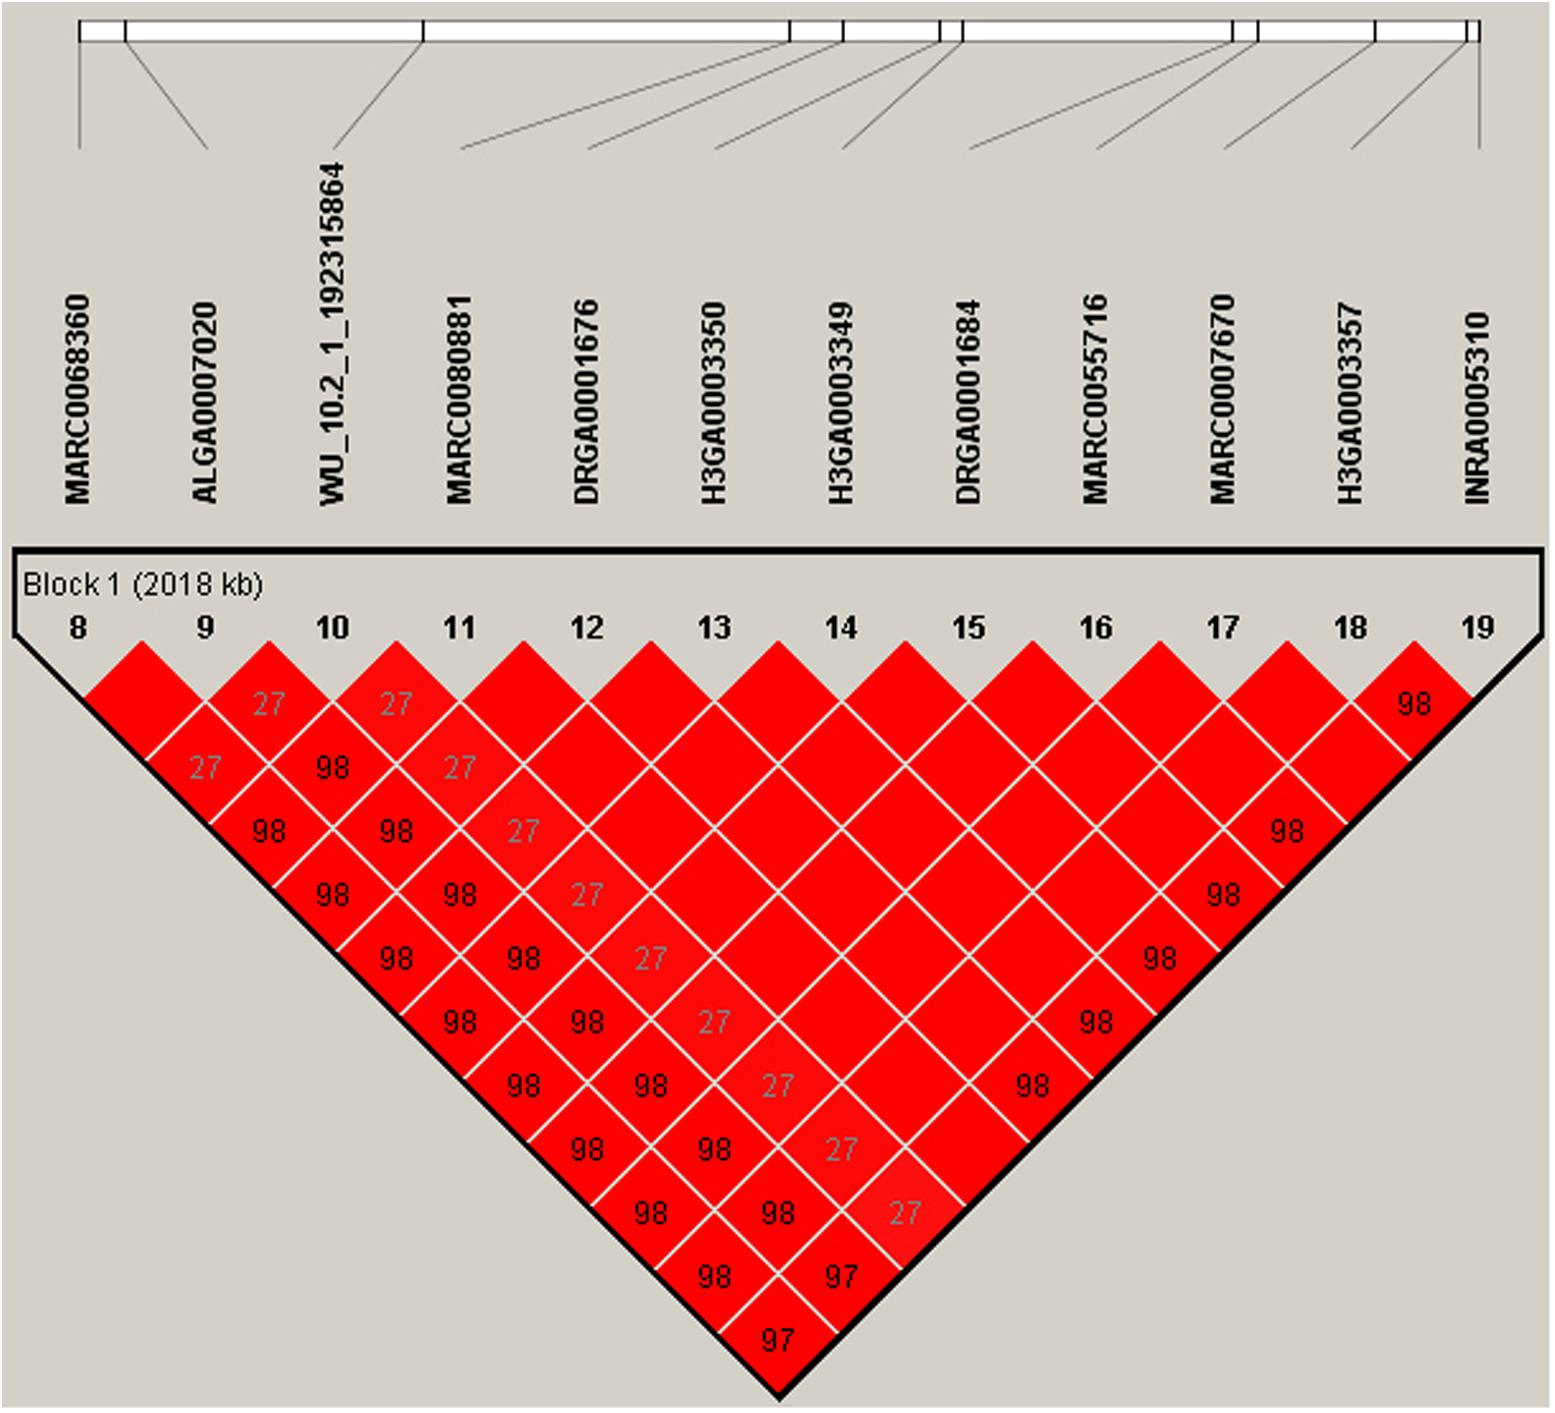
FIGURE 4. The LD block in the significantly associated region on SSC1. LD blocks are marked with triangles. Values in boxes are LD (r2) between SNP pairs and the boxes are colored according to the standard Haploview color scheme: LOD > 2 and D′ = 1, red; LOD > 2 and D′ < 1, shades of pink/red; LOD < 2 and D′ = 1, blue; LOD < 2 and D′ < 1, white (LOD is the log of the likelihood odds ratio, a measure of confidence in the value of D′). Annotated genes in the chromosomal region retrieved from the Ensemble genome browser (www.ensembl.org/Sus_scrofa/Info/Index).
To evaluate whether SNPs associated with the feeding behavior and feed efficiency trait in this study replicate any previously known QTLs, we search the pigQTLdb based on SNP and QTL locations. A total of 13 SNPs associated with FCR and/or RFI were identified within the genomic regions where QTLs for DFI have been previously mapped in pigs (Table 3). Eight SNPs associated with DFI and RFI were located on previously reported QTL regions for time spent drinking. One SNP on SSC13 associated with TPD was located on previously reported QTL regions for FCR in pigs. Moreover, 10 SNPs were located in the genomic regions where QTLs were previously detected by GWAS or linkage mapping for average daily gain and growth-related traits in pigs. Given the high genetic correlations (Table 2), overlaps were considered with QTLs for correlated traits as evidence for replication.
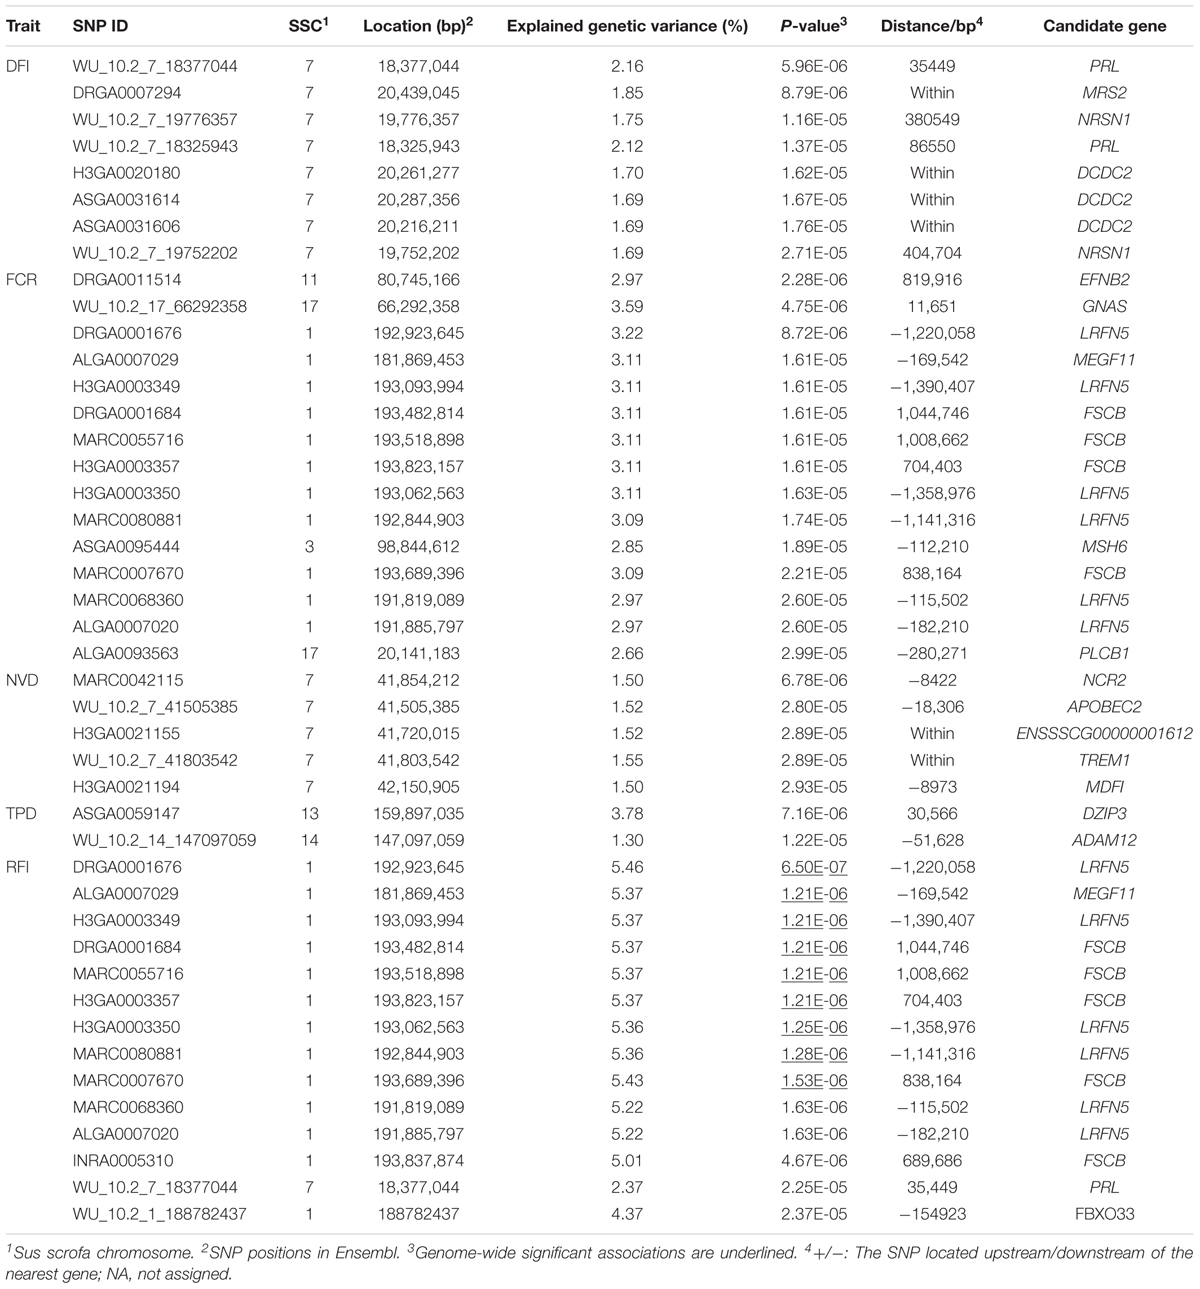
TABLE 3. Tag SNPs and Candidate genes for feeding behavior and feed efficiency traits.
A total of 16 functional genes that were within or near the identified tag SNPs were detected based on annotations of the Sus scrofa 10.2 genome assembly (Table 2). Many candidate genes appear to have biochemical and physiological roles that were are relevant to feeding behavior and feed efficiency traits, including neurensin 1 (NRSN1) and doublecortin domain-containing 2 (DCDC2) for DFI; ADAM metallopeptidase domain 12 (ADAM12) for TPD; phospholipase C beta 1 (PLCB1), GNAS complex locus (GNAS), and ephrin B2 (EFNB2) for FCR; prolactin (PRL) for both FCR and RFI; leucine-rich repeat and fibronectin type III domain-containing 5 (LRFN5), and multiple EGF-like domains 11 (MEGF11) for RFI and FCR.
To uncover genes and pathways involved in the biology of feed efficiency and feeding behavior traits, we performed gene set enrichment analysis of the 16 candidate genes for all five traits. Interestingly, at an FDR = 0.05, several KEGG pathways and GO terms are significantly enriched for the candidate genes, including pathways related to hormone metabolic process, secretion of digestive enzymes, among others (Supplementary Table S2).
In this study, we performed a GWAS for five feeding behavior and feed efficiency traits. We identified a number of genetic markers and genes associated with the traits. Gene set enrichment analysis revealed pathways that appear to be consistent with the underlying biology of the traits. This represents a first step toward understanding the genetic basis of feeding behaviors and feed efficiency and developing informative genetic markers for efficient breeding programs.
Despite similar design and analytical methods, none of the QTLs identified in this study replicated QTLs in a previous study (Ding et al., 2017). There could be a number of reasons. First, this study has a substantially larger sample size (1,008 vs. 338). Second, while both studies used Duroc pigs, the genetic backgrounds have subtle differences. For example, Duroc boars in the previous study (Ding et al., 2017) was of Canadian origin while pigs in the present study were of American origin. It is well-established that genetic backgrounds can have substantial influence on single marker associations. Moreover, this study detected QTLs that overlapped previously identified QTLs (Table 4). Indeed, over 87% of SNPs (28/32) significantly associated with feeding behavior and feed efficiency traits were located within genomic regions where QTLs for feeding behavior and feed efficiency were previously reported in pigs (pigQTLdb2).

TABLE 4. Comparative mapping of tag SNPs with previous QTLs reported in the pig QTL database (as of December 18, 2017) and previous GWAS results.
Derivative traits are correlated with each other. For example, RFI and DFI has a highly correlated at 0.81 phenotypically and 0.98 genetically. Indeed, GWAS signals overlapped to some extent for these two traits (Figures 1A,B). Signals are detected for both traits on SSC7. And while the strengths of associations differ and may not reach thresholds for both traits, SNPs associated with RFI on SSC1 also tended to have an effect for DFI (Figures 1A,B). However, because of the less than unity correlations, in particular the correlation at the phenotypic level which were used for GWAS mapping, full overlap is not expected.
Because of the low to moderate heritabilities of these traits, informative markers are particularly useful in selection programs. Our analyses indicated that the markers WU_10.2_7_18377044 and DRGA0001676 were two important polymorphisms with pleiotropic effects. SNP WU_10.2_7_18377044 on SSC7 explained 2.16 and 2.37% of the observed phenotypic variance for DFI and RFI, respectively. Another SNP DRGA0001676 on SSC1 explained 3.22 and 5.46% of the observed phenotypic variance for FCR and RFI, respectively. Although causal variants remain to be identified, given the substantial phenotypic variance explained, these SNPs could potentially serve as genetic markers in breeding programs.
Feeding is one of the most conserved activities of animals, and regulating feed intake is a fundamental process for animal survival (Bader et al., 2007). Physiological modulation is often accomplished through the regulation of the nervous system (Destexhe and Marder, 2004). In mammals, the hypothalamus controls appetite and satiety by integrating neuropeptides or hormonal signals (Berthoud, 2002; Leibowitz and Wortley, 2004; Fang et al., 2011). Our GWAS implicated several genes that have roles in neural development. The gene NRSN1 associated with DFI plays an important role in neural organelle transport and in the transduction of nerve signals or in nerve growth (Yu and Kaang, 2016; Lencer et al., 2017). Three significant SNPs located within the DCDC2 gene are associated with DFI. DCDC2 is involved in the conduction of neural signals and the development of neurons (Meng et al., 2005). Takasu et al. (2002) reported that EFNB2 protein, which is associated with FCR, is localized at excitatory synapses, regulating the development and remodeling of neural signals. MEGF11, another gene associated with FCR, is highly expressed in the central nervous system, whose homology MEGF10 in Drosophila plays an important role in maintaining the normal functioning of the brain (Draper et al., 2014). Finally, LRFN5, also a FCR associated gene, is a key neurodevelopmental gene that is associated with developmental delay (Mikhail et al., 2011).
Daily feed intake is a major concern of breeders because it is highly correlated with growth rate and feed efficiency (Do et al., 2013a). The most significant locus associated with DFI and RFI on SSC 7, WU_10.2_7_18377044, is close to the PRL gene, which encodes the anterior pituitary hormone prolactin. The secreted hormone is a growth regulator for many tissues (McAtee and Trenkle, 1971; Kennaway et al., 1982). Yayou et al. (2011) reported that administration of prolactin-releasing peptide in the central nervous system will result in reduced feed intake and abnormal feeding behavior in steers. In goats, prolactin has also been found to affect feed intake (Sergent et al., 1988).
Growth rate and feed intake were major influencing factors of FCR. Among the candidate genes identified by GWAS, PLCB1 is a protein-coding gene near the SNP ALGA0093563. Meng et al. (2017) reported that this gene is significantly associated with ADG in a Yorkshire pig and may be involved in pig growth and development. The GNAS gene is near SNP WU_10.2_17_66292358. The imprinted GNAS is involved in obesity, energy metabolism, feeding behavior, and viability. Eaton et al. (2012) reported that mutations in this gene can lead to pre-weaning growth retardation and incomplete catch-up growth in mice.
Feeding time is an important feeding behavior trait that directly affects the growth rate and efficiency. ADAM metallopeptidase domain 12 (ADAM12) is located proximal to the SNP WU_10.2_14_14709705, which is associated with TPD. ADAM12 had been identified as a protease to insulin-like growth factor (IGF)-binding proteins. This gene may have a regulatory function in controlling the amount of free bioactive IGF (Cowans and Spencer, 2007). In chickens, insulin has been consistently shown to affect feed intake and feed behavior (Shiraishi et al., 2008, 2011).
Functional annotation revealed a number of pathways and biological processes that are significantly overrepresented among the 16 positional candidate genes for feeding behavior and feed efficiency traits (Supplementary Table S2). Most of the significantly enriched pathways are associated with hormonal and digestive gland secretion during feeding such as thyroid hormone and gastric acid secretion. Given the principal roles of hormone and digestive gland secretion in feeding and metabolism, their involvement in the feeding behavior and feed efficiency traits are conceivable.
Several GWAS for feeding behavior and feed efficiency traits in Duroc populations with different genetic backgrounds have been reported (Do et al., 2013a,b; Ding et al., 2017; Quan et al., 2017). We previously found, by GO enrichment analysis, that most of the potential candidate genes were involved in the development of the hypothalamus (Ding et al., 2017). This agrees with our findings that feeding behavior is mainly controlled by the central nervous system. Results in the present study further extend to suggest that the hormonal and digestive glands are also involved. However, functional studies remain to be performed to delineate the mechanisms of how the constellations of genes implicated by the GWAS affect feeding.
ZW, JY, and WH: conceived and designed the experiments. RD, MY, XW, JQ, ZZ, SZ, and SL: performed the experiments. RD, JY, and WH: analyzed the data and wrote manuscript. MY, ZX, EZ, GC, and DL: collected the samples and recorded the phenotypes. ZW: contributed materials. All authors reviewed and approved the manuscript.
This study was supported by the Science and Technology Planning Project of Guangdong Province (Grant Nos. 2015B020231010 and 2017B020201012), the Guangdong Sail Plan Introduction of Innovative and Entrepreneurship Research Team Program (Grant No. 2016YT03H062), the National Natural Science Foundation of China (Grant No. 31601912), and the Natural Science Foundation of Guangdong Province (Grant Nos. 2016A030310447 and 2017A030313213) supported this study.
The authors have read the journal’s policy and declare the following conflicts of interest: Wens Foodstuffs Group, Co., Ltd. provided all phenotypic data and ear tissue samples for the research reported in this study. This does not alter our adherence to Frontiers in Genetics policies on sharing data and materials.
The Supplementary Material for this article can be found online at: https://www.frontiersin.org/articles/10.3389/fgene.2018.00220/full#supplementary-material
FIGURE S1 | Quantile–quantile (Q–Q) plots of genome-wide association studies for feeding behavior and feed efficiency in male Duroc pigs. Q–Q plots show the observed versus expected negative log10 P-values. On the vertical axis, Q–Q plot for (A) residual feed intake (RFI), (B) total daily feed intake (DFI), (C) feed conversion ratio (FCR), (D) total daily time spent in feeder (TBD), and (E) number of visits to feeder (NVD), respectively.
TABLE S1 | Distributions of SNPs after QC and the average distance between adjacent SNPs on each chromosome.
TABLE S2 | Significant KEGG PATHWAY and GO terms with feeding behavior and feed efficiency traits (P-value < 0.05).
Andersson, L. (2009). Genome-wide association analysis in domestic animals: a powerful approach for genetic dissection of trait loci. Genetica 136, 341–349. doi: 10.1007/s10709-008-9312-4
Bader, R., Colomb, J., Pankratz, B., Schrock, A., Stocker, R. F., and Pankratz, M. J. (2007). Genetic dissection of neural circuit anatomy underlying feeding behavior in Drosophila: distinct classes of hugin-expressing neurons. J. Comp. Neurol. 502, 848–856. doi: 10.1002/cne.21342
Bai, C., Pan, Y., Wang, D., Cai, F., Yan, S., Zhao, Z., et al. (2017). Genome-wide association analysis of residual feed intake in Junmu No. 1 White pigs. Anim. Genet. 48, 686–690. doi: 10.1111/age.12609
Barrett, J. C., Fry, B., Maller, J., and Daly, M. J. (2005). Haploview: analysis and visualization of LD and haplotype maps. Bioinformatics 21, 263–265. doi: 10.1093/bioinformatics/bth457
Bartos, P., Dolan, A., Smutny, L., Sistkova, M., Celjak, I., Soch, M., et al. (2016). Effects of phytogenic feed additives on growth performance and on ammonia and greenhouse gases emissions in growing-finishing pigs. Anim. Feed Sci. Technol. 212, 143–148. doi: 10.1016/j.anifeedsci.2015.11.003
Berthoud, H. R. (2002). Multiple neural systems controlling food intake and body weight. Neurosci. Biobehav. Rev. 26, 393–428. doi: 10.1016/S0149-7634(02)00014-3
Cai, W., Casey, D. S., and Dekkers, J. C. M. (2008). Selection response and genetic parameters for residual feed intake in Yorkshire swine. J. Anim. Sci. 86, 287–298. doi: 10.2527/jas.2007-0396
Cowans, N. J., and Spencer, K. (2007). First-trimester ADAM12 and PAPP-A as markers for intrauterine fetal growth restriction through their roles in the insulin-like growth factor system. Prenat. Diagn. 27, 264–271. doi: 10.1002/pd.1665
Destexhe, A., and Marder, E. (2004). Plasticity in single neuron and circuit computations. Nature 431, 789–795. doi: 10.1038/nature03011
Ding, R. R., Quan, J. P., Yang, M., Wang, X. W., Zheng, E. Q., Yang, H. Q., et al. (2017). Genome-wide association analysis reveals genetic loci and candidate genes for feeding behavior and eating efficiency in Duroc boars. PLoS One 12:e0183244. doi: 10.1371/journal.pone.0183244
Do, D. N., Ostersen, T., Strathe, A. B., Mark, T., Jensen, J., and Kadarmideen, H. N. (2014). Genome-wide association and systems genetic analyses of residual feed intake, daily feed consumption, backfat and weight gain in pigs. BMC Genet. 15:27. doi: 10.1186/1471-2156-15-27
Do, D. N., Strathe, A. B., Jensen, J., Mark, T., and Kadarmideen, H. N. (2013a). Genetic parameters for different measures of feed efficiency and related traits in boars of three pig breeds. J. Anim. Sci. 91, 4069–4079. doi: 10.2527/jas.2012-6197
Do, D. N., Strathe, A. B., Ostersen, T., Jensen, J., Mark, T., and Kadarmideen, H. N. (2013b). Genome-wide association study reveals genetic architecture of eating behavior in pigs and its implications for humans obesity by comparative mapping. PLoS One 8:e71509. doi: 10.1371/journal.pone.0071509
Draper, I., Mahoney, L. J., Mitsuhashi, S., Pacak, C. A., Salomon, R. N., and Kang, P. B. (2014). Silencing of drpr leads to muscle and brain degeneration in adult Drosophila. Am. J. Pathol. 184, 2653–2661. doi: 10.1016/j.ajpath.2014.06.018
Eaton, S. A., Williamson, C. M., Ball, S. T., Beechey, C. V., Moir, L., Edwards, J., et al. (2012). New mutations at the imprinted Gnas cluster show gene dosage effects of Gsα in postnatal growth and implicate XLαs in bone and fat metabolism but not in suckling. Mol. Cell. Biol. 32, 1017–1029. doi: 10.1128/MCB.06174-11
Fan, B., Lkhagvadorj, S., Cai, W., Young, J., Smith, R. M., Dekkers, J. C. M., et al. (2010). Identification of genetic markers associated with residual feed intake and meat quality traits in the pig. Meat Sci. 84, 645–650. doi: 10.1016/j.meatsci.2009.10.025
Fang, P. H., Yu, M., Ma, Y. P., Li, J., Sui, Y. M., and Shi, M. Y. (2011). Central nervous system regulation of food intake and energy expenditure: role of galanin-mediated feeding behavior. Neurosci. Bull. 27, 407–412. doi: 10.1007/s12264-011-1841-7
Gabriel, S. B., Schaffner, S. F., Nguyen, H., Moore, J. M., Roy, J., Blumenstiel, B., et al. (2002). The structure of haplotype blocks in the human genome. Science 296, 2225–2229. doi: 10.1126/science.1069424
Guo, Y., Gu, X. R., Sheng, Z. Y., Wang, Y. Q., Luo, C. L., Liu, R. R., et al. (2016). A complex structural variation on chromosome 27 leads to the ectopic expression of HOXB8 and the muffs and beard phenotype in chickens. PLoS Genet. 12:e1006071. doi: 10.1371/journal.pgen.1006071
Hoque, A., and Suzuki, K. (2008). Genetic parameters for production traits and measures of residual feed intake in Duroc and Landrace pigs. Anim. Sci. J. 79, 543–549. doi: 10.2527/jas.2012-6197
Hoque, M. A., Kadowaki, H., Shibata, T., Oikawa, T., and Suzuki, K. (2009). Genetic parameters for measures of residual feed intake and growth traits in seven generations of Duroc pigs. Livest. Sci. 121, 45–49. doi: 10.1016/j.livsci.2008.05.016
Hu, Z. L., Park, C. A., Wu, X. L., and Reecy, J. M. (2013). Animal QTLdb: an improved database tool for livestock animal QTL/association data dissemination in the post-genome era. Nucleic Acids Res. 41, D871–D879. doi: 10.1093/nar/gks1150
Iwaisaki, H. (1989). Distributional and Genetic Properties of Selection for Ratio Indexes. Ph.D. thesis, University of Guelph, Guelph.
Kennaway, D., Gilmore, T., and Seamark, R. (1982). Effect of melatonin feeding on serum prolactin and gonadotropin levels and the onset of seasonal estrous cyclicity in sheep. Endocrinology 110, 1766–1772. doi: 10.1210/endo-110-5-1766
Koch, R. M., Swiger, L. A., Chambers, D., and Gregory, K. E. (1963). Efficiency of feed use in beef cattle. J. Anim. Sci. 22, 486–494. doi: 10.2527/jas1963.222486x
Leibowitz, S. F., and Wortley, K. E. (2004). Hypothalamic control of energy balance: different peptides, different functions. Peptides 25, 473–504. doi: 10.1016/j.peptides.2004.02.006
Lencer, R., Mills, L. J., Alliey-Rodriguez, N., Reilly, J. L., Sprenger, A., McDowell, J. E., et al. (2017). Extended association studies of smooth pursuit and antisaccade eye movements: findings from the B-snip study. Schizophr. Bull. 43, S10–S11. doi: 10.1038/tp.2017.210
Lu, D., Jiao, S., Tiezzi, F., Knauer, M., Huang, Y., Gray, K. A., et al. (2017). The relationship between different measures of feed efficiency and feeding behavior traits in Duroc pigs. J. Anim. Sci. 95, 3370–3380. doi: 10.2527/jas.2017.1509
Ma, J. W., Yang, J., Zhou, L. S., Ren, J., Liu, X. X., Zhang, H., et al. (2014). A splice mutation in the PHKG1 gene causes high glycogen content and low meat quality in pig skeletal muscle. PLoS Genet. 10:e1004710. doi: 10.1371/journal.pgen.1004710
McAtee, J. W., and Trenkle, A. (1971). Effects of feeding, fasting, glucose or arginine on plasma prolactin levels in the bovine. Endocrinology 89, 730–734. doi: 10.1210/endo-89-3-730
McCarthy, M. I., Abecasis, G. R., Cardon, L. R., Goldstein, D. B., Little, J., Ioannidis, J. P. A., et al. (2008). Genome-wide association studies for complex traits: consensus, uncertainty and challenges. Nat. Rev. Genet. 9, 356–369. doi: 10.1038/nrg2344
Meng, H. Y., Smith, S. D., Hager, K., Held, M., Liu, J., Olson, R. K., et al. (2005). DCDC2 is associated with reading disability and modulates neuronal development in the brain. Proc. Natl. Acad. Sci. U.S.A. 102, 17053–17058. doi: 10.1073/pnas.0508591102
Meng, Q. L., Wang, K. J., Liu, X. L., Zhou, H. S., Xu, L., Wang, Z. J., et al. (2017). Identification of growth trait related genes in a Yorkshire purebred pig population by genome-wide association studies. Asian Aust. J. Anim. Sci. 30, 462–469. doi: 10.5713/ajas.16.0548
Mikhail, F. M., Lose, E. J., Robin, N. H., Descartes, M. D., Rutledge, K. D., Rutledge, S. L., et al. (2011). Clinically relevant single gene or intragenic deletions encompassing critical neurodevelopmental genes in patients with developmental delay, mental retardation, and/or autism spectrum disorders. Am. J. Med. Genet. A 155, 2386–2396. doi: 10.1002/ajmg.a.34177
O’Shea, C. J., Sweeney, T., Bahar, B., Ryan, M. T., Thornton, K., and O’Doherty, J. V. (2012). Indices of gastrointestinal fermentation and manure emissions of growing-finishing pigs as influenced through singular or combined consumption of Lactobacillus plantarum and inulin. J. Anim. Sci. 90, 3848–3857. doi: 10.2527/jas.2011-4461
Pearson, T. A., and Manolio, T. A. (2008). How to interpret a genome-wide association study. JAMA 299, 1335–1344. doi: 10.1001/jama.299.11.1335
Purcell, S., Neale, B., Todd-Brown, K., Thomas, L., Ferreira, M. A., Bender, D., et al. (2007). PLINK: a tool set for whole-genome association and population-based linkage analyses. Am. J. Hum. Genet. 81, 559–575. doi: 10.1086/519795
Quan, J., Ding, R., Wang, X., Yang, M., Yang, Y., Zheng, E., et al. (2017). Genome-wide association study reveals genetic loci and candidate genes for average daily gain in Duroc pigs. Asian Aust. J. Anim. Sci. 31, 480–488. doi: 10.5713/ajas.17.0356
Sergent, D., Berbigier, P., and Ravault, J. (1988). Effect of prolactin inhibition on thermophysiological parameters, water and feed intake of sun-exposed male Creole goats (Capra hircus) in Guadeloupe (French West Indies). J. Therm. Biol. 13, 53–59. doi: 10.1016/0306-4565(88)90012-5
Shiraishi, J., Tanizawa, H., Fujita, M., Kawakami, S., and Bungo, T. (2011). Localization of hypothalamic insulin receptor in neonatal chicks: evidence for insulinergic system control of feeding behavior. Neurosci. Lett. 491, 177–180. doi: 10.1016/j.neulet.2011.01.031
Shiraishi, J. I., Yanagita, K., Fujita, M., and Bungo, T. (2008). Central insulin suppresses feeding behavior via melanocortins in chicks. Domest. Anim. Endocrinol. 34, 223–228. doi: 10.1016/j.domaniend.2007.05.002
Smith, W., Ellis, M., Chadwick, J., and Laird, R. (1991). The influence of index selection for improved growth and carcass characteristics on appetite in a population of Large White pigs. Anim. Sci. 52, 193–199. doi: 10.1017/S0003356100005833
Tabor, H. K., Risch, N. J., and Myers, R. M. (2002). Candidate-gene approaches for studying complex genetic traits: practical considerations. Nat. Rev. Genet. 3, 391–397. doi: 10.1038/nrg796
Takasu, M. A., Dalva, M. B., Zigmond, R. E., and Greenberg, M. E. (2002). Modulation of NMDA receptor-dependent calcium influx and gene expression through EphB receptors. Science 295, 491–495. doi: 10.1126/science.1065983
Theune, J. (1973). Comparison of power for the D’Agostino and the Wilk-Shapiro test of normality for small and moderate samples. Stat. Neerl. 27, 163–168. doi: 10.1111/j.1467-9574.1973.tb00223.x
Utsunomiya, Y. T., do Carmo, A. S., Carvalheiro, R., Neves, H. H. R., Matos, M. C., Zavarez, L. B., et al. (2013). Genome-wide association study for birth weight in Nellore cattle points to previously described orthologous genes affecting human and bovine height. BMC Genet. 14:52. doi: 10.1186/1471-2156-14-52
Wang, K. J., Liu, D. W., Hernandez-Sanchez, J., Chen, J., Liu, C. K., Wu, Z. F., et al. (2015). Genome wide association analysis reveals new production trait genes in a male Duroc population. PLoS One 10:e0139207. doi: 10.1371/journal.pone.0139207
Wang, Y., Ding, X. D., Tan, Z., Ning, C., Xing, K., Yang, T., et al. (2017). Genome-wide association study of piglet uniformity and farrowing interval. Front. Genet. 8:194. doi: 10.3389/fgene.2017.00194
Webb, A., and King, J. (1983). Selection for improved food conversion ratio on ad libitum group feeding in pigs. Anim. Sci. 37, 375–385. doi: 10.1017/S0003356100001987
Xie, C., Mao, X., Huang, J., Ding, Y., Wu, J., Dong, S., et al. (2011). KOBAS 2.0: a web server for annotation and identification of enriched pathways and diseases. Nucleic Acids Res. 39, W316–W322. doi: 10.1093/nar/gkr483
Xing, K., Zhu, F., Zhai, L. W., Chen, S. K., Tan, Z., Sun, Y. Y., et al. (2016). Identification of genes for controlling swine adipose deposition by integrating transcriptome, whole-genome resequencing, and quantitative trait loci data. Sci. Rep. 6:23219. doi: 10.1038/srep23219
Yang, J., Ferreira, T., Morris, A. P., Medland, S. E., Madden, P. A. F., Heath, A. C., et al. (2012). Conditional and joint multiple-SNP analysis of GWAS summary statistics identifies additional variants influencing complex traits. Nat. Genet. 44, 369–375. doi: 10.1038/ng.2213
Yang, J. A., Benyamin, B., McEvoy, B. P., Gordon, S., Henders, A. K., Nyholt, D. R., et al. (2010). Common SNPs explain a large proportion of the heritability for human height. Nat. Genet. 42, 565–569. doi: 10.1038/ng.608
Yang, J. A., Lee, S. H., Goddard, M. E., and Visscher, P. M. (2011). GCTA: a tool for genome-wide complex trait analysis. Am. J. Hum. Genet. 88, 76–82. doi: 10.1016/j.ajhg.2010.11.011
Yang, Q., Cui, J., Chazaro, I., Cupples, L. A., and Demissie, S. (2005). Power and type I error rate of false discovery rate approaches in genome-wide association studies. BMC Genet. 6:S134. doi: 10.1186/1471-2156-6-S1-S134
Yayou, K., Kitagawa, S., Ito, S., Kasuya, E., and Sutoh, M. (2011). Effect of oxytocin, prolactin-releasing peptide, or corticotropin-releasing hormone on feeding behavior in steers. Gen. Comp. Endocrinol. 174, 287–291. doi: 10.1016/j.ygcen.2011.09.003
Young, J. M., Cai, W., and Dekkers, J. C. M. (2011). Effect of selection for residual feed intake on feeding behavior and daily feed intake patterns in Yorkshire swine. J. Anim. Sci. 89, 639–647. doi: 10.2527/jas.2010-2892
Yu, N. K., and Kaang, B. K. (2016). Gene repressive mechanisms in the mouse brain involved in memory formation. BMB Rep. 49, 199–200. doi: 10.5483/BMBRep.2016.49.4.044
Zhou, X., and Stephens, M. (2012). Genome-wide efficient mixed-model analysis for association studies. Nat. Genet. 44, 821–824. doi: 10.1038/ng.2310
Keywords: pigs, Duroc, GWAS, feed conversion ratio, residual feed intake, feeding behavior, feed efficiency
Citation: Ding R, Yang M, Wang X, Quan J, Zhuang Z, Zhou S, Li S, Xu Z, Zheng E, Cai G, Liu D, Huang W, Yang J and Wu Z (2018) Genetic Architecture of Feeding Behavior and Feed Efficiency in a Duroc Pig Population. Front. Genet. 9:220. doi: 10.3389/fgene.2018.00220
Received: 28 March 2018; Accepted: 29 May 2018;
Published: 19 June 2018.
Edited by:
Meng-Hua Li, Institute of Zoology (CAS), ChinaReviewed by:
Jun Ren, Jiangxi Agricultural University, ChinaCopyright © 2018 Ding, Yang, Wang, Quan, Zhuang, Zhou, Li, Xu, Zheng, Cai, Liu, Huang, Yang and Wu. This is an open-access article distributed under the terms of the Creative Commons Attribution License (CC BY). The use, distribution or reproduction in other forums is permitted, provided the original author(s) and the copyright owner are credited and that the original publication in this journal is cited, in accordance with accepted academic practice. No use, distribution or reproduction is permitted which does not comply with these terms.
*Correspondence: Jie Yang, amlleWFuZzIwMTJAaG90bWFpbC5jb20= Zhenfang Wu, d3pmZWFtaWxAMTYzLmNvbQ==
†These authors have contributed equally to this work.
Disclaimer: All claims expressed in this article are solely those of the authors and do not necessarily represent those of their affiliated organizations, or those of the publisher, the editors and the reviewers. Any product that may be evaluated in this article or claim that may be made by its manufacturer is not guaranteed or endorsed by the publisher.
Research integrity at Frontiers
Learn more about the work of our research integrity team to safeguard the quality of each article we publish.