- 1Department of Ophthalmology, Emory University School of Medicine, Atlanta, GA, USA
- 2Bascom Palmer Eye Institute, University of Miami Miller School of Medicine, Miami, FL, USA
- 3Department of Genetics, Genomics and Informatics, University of Tennessee Health Science Center, Memphis, TN, USA
Retinal ganglion cells (RGCs) are the output neuron of the eye, transmitting visual information from the retina through the optic nerve to the brain. The importance of RGCs for vision is demonstrated in blinding diseases where RGCs are lost, such as in glaucoma or after optic nerve injury. In the present study, we hypothesize that normal RGC function is transcriptionally regulated. To test our hypothesis, we examine large retinal expression microarray datasets from recombinant inbred mouse strains in GeneNetwork and define transcriptional networks of RGCs and their subtypes. Two major and functionally distinct transcriptional networks centering around Thy1 and Tubb3 (Class III beta-tubulin) were identified. Each network is independently regulated and modulated by unique genomic loci. Meta-analysis of publically available data confirms that RGC subtypes are differentially susceptible to death, with alpha-RGCs and intrinsically photosensitive RGCs (ipRGCs) being less sensitive to cell death than other RGC subtypes in a mouse model of glaucoma.
Introduction
The retinal ganglion cell (RGC) is the final output neuron of the retina, projecting through the optic nerve to the brain, where it targets a number of functionally distinct areas: for visual perception, RGC axons travel to the lateral geniculate nucleus (Chalupa and Günhan, 2004); for the regulation of circadian rhythms, they pass through the suprachiasmatic nucleus (Guido et al., 2010); for eye movements, a group of RGC axons terminates in the superior colliculus (Triplett et al., 2014); and for the pupillary light reflex, RCG axons terminate in the pretectal area (Young and Lund, 1998). Each of these areas receives input from distinct subtypes of RGCs with unique morphological and molecular signatures. At the present time, over 30 subtypes of RGCs (Baden et al., 2016) are estimated to exist. They all receive inputs from other types of retinal neurons (bipolar cells and amacrine cells), and most of them express similar groups of genes that may serve as general RGC markers (Raymond et al., 2008; Rodriguez et al., 2014). Identifying gene expression patterns in RGCs and their subtypes is currently an active area of research, as demonstrated by the discovery of new subtypes of ganglion cells based on gene expression (Macosko et al., 2015; Sanes and Masland, 2015).
The death of RGCs in glaucoma or after injury eventually leads to loss of vision (Templeton et al., 2009; Zode et al., 2011; Munguba et al., 2014; Nuschke et al., 2015). However, the susceptibility of RGC subtypes to death differs among the distinct subtypes. Some RGCs are resistant to injury, while others appear to be more sensitive to insult, indicating differential gene expression and response to injury among subtypes (Chang et al., 2013; Duan et al., 2015; Puyang et al., 2015). The present study focuses on transcriptional networks within RGCs of the mouse, using gene expression data measured across 55 strains of recombinant inbred BXD mice (King et al., 2015) as well as the bioinformatic tools from GeneNetwork (Williams and Mulligan, 2012). The analysis begins by examining genes correlated with two relatively general RGC markers, Thy1 and Tubb3. Each of these markers forms a unique network of genes that appears to function independently across many of the RGC subtypes. These networks are functionally different to the point of having distinct transcription factor binding sites. Subtype-specific networks partially overlapping with the Thy1-network are also present. In a meta-analysis of previously published data from a microarray study of a mouse glaucoma model (Howell et al., 2011), we examine the differential effects of this disease state on transcriptional networks in RGC subtypes and confirm intrinsically photosensitive RGCs (ipRGCs) and alpha-RGCs as more resistant to cell death (Duan et al., 2015).
The systems genetics and bioinformatics approach used in the present study demonstrates how signatures of RGCs and their subtypes can be extracted from a complex neural tissue such as the retina.
Results
RGC Markers Segregate into Two Major Correlation Networks
The present study examines the correlation of gene expression in the retina across the BXD recombinant inbred strain set to define gene networks active in RGCs. The BXD strain set is derived from two parental strains, the C57BL/6J mouse and the DBA/2J mouse. Natural variation in gene expression across strains can be used to identify co-regulated genes with a similar expression pattern, allowing for the construction of genetic networks (Williams et al., 2001; Geisert et al., 2009; Templeton et al., 2013a; Keeley et al., 2014).
The data used in this study consist of whole retinal samples collected from 55 BXD strains. They can be found on www.genenetwork.org under the identifier “DoD Retina Normal Affy MoGene 2.0 ST (May15) RMA Gene Level”. Two features of this dataset enhance the quality of the analysis: The first is that the retina is a tissue that can be consistently isolated with minimal contamination by other tissues. The second is the quality of the RNA with an average RNA Integrity Score of 9.43 and a standard error of 0.037 across the 220 samples isolated for this dataset.
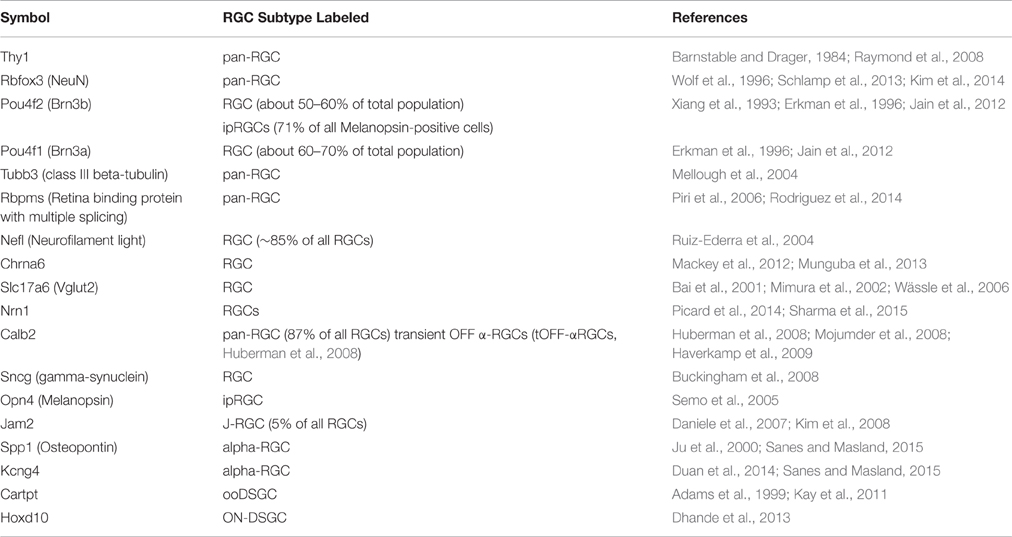
The analysis began with two well-characterized markers for RGCs, Thy1 and Tubb3, as they both exhibited substantial variability in mRNA expression levels across BXD strains (Figure 1). Expression of Thy1 ranged from 10.39 in BXD42 to 11.45 in BXD15 (this data is presented on a log2 scale and the difference in expression is equivalent to an over 2-fold change). A similar variability in gene expression was observed for Tubb3, with expression levels ranging from 9.68 (BXD6) to 10.74 (BXD2). When correlations for Thy1 and Tubb3 were made across all microarray data, both produced a highly correlated group of genes. For Thy1, the top 100 correlates had an absolute r-value (Pearson) greater than 0.89 (Bonferroni-adjusted p < 1e−12) and the top 2000 correlates all had an absolute r-value greater than 0.77 (adj. p < 1e−8). If we examine the Pearson correlation values above 0.60, which corresponds to an adjusted p-value of 0.02, then Thy1 has a total of 8596 correlates. This tightly correlated list of genes forms a potential network, and indicates that the genes in this network are co-regulated across the BXD strains (King et al., 2015). Within the list of the top 2000 Thy1-correlates, we found several other well-characterized RGC markers, including Rbfox3 (producing NeuN, Neuronal Nuclei), Pou4f1 (producing BRN3A), and Pou4f2 (producing BRN3B) (Table 1). Interestingly, the Thy1 correlate list did not contain other known RGC markers, including Tubb3.
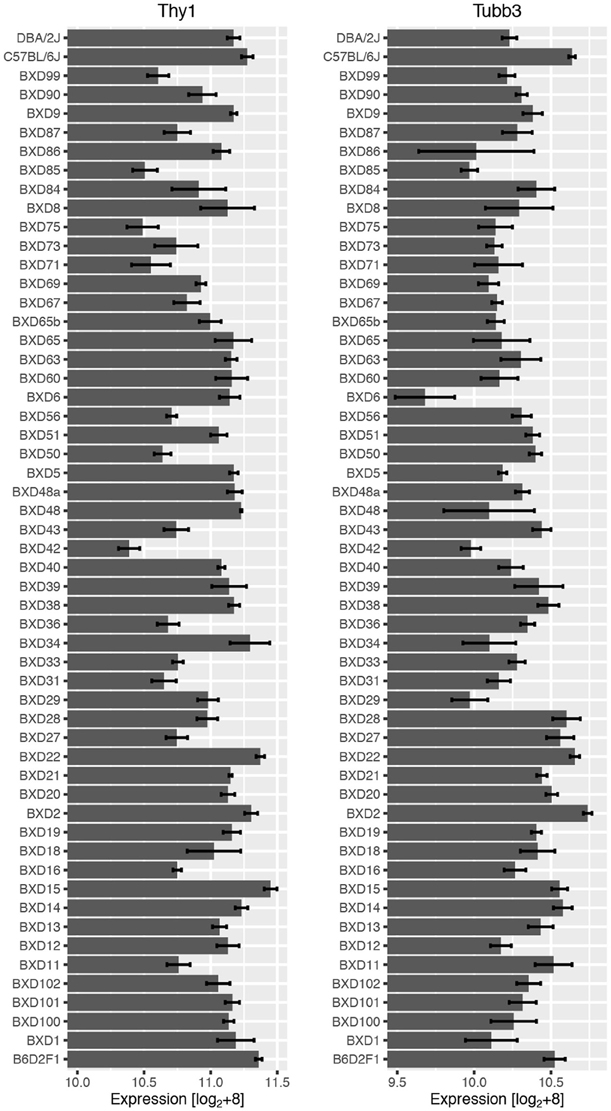
Figure 1. RNA expression across the BXD RI strain set for Thy1 (left) and Tubb3 (right) with the means and standard errors. There was an approximately 2-fold difference in mean expression levels for both genes. This data is given as raw expression values on a log2 scale +8.
For Tubb3, the top 100 genes had an absolute r value greater than 0.71 (adj. p < 1e−6), and the top 2000 genes showed values greater than 0.52 (adj. p = 0.12) and did not contain Thy1, Pou4f1, Pou4f2, or Rbfox3. This was also true for the 1387 correlates with Pearson r > 0.60 (equal to a significant Bonferroni-adjusted p-value of 0.02). However, other RGC markers were present in the Tubb3 correlation list, including the newly described Rbpms (RNA binding protein with multiple splicing) as well as Calb2 (Calbindin 2) and Chrna6 (Cholinergic receptor nicotinic alpha 6).
These two networks are relatively independent, with minimal overlap. When examining the correlates of the Thy1-network relative to the Tubb3-network, only one gene is shared within their top 100 correlations (1%), 31 genes (1.55%) are present in the top 2000 correlations, and 51 genes (0.05%) are in common with the 9982 genes found in both the Thy1 (8596 genes) and the Tubb3 (1386 genes) correlation lists with a Pearson correlation above 0.6.
The basis for the segregation of genes into two distinct networks is illustrated by plotting the correlations for combinations of genes from both networks. In Figure 2, the expression of Thy1, Pou4f1, Tubb3, and Rbpms across BXD strains is displayed in scatterplots. These plots demonstrate the tight correlation for Thy1-Pou4f1 (Figure 2A) and Tubb3-Rbpms (Figure 2C). They further show the lack of correlation between Thy1 and Tubb3 (Figure 2B) as well as Tubb3 and Pou4f1 (Figure 2D). The presence of additional RGC markers in the correlation lists of Thy1 and Tubb3 together with the minimal overlap of genes indicated the presence of at least two RGC-specific transcriptional networks in mouse RGCs.
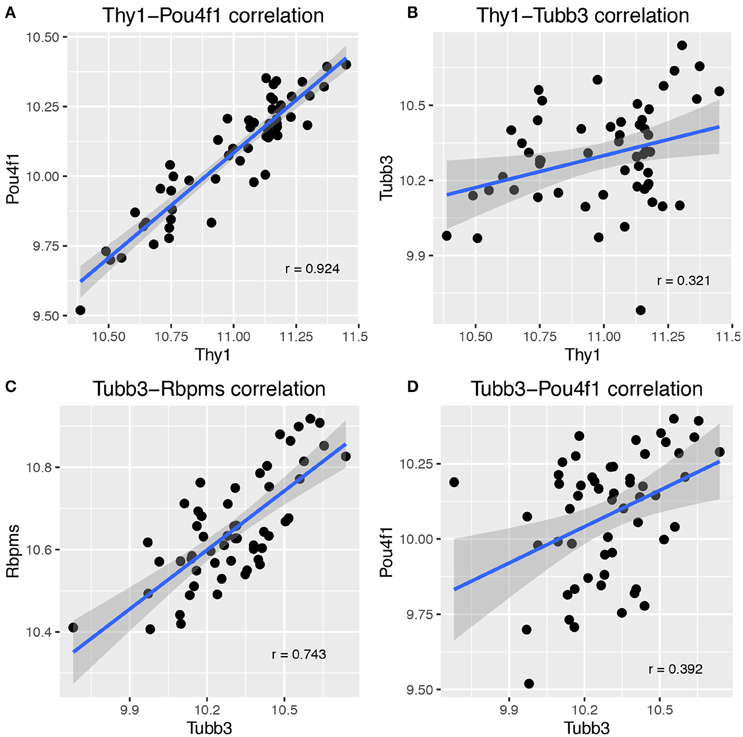
Figure 2. Scatterplots illustrating the correlation between major RGC markers. There was a tight correlation between Thy1 and Pou4f1 (A), which are part of the same network. Correlation dropped greatly for Thy1 and Tubb3 (B), which are not part of the same network. Similarly, Tubb3 correlated well with Rbpms (C) but not with Pou4f1 (D). Pearson's correlation coefficient is given in each plot on the lower right half. Each dot represents one BXD RI strain, and the confidence interval for the smoothing function (dark gray areas surrounding the blue line) is 0.95.
Since we selected Thy1 and Tubb3 to serve as primary RGC markers for this analysis based upon literature evidence, we wondered if an alternative unbiased approach would validate our findings. As an independent examination of these networks, we performed weighted gene correlation network analysis (WGCNA) on the whole microarray dataset (Langfelder and Horvath, 2008). This method relies on unsupervised clustering of co-expressed genes across all of the BXD RI strains into so-called modules or eigengenes and thus represents an unbiased approach to test the assumption that Thy1- and Tubb3- networks exist independently from each other. WGCNA created 18 modules of co-expressed genes. Module #1 contained 1741 of the top 2000 Thy1 correlates, whereas only 131 genes from the top 2000 Tubb3 correlates were assigned to this module. The majority of the Tubb3 correlates belonged to modules #4 (n = 279), #5 (n = 886), and #6 (n = 327), none of which contained any of the Thy1 correlates. This minor overlap in module affiliation between genes of both networks reaffirms our finding that the Thy1- and Tubb3-network function individually.
To define the genomic location of upstream modulators for both the Thy1- and the Tubb3-network, we examined interval maps for the 7 RGC marker genes found in both correlation lists (Thy1, Rbfox3, Pou4f2, Pou4f1, Tubb3, Calb2, and Rbpms). When we investigated each marker's signature quantitative trait locus (QTL), we found that Thy1, Rbfox3, Pou4f2, and Pou4f1, had similar interval maps. The same was true for Tubb3, Calb2, and Rbpms. To further investigate this phenomenon, we plotted multiple interval maps as heat maps for each marker and its 20 highest correlated genes (Figure 3). In these heat maps, rows correspond to the QTL curve of a single correlated gene plotted across the entire genome. Two color gradients were used to characterize differential expression between strains: A yellow to red gradient identified a transcript whose expression was higher in strains with a B haplotype (allele origin from C57BL/6J), whereas a green to blue gradient represented a transcript whose expression was higher in strains with the D haplotype (allele origin from DBA/2J). The linkage significance (LRS or LOD-score) increased with color intensity. In other words: A deeply colored vertical line characterized a genomic locus that may contain a regulatory element responsible for the differential expression of these genes.
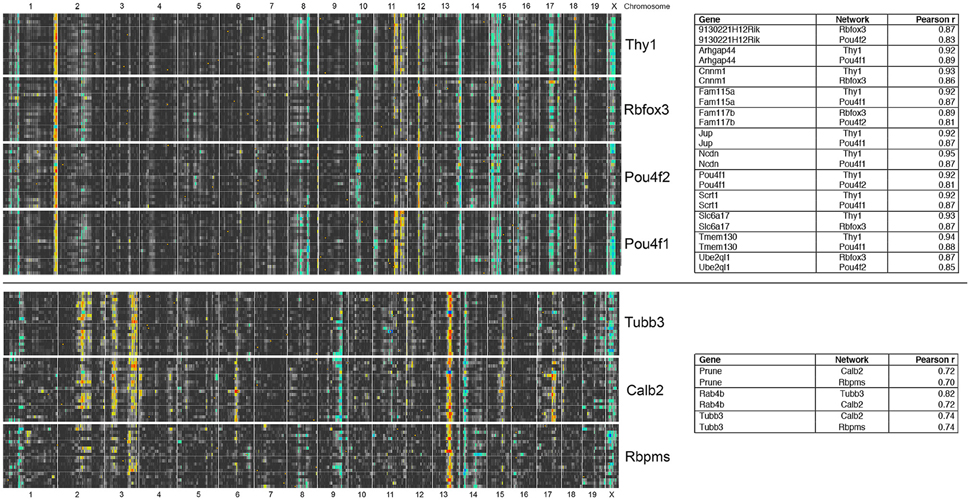
Figure 3. RGC markers segregate into two major correlation networks. For each of the general RGC markers on the right, the eQTL curve for the 20 highest correlated genes was plotted as a heat map. In these, the LRS/LOD score is given in pseudocolors: A yellow to red gradient identifies a transcript whose expression is higher in strains with a B haplotype at that locus (allele origin from C57BL/6J), whereas a green to blue gradient represents a transcript whose expression is higher in strains with the D haplotype (allele origin from DBA/2J). There are several strong and sharp trans-bands extending across Thy1, Rbfox3, Pou4f2, and Pou4f1, such as on distal Chromosome 1 or 13. There are also trans-bands extending across Tubb3, Calb2, and Rbpms on mid Chr. 13 and proximal Chr. 14. No overlap is present between the genes separated by the black line, indicating that RGC markers segregate into two major independently regulated gene networks. The panel on the right lists genes that are found in more than one of the top 20 correlations. For example, Arhgap44 is present in the 20 highest correlates for both Thy1 and Pou4f1.
These bands are thought to identify a genomic locus modulating the expression of the genes in the network across the BXD RI strains. Likely candidates for modulating gene expression include transcription factors, micro RNAs or long noncoding RNAs (Geisert et al., 2009; Templeton et al., 2013b; Williams and Auwerx, 2015). Since the analysis is only correlational in nature, we cannot exclude the possibility that loci for individual networks do not have regulatory roles, as they could just be co-regulated with the other identified networks. When comparing heat maps for both networks, no overlap in patterns was observed. Thus, the RGC marker genes segregated into two independently regulated gene networks. From here on, we will refer to these networks as the Thy1-network and the Tubb3-network. This is an arbitrary nomenclature, mirroring the most prominent RGC marker for each of both networks. For the Thy1-network, the strongest modulatory signature was localized at the distal end of Chromosome 1. For members of the Tubb3- network, the most prominent genomic signature was on mid-distal Chromosome 13. Several candidate genes exist in those loci; a comprehensive analysis is attached as Supplemental Material (Supplemental Tables 1, 2).
There are three potential scenarios that would allow two specific genetic networks to exist within a single cell population. The first is that the mRNA levels of each marker differ across the entire retina. The second explanation is that their mRNA expression levels differ in specific RGC subtypes, leading to unique expression of each protein within each RGC subtype. The third potential mechanism involves differences in the percentage of each of the RGC subtypes from strain to stain. To further examine this, we immunostained retinas with THY1 and Class III beta tubulin. In these retinal whole mounts, the more than 90% of labeled cells were double-labeled of RGCs were both THY1- and Class III beta tubulin- positive (Figure 4), indicating that the two markers are co-localized and expressed in the same cell. Despite their protein co-expression, their mRNA level may differ from cell to cell. When examining the double stained cells, the intensity of each stain varied from ganglion cell to ganglion cell. Some cells had approximately equal labeling for THY1 and Class III beta tubulin, while in other cells THY1 staining was more intense than Class III beta tubulin. In a few cells, the labeling of Class III beta tubulin was more intense. It also appeared that some cells were labeled by only one of the two markers. Thus, even though both markers are co-expressed in many RGCs, their expression levels do not consistently correlate with each other, corroborating that their expression is independently regulated.

Figure 4. Maximum intensity projections of confocal z-stacks taken from retinal whole-mounts showing the co-localization of THY1 (A) and Class III beta-tubulin (B) in the retinal ganglion cell layer from a C57BL/6 mouse. Most cells were double-stained for both RGC markers (C), but some cells only expressed Class III beta-tubulin (arrowhead) or THY1 (arrow). Furthermore, the staining intensity was different across cells, and some cells had large somata and were more intensely stained than others (large arrowhead in “merge”). Staining with the secondary antibodies only did not result in unspecific fluorescence (data not shown). Scale bar in C = 100 μm.
Since multiple subtypes of RGCs are known to exist, one could predict that there are also multiple genetic networks within each of these subtypes. We compiled an extended list of RGC markers from the literature. This list consisted of 17 proteins and their respective genes, 6 of which are known to be relatively specific for a single RGC subtype (Table 1). Calculating the correlation in expression across the BXD RI strain set and displaying these relations in a network graph revealed that indeed two major network hubs formed around Thy1 and Tubb3 based on the highest correlations surrounding these two markers (Figure 5). The only significant connection between Thy1 and Tubb3 existed through 2 of their respective correlates, Slc17a6 (VGLUT2), and Chrna6. Except for Hoxd10 (a marker of ON-directionally selective RGCs), all the other RGC markers had a direct connection to either Thy1 or Tubb3.
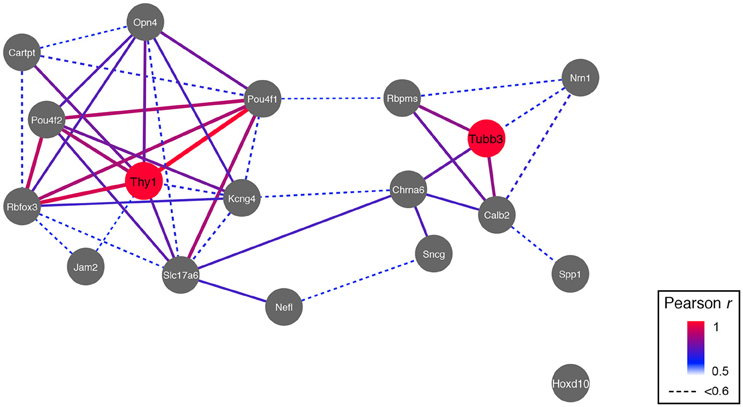
Figure 5. RGC markers segregate into two networks, and two major hubs are formed around Thy1 and Tubb3. The only connection between the Thy1- and the Tubb3-network is through two of their correlates, Slc17a6 and Chrna6. Pearson's correlation coefficient was mapped to line color and thickness (high correlation = thicker and red bars).
Functional Differences of RGC Networks
Following the identification of two gene networks related to normal RGC function, we asked whether both networks had any functional differences.
In order to facilitate this analysis, we grouped genes with a similar heat map pattern belonging to the same network into one “synthetic trait” using principal component analysis. These “synthetic traits” provide for more robust functional network analysis than a single marker gene, and they can be used to generate correlation lists specific to a group of genes by reducing the dimensionality of the data (Yin et al., 2012; Vanderlinden et al., 2013; Graybeal et al., 2014).
The synthetic trait for the Thy1-network was constructed using Thy1 and its direct correlates Rbfox3, Pou4f1, and Pou4f2, while the Tubb3-network was constructed using Tubb3, Calb2, and Rbpms. When we compared the correlations of these networks using WebGestalt-based gene ontology (GO) analysis (Wang et al., 2013), each of the two synthetic traits was enriched in genes with very different molecular and cellular functions. The Thy1-network was significantly enriched in genes involved in neuron development, synaptic transmission, cation transmembrane transporter activity and voltage-gated channel activity (adj. p < 0.0000001 for all), strongly indicating that this network was highly neuron-specific (Supplemental Figure S1). Some examples of the genes associated with neuronal development and synaptic transmission included: Tnr, NeuroD2, L1cam, Syn2, Grn4, and Gabbr1 (see Supplemental Table 3 for the whole list). A close examination of the highest (r > 0.9) correlates also revealed that at least 6 genes (Gsk3a, Srgap1, Arhgap44, Ncdn, L1cam, and Lrrc4b) were functionally associated with neurite outgrowth.
The Tubb3 synthetic network contained genes that were associated with completely different biological functions (Supplemental Figure S2). Several members of the tubulin family of proteins were at the top of the correlation list, such as Tubg2, Tuba4a, Tubg1, Tubb5, and Tuba1b. Gene Ontology analysis revealed enrichment in GO terms “guanyl nucleotide binding” and “protein polymerization” (both with adj. p < 0.001), including the genes Rab11b, Bab8a, Tufm, Rabb1b, Arf6, and Rab4b. The highest correlates of the Tubb3 synthetic trait were two genes encoding proteins from the Rab family (Rab15 and Rab4b).
Distinct Groups of Transcription Factor Binding Sites Are Associated with the Two RGC networks
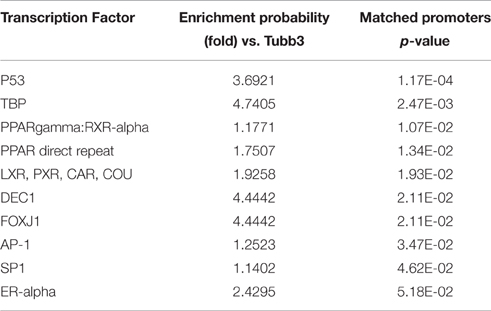
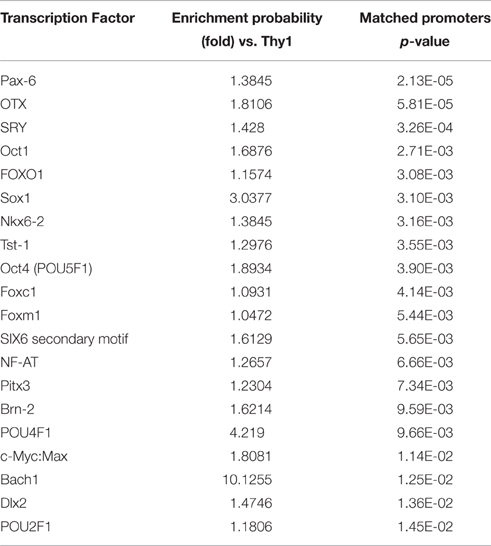
Since the Thy1- and the Tubb3-network were functionally enriched for distinct GO terms, we asked if this difference would be reflected in their transcription factor binding site (TFBS) distribution. We searched the promoter sequences for genes in the Thy1-network using the TRANSFAC FMatch algorithm (Matys et al., 2006) for over-represented TFBS in comparison to the Tubb3-network and vice versa (Tables 2a,b). Genes of the Thy1-network were ~4 times more enriched in TFBS for p53 and Dec1, two master regulators of cell cycle progression (Qian et al., 2012). The Thy1-network was also more enriched in TFBS for PPAR gamma and estrogen receptor alpha as well as effectors SP1 and AP1. In contrast, the promoters of genes in the Tubb3-network were significantly enriched in TFBS of developmental origin, such as Pax6, Six6, proteins of the Sox and Oct family, as well as Pou4f1.
Genomic Regulation of Subtype-Specific RGC Markers
Since our analysis revealed two distinct molecular networks governing normal RGC function, we hypothesized that subtype-specific RGC markers would contain regulatory signatures from either one or both RGC networks.
Thus, we generated heat maps of the highest correlates of each subtype-specific marker (Cartpt2, Jam2, Kcng4, Opn4, Spp1, and Hoxd10, see Figure 5). This comprehensive analysis revealed that two pairs of genes were regulated in a similar fashion: Cartpt and Jam2 as well as Kcng4 and Opn4 showed very similar heat maps to each other. When we compared the heat maps for these 4 subtype-specific markers, we found that some of their bands were at identical loci as bands observed in the Thy1-network (Figure 6). While Cartpt/Jam2 had the distinct band from distal Chromosome 1, Kcng4/Opn4 shared a band on distal Chromosome 13. It was also noticed that the allelic distribution of correlates for Cartpt/Jam2 seen as a blue line on distal Chromosome 1 was diametrical to the original Thy1-correlates, where the line was mostly yellow-red (see Figure 3). This simply implies that the top 20 correlates of Cartpt and Jam2 are in fact correlated inversely to Cartpt or Jam2 itself, whereas the top 20 correlates of Thy1 are positively correlated to Thy1 itself.
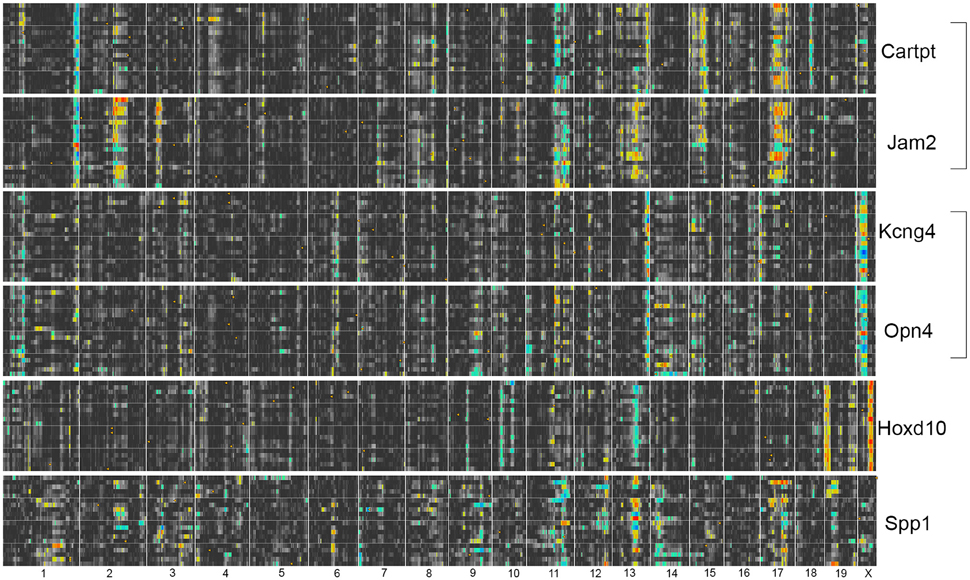
Figure 6. Heat maps for RGC subtype-specific marker genes. Cartpt/Jam2 share the trans-band on distal Chromosome 1 with the Thy1-network, whereas Kcng4/Opn4 share the Thy1-network trans-band from Chromosome 13. There is no obvious overlap of trans-bands with either network for Hoxd10. For Spp1, no obvious trans-bands can be appreciated, suggesting that this gene is not part of a transcriptional network in its normal state.
Hoxd10 had very distinct trans-QTL bands that were not found elsewhere, and its correlates also did not contain any RGC-enriched genes. Since no connection of Hoxd10 to either the Thy1- or the Tubb3-network (see Figure 3) was observed, the lack of overlap with RGC-enriched genes casts doubt on the specificity of this marker for the identification of RGC subtypes based on gene expression. The eQTL pattern of Spp1 was the most complex of all markers, as it lacked any clearly detectable trans-band.
Overlap of Correlates of Subtype-Specific Markers with the Thy1-network and the Tubb3-network
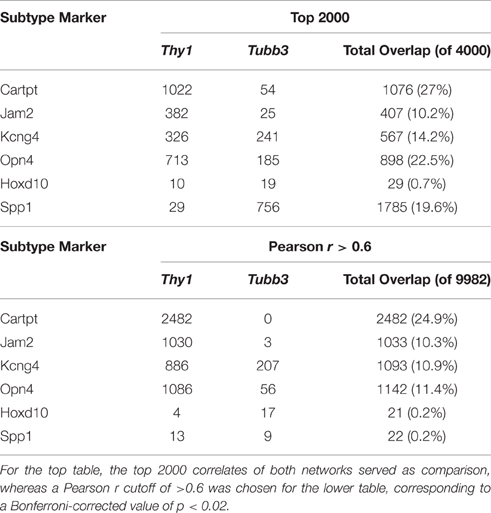
When we took the top 2000 correlates (an arbitrary cut-off) of each of the six subtype specific markers (Cartpt, Jam2, Kcng4, Opn4, Hoxd10, and Spp1) and examined the distributions of these markers across the Thy1- and the Tubb3-networks, we were able to see the relative interplay between these networks (Table 3). For Spp1 and Hoxd10, the majority of the overlap was seen with genes from the Tubb3-network. The picture was quite different for the remaining subtype-specific markers. For Cartpt, Opn4, Kcng4, and Jam2, the overlap was dominated by similarities with the Thy1-network. This analysis was also conducted using only the genes with a Pearson correlation value above 0.6 (adj. p < 0.02) and it displayed a similar trend (Table 3). Taken together these data indicate that each of the RGC subtypes has a unique interplay with the Thy1- and the Tubb3-networks. The dramatic differences in overlap between correlates may reflect the differential expression of the Thy1- and Tubb3-networks in different RGC subtypes. These relationships can also be seen in the network map (Figure 5).
Susceptibility of RGC Marker Genes to Glaucomatous Nerve Damage
The identification of RGC subtypes has raised the question whether or not there is a difference in susceptibility to nerve damage, subsequent cell survival, or axon regeneration. In order to test this hypothesis on a transcriptional level, we used publicly available microarray data generated from DBA/2J glaucomatous eyes (Howell et al., 2011) and correlated glaucoma severity score (GSS) with expression levels of RGC markers (Figure 7). As expected, expression levels of all general RGC markers decreased as nerve damage increased (implicated by the negative correlation between GSS and RGC markers in Figure 7, dashed blue line). This was also the case for two subtype-specific markers, Jam2 and Cartpt. Interestingly, expression levels of markers for alpha-RGCs (Kcng4 and Spp1) and ipRGCs (Opn4) did not correlate to GSS (cutoff r < 0.6), suggesting that these two RGC subtypes are differentially susceptible to nerve damage.
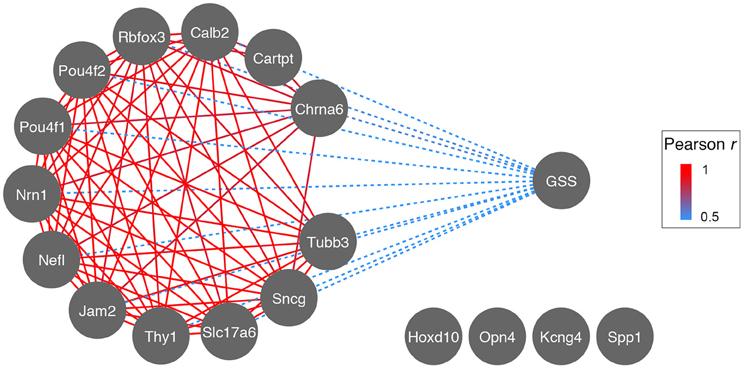
Figure 7. Correlation network of Glaucoma Severity Score (GSS) to RGC markers during glaucoma progression. The GSS is a visual grading system identifying axonal damage in the optic nerve and consists of 4 stages: no damage, light, medium, and severe damage. These stages are inversely correlated (dashed blue) to the expression levels of most RGC markers, suggesting that as RGCs die and axonal damage increases, mRNA expression of RGC marker genes decreases (most likely due to decrease in RGC number). The decrease of RGC marker gene expression is strongly correlated across glaucoma stages (red, r for all >0.9). Markers for ipRGCs (Opn4) and alpha-RGCs (Kcng4 and Spp1) do not correlate to GSS, possibly indicating their preferential survival.
Discussion
Using the DoD CDMRP Retina expression microarray dataset to examine correlates of known RGC markers across the BXD RI strain set, this study revealed two distinct gene networks regulating normal RGC function. Detecting these transcriptional networks with high statistical power required tissue from 55 RI strains with 4 biological replicates per strain. The bioinformatic tools on GeneNetwork allowed us to extract gene networks from a complex structure such as the mouse retina (Geisert et al., 2009; Keeley et al., 2014). Interestingly, almost all of the general RGC markers described in the literature (see Table 1) selectively group with one of two genetic networks, the Thy1-network or the Tubb3-network. Both Thy1 (Barnstable and Drager, 1984) and Tubb3 (Snow and Robson, 1994) are believed to be generalized markers for RGCs. Nonetheless, these markers segregate into two distinct genetic networks. Two scenarios could explain the biological basis of correlated genes that are co-regulated in BXD RI mice: (I) differences in cell number of each RGC subtype across the BXD strains, or (II), differences in gene expression within individual RGC subtypes (Geisert et al., 2009; Keeley et al., 2014). Currently, we are not able to distinguish between these two potential explanations. Our analysis also revealed that these networks have unique biological functions.
Both the Thy1- and the Tubb3-networks contained large groups of genes that were consistent with a neuronal phenotype. However, they were each enriched in distinct functional roles. The Thy1-network appeared to be functionally involved in neuronal development and maintenance, as well as axon guidance. Some of the highest correlates of this network (Gsk3a, Srgap1, Arhgap44, Ncdn, L1cam, and Lrrc4b) were all previously reported to affect dendrite or axon pathfinding and outgrowth (Schwaibold and Brandt, 2008; Cherry et al., 2011; Ip et al., 2011; Galic et al., 2014). Therefore, this network could be directly involved in RGC process extension, potentially including dendrites and axons projecting to the brain. Furthermore, the network was enriched in transmembrane ion transporters. This included several calcium- and sodium-gated channel subunits, all of which have been previously localized to RGCs (Lipton and Tauck, 1987; Farrell et al., 2014).
The Tubb3-network contained genes that differed in function from those of the Thy1-network. The biological processes enriched in this group included protein polymerization and organic substrate metabolic processes. Under molecular processes, the Tubb3-network was enriched for GTP binding proteins and GTPase activity, two mechanisms known to be essential for cellular transport involving the cytoskeleton (Roychowdhury and Rasenick, 2008; Schappi et al., 2014). The highest two correlates of the Tubb3-network were Rab15 and Rab4b, two G-proteins that are known to play an important role in endosome formation and vesicle movement along actin and tubulin networks (Zuk and Elferink, 2000; Falk et al., 2014). Several other genes in this list were associated with intracellular trafficking, such as sorting nexin 32 (Snx32, a molecule that links transport vesicles to dynactin (Wassmer et al., 2009), vesicle associated membrane protein 1 (Vamp1, a SNARE protein important for linking vesicles to the target membrane; Hasan et al., 2010), Pigu (a GPI anchor protein; Guo et al., 2004), and Tmem9 (part of the lysosomal membrane; Kveine et al., 2002). These genes were highly correlated with and specific to the Tubb3-network.
These findings suggest that the Tubb3-network is functionally associated with cytoskeleton and vesicle transport in RGCs. Since neurons are known for the significant amount of cytoskeletal proteins necessary to maintain dendritic and axonal integrity (Kevenaar and Hoogenraad, 2015), it can be hypothesized that the Tubb3-network is involved in maintenance of these structural elements.
Taken together, this analysis indicates that each network has distinct molecular functions and that both of these networks can exist independently within a single RGC.
The functional differences between networks were mirrored by the transcription factor binding site (TFBS) analysis for promoters of their respective genes. Members of the Thy1-network showed significant enrichment in TFBS for proteins regulating cell cycle, growth and apoptosis (Tu et al., 2013). Genes belonging to the Tubb3-network, however, showed an over-representation of TFBS for transcription factors known to establish cell fate decisions during development, particularly in later stages. Proteins such as OTX1, PAX6, SIX6, or POU4F1 belonged to the latter group (Zagozewski et al., 2014). Pou4f1 was not originally found in the correlates of the Tubb3-network, which might seem surprising. A possible explanation for this is that the Thy1-network, which correlates well with the expression of Pou4f1 across the BXD strains, acts upstream of the Tubb3-network. In a developmental sense, this could suggest that members of the Thy1-network establish expression of Pou4f1, which can then bind to members of the Tubb3-network to influence their transcription. Because Pou4f1 was originally not found to be part of the Tubb3-network but the Thy1-network instead, we hypothesize here that basic cell cycle tasks such as survival decisions are managed by members of the Thy1-network, while members of the Tubb3-network regulate the fine-tuning of RGC development, possibly even influencing subtype commitments.
The identification of neuronal subtypes has gained a considerable amount of attention in neuroscience across a variety of scientific disciplines (Hoshino, 2012; Russ and Kaltschmidt, 2014). This is especially the case for RGC subtypes (Kay et al., 2011; Dhande et al., 2013; Sanes and Masland, 2015). The establishment of transgenic mouse models has recently transformed the field, and new paradigms are starting to emerge. For example, it is becoming increasingly evident that RGC subtypes seem to be differentially susceptible to nerve injury to the point of having different chances of survival or regeneration (Kay et al., 2011; Dhande et al., 2013; Pérez de Sevilla Müller et al., 2014; Duan et al., 2015; Sanes and Masland, 2015). In order to develop new therapeutic approaches to nerve regeneration, it may be necessary to tease apart the transcriptional programs of injury-susceptible and non-susceptible RGC subtypes.
When we investigated the heat maps of subtype-specific gene correlates, we found that two pairs—Kcng4/Opn4, or Jam2/Cartpt—showed similarity to two different heat map bands from the Thy1-network. Kcng4 marks alpha-RGCs, while Opn4 marks ipRGCs, and these two subtypes were recently found to be most resistant to optic nerve crush (Pérez de Sevilla Müller et al., 2014; Duan et al., 2015). Since the regulatory pattern of those two gene pairs was very similar based on heat map analysis of their co-varying genes, it would be interesting to systematically investigate if these upstream modulatory loci are responsible for increased neuronal survival or regeneration. Bioinformatic analysis of RGC marker susceptibility to glaucomatous nerve damage supported the notion that alpha-RGCs and ipRGCs were also most resistant to neurodegeneration. The decrease in mRNA expression of alpha-RGC markers (Kcng4, Spp1) and ipRCG markers (Opn4) did not correlate with GSS (a visual grading scale for optic nerve axon damage), whereas the overwhelming majority of RGC markers did.
Interestingly, the discovery of Spp1 marking a particular RGC subtype had only been made after crush injury to the optic nerve in a mouse model (Pérez de Sevilla Müller et al., 2014; Duan et al., 2015). In this study, it was found that alpha-RGCs secreting Osteopontin (the protein made from the gene Spp1) were most resistant to optic nerve crush among all RGC subtypes, and that this protective effect was due to Osteopontin. We were not able to identify putative upstream modulatory loci for this gene due to the lack of distinct trans-QTL bands. This suggests that Spp1 is part of a genetic network that needs to be activated by neuronal injury before it can be co-regulated in a more RGC-specific way. This phenomenon has been observed elsewhere for other genes following retinal injury (Templeton et al., 2013b).
In summary, we have identified multiple loci modulating RGC function in the BXD mouse strain set, and we have provided in silico evidence for the differential susceptibility of RGC subtypes to neurodegeneration and cell death. One caveat of this study is the fact that the performed analysis is only a correlative one. Proving a biological cause will require experimental manipulation of the mentioned genes and examination of the effects in vivo or in vitro. Nevertheless, our findings enhance the understanding of the RGC's normal transcriptome, as they are the first to describe gene regulatory networks for some of their subtypes. They may serve others and us as a reference for future studies on RGC subtype identification and their susceptibility to injury.
Materials and Methods
Animals
All of the procedures involving mice were approved by IACUC at Emory University and adhered to the ARVO Statement for the Use of Animals in Research.
Microarray Datasets
Two microarray datasets were used in this project as part of a comprehensive meta-analysis.
(i) The Department of Defense (DoD) Normal Retina Database (May2015). This is the most comprehensive retina microarray dataset and creation is described in King et al. (2015). The DoD Normal Retina Dataset consists of 222 microarrays from 55 different strains BXD mice, the parental strain C57BL/6J, the parental strain DBA/2J and an F1 cross.
(ii) The Howell et al. (2011), DBA/2J Glaucoma Retina M430 2.0 (Sep11) RMA database. This dataset consists of retinal tissue dissected from 40 DBA/2J mouse eyes at 10.5 months of age showing varying levels of RGC damage due to naturally occuring glaucoma in this mouse strain (as graded by visual inspection of the optic nerve). Twenty eyes served as negative controls. The generation of this dataset is described in Howell et al. (2011).
All of the used datasets are publicly accessible through www.genenetwork.org.
Statistical Analysis and Plot Generation
GeneNetwork provided the platform for correlation analysis, principal component generation, and linkage analysis. In general, datasets were queried for gene symbols, downloaded from GeneNetwork, and additional analysis was performed in R whenever necessary. P-values mentioned in relation to Pearson's coefficient throughout this paper are based on pair-wise comparisons. All p-values were Bonferroni-adjusted for 36,012 genes, which is equal to the number of genes captured on the microarray after accounting for replicated and wrongly annotated probes. Plots were generated with R and the dplyr and ggplot2 packages. Cytoscape version 3.2.1 was used to generate gene network graphs.
Gene Ontology Analysis
GO analysis was performed using WebGestalt (Wang et al., 2013). The top 500 genes of each network were used to compile a gene list and duplicates were removed. GO term enrichment was calculated using Affymetrix MouseGene 2.0 ST probe set IDs against a background dataset from the same chip. GO trees are appended as expanded view data. All p-values presented in the GO analysis are corrected for multiple comparisons using the Bonferroni method.
Candidate Gene Analysis
A list of candidate genes for putative upstream modulators of both networks was created by extracting genes with cis-QTLs from the loci showing trans-bands. For a cis-QTL considered to be a good candidate gene, it should fulfill three conditions: (i) be expressed above background, (ii) correlate well with the trait used to create the trans-bands, and (iii) have a nucleotide variation that alters either protein structure or other regulatory elements (such as promoters or enhancers). These lists are appended as Supplemental Tables.
Transcription Factor Binding Site Analysis
Gene lists including the top 500 correlated genes in each network were compiled, duplicates were removed, and uploaded to BIOBASE. The TRANSFAC FMatch algorithm was used to search for overrepresented neuron-specific transcription factor binding sites in the gene lists using the “best supported promoter” model for each gene (Matys et al., 2006). As a background dataset for both networks, the opposite network was chosen. Resulting p-values were Bonferroni-adjusted. The enrichment window for a gene's promoter was chosen to be −5000 to +100 bp of its best supported transcription start site. “Minimize false positives” was selected as cut-off method. The TRANSFAC data version was 2016.2, and only high-quality matrices were used for the analysis.
WGCNA Analysis
Weighted gene network analysis was performed using the WGCNA package in the R environment (Langfelder and Horvath, 2008). A soft thresholding power of 10 was used to calculate the adjacency matrix based on the criterion of scale-free topology (Zhang and Horvath, 2005). Modules were identified using the following parameters for the blockwiseModules function: minimum module size of 100, merge cut height of 0.25, and maximum block size of 2000. The top 2000 correlates of Thy1 and Tubb3 were then each merged with their module affiliation by Affymetrix Probe Set ID and the resulting list was checked for overlaps.
Immunohistochemistry
Two 60 day-old Thy1-CFP C57BL/6 transgenic mouse (Jax identifier B6.Cg-Tg(Thy1-CFP)23Jrs/J) were deeply anesthetized with a mixture of 13 mg/kg of xylazine and 87 mg/kg of ketamine and intracardially perfused with 0.9% saline followed by 4% paraformaldehyde. Retinas were dissected and flat-mounted on glass slides following a standard protocol. Retinas were blocked in 4% bovine serum albumin in PBS overnight. One retina was stained with anti-TUJ1 (a gift from Anthony Frankforter, dilution 1:1000) and anti-GFP (Invitrogen, 1:500) antibodies overnight and then labeled with appropriate Alexa Fluor-conjugated secondary antibodies. One retina served as negative secondary antibody control (data not shown). High-resolution Z-stacks were captured on a Nikon confocal microscope with the Nikon C1 software throughout the entire ganglion cell layer only. Z-stacks were collapsed using FiJi (Schindelin et al., 2012) and the whole image was adjusted for contrast and brightness using Adobe Photoshop.
Accessibility of Data
The data presented in this article is publicly available under www.genenetwork.org and can be downloaded under http://genenetwork.org/webqtl/main.py?FormID=sharinginfo&GN_AccessionId=709.
Author Contributions
FS, EG provided the initial design of the study. FS performed experiments and bioinformatic analyses with assistance from EG. FS, EG wrote the paper with input from RW and RL. RW supplied the datasets through the GeneNetwork platform and is responsible for its maintenance. RL has provided intellectual framework for this project as part of an ongoing collaborative effort between his laboratory and the laboratories of EG, RW.
Conflict of Interest Statement
The authors declare that the research was conducted in the absence of any commercial or financial relationships that could be construed as a potential conflict of interest.
Acknowledgments
This work was supported by DoD CDMRP Grant W81XWH1210255 from the USA Army Medical Research & Materiel Command and the Telemedicine and Advanced Technology (to EG), NIH Grant R01EY017841 (to EG), Vision Core Grant P30EY006360 (to P. Michael Iuvone), and Unrestricted Funds and a Stein Innovation Award from Research to Prevent Blindness (to the Ophthalmology Department at Emory University, the University of Tennessee Health Science Center, and the Bascom Palmer Eye Institute, University of Miami Miller School of Medicine). FS is supported by the institutional training grant T32EY007092-30 (to P. Michael Iuvone). The authors would like to thank Rebecca King for technical assistance with the retinal flat mounts and Dr. John Nickerson for his comments on the manuscript.
Supplementary Material
The Supplementary Material for this article can be found online at: http://journal.frontiersin.org/article/10.3389/fgene.2016.00169
References
Adams, L. D., Gong, W., Vechia, S. D., Hunter, R. G., and Kuhar, M. J. (1999). CART: from gene to function. Brain Res. 848, 137–140. doi: 10.1016/S0006-8993(99)01907-1
Baden, T., Berens, P., Franke, K., Román Rosón, M., Bethge, M., and Euler, T. (2016). The functional diversity of retinal ganglion cells in the mouse. Nature 529, 345–350. doi: 10.1038/nature16468
Bai, L., Xu, H., Collins, J. F., and Ghishan, F. K. (2001). Molecular and functional analysis of a novel neuronal vesicular glutamate transporter. J. Biol. Chem. 276, 36764–36769. doi: 10.1074/jbc.M104578200
Barnstable, C. J., and Dräger, U. C. (1984). Thy-1 antigen: a ganglion cell specific marker in rodent retina. Neuroscience 11, 847–855. doi: 10.1016/0306-4522(84)90195-7
Buckingham, B. P., Inman, D. M., Lambert, W., Oglesby, E., Calkins, D. J., Steele, M. R., et al. (2008). Progressive ganglion cell degeneration precedes neuronal loss in a mouse model of glaucoma. J. Neurosci. 28, 2735–2744. doi: 10.1523/JNEUROSCI.4443-07.2008
Chalupa, L. M., and Günhan, E. (2004). Development of On and Off retinal pathways and retinogeniculate projections. Prog. Retin. Eye Res. 23, 31–51. doi: 10.1016/j.preteyeres.2003.10.001
Chang, Z. Y., Yeh, M. K., Chiang, C. H., Chen, Y. H., and Lu, D. W. (2013). Erythropoietin protects adult retinal ganglion cells against NMDA-, trophic factor withdrawal-, and TNF-alpha-induced damage. PLoS ONE 8:e55291. doi: 10.1371/journal.pone.0055291
Cherry, T. J., Wang, S., Bormuth, I., Schwab, M., Olson, J., and Cepko, C. L. (2011). NeuroD factors regulate cell fate and neurite stratification in the developing retina. J. Neurosci. 31, 7365–7379. doi: 10.1523/JNEUROSCI.2555-10.2011
Daniele, L. L., Adams, R. H., Durante, D. E., Pugh, E. N. Jr., and Philp, N. J. (2007). Novel distribution of junctional adhesion molecule-C in the neural retina and retinal pigment epithelium. J. Comp. Neurol. 505, 166–176. doi: 10.1002/cne.21489
Dhande, O. S., Estevez, M. E., Quattrochi, L. E., El-Danaf, R. N., Nguyen, P. L., Berson, D. M., et al. (2013). Genetic dissection of retinal inputs to brainstem nuclei controlling image stabilization. J. Neurosci. 33, 17797–17813. doi: 10.1523/JNEUROSCI.2778-13.2013
Duan, X., Krishnaswamy, A., De la Huerta, I., and Sanes, J. R. (2014). Type II cadherins guide assembly of a direction-selective retinal circuit. Cell 158, 793–807. doi: 10.1016/j.cell.2014.06.047
Duan, X., Qiao, M., Bei, F., Kim, I. J., He, Z., and Sanes, J. R. (2015). Subtype-specific regeneration of retinal ganglion cells following axotomy: effects of osteopontin and mTOR signaling. Neuron 85, 1244–1256. doi: 10.1016/j.neuron.2015.02.017
Erkman, L., McEvilly, R. J., Luo, L., Ryan, A. K., Hooshmand, F., O'Connell, S. M., et al. (1996). Role of transcription factors Brn-3.1 and Brn-3.2 in auditory and visual system development. Nature 381, 603–606. doi: 10.1038/381603a0
Falk, J., Konopacki, F. A., Zivraj, K. H., and Holt, C. E. (2014). Rab5 and Rab4 regulate axon elongation in the Xenopus visual system. J. Neurosci. 34, 373–391. doi: 10.1523/JNEUROSCI.0876-13.2014
Farrell, S. R., Sargoy, A., Brecha, N. C., and Barnes, S. (2014). Modulation of voltage-gated Ca2+ channels in rat retinal ganglion cells by gabapentin. Vis. Neurosci. 31, 47–55. doi: 10.1017/S0952523813000588
Galic, M., Tsai, F. C., Collins, S. R., Matis, M., Bandara, S., and Meyer, T. (2014). Dynamic recruitment of the curvature-sensitive protein ArhGAP44 to nanoscale membrane deformations limits exploratory filopodia initiation in neurons. Elife 3:e03116. doi: 10.7554/elife.03116
Geisert, E. E., Lu, L., Freeman-Anderson, N. E., Templeton, J. P., Nassr, M., Wang, X., et al. (2009). Gene expression in the mouse eye: an online resource for genetics using 103 strains of mice. Mol. Vis. 15, 1730–1763. Available online at: http://www.molvis.org/molvis/v15/a185
Graybeal, C., Bachu, M., Mozhui, K., Saksida, L. M., Bussey, T. J., Sagalyn, E., et al. (2014). Strains and stressors: an analysis of touchscreen learning in genetically diverse mouse strains. PLoS ONE 9:e87745. doi: 10.1371/journal.pone.0087745
Guido, M. E., Garbarino-Pico, E., Contin, M. A., Valdez, D. J., Nieto, P. S., Verra, D. M., et al. (2010). Inner retinal circadian clocks and non-visual photoreceptors: novel players in the circadian system. Prog. Neurobiol. 92, 484–504. doi: 10.1016/j.pneurobio.2010.08.005
Guo, Z., Linn, J. F., Wu, G., Anzick, S. L., Eisenberger, C. F., Halachmi, S., et al. (2004). CDC91L1 (PIG-U) is a newly discovered oncogene in human bladder cancer. Nat. Med. 10, 374–381. doi: 10.1038/nm1010
Hasan, N., Corbin, D., and Hu, C. (2010). Fusogenic pairings of vesicle-associated membrane proteins (VAMPs) and plasma membrane t-SNAREs–VAMP5 as the exception. PLoS ONE 5:e14238. doi: 10.1371/journal.pone.0014238
Haverkamp, S., Inta, D., Monyer, H., and Wassle, H. (2009). Expression analysis of green fluorescent protein in retinal neurons of four transgenic mouse lines. Neuroscience 160, 126–139. doi: 10.1016/j.neuroscience.2009.01.081
Hoshino, M. (2012). Neuronal subtype specification in the cerebellum and dorsal hindbrain. Dev. Growth Differ. 54, 317–326. doi: 10.1111/j.1440-169X.2012.01330.x
Howell, G. R., Macalinao, D. G., Sousa, G. L., Walden, M., Soto, I., Kneeland, S. C., et al. (2011). Molecular clustering identifies complement and endothelin induction as early events in a mouse model of glaucoma. J. Clin. Invest. 121, 1429–1444. doi: 10.1172/JCI44646
Huberman, A. D., Manu, M., Koch, S. M., Susman, M. W., Lutz, A. B., Ullian, E. M., et al. (2008). Architecture and activity-mediated refinement of axonal projections from a mosaic of genetically identified retinal ganglion cells. Neuron 59, 425–438. doi: 10.1016/j.neuron.2008.07.018
Ip, B. K., Bayatti, N., Howard, N. J., Lindsay, S., and Clowry, G. J. (2011). The corticofugal neuron-associated genes ROBO1, SRGAP1, and CTIP2 exhibit an anterior to posterior gradient of expression in early fetal human neocortex development. Cereb. Cortex 21, 1395–1407. doi: 10.1093/cercor/bhq219
Jain, V., Ravindran, E., and Dhingra, N. K. (2012). Differential expression of Brn3 transcription factors in intrinsically photosensitive retinal ganglion cells in mouse. J. Comp. Neurol. 520, 742–755. doi: 10.1002/cne.22765
Ju, W. K., Kim, K. Y., Cha, J. H., Kim, I. B., Lee, M. Y., Oh, S. J., et al. (2000). Ganglion cells of the rat retina show osteopontin-like immunoreactivity. Brain Res. 852, 217–220. doi: 10.1016/S0006-8993(99)02140-X
Kay, J. N., De la Huerta, I., Kim, I. J., Zhang, Y., Yamagata, M., Chu, M. W., et al. (2011). Retinal ganglion cells with distinct directional preferences differ in molecular identity, structure, and central projections. J. Neurosci. 31, 7753–7762. doi: 10.1523/JNEUROSCI.0907-11.2011
Keeley, P. W., Whitney, I. E., Madsen, N. R., St John, A. J., Borhanian, S., Leong, S. A., et al. (2014). Independent genomic control of neuronal number across retinal cell types. Dev. Cell 30, 103–109. doi: 10.1016/j.devcel.2014.05.003
Kevenaar, J. T., and Hoogenraad, C. C. (2015). The axonal cytoskeleton: from organization to function. Front. Mol. Neurosci. 8:44. doi: 10.3389/fnmol.2015.00044
Kim, I. J., Zhang, Y., Yamagata, M., Meister, M., and Sanes, J. R. (2008). Molecular identification of a retinal cell type that responds to upward motion. Nature 452, 478–482. doi: 10.1038/nature06739
Kim, K. K., Yang, Y., Zhu, J., Adelstein, R. S., and Kawamoto, S. (2014). Rbfox3 controls the biogenesis of a subset of microRNAs. Nat. Struct. Mol. Biol. 21, 901–910. doi: 10.1038/nsmb.2892
King, R., Lu, L., Williams, R. W., and Geisert, E. E. (2015). Transcriptome networks in the mouse retina: an exon level BXD RI database. Mol. Vis. 21, 1235–1251. Available online at: http://www.molvis.org/molvis/v21/1235
Kveine, M., Tenstad, E., Døsen, G., Funderud, S., and Rian, E. (2002). Characterization of the novel human transmembrane protein 9 (TMEM9) that localizes to lysosomes and late endosomes. Biochem. Biophys. Res. Commun. 297, 912–917. doi: 10.1016/S0006-291X(02)02228-3
Langfelder, P., and Horvath, S. (2008). WGCNA: an R package for weighted correlation network analysis. BMC Bioinformat. 9:559. doi: 10.1186/1471-2105-9-559
Lipton, S. A., and Tauck, D. L. (1987). Voltage-dependent conductances of solitary ganglion cells dissociated from the rat retina. J. Physiol. 385, 361–391. doi: 10.1113/jphysiol.1987.sp016497
Mackey, E. D., Engle, S. E., Kim, M. R., O'Neill, H. C., Wageman, C. R., Patzlaff, N. E., et al. (2012). alpha6* nicotinic acetylcholine receptor expression and function in a visual salience circuit. J. Neurosci. 32, 10226–10237. doi: 10.1523/JNEUROSCI.0007-12.2012
Macosko, E. Z., Basu, A., Satija, R., Nemesh, J., Shekhar, K., Goldman, M., et al. (2015). Highly parallel genome-wide expression profiling of individual cells using nanoliter droplets. Cell 161, 1202–1214. doi: 10.1016/j.cell.2015.05.002
Matys, V., Kel-Margoulis, O. V., Fricke, E., Liebich, I., Land, S., Barre-Dirrie, A., et al. (2006). TRANSFAC and its module TRANSCompel: transcriptional gene regulation in eukaryotes. Nucleic Acids Res. 34:D108–D110. doi: 10.1093/nar/gkj143
Mellough, C. B., Cui, Q., Spalding, K. L., Symons, N. A., Pollett, M. A., Snyder, E. Y., et al. (2004). Fate of multipotent neural precursor cells transplanted into mouse retina selectively depleted of retinal ganglion cells. Exp. Neurol. 186, 6–19. doi: 10.1016/j.expneurol.2003.10.021
Mimura, Y., Mogi, K., Kawano, M., Fukui, Y., Takeda, J., Nogami, H., et al. (2002). Differential expression of two distinct vesicular glutamate transporters in the rat retina. Neuroreport 13, 1925–1928. doi: 10.1097/00001756-200210280-00019
Mojumder, D. K., Wensel, T. G., and Frishman, L. J. (2008). Subcellular compartmentalization of two calcium binding proteins, calretinin and calbindin-28 kDa, in ganglion and amacrine cells of the rat retina. Mol. Vis. 14, 1600–1613. Available online at: http://www.molvis.org/molvis/v14/a190
Munguba, G. C., Galeb, S., Liu, Y., Landy, D. C., Lam, D., Camp, A., et al. (2014). Nerve fiber layer thinning lags retinal ganglion cell density following crush axonopathy. Invest. Ophthalmol. Vis. Sci. 55, 6505–6513. doi: 10.1167/iovs.14-14525
Munguba, G. C., Geisert, E. E., Williams, R. W., Tapia, M. L., Lam, D. K., Bhattacharya, S. K., et al. (2013). Effects of glaucoma on Chrna6 expression in the retina. Curr. Eye Res. 38, 150–157. doi: 10.3109/02713683.2012.724512
Nuschke, A. C., Farrell, S. R., Levesque, J. M., and Chauhan, B. C. (2015). Assessment of retinal ganglion cell damage in glaucomatous optic neuropathy: axon transport, injury and soma loss. Exp. Eye Res. 141, 111–124. doi: 10.1016/j.exer.2015.06.006
Pérez de Sevilla Müller, L., Sargoy, A., Rodriguez, A. R., and Brecha, N. C. (2014). Melanopsin ganglion cells are the most resistant retinal ganglion cell type to axonal injury in the rat retina. PLoS ONE 9:e93274. doi: 10.1371/journal.pone.0093274
Picard, N., Leslie, J. H., Trowbridge, S. K., Subramanian, J., Nedivi, E., and Fagiolini, M. (2014). Aberrant development and plasticity of excitatory visual cortical networks in the absence of cpg15. J. Neurosci. 34, 3517–3522. doi: 10.1523/JNEUROSCI.2955-13.2014
Piri, N., Kwong, J. M., Song, M., and Caprioli, J. (2006). Expression of hermes gene is restricted to the ganglion cells in the retina. Neurosci. Lett. 405, 40–45. doi: 10.1016/j.neulet.2006.06.049
Puyang, Z., Chen, H., and Liu, X. (2015). Subtype-dependent morphological and functional degeneration of retinal ganglion cells in mouse models of experimental Glaucoma. J. Nat. Sci. 1, e103.
Qian, Y., Jung, Y. S., and Chen, X. (2012). Differentiated embryo-chondrocyte expressed gene 1 regulates p53-dependent cell survival versus cell death through macrophage inhibitory cytokine-1. Proc. Natl. Acad. Sci. U.S.A. 109, 11300–11305. doi: 10.1073/pnas.1203185109
Raymond, I. D., Vila, A., Huynh, U.-C. N., and Brecha, N. C. (2008). Cyan fluorescent protein expression in ganglion and amacrine cells in a thy1-CFP transgenic mouse retina. Mol. Vis. 14, 1559–1574. Available online at: http://www.molvis.org/molvis/v14/a186
Rodriguez, A. R., de Sevilla Müller, L. P., and Brecha, N. C. (2014). The RNA binding protein RBPMS is a selective marker of ganglion cells in the mammalian retina. J. Comp. Neurol. 522, 1411–1443. doi: 10.1002/cne.23521
Roychowdhury, S., and Rasenick, M. M. (2008). Submembraneous microtubule cytoskeleton: regulation of microtubule assembly by heterotrimeric Gproteins. FEBS J. 275, 4654–4663. doi: 10.1111/j.1742-4658.2008.06614.x
Ruiz-Ederra, J., García, M., Hicks, D., and Vecino, E. (2004). Comparative study of the three neurofilament subunits within pig and human retinal ganglion cells. Mol. Vis. 10, 83–92. Available online at: http://www.molvis.org/molvis/v10/a12/
Russ, J. B., and Kaltschmidt, J. A. (2014). From induction to conduction: how intrinsic transcriptional priming of extrinsic neuronal connectivity shapes neuronal identity. Open Biol. 4:140144. doi: 10.1098/rsob.140144
Sanes, J. R., and Masland, R. H. (2015). The types of retinal ganglion cells: current status and implications for neuronal classification. Annu. Rev. Neurosci. 38, 221–246. doi: 10.1146/annurev-neuro-071714-034120
Schappi, J. M., Krbanjevic, A., and Rasenick, M. M. (2014). Tubulin, actin and heterotrimeric G proteins: coordination of signaling and structure. Biochim. Biophys. Acta 1838, 674–681. doi: 10.1016/j.bbamem.2013.08.026
Schindelin, J., Arganda-Carreras, I., Frise, E., Kaynig, V., Longair, M., Pietzsch, T., et al. (2012). Fiji: an open-source platform for biological-image analysis. Nat. Methods 9, 676–682. doi: 10.1038/nmeth.2019
Schlamp, C. L., Montgomery, A. D., Mac Nair, C. E., Schuart, C., Willmer, D. J., and Nickells, R. W. (2013). Evaluation of the percentage of ganglion cells in the ganglion cell layer of the rodent retina. Mol. Vis. 19, 1387–1396. Available online at: http://www.molvis.org/molvis/v19/1387
Schwaibold, E. M., and Brandt, D. T. (2008). Identification of Neurochondrin as a new interaction partner of the FH3 domain of the Diaphanous-related formin Dia1. Biochem. Biophys. Res. Commun. 373, 366–372. doi: 10.1016/j.bbrc.2008.06.042
Semo, M., Muñoz Llamosas, M., Foster, R. G., and Jeffery, G. (2005). Melanopsin (Opn4) positive cells in the cat retina are randomly distributed across the ganglion cell layer. Vis. Neurosci. 22, 111–116. doi: 10.1017/S0952523805001069
Sharma, T. P., Liu, Y., Wordinger, R. J., Pang, I. H., and Clark, A. F. (2015). Neuritin 1 promotes retinal ganglion cell survival and axonal regeneration following optic nerve crush. Cell Death Dis. 6, e1661. doi: 10.1038/cddis.2015.22
Snow, R. L., and Robson, J. A. (1994). Ganglion cell neurogenesis, migration and early differentiation in the chick retina. Neuroscience 58, 399–409. doi: 10.1016/0306-4522(94)90046-9
Templeton, J. P., Freeman, N. E., Nickerson, J. M., Jablonski, M. M., Rex, T. S., Williams, R. W., et al. (2013a). Innate immune network in the retina activated by optic nerve crush. Invest. Ophthalmol. Vis. Sci. 54, 2599–2606. doi: 10.1167/iovs.12-11175
Templeton, J. P., Nassr, M., Vazquez-Chona, F., Freeman-Anderson, N. E., Orr, W. E., Williams, R. W., et al. (2009). Differential response of C57BL/6J mouse and DBA/2J mouse to optic nerve crush. BMC Neurosci. 10:90. doi: 10.1186/1471-2202-10-90
Templeton, J. P., Wang, X., Freeman, N. E., Ma, Z., Lu, A., Hejtmancik, F., et al. (2013b). A crystallin gene network in the mouse retina. Exp. Eye Res. 116, 129–140. doi: 10.1016/j.exer.2013.08.001
Triplett, J. W., Wei, W., Gonzalez, C., Sweeney, N. T., Huberman, A. D., Feller, M. B., et al. (2014). Dendritic and axonal targeting patterns of a genetically-specified class of retinal ganglion cells that participate in image-forming circuits. Neural Dev. 9:2. doi: 10.1186/1749-8104-9-2
Tu, C. C., Kumar, V. B., Day, C. H., Kuo, W. W., Yeh, S. P., Chen, R. J., et al. (2013). Estrogen receptor alpha (ESR1) over-expression mediated apoptosis in Hep3B cells by binding with SP1 proteins. J. Mol. Endocrinol. 51, 203–212. doi: 10.1530/JME-13-0085
Vanderlinden, L. A., Saba, L. M., Kechris, K., Miles, M. F., Hoffman, P. L., and Tabakoff, B. (2013). Whole brain and brain regional coexpression network interactions associated with predisposition to alcohol consumption. PLoS ONE 8:e68878. doi: 10.1371/journal.pone.0068878
Wang, J., Duncan, D., Shi, Z., and Zhang, B. (2013). WEB-based GEne SeT AnaLysis Toolkit (WebGestalt): update 2013. Nucleic Acids Res. 41, W77–W83. doi: 10.1093/nar/gkt439
Wässle, H., Regus-Leidig, H., and Haverkamp, S. (2006). Expression of the vesicular glutamate transporter vGluT2 in a subset of cones of the mouse retina. J. Comp. Neurol. 496, 544–555. doi: 10.1002/cne.20942
Wassmer, T., Attar, N., Harterink, M., van Weering, J. R., Traer, C. J., Oakley, J., et al. (2009). The retromer coat complex coordinates endosomal sorting and dynein-mediated transport, with carrier recognition by the trans-Golgi network. Dev. Cell 17, 110–122. doi: 10.1016/j.devcel.2009.04.016
Williams, E. G., and Auwerx, J. (2015). The convergence of systems and reductionist approaches in complex trait analysis. Cell 162, 23–32. doi: 10.1016/j.cell.2015.06.024
Williams, R. W., Gu, J., Qi, S., and Lu, L. (2001). The genetic structure of recombinant inbred mice: high-resolution consensus maps for complex trait analysis. Genome Biol. 2, RESEARCH0046
Williams, R. W., and Mulligan, M. K. (2012). Genetic and molecular network analysis of behavior. Int. Rev. Neurobiol. 104, 135–157. doi: 10.1016/B978-0-12-398323-7.00006-9
Wolf, H. K., Buslei, R., Schmidt-Kastner, R., Schmidt-Kastner, P. K., Pietsch, T., Wiestler, O. D., et al. (1996). NeuN: a useful neuronal marker for diagnostic histopathology. J. Histochem. Cytochem. 44, 1167–1171. doi: 10.1177/44.10.8813082
Xiang, M., Zhou, L., Peng, Y. W., Eddy, R. L., Shows, T. B., and Nathans, J. (1993). Brn-3b: a POU domain gene expressed in a subset of retinal ganglion cells. Neuron 11, 689–701. doi: 10.1016/0896-6273(93)90079-7
Yin, L., Unger, E. L., Jellen, L. C., Earley, C. J., Allen, R. P., Tomaszewicz, A., et al. (2012). Systems genetic analysis of multivariate response to iron deficiency in mice. Am. J. Physiol. Regul. Integr. Comp. Physiol. 302, R1282–R1296. doi: 10.1152/ajpregu.00634.2011
Young, M. J., and Lund, R. D. (1998). The retinal ganglion cells that drive the pupilloconstrictor response in rats. Brain Res. 787, 191–202. doi: 10.1016/S0006-8993(97)01473-X
Zagozewski, J. L., Zhang, Q., Pinto, V. I., Wigle, J. T., and Eisenstat, D. D. (2014). The role of homeobox genes in retinal development and disease. Dev. Biol. 393, 195–208. doi: 10.1016/j.ydbio.2014.07.004
Zhang, B., and Horvath, S. (2005). A general framework for weighted gene co-expression network analysis. Stat. Appl. Genet. Mol. Biol. 4:17. doi: 10.2202/1544-6115.1128. Available online at: http://dibernardo.tigem.it/files/papers/2008/zhangbin-statappsgeneticsmolbio.pdf
Zode, G. S., Kuehn, M. H., Nishimura, D. Y., Searby, C. C., Mohan, K., Grozdanic, S. D., et al. (2011). Reduction of ER stress via a chemical chaperone prevents disease phenotypes in a mouse model of primary open angle glaucoma. J. Clin. Invest. 121, 3542–3553. doi: 10.1172/JCI58183
Keywords: retinal ganglion cells, gene regulatory networks, transcription factors, recombinant inbred strain, subtypes
Citation: Struebing FL, Lee RK, Williams RW and Geisert EE (2016) Genetic Networks in Mouse Retinal Ganglion Cells. Front. Genet. 7:169. doi: 10.3389/fgene.2016.00169
Received: 01 June 2016; Accepted: 06 September 2016;
Published: 28 September 2016.
Edited by:
Igor Ponomarev, University of Texas at Austin, USAReviewed by:
Claudio V. Mello, Oregon Health & Science University, USAMichael F. Miles, Virginia Commonwealth University, USA
Copyright © 2016 Struebing, Lee, Williams and Geisert. This is an open-access article distributed under the terms of the Creative Commons Attribution License (CC BY). The use, distribution or reproduction in other forums is permitted, provided the original author(s) or licensor are credited and that the original publication in this journal is cited, in accordance with accepted academic practice. No use, distribution or reproduction is permitted which does not comply with these terms.
*Correspondence: Eldon E. Geisert, ZWdlaXNlckBlbW9yeS5lZHU=
 Felix L. Struebing
 Richard K. Lee2
 Robert W. Williams
 Eldon E. Geisert