
95% of researchers rate our articles as excellent or good
Learn more about the work of our research integrity team to safeguard the quality of each article we publish.
Find out more
ORIGINAL RESEARCH article
Front. Genet. , 16 May 2012
Sec. Toxicogenomics
Volume 3 - 2012 | https://doi.org/10.3389/fgene.2012.00085
This article is part of the Research Topic Toxicogenomics in non-mammalian species View all 11 articles
A commentary has been posted on this article:
Erratum: Functional environmental genomics of a municipal landfill soil
 Dick Roelofs1*
 Muriel de Boer1
 Valeria Agamennone1
 Pascal Bouchier1
 Juliette Legler2
 Nico van Straalen1
We investigated the toxicity of soil samples derived from a former municipal landfill site in the South of the Netherlands, where a bioremediation project is running aiming at reusing the site for recreation. Both an organic soil extract and the original soil sample was investigated using the ISO standardized Folsomia soil ecotoxicological testing and gene expression analysis. The 28 day survival/reproduction test revealed that the ecologically more relevant original soil sample was more toxic than the organic soil extract. Microarray analysis showed that the more toxic soil samples induced gene regulatory changes in twice as less genes compared to the soil extract. Consequently gene regulatory changes were highly dependent on sample type, and were to a lesser extent caused by exposure level. An important biological process shared among the two sample types was the detoxification pathway for xenobiotics (biotransformation I, II, and III) suggesting a link between compound type and observed adverse effects. Finally, we were able to retrieve a selected group of genes that show highly significant dose-dependent gene expression and thus were tightly linked with adverse effects on reproduction. Expression of four cytochrome P450 genes showed highest correlation values with reproduction, and maybe promising genetic markers for soil quality. However, a more elaborate set of environmental soil samples is needed to validate the correlation between gene expression induction and adverse phenotypic effects.
The focus of ecotoxicological research is aimed at understanding toxicological phenomena in a variety of biota (Fent, 2004). Much emphasis is placed on lab-controlled testing of single compounds to address regulatory issues of chemical registration. However, testing the toxicity of complex environmental samples such as fresh water, river sediments, and natural soils remains challenging for several reasons. One of the major problems is that chemical analysis of pollutants in ecosystems often reveals an extensive list of toxicants that are potentially hazardous. Although legislation is based on the concept of concentration thresholds that must not be exceeded to ensure that the site is safe, such analysis cannot provide evidence for the real toxicological consequences of complicated mixtures. One of the valuable tools to assess ecotoxicological consequences of complex environmental mixtures is to apply bioassays. In such assays, survival and reproduction is studied of model organisms (validated in international standard tests), exposed to samples from the environment under controlled conditions. However, identification of the compound(s) causing the adverse effects among the potential list of compounds in a mixture is challenging, due to the fact that the endpoints survival, growth, and reproduction are not specific to the type of stress exerted on the test animals. Traditional bioassays do not allow conclusions on the nature of the chemicals causing the effects.
Transcriptional profiling seems to have important advantages over traditional bioassays. Several recent studies provided evidence that transcriptome profiles bear a signature of the type of pollution (Owen et al., 2008; Nota et al., 2010). If combined with traditional endpoints, genomics analysis of exposed animals can link adverse effects at the organismal level to mechanistic explanation. However, up to now this is only exemplified for single-compound exposures (van Straalen and Roelofs, 2008).
To simulate more realistic ecotoxicological scenarios, some recent studies have investigated toxic effects at the gene regulatory level of compounds presented in binary mixtures. For instance, trinitrotoluene (TNT) mixed with an additional explosive trinitrotriazacyclohexane (RDX) radically altered the gene expression profile of the ecotoxicological model organism Eisenia fetida when compared to single TNT exposure (Gong et al., 2007). While TNT alone regulated 321 genes, the mixture decreased the count to only three genes. These results implied a strong antagonistic effect of RDX on gene expression induced by TNT. In contrast, mixture toxicity studies with compounds proposed to have comparable modes of action should generate comparable transcriptional responses. Indeed, when Daphnia magna was exposed to two polycyclic aromatic hydrocarbons (fluoranthene and pyrene) no clear distinction could be made between the compounds, suggesting similar molecular modes of action (Vandenbrouck et al., 2010). Furthermore, cluster analysis with both the single compounds and the binary mixture treatments resulted in a separation of treatments based on differences in toxic ratios rather than component differences. However, the results were highly dependent on the composition of the binary mixture. In any case, these lab-controlled experiments suggest that transcriptomics may prove valuable in determining the most toxic substances among complex environmental samples.
Only few studies (restricted to aquatic samples and river sediments) have addressed gene regulatory consequences of exposure to complex environmental samples. Menzel et al. (2009) studied exposure of nematodes to polluted and clean river sediments and showed that several biological processes, such as oxidative phosphorylation, xenobiotics, and development in response to exposure to the most polluted samples. This demonstrates that ecotoxicogenomics can be used to distinguish pollution levels in river sediments. To our knowledge, such an approach has not yet been applied to assess soil quality.
In the present study we investigated the toxicity of soil samples derived from a former municipal landfill site in the South of the Netherlands, where a bioremediation project is running aiming at reusing the site for recreation. Very recently, Legler et al. (2011) investigated this complex environmental sample to study the substances that cause toxicity using effect-directed analysis. They identified the presence of compounds (11H-benzo[b]fluorene, 9-methylacridine, 4-azapyrene, and 2-phenylquinoline) with previously unknown teratogenic toxicity in zebrafish. They concluded that these compounds may have been missed by current soil chemical quality assessment.
Here we present toxicogenomic data using the soil ecotoxicological model organism Folsomia candida. We asked the question whether an original soil sample exerts comparable toxic responses in our soil ecotoxicological model when compared to the toxic responses exerted upon exposure to the organic extract from that soil (Legler et al., 2011). If this is the case, analysis of extracts will have predictive power to estimate adverse effects in the field (Fent, 2004). To that end, the arthropods were exposed to an organic soil extract and the original Vlagheide soil sample. Results from a 28 day survival/reproduction test revealed differences in toxicity between the organic extract and the ecologically more relevant original soil sample. The more toxic soil samples induced gene regulatory changes in twice as less genes compared to the soil extract. Despite these differences several gene categories (biological processes) were shared among the two samples. In addition, a substantial number of genes were dependent on sample type (soil or extract), potentially explaining the difference in toxicity. Our results show that bioassays deploying functional genomics can reveal crucial information on the nature of the toxicants. Furthermore, we argue that it is essential to include ecologically relevant test organisms in order to properly assess the risk of environmental samples.
The Vlagheide municipal waste landfill site is located about 10 miles South-East from ‘s-Hertogenbosch, the Netherlands. Haskoning B.V. sampled the site in October 2005 at depths varying from 3 to 18 m. In total seven soil samples were taken and pooled, sieved (mesh size 250 μm), homogenized, and freeze-dried to end up as a composite sample of approximately 1 kg dry weight. In order to retrieve an extract the sample was subjected to pressurized liquid extraction an accelerated solvent extraction (ASE) apparatus (Dionex, ASE200, Sunnyvale, CA, USA) with a mixture of acetone and dichloromethane in a 1:3 ratio. The extract was then subjected to gel permeation chromatography (GPC) clean-up with dichloromethane (Legler et al., 2011). An overview of concentrations of persistent organic pollutants such as polychlorinated biphenyls, polycyclic aromatic hydrocarbons, brominated flame retardants, and organochlorine pesticides in the composite sample have been published elsewhere (Legler et al., 2011). Several metals were measured in three samples and were present at variable levels depending on the depth of sampling. Mean concentrations of lead, cadmium, zinc, and copper were 1751, 29, 3060, and 761 mg/kg soil respectively. A full overview of metal measurements and soil parameters is given in datasheet Table S1 in Supplementary Material.
Treatments consisted of two separate dilution series, the first being a series of diluted whole environmental Vlagheide soil, and the second being a series of LUFA 2.2 reference soil spiked with the extract derived from composite Vlagheide soil sample according to Droge et al. (2006) using acetone as solvent.
For the 100% extract treatment, an extract derived from 100 g (d.w.) Vlagheide soil was spiked-in 100 g (d.w.) LUFA 2.2 soil. For the 100% soil treatment, we used sieved and freeze-dried Vlagheide soil. Using LUFA 2.2 soil for dilution, we employed a dilution factor of 2.5 to prepare five additional treatments within each series, resulting in a 40, 16, 6.4, 2.56, and 0% dilution of both undiluted extract and soil treatments. The control (0%) sample was 100% LUFA 2.2 soil in case of the Soil sample dilution series, whereas the control for the Extract dilutions was a solvent control consisting of LUFA 2.2 soil including acetone (the solvent) in an identical amount as was used for the extract dilution series. In this way we were able to normalize for the effect of the solvent during the spike-in procedure of the extract samples (Droge et al., 2006).
Preparation of the test soils and experimental set-up was done following the standard ISO protocol 11267 (ISO, 1999), with four biologically replicated test jars per treatment. The standard ISO test procedure for inhibition of reproduction after 28 days was followed. In parallel, we exposed 10 animals in each of four biological replicate jars per treatment, for 4 days on top of a compressed layer of test soil. These arthropods were snap frozen in liquid nitrogen immediately after exposure so that total RNA could be isolated (see below) for subsequent Microarray and QPCR analysis.
A logistic model was fitted to estimate toxicity end points no-effect concentration (NOEC) and a significant sublethal decrease in reproduction (DiR) for extract samples and soil samples of 50% (further deduced as DiR).
Samples (Lufa control, NOEC; sublethal effects DiR) were subjected to RNA extraction using the SV Total RNA Isolation System (Promega) according to the manufacturer’s instructions. Agilent RNA Spike-In Kit (Agilent Technologies) was used to prepare Spike A Mix and Spike B Mix in order to normalize the hybridization measurements. Approximately, 50 ng input of total RNA was used for amplification and labeling with Agilent’s Low Input Quick Amp Labeling Kit. The RNA was reverse transcribed into cDNA and treated with a T7 RNA polymerase to incorporate cyanine 3- or cyanine 5-labeled CTPs in the synthesized cRNA, which was purified with RNeasy (Qiagen) and quality controlled using spectrophotometric measurements on a NanoDrop 2000 (Thermo scientific). Hybridization of 8 × 15 K format microarray slides was performed with 300 ng cyanine 3-labeled cRNA and 300 ng cyanine 5-labeled cRNA according to manufacturer’s protocol (Agilent). The design of the microarray is described by Nota et al. (2009) and details can be found under Gene Expression Omnibus (GEO) platform number GPL7150. A replicate reference design was used (Figure 1) so that each treatment sample was competitively hybridized against a control sample (Lufa 2.2). The design included dye-swapped biological replicates. Two slides of the 8 × 15 K Agilent microarray platform, containing 5069 unique gene probes in triplicate, was used for soil samples and extract samples (Figure 1). Hybridization was performed at 65°C for 17 h rotating at 10 rpm in an incubator. Following the hybridization, the slides were washed using Gene Expression wash buffers and scanned on an Agilent DNA Microarray Scanner. The microarray scan images were preprocessed with Feature Extraction software (version 10.5.1.1.) and the obtained Fold changes were subjected to further statistical analyses. The data was submitted to NCBI’s GEO and can be retrieved under accession number GSE37154.
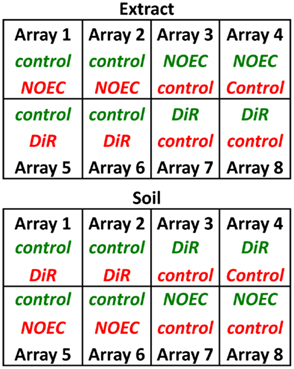
Figure 1. Hybridization scheme for gene expression analysis. On each of the arrays, a test sample (NOEC or DiR) of either Soil or Extract is hybridized against a control sample (Lufa 2.2 for Soils; acetone spiked-in Lufa 2.2 for extracts). Green Cy-3, Red Cy-5.
Statistical analysis of microarray data was performed using the Limma package in R environment (version 2.13.0, Wettenhall and Smyth, 2004). The data were normalized to account for dye bias with the global loess method and the significance of gene expression was verified for each of the soil and extract dataset by a modified t-test using Bayesian statistics two-way analysis of variance (ANOVA) with factors sample type and treatment as main factors. All calculated probabilities were corrected for multiple testing using Benjamini and Hochberg’s false discovery rate procedure at the level of p < 0.05 (Benjamini and Hochberg, 1995). Each probe was assigned a mean log2 expression ratio and an adjusted p-value. Gene annotation was performed in R using a Blast2go script. Subsequently, a GO term Enrichment Analysis was performed by applying the TopGO algorithm on significant gene lists (Alexa et al., 2006; de Boer et al., 2011a) to assess which biological processes, molecular functions, and cellular components were mostly affected. The TIGR MultiExperiment Viewer (TIGR Mev version 4.6.2; Saeed et al., 2006) was used to perform cluster analysis in order to define groups of genes that share common patterns of expression. Hierarchical clustering was done using Euclidean distance and average linkage method. Heat maps were used to represent the data. A general linear model was used to investigate the interaction between factors affecting the variability in the data with the factors Sample type (Extract or Soil), treatment (NOEC or DiR), and the Sample X Treatment interaction according to de Boer et al. (2011a). Finally, a Principal Component Analysis (PCA) in TIGR Mev allowed the identification of factors that most contribute to the variability in the data.
Quantitative PCR (QPCR) was performed using a selected group of genes according to de Boer et al. (2011b) on a Biomark HD system (Fluidigm). Information on gene description and PCR primer sequence can be found in Table 2 of the results section. Quantitative analyses of cycle threshold (Ct) values were performed with the software package Genex Light 4.3.5 (Multi ID analysis) according to de Boer et al. (2011b). First, the three technical replicates were averaged over each sample. Efficiency corrections were applied on the mean Ct values using PCR efficiency values previously established and published by de Boer et al. (2011b). Subsequently, gene expression values were assessed relative to an internal reference by normalization with the geometric mean of the housekeeping genes SDHA and YWAZ (de Boer et al., 2009). Finally, the Log2 transformed normalized gene expression values were subjected to statistical analysis in SPSS version 17 (IBM). Linear regression was applied to assess dose-dependency. The residuals were tested for normality using a Kolmogorov–Smirnov test. A one-way ANOVA was applied to test whether expression values were significantly different between sample type (Extract or Soil).
The effects of the original soil from the landfill and its extract on reproduction of Folsomia candida were assessed in an ISO standardized 28 days toxicity test. Figure 2 shows the dose-response curves resulting from exposure to Soil (blue) and Extract (red) samples. The different shapes of the lines clearly indicate a difference in toxicity between the two kinds of samples. The original soil samples show a clearer dose-dependence and appear to be more toxic compared to the organic extracts.
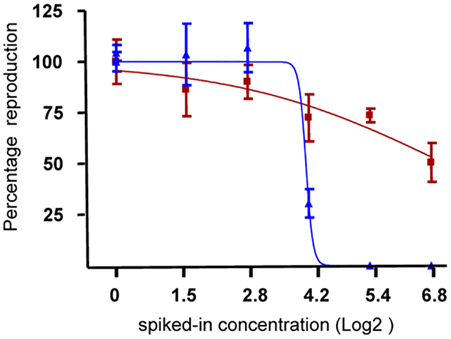
Figure 2. Effect of soil and extract on reproduction of F. candida. Red dots indicate the number of F. candida juveniles in the jars after 28 days exposure to six dilutions of soil samples. Blue dots indicate the number of juveniles retrieved after 28 days exposure to dilutions of extract samples. The lines indicate the dose–response curves derived from a logistic model. x-Axis, Log2 transformed spiked-in concentrations; y-axis, percentage reproduction scaled to the control samples (set at 100%).
The NOEC and the 50% DiR were deduced for each sample type and a spike-in concentration of 6.4% was taken as NOEC for both Extract and Soil exposures. Furthermore, DiR was observed at 100% spike-in Extract, whereas 16% of spiked-in Soil concentration did not significantly deviate from the 50% DiR estimated by the logistic model for Soil toxicity and was thus taken for further investigations at the molecular level.
Figure 3 shows the number of genes that were differentially expressed in response to toxic exposure in Soil and Extract samples. Regarding the Soil exposure 109 genes were significantly regulated in response to both NOEC and DiR concentration, of which 76 were up-regulated and 33 were down-regulated. Moreover, 354 genes were only regulated at the NOEC level and 521 genes were only regulated at the DiR level. Intriguingly, exposure to Extracts caused differential expression of an increased amount of genes as compared to Soil exposure. As much as 1581 genes were significantly regulated in response to both NOEC and DiR, of which 747 were up-regulated and 834 down-regulated. Moreover, 613 genes were only regulated at NOEC level and 536 exclusively regulated at DiR level in the Extracts.
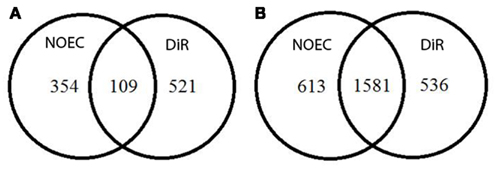
Figure 3. Venn diagrams showing the number of genes responding to NOEC and DiR levels of toxicants in the Soil exposure (A) and in Extract exposure (B).
Subsequently, the two-way ANOVA with factors Sample type (Extract or Soil) and Treatment (NOEC or DiR) was applied to identify genes only affected by Sample type or Treatment, and to assess whether genes exerted a Sample X Treatment interaction. In total 1929 were affected onle by Sample type (Soil, Extract), while 396 genes were exclusively regulated by Treatment (NOEC, DiR). In addition, 400 genes showed a significant Sample x Treatment interaction. Heat maps of significantly regulated genes for these three factors are represented in Supplementary data.
Table 1 shows the Gene Ontology terms for biological processes enriched in the significant gene lists for treatment, sample type, and the interaction.
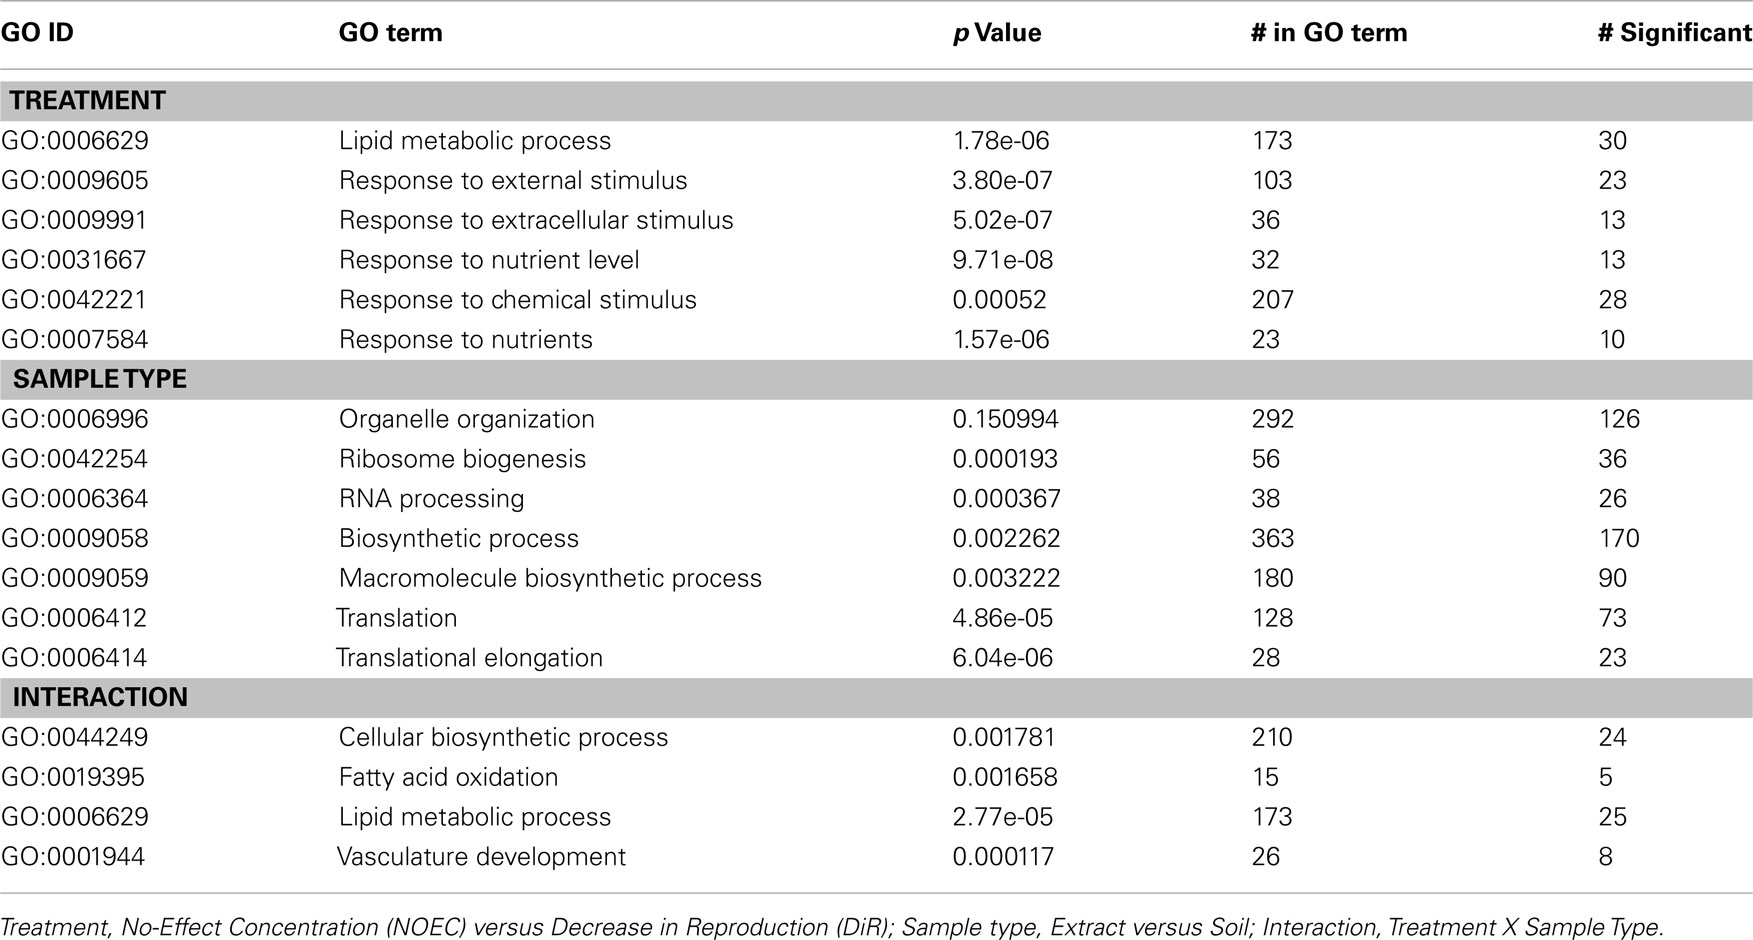
Table 1. Gene Ontology (GO) terms for biological processes that are over represented in the lists of significant transcripts and their P-values as obtained using the R package topGO (Alexa et al., 2006).
Some of the biological processes that were differentially affected by different treatments (low and high level of exposure) are lipid metabolism, response to nutrient level, response to chemical stimulus. The exposure to contaminated samples had a strong impact on 368 genes in both kinds of samples (soil and extract). Glucosyl glucuronosyl transferases (Fcc00734, biological process “lipid metabolism”) and superoxide dismutase (Fcc01344, biological process “response to nutrient level”), for example, were both affected by the exposure, being differentially expressed in response to different toxic levels.
On the other side, other biological processes were found to be affected mainly by the difference in sample type: 1929 genes showed different responses between soil and extract samples. These genes are referable to biological processes such as RNA processing, biosynthetic processes, translation, and translational elongation. For instance, isopenicillin-N-synthetase (Fcc00057), translation initiation factor (Fcc00062), and ribosomal proteins (Fcc00498, Fcc00410) were differentially affected by the exposure in soil and extract samples.
Figure 4 shows an acyclic graphs resulting from the enrichment analysis referring to biological processes affected in the context of the interaction between sample type and level of exposure. The most significant ones are lipid metabolic processes (such as fatty acid metabolism and fatty acid oxidation), cellular biosynthetic processes, organic acid metabolic processes, regulation of body fluid, vascular development, and response to wounding.
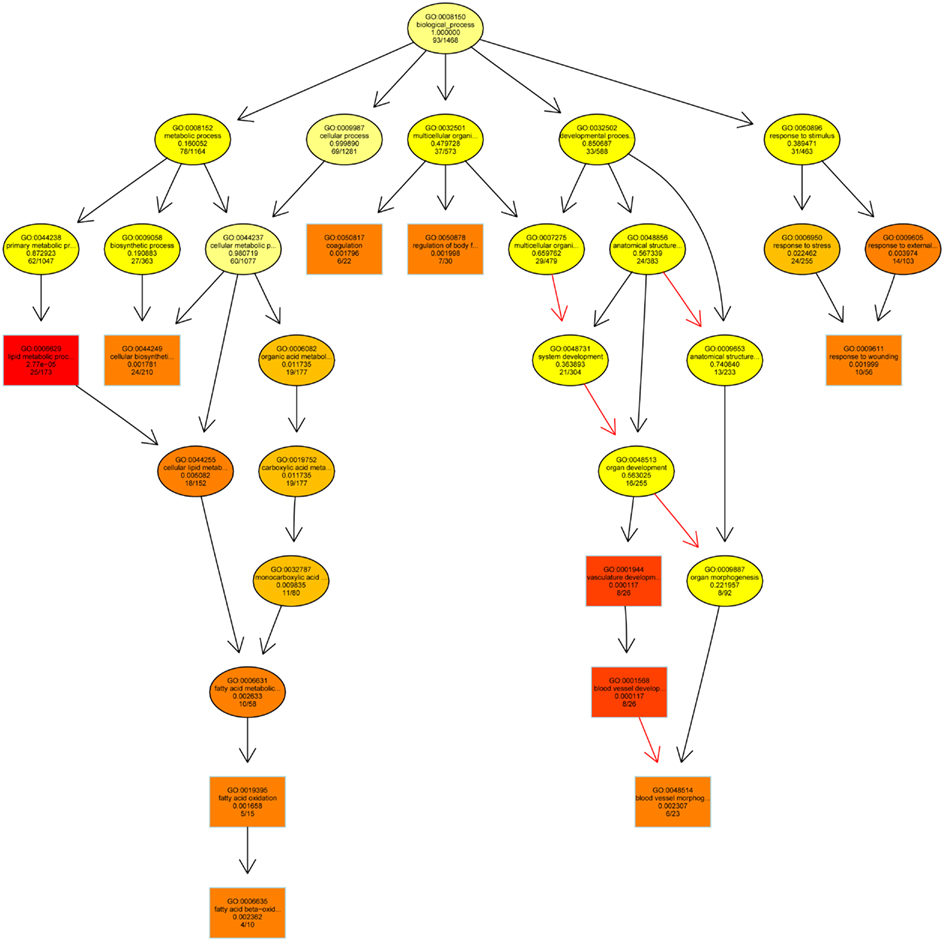
Figure 4. Acyclic graph resulting from the Enrichment Analysis and showing the biological processes mostly affected by an interaction between sample type (Soil, Extract) and treatment (NOEC, DiR). Increasing coloring toward red represents increasing significance levels. Each sphere contains GO ID, description, significance level, and ratio regulated: total genes in GO ID.
Some significant genes were found to respond to the toxic exposure in either kind of sample type, at both high and low levels of exposure. Up-regulation of heat-shock proteins (Fcc05793), ubiquitins (Fcc02887), biotransformation enzymes (Fcc01651, Fcc04073, Fcc5260), and components of the antibiotic biosynthetic pathway (Fcc00057, Fcc00170, Fcc05968) was observed. On the contrary, hedgehog, antimicrobial genes, and molecular chaperones were down-regulated.
A PCA was then performed in order to explore how the two factors affect each other and to identify prevalent expression profiles among samples. Figure 5 is the output of the PCA and shows that the 58% of the variation in the data can be explained by the two factors sample type and exposure level.
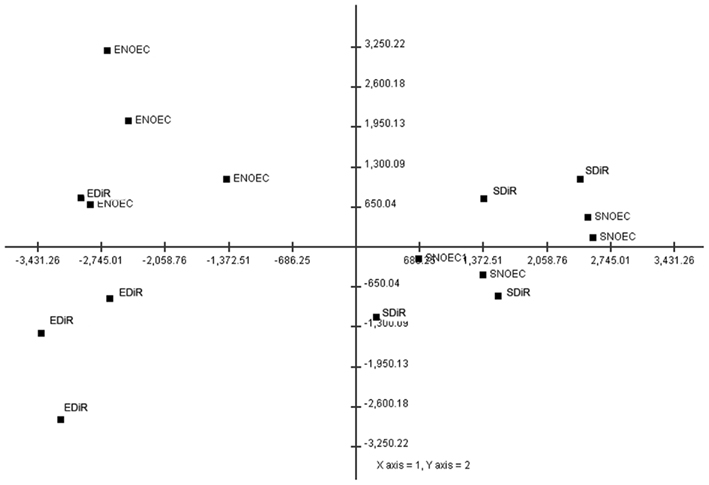
Figure 5. Distribution of the samples in the space defined by two main components (axis) resulting from a Principal Component Analysis. The labels indicate the sample type; ENOEC, extract no-effect concentration; SNOEC, soil no-effect concentration; EDiR extract 50% decrease in reproduction; SDiR soil 50% decrease in reproduction. The localization of the points in the space suggests that these two factors are mainly responsible for the distribution of the data.
From the microarray analysis it became apparent that some genes show a dose-dependent regulation in response to both soil and extract. For instance, CYP6N4v1 (Fcc01651) transcription, significantly increased two fold with increasing exposure level. We therefore decided to assay this gene using a QPCR assay in all extract- and soil sample concentrations (expression data are provided in datasheet Table S2 in Supplementary Material). Figure 6 shows CYP6N4v1 expression as all exposure levels in extract (Figure 6A) and soil (Figure 6B) samples. The QPCR profiles significantly correlated with the dose-dependent induction as observed in the microarray data (Spearman’s Rho 0.74, p < 0.05). Linear regression analysis of expression level with exposure showed a highly significant (p < 0.001) correlation between CYP6N4v1 gene expression induction and increased exposure level (extract R = 0.89; soil R = 0.92), while the residuals did not significantly differ from normal distribution (data not shown). Subsequently, we decided to assay more genes related to biotransformation, previously identified by de Boer et al. (2011b) (expression data are provided in datasheet Table S2 in Supplementary Material). They are summarized in Table 2. Interestingly, transcriptional activation of three additional cytochrome P450s (CYP6N3v1, CYP2P3, CYP9/6) showed highly significant correlations with both extract and soil concentration. Particularly, CYP6N3v1 gene activation showed the highest correlation (R = 0.99, extract Figure 6C; R = 0.96, soil Figure 6D) with increased exposure levels (Table 2), despite the fact that this gene did not show dose-dependent transcriptional activation in the microarray experiment. This was probably due to detection limitations of the microarray technology, because the hybridization intensities were not above background levels. Moreover, alcohol dehydrogenase, deoxynucleoside kinase, transcription factor CCCTC-binding protein, phosphoserine amino transferase, and haloacid dehalogenase-like hydrolase showed highly significant dose-dependent transcriptional regulation (Table 2).
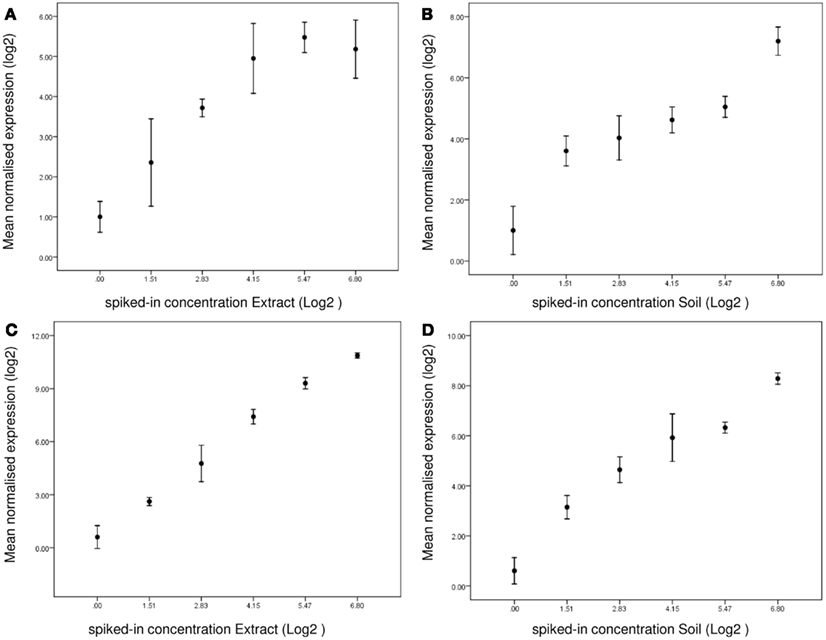
Figure 6. Linear regression of gene expression as deduced from the QPCR measurements. (A) CYP6N4v1 expression in response to Extracts; (B) CYP6N4v1 expression in response to Soils; (C) CYP6N3v2 expression in response to Extracts. (D) CYP6N3v2 expression in response to Soils. X-axis, Log2 transformed spiked-in concentrations. Y-axis, Log2 normalized gene expression.
Finally we identified nine genes that showed a significant (one-way ANOVA, p < 0.02) sample type effect. Among these, the gene ubiquitin ligase E3 alpha (Fcc06380) indicated an increased general stress–response in soil samples. Also, developmental processes were increasingly affected due to the increased transcriptional activation of crossveinless-2 BMP binding protein (Fcc04834) and LMBR1 domain containing 2 (Fcc03839, associated with hedgehog transcriptional regulation). Although, direction of regulation (up- or down-regulation) was in concordance between the QPCR data and microarray data for most of the genes, we could be confirmed significant sample type-specific regulation for LMBR1 domain containing 2, ABC transporter (Fcc06002), Laminin A (Fcc00086). To conclude, we were able to indentify and confirm treatment specific and sample type specified gene expression assays by considering both (microarray and QPCR) gene expression analysis platforms.
Here we presented a full ecotoxicogenomics assessment of a complex environmental sample and identified large differences between the unprocessed, ecologically more relevant, raw soil, and an organic total extract. The extract samples showed a clearly different level of toxicity when compared with the original soil sample. As such, extract samples may have only weak predictive power to estimate the actual toxicity status in the field. The soil sample is highly contaminated with organic micropollutants such as polychlorinated biphenyls, organochlorine pesticides, and one brominated flame retardant (Legler et al., 2011). Heavy metals are also elevated in the soil sample, including lead, copper, cadmium, and zinc. The exact chemical composition of the extract is not known, however due to the nature of the organic extraction procedure, metals are expected to be removed from the extract (Hubert et al., 2000). Moreover, microarray analysis generated important mechanistic information that can explain this discrepancy in toxicological effects. In combination with the QPCR data, we can conclude that developmental processes, fatty acid metabolism, and defense processes are adversely affected depending on which sample type was analyzed. Indeed, most of the genes (1929) were regulated in response to sample type. This is reflected in the PCA graph (Figure 5) where the first principle component explaining 42% of the variance divides the samples into either Extract or Soil. As much as 395 genes showed treatment-specific-regulation. Among them are genes (CYP6N4v1) that show a highly significant dose-dependent transcriptional activation, which was confirmed by QPCR analysis. Such genes may proof invaluable as genetic markers for soil pollution assessment.
The ISO standardized Folsomia test resulted in a consistent difference in toxicity between soil samples and organic extracts, with the former being much more toxic than the latter. This confirms the concern raised in earlier reports that toxicity tests based on extracts may generate uncertain levels of protection due to the fact that they do not address bioavailability of the original sample (Fent, 2004). The reason for this result could lie in differences in the availability of the toxic compounds between the original landfill soil and the natural soil spiked with the organic extracts, or in the loss of some of these substances during the extraction procedure. The extraction method using acetone/dichloromethane does not remove all toxic compounds; therefore it is likely that part of the soil toxicity is due to polar substances such as hydrophilic xenobiotic compounds and/or heavy metals.
A considerable difference was found between the two kinds of samples, concerning the number of genes affected by the exposure. This is in accordance with a recently published survey of ecotoxicogenomics studies by Van Straalen and Feder (2012), who showed that in most studies expression profiles at sublethal toxic effects of 10% DiR (EC10) and EC50 cluster together, while the main differences can be observed between sample type. Soil samples evoked gene regulatory changes in more than one order of magnitude fewer genes than the extract samples although we aimed to assess the two sample types at similar toxicity levels (NOEC and DiR of around 50% reduced reproduction). Due to the steepness of the logistic model through the soil toxicity data we may have chosen a soil sample that exerts more toxic effects than the DiR in Extact, although DiR in Soil did not significantly deviate from 50% DiR deduced from the logistic model. It is worth to mention that Nota et al. (2009) studied the effects of phenanthrene on F. candida and also found a smaller number of differentially expressed genes in response to high toxic concentration. Very recently, we obtained a similar result in a toxicogenomic study assessing stress–responses in F. candida exposed to the anti inflammatory drug Diclofenac (Roelofs et al. unpublished data). The explanation for this drop in transcriptional regulation needs further investigation. We speculate that higher toxic levels induce intense detoxification responses in the organisms, thus leaving less energy for other less essential processes, although Timmermans et al. (2009) showed that increased desiccation stress strongly increased the number of up- and down-regulated genes.
Some interesting biological processes were influenced by the exposure to contaminated samples. The GO term “lipid metabolic process” includes the chemical reaction and pathways involving all kinds of lipids. It is the biological process most significantly affected in this study. Within living systems, polar lipids have a fundamental structural role, being the main constituents of biological membranes. Furthermore, apolar lipids act as a reserve of energy. Lipid metabolism is regulated in order to ensure the correct balance between degradation and synthesis of lipids, according to the needs of the cells and of the whole organism. When facing environmental stress, an organism will activate a series of stress–response mechanisms in order to face the new conditions. These processes require energy and this might explain the changes in lipid metabolism suggested by the gene expression pattern. In fact, within this GO term category, we found a series of significant genes linked to lipid metabolism and transport. For example, Enoyl-CoA hydratase was found to be up-regulated in response to toxicant exposure: this enzyme is very efficient in metabolizing fatty acids to produce acetyl CoA and energy (Agnihotri and Liu, 2003), so it might be up-regulated in order to sustain the energy-requiring processes. On the other side, fatty acid desaturase, that causes increase of unsaturated bonds in fatty acids of membranes (Los and Murata, 1998), was found to be down-regulated, probably because the double bonds in fatty acids are a target of oxidative stress. Another interesting biological process is “response to wounding,” which includes any process resulting from a stimulus indicating damage of the organism. Within this group we found, for example, hedgehog, a developmentally active transcription factor that plays a vital role during early embryonic stages (Tabata and Kornberg, 1994). The hedgehog signaling pathway is intimately linked to cell growth and differentiation, so this protein could also be involved in the healing response. Vascular development is another significantly affected biological process. Springtails do not have a vascular system; thus it is difficult to translate this biological process to an invertebrate response. In fact, in this category we find hypoxia-inducible factor, a transcription factor that responds to changes in the level of available oxygen and mediates responses to hypoxia (Jiang et al., 1996). Furthermore, matrix metalloproteinase are represented in this category. This family of enzymes hydrolyze components of the extracellular matrix and play a central role in many biological processes, such as embryogenesis, normal tissue remodeling, wounding, etc (Nagase and Woessner, 1999). When investigating the single genes that fall into a GO term, it is interesting to notice that many of them are actually annotated to more than one term, and this in fact can be seen as a reflection of the number of interconnections that exist between different kinds of stress–responses. For example, within the context of lipid metabolism, a series of genes are annotated that are responding to different kinds of stress: glucosyl glucuronosyl transferases (involved in phase II metabolism of xenobiotics), glutathione S transferases, CYP450, catalases, dismutases, and other gene products found, by other authors, to be associated to oxidative stress or exposure to toxicants.
Some significant genes were found to both high and low levels of exposure in either kind of sample, soil and extract. Heat-shock proteins, that are part of the general stress–response and have a chaperone function (Feder and Hofmann, 1999), were always found to be up-regulated. A similar result was observed for ubiquitins, regulatory proteins that are involved in the degradation of damaged or unneeded proteins (Glickman and Ciechanover, 2002). An increase in expression of enzymes responsible for biotransformation and detoxification reactions was also observed in all cases of exposure. Mono-oxygenases such as cytochrome P450 for phase I, conjugation enzymes for phase II and ABC transporters for phase III were all found to be significantly up-regulated in contaminated samples compared to the control ones. These enzymes are responsible for the detoxification of organic compounds, so their induction is expected in case of exposure to organic xenobiotic substances (Xu et al., 2005). Interestingly, two components of the antibiotic biosynthetic pathway were found to be up-regulated in soil samples: aminoadipyl–cysteinyl–valine synthetase and isopenicillin-N-synthetase. Cathepsins, a family of proteases that break apart other proteins and might play a role in apoptosis, also resulted overexpressed, in the extract samples. Hedgehog was down-regulated following exposure to the environmental samples, so the stress caused by toxic exposure is likely to influence important signaling pathways and therefore the correct development of the organism. Some antimicrobial genes were also found to be down-regulated after exposure, suggesting that pollution might adversely affect the insect immune system and increase its susceptibility to invading pathogens. Finally, down-regulation of genes coding for proteins with a folding function is likely to affect directly or indirectly important cellular structures and functions.
In conclusion the microarray experiment shows that transcriptomics data can add relevant information on the nature of the compounds that cannot be recovered by traditional bioassays. We showed this in a recent study on aged copper contamination in an agricultural field (de boer et al., 2012). In this case, the patterns of gene expression suggest that the adverse biological effect of Vlagheide soil is partly due to organic compounds inducing xenobiotic metabolism. These compounds remain active after solvent extraction and induce a similar set of genes compared to the intact soil samples. However, the dose-dependence of the extracts is less clear maybe due to altered bioavailability. In addition to organic compounds, toxicity of the field soils is also due to polar components. Heavy metals would be the most likely factor, because elevated levels were measured at the Vlagheide site. However, we did not recover gene expression profiles indicative of specific single metals, as in the study of Nota et al. (2010). This might be due to interactive effects of metal mixtures in field soils, as also described by Nota et al. (2010). Finally our study illustrates that it is essential to link transcriptomics bioassays to traditional ecotoxicity tests, because only in this way can the exposure levels applied in gene expression studies linked to defined phenotypic effects.
Finally, we demonstrate that a number of QPCR assays exert a wide dynamic range of transcript quantification activated in a dose-dependent manner. This dynamic range can be observed around important endpoint such as the NOEC and 50% DiR. This opens the possibility to link gene expression levels to adverse effects at the organismal level. Such molecular bioassays may become very useful in future soil quality testing, because they are fast and diagnostic for the type of toxicity. Future work will focus on thorough validation of selected gene expression assays using a wide range of environmental soil samples containing different classes of compounds.
The authors declare that the research was conducted in the absence of any commercial or financial relationships that could be construed as a potential conflict of interest.
The Supplementary Material for this article can be found online at: http://www.frontiersin.org/Toxicogenomics_/10.3389/fgene.2012.00085/abstract
Table S1. Measurement of metals and soil parameters in three Vlagheide samples.
Table S2. Log2 normalized gene expression values from biological replicates in the QPCR assays.
SampleTypeSign, heat map significant genes factor Sample Type (extract or soil).
TreatmentSign, heat map significant genes factor Exposure level (NOEC or DiR).
InteractionSign, heat map significant genes Sample Type × Treatment interaction.
Agnihotri, G., and Liu, H. W. (2003). Enoyl-CoA hydratase: reaction, mechanism, and inhibition. Bioorg. Med. Chem. 11, 9–20.
Alexa, A., Rahnenfuehrer, J., and Lengauer, T. (2006). Improved scoring of functional groups from gene expression data by decorrelating GO graph structure. Bioinformatics 22, 1600–1607.
Benjamini, Y., and Hochberg, Y. (1995). Controlling the false discovery rate – a practical and powerful approach to multiple testing. J. R. Stat. Soc. B Methodol. 57, 289–300.
de Boer, M. E., de Boer, T. E., Marien, J., Timmermans, M., Nota, B., van Straalen, N. M., Ellers, J., and Roelofs, D. (2009). Reference genes for QRT-PCR tested under various stress conditions in Folsomia candida and Orchesella cincta (Insecta, Collembola). BMC Mol. Biol. 10, 54. doi:10.1186/1471-2199-10-54
de Boer, T. E., Birlutiu, A., Bochdanovits, Z., Timmermans, M., Dijkstra, T. M. H., Van Straalen, N. M., Ylstra, B., and Roelofs, D. (2011a). Transcriptional plasticity of a soil arthropod across different ecological conditions. Mol. Ecol. 20, 1144–1154.
de Boer, M. E., Berg, S., Timmermans, M. J. T. N., Den Dunnen, J. T., Van Straalen, N. M., Ellers, J., and Roelofs, D. (2011b). High throughput nano-liter RT-qPCR to classify soil contamination using a soil arthropod. BMC Mol. Biol. 12, 11. doi:10.1186/1471-2199-12-11
de boer, T. E., Taş, N., Braster, M., Temminghoff, E. J., Röling, W. F., and Roelofs, D. (2012). The Influence of long-term copper contaminated agricultural soil at different pH levels on microbial communities and springtail transcriptional regulation. Environ. Sci. Technol. 46, 60–68.
Droge, S. T. J., Paumen, M. L., Bleeker, E. A. J., Kraak, M. H. S., and van Gestelt, C. A. M. (2006). Chronic toxicity of polycyclic aromatic compounds to the springtail Folsomia candida and the enchytraeid Enchytraeus crypticus. Environ. Toxicol. Chem. 25, 2423–2431.
Feder, M. E., and Hofmann, G. E. (1999). Heat-shock proteins, molecular chaperones, and the stress response: evolutionary and ecological physiology. Annu. Rev. Physiol. 61, 243–282.
Glickman, M. H., and Ciechanover, A. (2002). The ubiquitin-proteasome proteolytic pathway: destruction for the sake of construction. Physiol. Rev. 82, 373–428.
Gong, P., Guan, X., Inouye, L. S., Deng, Y., Pirooznia, M., and Perkins, E. J. (2007). Transcriptomic analysis of RDX and TNT interactive sublethal effects in the earthworm Eisenia fetida. BMC Genomics 9, S15 doi:10.1186/1471-2164-9-S1-S15
Hubert, A., Wenzel, K. D., Manz, M., Weissflog, L., Engewald, W., and Schuurmann, G. (2000). High extraction efficiency for POPs in real contaminated soil samples using accelerated solvent extraction. Anal. Chem. 72, 1294–1300.
ISO Soil Quality. (1999). Inhibition of Reproduction of Collembola (Folsomia candida). ISO Guideline 11267. Switzerland: International Standardization Organization, 1999–1916.
Jiang, B. H., Semenza, G. L., Bauer, C., and Marti, H. H. (1996). Hypoxia-inducible factor 1 levels vary exponentially over a physiologically relevant range of O-2 tension. Am. J. Physiol. 271, C1172–C1180.
Legler, J., van Velzen, M., Cenijn, P. H., Houtman, C. J., Lamoree, M. H., and Wegener, J. W. (2011). Effect-directed analysis of municipal landfill soil reveals novel developmental toxicants in the zebrafish Danio rerio. Environ. Sci. Technol. 45, 8552–8558. doi:10.1186/1471-2164-10-160
Los, D. A., and Murata, N. (1998). Structure and expression of fatty acid desaturases. Biochim. Biophys. Acta 1394, 3–15.
Menzel, R., Swain, S. C., Hoess, S., Claus, E., Menzel, S., Steinberg, C. E. W., Reifferscheid, G., and Stuerzenbaum, S. R. (2009). Gene expression profiling to characterize sediment toxicity – a pilot study using Caenorhabditis elegans whole genome microarrays. BMC Genomics 10, 160. doi:10.1186/1471-2164-10-160
Nota, B., Bosse, M., Ylstra, B., van Straalen, N. M., and Roelofs, D. (2009). Transcriptomics reveals extensive inducible biotransformation in the soil-dwelling invertebrate Folsomia candida exposed to phenanthrene. BMC Genomics 10, 326. doi:10.1186/1471-2164-10-236
Nota, B., Verweij, R. A., Molenaar, D., Ylstra, B., van Straalen, N. M., and Roelofs, D. (2010). Gene expression analysis reveals a gene set discriminatory to different metals in soil. Toxicol. Sci. 115, 34–40.
Owen, J., Hedley, B. A., Svendsen, C., Wren, J., Jonker, M. J., Hankard, P. K., Lister, L. J., Sturzenbaum, S. R., Morgan, A. J., Spurgeon, D. J., Blaxter, M. L., and Kille, P. (2008). Transcriptome profiling of developmental and xenobiotic responses in a keystone soil animal, the oligochaete annelid Lumbricus rubellus. BMC Genomics 9, 266. doi:10.1186/1471-2164-9-266
Saeed, A. I., Hagabati, N. K., Braisted, J. C., Liang, W., Sharov, V., Howe, E. A., Li, J., Thiagarajan, M., White, J. A., and Quackenbush, J. (2006). TM4 microarray software suite. Methods Enzymol. 411, 134–193.
Tabata, T., and Kornberg, T. B. (1994). Hedgehog is a signaling protein with a key role in patterning drosophila imaginal disks. Cell 76, 89–102.
Timmermans, M. J. T. N., Roelofs, D., Nota, B., Ylstra, B., and Holmstrup, M. (2009). Sugar sweet springtails: on the transcriptional response of Folsomia candida (Collembola) to desiccation stress. Insect Mol. Biol. 18, 737–746.
Van Straalen, N. M., and Feder, M. E. (2012). Ecological and evolutionary functional genomics – how can it contribute to the risk assessment of chemicals? Eviron Sci. Technol. 46, 3–9.
van Straalen, N. M., and Roelofs, D. (2008). Genomics technology for assessing soil pollution. J. Biol. 7, 19.
Vandenbrouck, T., Jones, O. A. H., Dom, N., Griffin, J. L., and De Coen, W. (2010). Mixtures of similarly acting compounds in Daphnia magna: from gene to metabolite and beyond. Environ. Int. 36, 254–268.
Wettenhall, J. M., and Smyth, G. K. (2004). limmaGUI: a graphical user interface for linear modeling of microarray data. Bioinformatics 20, 3705–3706.
Keywords: microarray, Folsomia candida, biotransformation, cytochrome P450
Citation: Roelofs D, de Boer M, Agamennone V, Bouchier P, Legler J and van Straalen N (2012) Functional environmental genomics of a municipal landfill soil. Front. Gene. 3:85. doi: 10.3389/fgene.2012.00085
Received: 28 January 2012; Paper pending published: 29 February 2012;
Accepted: 28 April 2012; Published online: 16 May 2012.
Edited by:
Stephen Sturzenbaum, King’s College London, UKReviewed by:
Alok K. Sharma, Covance Laboratories Inc., USACopyright: © 2012 Roelofs, de Boer, Agamennone, Bouchier, Legler and van Straalen. This is an open-access article distributed under the terms of the Creative Commons Attribution Non Commercial License, which permits non-commercial use, distribution, and reproduction in other forums, provided the original authors and source are credited.
*Correspondence: Dick Roelofs, Department of Ecological Science, VU University, de Boelelaan 1085, 1081HV, Amsterdam, Netherlands. e-mail:ZGljay5yb2Vsb2ZzQHZ1Lm5s
Disclaimer: All claims expressed in this article are solely those of the authors and do not necessarily represent those of their affiliated organizations, or those of the publisher, the editors and the reviewers. Any product that may be evaluated in this article or claim that may be made by its manufacturer is not guaranteed or endorsed by the publisher.
Research integrity at Frontiers

Learn more about the work of our research integrity team to safeguard the quality of each article we publish.