- 1 Department of Psychiatry, The University of Iowa, Iowa City, IA, USA
- 2 Neuroscience Program, The University of Iowa, Iowa City, IA, USA
- 3 Department of Psychology, The University of Georgia, Athens, GA, USA
- 4 Department of Family and Consumer Sciences, The University of Georgia, Athens, GA, USA
Peripheral mononuclear cell preparations are commonly used as proxies for other tissues in studies of the role of gene expression and methylation in human disease. Whether changes in peripheral DNA methylation are associated with changes in peripheral blood or brain gene expression is not clear. In order to test the former hypothesis and determine which genome-wide methylation platform was most suitable for our studies of peripheral blood cells, we compared the results from two commercially available genome-wide methylation arrays with respect to genome-wide gene expression using lymphoblast DNA and RNA from eight individuals at the promoters of 5619 genes. We found that methylation signatures at these gene promoters were significantly correlated with one another across platforms and with genome-wide gene expression, but the extent of that relationship is dependent on choice of platform and degree of methylation. Taken in context with data from other studies, these data demonstrate that peripheral blood cell methylation is associated with gene expression and that further studies to clarify the extent of this relationship, and the relationship between central and peripheral DNA methylation are in order.
Introduction
At the nucleic acid level, epigenetic changes are defined as modifications to DNA that may alter gene expression but do not result in changes in the primary DNA sequence. These modifications can be transitory, persist for years, or in some instances, may be transgenerational (Youngson and Whitelaw, 2008). Epigenetic processes are key players in neurodevelopment and are hypothesized to play important roles in many complex behavioral illnesses such as autism, depression, and substance use (Chahrour and Zoghbi, 2007; Oberlander et al., 2008; Philibert et al., 2010). Consequently, there is a strong interest among researchers to identify epigenetic changes associated with disease and illness.
DNA methylation is perhaps the most accessible epigenetic mechanism (Suzuki and Bird, 2008). DNA methylation results from the covalent addition of a methyl group to the 5′ carbon on cytosine. This reaction is catalyzed by DNA methyltransferases and typically occurs at CpG dinucleotides residues. Due to selective evolutionary pressures, CpG dinucleotide pairs are underrepresented throughout the genome, except at discrete regions known as CpG islands. In general, methylation of regulatory CpG islands is thought to downregulate transcription by promoting the formation of heterochromatin and preventing the binding of transcription factors (Suzuki and Bird, 2008). However, at least one large-scale study has failed to demonstrate a significant relationship between genome-wide methylation and gene expression (Fan and Zhang, 2009).
In order to quantify the exact level of DNA methylation, several large-scale and two genome-wide methylation assays have been marketed to aid researchers in identifying genes associated with biological processes. Each of these technologies exploit unique biophysical properties of DNA to determine the level of DNA methylation at large subsets of genomic loci. For example, the NimbleGen 385K array uses a methylated DNA immunoprecipitation based approach to isolate methylated fragments of genomic DNA from unmethylated regions. Methylated and unmethylated segments are then labeled with Cy3 and Cy5 dyes, respectively, and subjected to competitive hybridization against a set of oligonucleotides representing the promoters of all well characterized RefSeq genes, providing a measure of relative methylation (Roche NimbleGen, 2007). In contrast, the Illumina HumanMethylation450 BeadChip, uses bisulfite converted DNA and single base pair extension technology to determine the level of methylation (Fan et al., 2006). Each of these platforms has been used extensively.
Like many other groups (Vawter et al., 2004; Glatt et al., 2005; Nielsen et al., 2008), our group frequently uses measures of peripheral lymphocyte and lymphoblast gene expression or methylation as a proxy for expression or methylation in the brain. Therefore, we have been intensely interested in determining which methylation platform would work best for our integrated studies of gene expression and gene methylation. Unfortunately, in our examination of the literature, we could not find independent comparisons of the two leading genome-wide platforms or analyses of the relationship between methylation and gene expression using these platforms. Therefore, in this communication, we describe our comparison of these two platforms, relating them to one another, and comparing their utility in predicting genome-wide RNA expression using DNA and RNA from eight independent individuals.
Materials and Methods
The DNA and RNA used in the studies were derived from biomaterial obtained from eight individuals participating in the Iowa Adoption Studies (IAS). The IAS uses a case and control adoption approach whose goal is to elucidate the etiology of complex psychiatric illness. The clinical characteristics of the IAS have been described elsewhere (Philibert, 2006). All procedures were approved by the University of Iowa Institutional Review Board.
The DNA and RNA used in this study were prepared, as previously described, from growth entrained lymphoblast cell lines (Philibert et al., 2008). Total RNA was prepared from these cells using Invitrogen RNA purification kits (Carlsbad, CA, USA) according to the instructions of the manufacturer. DNA from these cells was isolated using cold protein precipitation (Lahiri and Schnabel, 1993). The quality and integrity of both the DNA and RNA samples were inspected by spectrophotometer to ensure integrity.
Genome-wide expression analyses were conducted by the University of Iowa DNA Facility using the Affymetrix Human Genome U133 2.0 plus Array which contains 29,098 gene specific oligonucleotide probes following the procedure outlined by the manufacturer. The resulting data were then quantile normalized using Partek Genomic Suite (St. Louis, MO, USA).
Input and methylation enriched fractions of DNA were prepared per the standard NimbleGen protocol (Roche NimbleGen, 2007). Briefly, 20 μg of genomic DNA was reduced in complexity by digestion with MseI, column purified, with a small aliquot of the sample being taken for future analysis (i.e., input DNA). Five micrograms of the remainder of the digested DNA from each subject was resuspended in immunoprecipitation buffer (50 mM NaPO4, 700 mM NaCl, 0.25% Triton X-100) and hybridized with 1 μg of monoclonal mouse anti-5-methyl cytidine antibody (Calbiochem USA) at 4°C overnight. The resulting solution was then hybridized to a magnetic bead coupled secondary antibody (Dynabeads M-280, Invitrogen USA) and the DNA-antibody moiety purified by magnetic separation. The DNA was removed from the antibody complex by overnight digestion with protease K and column purified. Then, 100 ng aliquots of both the methyl enriched DNA fraction and the input DNA were amplified using a WGA2 genome amplification kit, which selectively amplifies short DNA contigs that are more amenable to hybridization and was used according to the manufacturer’s instructions (Sigma, St. Louis). After purification, this DNA was then frozen at −20°C until use in the microarray analyses. Hybridization to the NimbleGen 385K RefSeq Whole Genome Promoter Array was performed under contract by NimbleGen (Madison, WI, USA). M-values were then calculated from the obtained raw data, quantile normalized, and centered around zero.
DNA methylation of the samples was also assessed using the Illumina HumanMethylation450 BeadChip under contract by the University of Minnesota Genome Center using the protocol specified by the manufacturer (Illumina, San Diego). The resulting microarray data were inspected for complete bisulfite conversion of the DNA, and average β-values (i.e., average methylation) for each CpG residue were determined using the GenomeStudio suite of software (V2009.2; Methylation module Version 1.5.5., version 3.2). The HumanMethylation450 BeadChip contains 485,577 probes that recognize at least 20,216 unique features. Greater than 99.7% of the 485,577 probes yielded statistically reliable data. Because DNA methylation values exhibit heteroscedasticity, to make the data more suitable for statistical analyses, we converted the Illumina β-values to M-values as derived in Du et al. (2010). This conversion has been shown to appropriate for mid-range methylation values, but may distort values at methylation extremes.
RefSeq gene identification codes were used to identify genes common across all three platforms. For the Illumina array data, we used the manufacturer’s definition of promoter associated region as given in the data annotation files. The NimbleGen array contains probes for promoters of all well characterized RefSeq genes (Roche NimbleGen, 2011). The promoter regions on these arrays are covered by 50–75mer probes spaced approximately 100 base pairs apart. For genes with multiple probes in a particular array, the average of the presented values was calculated to obtain one value for each gene. Genes not common to all three platforms were eliminated. In total, 5619 genes were identified common to all platforms. While many of these tiled regions in the NimbleGen array are non-CpG associated, after eliminating regions not common to all three platforms, over 93% of the probes mapped to CpG islands or CpG shores according to the Illumina annotation file. Lastly, we z-transformed all values in order to obtain a common scale with which all arrays could be compared.
Pearson’s linear correlation coefficient and Spearman’s rank-order correlation coefficients were used to compare the values from each methylation platform to genome-wide mRNA expression (Fleiss, 1981). To further elucidate the sources of variance, we performed an ordinary least squares (OLS) regression, using both the Illumina and the NimbleGen array to simultaneously predict gene expression. We then sought to examine the shape and magnitude of the relationship between methylation and expression. To examine aggregate expression for each percentile of methylation, we separated methylation data into percentile bins and averaged the expression for every locus within the designated percentile and plotted the resulting 100 data points for each array. Lastly, hierarchical cluster analysis was conducted with CIMminer™ (http://discover.nci.gov/cimminer) using the default Euclidian algorithm. All calculations were performed using SPSS version 19 or SAS 9. Figures were plotted using SAS 9 or Microsoft Excel 2007.
Results
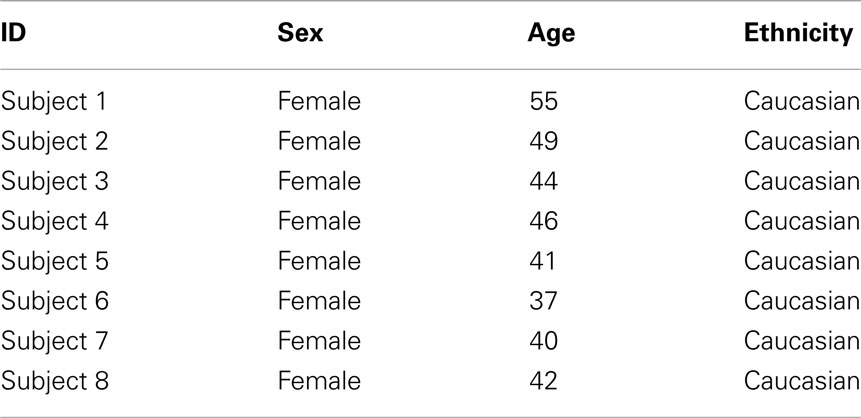
Table 1 shows the clinical and demographic data for the subjects in this study. In brief, all participants were middle age females of northern European descent.
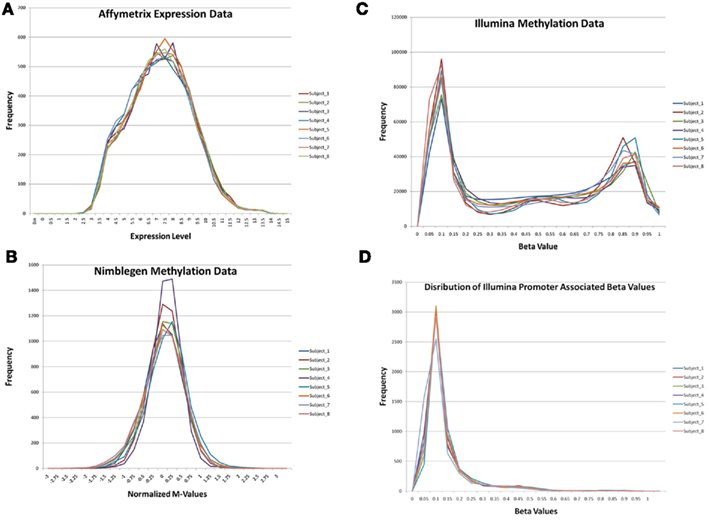
Figure 1 describes the overall distribution of the z-transformed data for each subject for all three platforms. The frequency distribution of the NimbleGen and Affymetrix data appears approximately Gaussian, whereas the Illumina data exhibits a moderate positive skew which is potentially a source of decreased correspondence with the other arrays. For comparison, distributions of the raw data are shown in Figure A1 in Appendix. When the data were subjected to hierarchical clustering, cross-platform variation appeared greater than within platform variation (Figure A2 in Appendix).
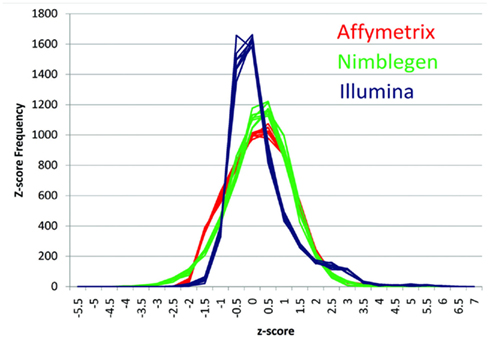
Figure 1. The distribution of z-transformed methylation of gene expression values (Y-axis) from each platform for each of the subjects in the study. NimbleGen values are in green, Affymetrix values are in red, and Illumina values are in blue.
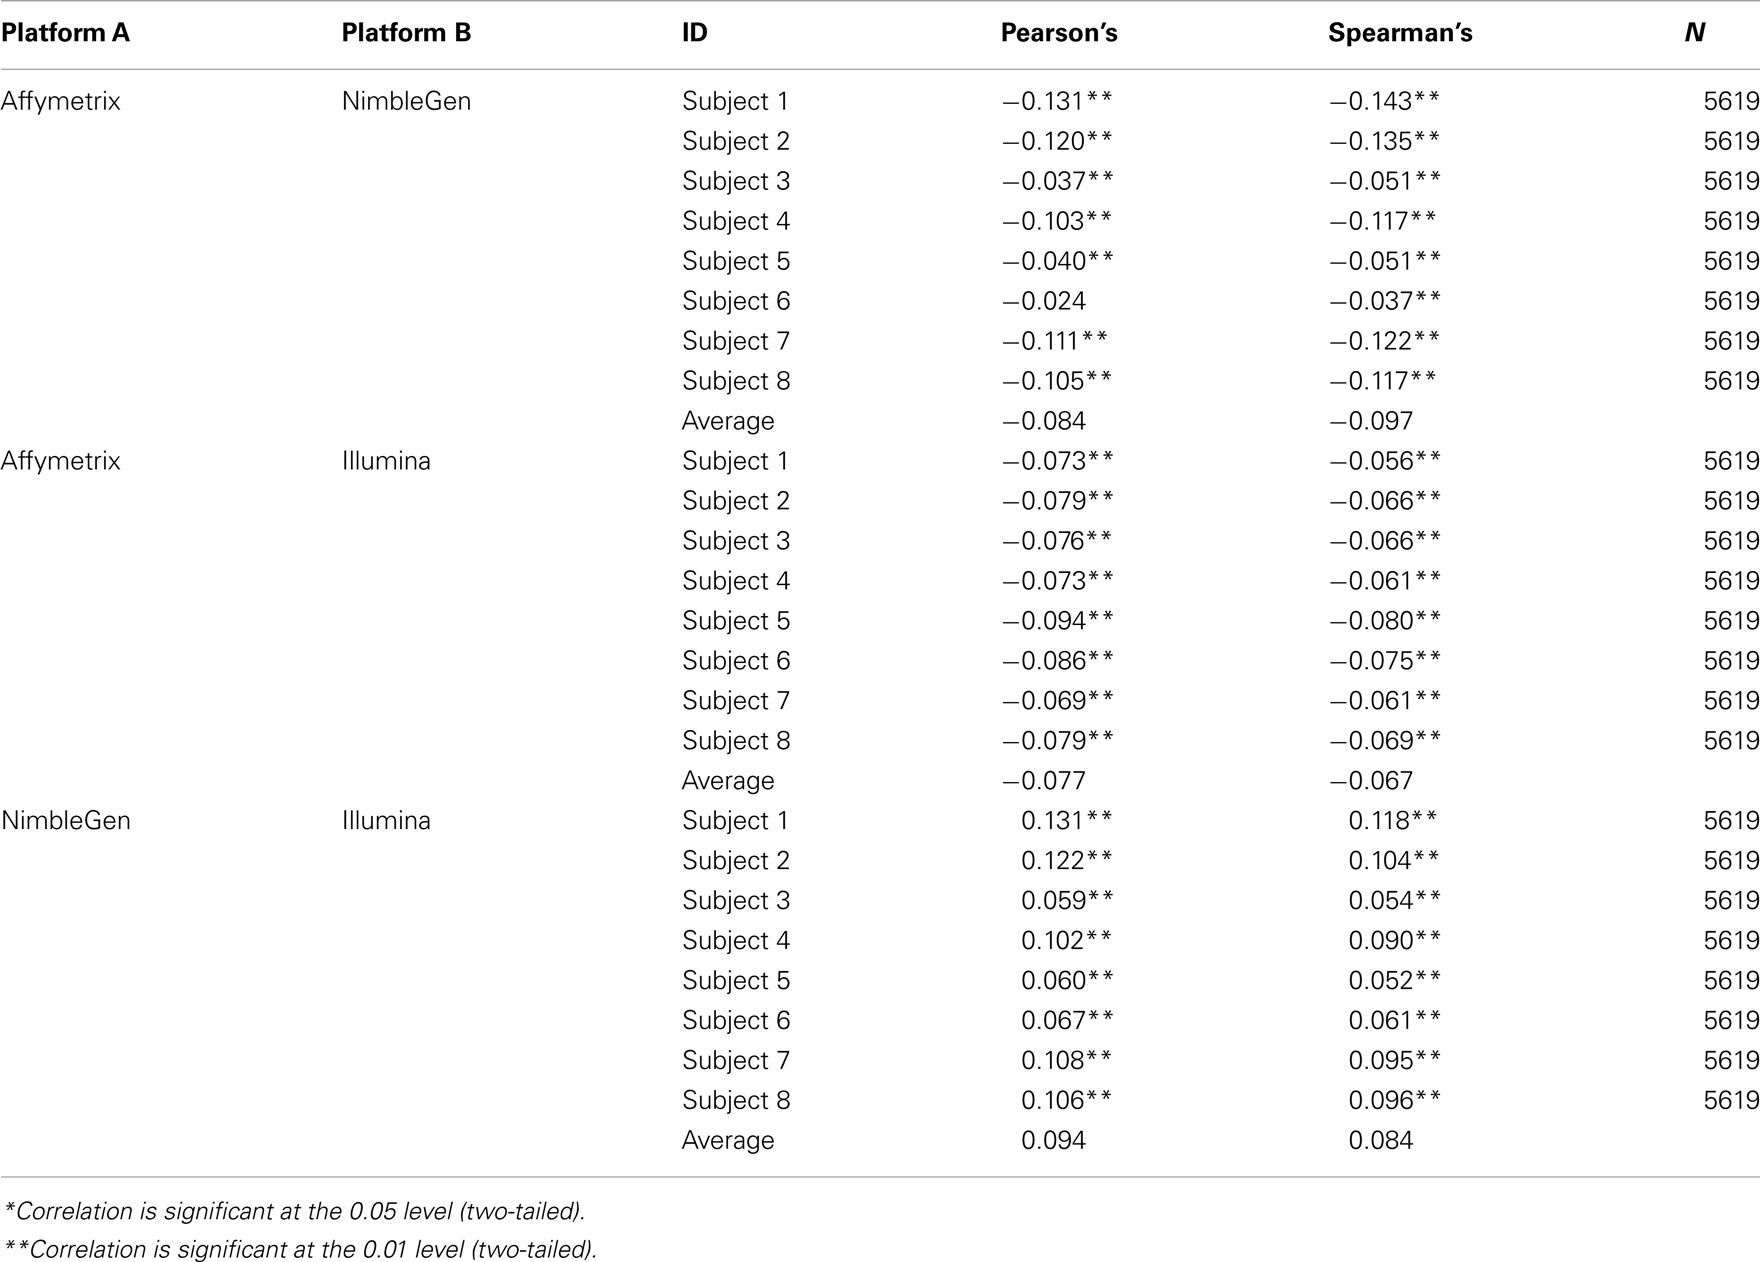
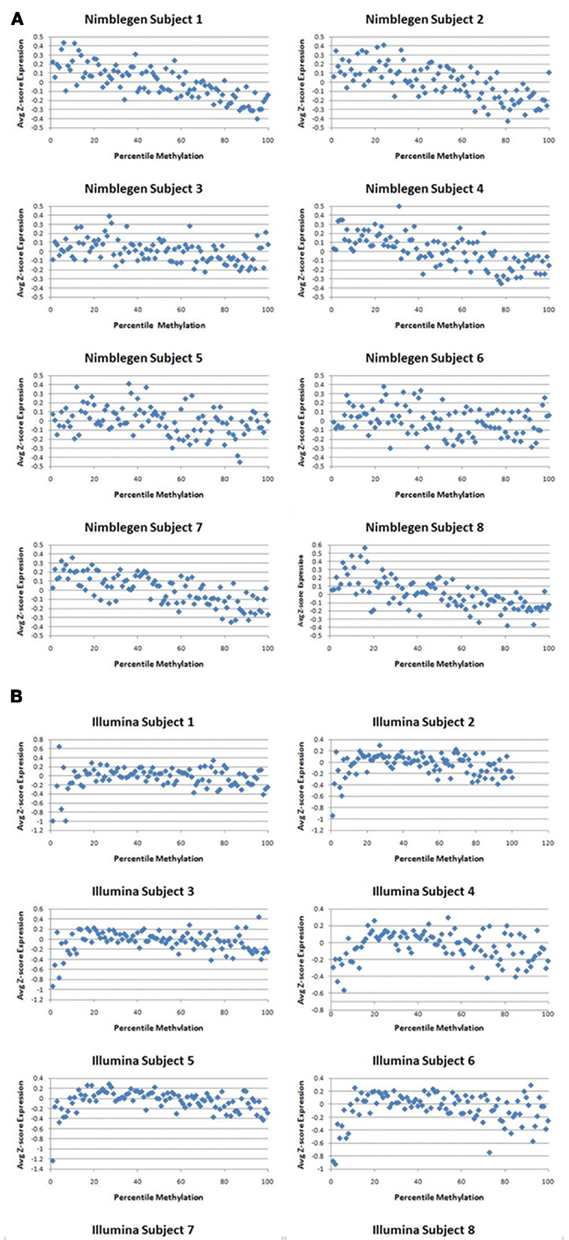
At the level of the individual, the average correlation between gene methylation and mRNA expression was significant and trended in the directions expected (see Figure 2). In general, there was a trend toward increasing expression with decreasing methylation for all eight subjects, although considerable variation was evident across individuals. Pearson’s correlation coefficients were between −0.131 and −0.024 when comparing the Affymetrix array with the NimbleGen array. When comparing the Affymetrix array with the Illumina array, Pearson’s correlation coefficients ranged between −0.094 and −0.069. Pearson’s correlation coefficients for all analyses are shown in Table 2. In general, the NimbleGen array showed stronger predictive scores, albeit being less consistent. For these comparisons we used the M-value conversion for the Illumina array values as recommended by Du et al. (2010). We found similar results for all analyses whether M-values or β-values were used. Figure 2 shows the scatterplots for the genome-wide methylation-expression comparisons for Subject 1. Scatterplots for the other seven individuals are available upon request.
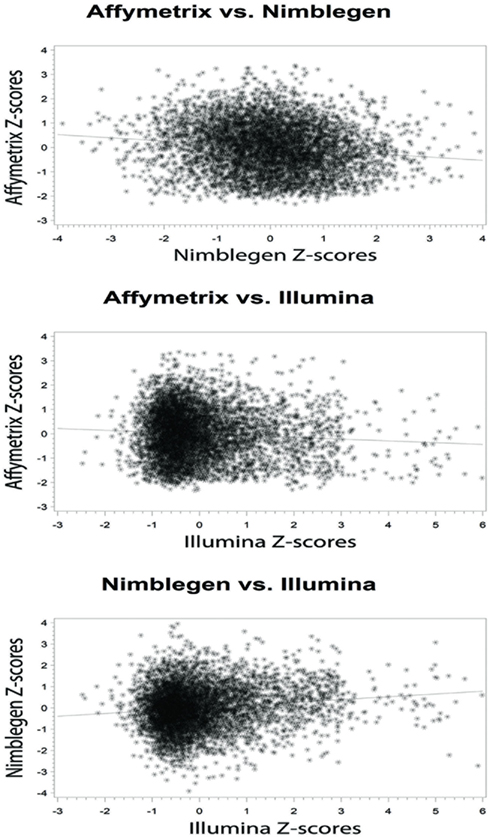
Figure 2. Bivariate analytic plots of the relationship between: (A) Affymetrix gene expression and NimbleGen methylation data (r2 = −0.131) (B) Affymetrix gene expression and Illumina methylation data (r2 = −0.073) and (C) NimbleGen and Illumina methylation data (r2 = 0.131).
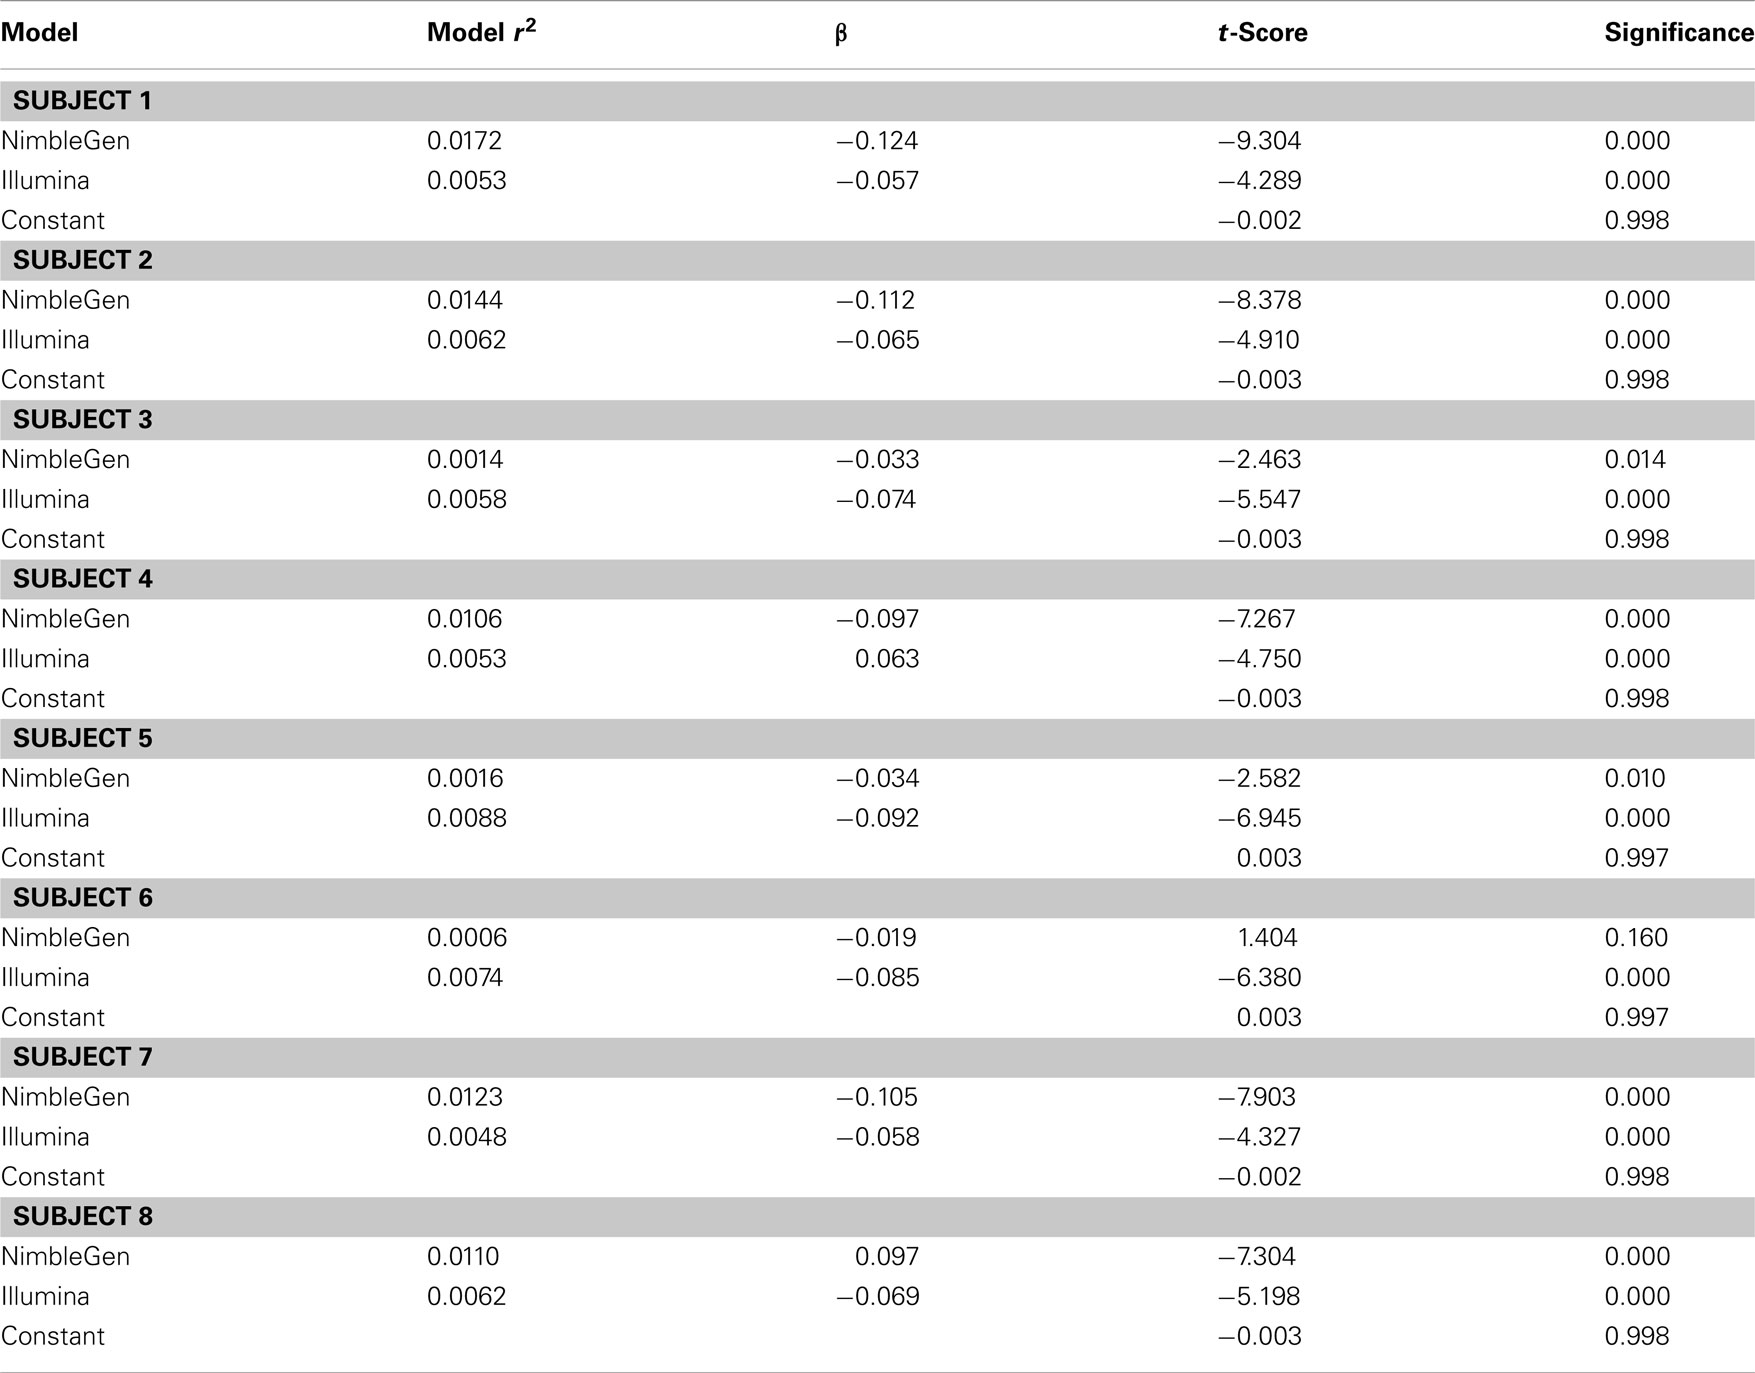
When we compared the values for each methylation arrays, we found a slight positive correlation suggesting that they are, in fact, measuring the same diathesis, albeit to a lesser degree than anticipated. Pearson’s correlation coefficients ranged between 0.131 and 0.059 for these comparisons. To examine the differential validity of the Illumina and NimbleGen arrays in predicting expression we conducted an OLS analysis, using the values for each array as predictors of expression. In this OLS regression, we found that each array accounted for significant variance in gene expression, suggesting that each provided valid, unique information in addition to shared prediction of gene expression (Table 3). In five of the eight cases, the NimbleGen arrays were better predictors of expression.
One recent investigation has suggested that DNA methylation may not affect transcription in the same manner at all genes (Park and Nakai, 2011). In order to examine whether cryptic dichotomies may exist within our data, we plotted average expression as a percentage of methylation for each array based on z-scores. We found that maximal expression occurred around the around the 13th–25th percentiles with a monotonic decrease in expression as percent methylation increased above this range (Figure 3). The two arrays corresponded moderately well with each other with a Pearson’s correlation coefficient of 0.232 across the full range. Interestingly, as Figure 3 shows, with respect to the Illumina data, expression was suppressed at the lowest extremes of methylation. Moreover, the lowest percentile methylation values exhibited the largest discordance between the two methylation arrays. Discordance was also noted at the upper extremes of methylation, but not to the same extent as the lower extremes. When we examined the middle 80% of methylation percentiles, ignoring 10% on either side of the curve, the correlation increased to 0.626, suggesting moderate to strong overall predictability between the two arrays when examining genes that are not in the extreme portions of the methylation distribution.
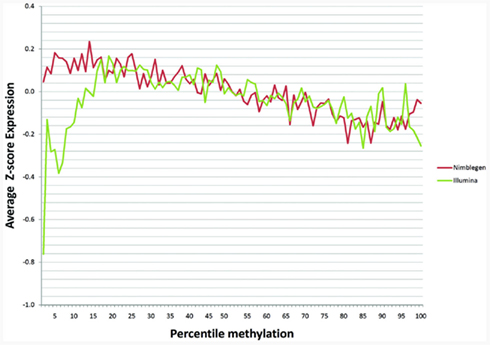
Figure 3. The relationship of gene methylation to gene expression for the NimbleGen (red line) and the Illumina platform (green line) at each percentile of the z-score of the gene expression distribution.
Discussion
In summary, we compared the relationship of genome-wide lymphoblast DNA methylation at gene promoters to gene expression utilizing two widely used, commercially available platforms. Despite finding weak correlations between gene expression and DNA methylation within individuals across all queried loci, we found strong relationships between gene expression and gene methylation when we examined the average expression for each percentile methylation, particularly in the modal portion of the distribution of methylation values.
The current findings have certain limitations including the small number of samples examined. In addition, it is important to note that gene expression and methylation were derived using material from lymphoblast cell lines. Although these commonly used models have many strengths, they are not always representative of their cognate lymphocyte precursors and are subject to clonal skewing and effects of both the EBV transformation and cell passaging (Grafodatskaya et al., 2010).
Recently, Bock et al. (2010) compared a prior generation of Illumina array (the HumanMethylation 27K array) with three other DNA methylation sequencing technologies. Their data demonstrated a high degree of correlation between the results using the 27K array and the methylated DNA immunoprecipitation sequencing (MeDip-Seq), methylated DNA captured by affinity purification (Methyl-Cap Seq) and reduced representation bisulfite sequencing (RRBS). However, the results of Bock and colleagues are not directly comparable to the current results because they did not include data from any NimbleGen platforms.
Consistent with some, but not all prior studies, both platforms demonstrated a correlation between increased promoter methylation and genome-wide gene expression (Fan and Zhang, 2009; Brenet et al., 2011; Pai et al., 2011). However, it is likely that the current analyses underestimate the extent of the true relationship between methylation and gene expression. In the current analyses, we aggregated the values for all promoter associated regions. Although this is an excellent way to begin an unbiased analysis, this approach ignores the fact that the status of some regions, especially certain CpG islands, will be found to be more predictive of gene expression than others. Second, the Affymetrix gene expression array that was used in the study is not exon specific but rather sums all transcripts from a given gene. Since promoter associated CpG islands preferentially affect transcripts containing exons in their immediate vicinity (Brenet et al., 2011) and many genes contain non-promoter associated CpG islands that also may affect gene transcription, it is likely that future studies which focus on critical CpG residues and relevantly spliced transcripts will produce more robust relationships. Third, 7% of the promoter associated regions did not overlap CpG islands and may serve functions distinct from those of promoter associated CpG islands.
The overall distribution of the expression data in relation to percentile methylation illustrates several important findings and identifies a cautionary note. As expected, expression decreases monotonically as methylation increases at loci of mid-range methylation. However, this pattern did not persist at methylation extremes. At low methylation values, we found an unexpected decrease in expression when using data derived from the Illumina platform. However, it is important to note that these islands tended to be smaller and poorly covered in the 450K platform. Another possibility for this observation may be driven by technical limitation. The Du et al. (2010) derivation, used to convert β-values to M-values, is less predictive outside of mid-range β-values. Even after converting the Illumina β-values to M-values, the resulting data did still exhibit some positive skew. Consequently, few probes fell into the low percentile z-scores, potentially leading to sample bias. Interestingly, however, we found nearly identical results when using the untransformed β-values.
It is possible that the low concordance and discrepant gene regulation at the low range of gene methylation may be partially artifactual. The regions in the 1st percentile of the methylation in the Illumina array data tended to be much smaller and had fewer (2.8 ± 2.6) probes per region as compared to those in the 50th percentile of the distribution (5.9 ± 3.9; p < 0.0001). In addition, it is important to note that although the regions were defined similarly, the NimbleGen and Illumina arrays may target slight biological diatheses. The area of methylation effectively targeted by the NimbleGen array includes all the area within the MseI digest cut sites while the Illumina array effectively targets a select set of CpG sites within a CpG island whose inclusion is not dependent on the presence or absence of MseI cut sites. Finally, even though we did not detect any significant effect of data transformation, the Illumina array data were transformed prior to analyses, which may introduce distortions at the extreme ranges of methylation.
In actual laboratory practice, each of the approaches has its strengths and weaknesses. For example, in this study, the results using the NimbleGen platform were slightly more robust. However, it should be noted that this increase in sensitivity was obtained at the cost of significant amounts of bench work which required a high degree of technical expertise. At the same time, although the Illumina based approach was much easier to perform and provided data of comparable utility for the majority of genes, Illumina does not offer a genome-wide platform for studies of rodents. Hence, one is not able to use this approach in comparative studies of rodents and human genome-wide DNA methylation. In the future, direct sequencing of the methylome may make both of these methods obsolete. However, at the current time, genome-wide sequencing of bisulfite converted DNA remains a technique limited to isolated laboratory groups (Rauch et al., 2009).
These findings have significant implications for behavioral scientists that use lymphocytes or lymphoblasts in their studies. In general, they indicate that changes in DNA methylation in these cells are functionally correlated with changes in gene expression at the vast majority of genes. Because others have shown that overall gene expression and methylation in these cells is correlated with brain gene expression and methylation (Fan and Zhang, 2009; Rollins et al., 2010), these findings create an additional credence for the use of these cell models in studies of neuropsychiatric disorders.
In conclusion, we demonstrate a significant genome-wide relationship between lymphoblast DNA methylation and gene expression and report a direct head-to-head comparison of two leading DNA methylation platforms. We conclude that investigators contemplating the use of either platform will need to balance the complexities inherent in performing the MeDip based NimbleGen measurements versus the ease of performing the Illumina Infinium assays as performed by third party providers.
Conflict of Interest Statement
The authors declare that the research was conducted in the absence of any commercial or financial relationships that could be construed as a potential conflict of interest.
Acknowledgments
The work in this study was supported by DA015789 and MH080898 to Dr. Philibert Additional support for these studies was derived from the Center for Contextual Genetics and Prevention Science (Grant Number P30 DA027827, Gene H. Brody) funded by the National Institute on Drug Abuse. The content is solely the responsibility of the authors and does not necessarily represent the official views of the National Institutes of Health.
References
Bock, C., Tomazou, E. M., Brinkman, A. B., Muller, F., Simmer, F., Gu, H., Jager, N., Gnirke, A., Stunnenberg, H. G., and Meissner, A. (2010). Quantitative comparison of genome-wide DNA methylation mapping technologies. Nat. Biotechnol. 28, 1106–1114.
Brenet, F., Moh, M., Funk, P., Feierstein, E., Viale, A. J., Socci, N. D., and Scandura, J. M. (2011). DNA methylation of the first exon is tightly linked to transcriptional silencing. PLoS ONE 6, e14524. doi: 10.1371/journal.pone.0014524
Chahrour, M., and Zoghbi, H. Y. (2007). The story of Rett syndrome: from clinic to neurobiology. Neuron 56, 422–437.
Du, P., Zhang, X., Huang, C.-C., Jafari, N., Kibbe, W., Hou, L., and Lin, S. (2010). Comparison of Beta-value and M-value methods for quantifying methylation levels by microarray analysis. BMC Bioinformatics 11, 587. doi: 10.1186/1471-2105-11-587
Fan, J., Gunderson, K. L., Bibikova, M., Yeakley, J. M., Chen, J., Wickham Garcia, E., Lebruska, L. L., Laurent, M., Shen, R., and Barker, D. (2006). “Illumina universal bead arrays,” in Methods in Enzymology, Chap. 3, eds K. Alan, and O. Brian (San Diego: Academic Press), 57–73.
Fan, S., and Zhang, X. (2009). CpG island methylation pattern in different human tissues and its correlation with gene expression. Biochem. Biophys. Res. Commun. 383, 421–425.
Fleiss, J. L. (1981). Statistical Methods for Rates and Proportions. New York, NY: John Wiley & Sons Inc.
Glatt, S. J., Everall, I. P., Kremen, W. S., Corbeil, J., Sasik, R., Khanlou, N., Han, M., Liew, C. C., and Tsuang, M. T. (2005). Comparative gene expression analysis of blood and brain provides concurrent validation of SELENBP1 up-regulation in schizophrenia. Proc. Natl. Acad. Sci. U.S.A. 102, 15533–15538.
Grafodatskaya, D., Choufani, S., Ferreira, J. C., Butcher, D. T., Lou, Y., Zhao, C., Scherer, S. W., and Weksberg, R. (2010). EBV transformation and cell culturing destabilizes DNA methylation in human lymphoblastoid cell lines. Genomics 95, 73–83.
Lahiri, D. K., and Schnabel, B. (1993). DNA isolation by a rapid method from human blood samples: effects of MgCl2, EDTA, storage time, and temperature on DNA yield and quality. Biochem. Genet. 31, 321–328.
Nielsen, D. A., Yuferov, V., Hamon, S., Jackson, C., Ho, A., Ott, J., and Kreek, M. J. (2008). Increased OPRM1 DNA methylation in lymphocytes of methadone-maintained former heroin addicts. Neuropsychopharmacology 34, 867–873.
Oberlander, T. F., Weinberg, J., Papsdorf, M., Grunau, R., Misri, S., and Devlin, A. M. (2008). Prenatal exposure to maternal depression, neonatal methylation of human glucocorticoid receptor gene (NR3C1) and infant cortisol stress responses. Epigenetics 3, 97–106.
Pai, A. A., Bell, J. T., Marioni, J. C., Pritchard, J. K., and Gilad, Y. (2011). A genome-wide study of DNA methylation patterns and gene expression levels in multiple human and chimpanzee tissues. PLoS Genet. 7, e1001316. doi: 10.1371/journal.pgen.1001316
Park, S.-J., and Nakai, K. (2011). A regression analysis of gene expression in ES cells reveals two gene classes that are significantly different in epigenetic patterns. BMC Bioinformatics 12, S50. doi: 10.1186/1471-2105-12-S1-S50
Philibert, R. (2006). Merging genetic and environmental effects in the Iowa Adoption Studies: focus on depression. Ann. Clin. Psychiatry 18, 219–222.
Philibert, R. A., Beach, S. R., Gunter, T. D., Brody, G. H., Madan, A., and Gerrard, M. (2010). The effect of smoking on MAOA promoter methylation in DNA prepared from lymphoblasts and whole blood. Am. J. Med. Genet. B Neuropsychiatr. Genet. 153B, 619–628.
Philibert, R. A., Gunter, T. D., Beach, S. R., Brody, G. H., and Madan, A. (2008). MAOA methylation is associated with nicotine and alcohol dependence in women. Am. J. Med. Genet. B Neuropsychiatr. Genet. 147B, 565–570.
Rauch, T. A., Wu, X., Zhong, X., Riggs, A. D., and Pfeifer, G. P. (2009). A human B cell methylome at 100-base pair resolution. Proc. Natl. Acad. Sci. U.S.A. 106, 671–678.
Roche NimbleGen. (2007). Sample Preparation Protocol for DNA Methylation Microarrays v3.0. Indianapolis: Roche NimbleGen.
Roche NimbleGen. (2011). NimbleGen ChIP-Chip and DNA Methylation Microarrays. Indianapolis: Roche NimbleGen.
Rollins, B., Martin, M. V., Morgan, L., and Vawter, M. P. (2010). Analysis of whole genome biomarker expression in blood and brain. Am. J. Med. Genet. B Neuropsychiatr. Genet. 153B, 919–936.
Suzuki, M. M., and Bird, A. (2008). DNA methylation landscapes: provocative insights from epigenomics. Nat. Rev. Genet. 9, 465–476.
Vawter, M. P., Ferran, E., Galke, B., Cooper, K., Bunney, W. E., and Byerley, W. (2004). Microarray screening of lymphocyte gene expression differences in a multiplex schizophrenia pedigree. Schizophr. Res. 67, 41–52.
Youngson, N. A., and Whitelaw, E. (2008). Transgenerational epigenetic effects. Annu. Rev. Genomics Hum. Genet. 9, 233–257.
Appendix
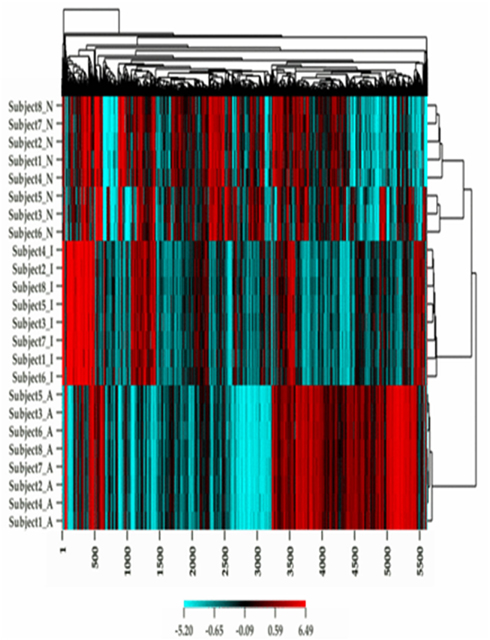
Figure A2. A heat map plot of the methylation and gene expression values for each subject in the study.
Keywords: DNA methylation, genome wide, gene expression
Citation: Plume JM, Beach SRH, Brody GH and Philibert RA (2012) A cross-platform genome-wide comparison of the relationship of promoter DNA methylation to gene expression. Front. Gene. 3:12. doi: 10.3389/fgene.2012.00012
Received: 01 November 2011; Accepted: 20 January 2012;
Published online: 06 February 2012.
Edited by:
Jeff Schwartz, Griffith University, AustraliaReviewed by:
Rui Feng, University of Pennsylvania, USARaman Nagarajan, University of California San Francisco, USA
Frank Grutzner, University of Adelaide, Australia
Copyright: © 2012 Plume, Beach, Brody and Philibert. This is an open-access article distributed under the terms of the Creative Commons Attribution Non Commercial License, which permits non-commercial use, distribution, and reproduction in other forums, provided the original authors and source are credited.
*Correspondence: Robert A. Philibert, The University of Iowa, 2-126 Medical Education Building, 500 Newton Road, Iowa City, IA 52242-1000, USA. e-mail:cm9iZXJ0LXBoaWxpYmVydEB1aW93YS5lZHU=


