- Department of Geography and Planning, University of Toledo, Toledo, OH, United States
By employing descriptive statistics and multinomial logistic regression models, the paper investigates factors that affect the travel mode choice behavior of a college community for both commuting to the campus from their residences and commuting on campus from one facility to another. Results show that car ownership, travel distance, age, gender, academic status, income, perception of safety, number of weekly trips, and weather conditions affect people’s mode choice decisions significantly. The study finds that increasing travel distance, age, and being a staff member positively impact car mode choice, faculty members are more likely to bike and walk compared to undergraduate students, and unlike the authors’ predictions, the higher-income people are more likely to walk on campus. Results also reveal that car users change travel modes more often than active transport mode users based on semesters and that although women are less likely to bike to the campus, they are more likely to walk and bike on campus. If the number of trips increases, people prefer cars to walk, bike, and ride a bus to commute to the campus while they prefer walking to driving a car on campus. The study contributes to help create pollution-free and healthy urban college campuses that, on larger scales, will further contribute to developing sustainable cities to achieve the Sustainable Development Goals as described by the United Nations, particularly goal number 11, “to make cities and human settlements inclusive, safe, resilient and sustainable,” and thereby contribute to improving urban living conditions.
1 Introduction
On 25 September 2015, the United Nations Sustainable Development Summit adopted the 2030 Agenda for Sustainable Development (The United Nations, 2015). Sustainable city development integrates three major intertwined aspects: built environment, transport, and health (BETH). One of the major components of cities is the transportation system, which includes both infrastructure and service. Other elements of cities are streets, buildings, public spaces, and infrastructure. The transportation system of a city causes profound impacts on the overall wellbeing of the city dwellers by individually shaping their mobility and health. Cities can improve their overall health and wellbeing, as well as the health conditions of their residents, by creating a user-friendly, attractive, and safe environment for pedestrians and bicyclists so more people can use these environment-friendly active transport modes.
Reducing carbon footprint and improving air quality are two of the major measures that can help develop sustainable cities. Since private automobile contributes to air pollution, adopting active and non-motorized transport modes can help meet the requirements of these two major measures of sustainable city development and help people get exercise. Active and non-motorized transport modes can also help reduce the impacts of climate change by reducing traffic congestion and greenhouse gas emissions – which finally can lead to creating more inclusive, accessible, and equitable cities.
Transportation planners consider walking, bicycling, and public transport as active and sustainable transportation modes. Studies consider walk- and bike-friendly university campuses low carbon-emitting institutes that are environmentally safe and healthy. Active transport modes like walking and biking reduce traffic congestion as well (Pucher, Komanoff, and Schimek, 1999). Physicians and health experts recommend walking and bicycling because of the cardiovascular benefits they render to the users of these transport modes. Active commuting is a successful means for integrating habitual physical activity into daily life (Bopp, Kaczynski, and Wittman, 2011), which can help people with chronic diseases like type 2 diabetes. However, pedestrians, bicyclists, and public transport users are unprotected road users who are vulnerable to serious injuries and fatalities in case of a crash between an active traveler and a motor vehicle (Macioszek et al., 2023a; Apardian and Alam, 2020). Similarly, the users of a relatively newer mode of active transport called the electric scooters are at severe risk of being injured or killed by crashes involving a scooter and a motor vehicle (Macioszek et al., 2023b). Visually impaired pedestrians are also unprotected road users who are even more vulnerable to pedestrian-automobile crashes and susceptible to severe injuries and fatality (Apardian and Alam, 2015).
The travel behavior of a person to the college campus is a function of multiple factors. Travel behavior of campus communities has recently gained attention of the researchers. Unfortunately, there is a lack of academic research on the travel behavior of college communities in northwest Ohio. This study investigates the travel behavior of the students, faculty, and staff of the University of Toledo (UT) by examining the factors that affect their mode choice decisions for traveling to and on its main campus. Considering the importance of sustainable transportation planning for college campuses, the study examines the factors that can encourage people to commute to college campuses by walking and biking. It aims to contribute to making UT a showcase for sustainable campus development by encouraging its students, staff, and faculty community to adopt active transport modes for traveling to and on its main campus. The objectives of the paper are three-fold. The first objective is to examine the general travel behavior of the students, staff, and faculty to and on the main campus of the university. This is done by analyzing the descriptive statistics and graphs. The second objective is to identify the significant impacts of the built environment, personal, and socioeconomic characteristics on the choice of active travel modes to commute to and on campus. It is accomplished by using multinomial logistic regression models. The third objective is to provide recommendations for the campus planners to make the campus more sustainable and environment friendly, which are expected to help the campus planners of other similar universities, which will eventually contribute to sustainable city development. Lastly, while there are studies on the travel behavior of college communities, there is a lack in the literature in terms of mode choice decisions for traveling from their residences to university campuses and traveling on the same campuses. This study fills this gap by studying the factors that impact the mode choice behavior of a college community for both commuting to the university campus from their residences and commuting on the campus from one building to another.
The paper is organized in the following manner. Section 2 illustrates a review of the existing literature on the subject matter. The study area and multinomial logistic regression models are briefly introduced in Section 3 titled Materials and Methods. Section 4 presents the detailed results of the paper with Section 4.1 introducing the descriptive analysis and Section 4.2 reporting the results of the multinomial logistic regression models. While Section 4.3 and Section 4.4 explore the mode choice decisions for commuting to and on UT Main campus, respectively, Section 4.5 displays the marginal effects of the significant factors on walking, biking, and using Toledo Area Regional Transit Authority (TARTA) and UT shuttle. The paper lays out a discussion of the results and conclusion in Section 5. Lastly, Section 6 presents policy implications of the research.
2 Literature review
The literature review focuses on campus travel behavior. Balsas (2003) claims that the United States is highly dependent on automobiles and that campus planners can hardly provide access and mobility to college campuses. Sisson et al. (2008) explore the significant contribution of the built environment on the walkability of a college campus. Improved bicycling facilities reduce the number of automobile users in colleges, leading to congestion- and pollution-free campuses (Fernández-Heredia et al., 2014). Inadequate and inconvenient bicycle parking facilities discourage people from riding bicycles on college campuses, while many do not feel safe riding a bicycle at night, and the lack of bike lanes discourages people from riding bicycles. Also, the parking prices and transit fares impact the university community’s mode choice behavior (Proulx et al., 2019).
Men and women differ in travel behavior across the globe. Men are more likely to drive automobiles than women. Women, on the other hand, make a higher number of daily trips of shorter distances than men do (Hu, 2021; Uteng, 2011). Most people use automobiles while living more than five miles from campus and a small number of bicyclists ride bicycles on the sidewalks. In general, students are more likely to walk and bike with an improved sidewalk from their home to school (Ewing et al., 2004). Also, car ownership encourages people to drive instead of walking and bicycling (Eluru et al., 2012; Limanond et al., 2011). Age, gender, and distance from residence to university are key factors for travel by car to college campuses (Soria-Lara et al., 2017). Bicycle commuting depends on the connectivity and directness of the bicycle network structure (Schoner and Levinson (2014).
Literature suggests that people’s perceptions on alternative transportation modes differ with gender and that women are more sensitive in terms of the safety and feasibility of transportation modes (Kamargianni et al., 2015; Krizek et al., 2005; Nayar and Najafi, 2012). Researchers recommend building additional bicycle racks and installing streetlights to encourage female students to walk and bicycle on campus. They also argue for increasing car decal fees to discourage driving on campus. They explain that walking and bicycling are not only important for a healthy lifestyle but also vital for reducing pollution. Field (1999) reports that domestic students are more likely to travel by car than by bus or train.
Rybarczyk and Gallagher (2014) explore that faculty members consider bicycle safety and education the most crucial factors in riding bicycles and that higher automobile costs encourage staff to bicycling over driving. Whalen et al. (2013) find that cost, individual attitudes, and environmental factors like sidewalk and street density play important roles in the mode choice behavior of university students. Students are also more likely to ride a bicycle when there is a visible bicycle culture on campus (Bonham and Koth, 2010). Bopp et al. (2011) argue that students use active transport modes more than the faculty and staff. They also explain that psychological factors are the most significant variables in active commuting. Shorter distances encourage people to walk and bike to school, and the students travel the shortest commute distances and use alternative transport modes more frequently than the faculty and staff (Ewing et al., 2004; Fu et al., 2012). Long travel distances prevent students from using alternative transport modes like public transport and active modes, and commuters who live near transit stops are more likely to use public transit as their main travel mode (Fu et al., 2012; Ribeiro et al., 2020). Sisson and Tudor-Locke (2008) report that cyclists live nearer to college campuses than motorists, spend more time in active transportation, and perform more physical activity than motorists. Bicycle paths increase the number of bicyclists on campuses, and creating bicycle paths is easier than creating bicycle lanes on existing streets (Walton, 2011).
Women are less receptive to bicycles and non-motorized transport modes, although they use public buses more than men (Abasahl et al., 2018). Men students use more active transport modes, and some bus users ride the bus for economic reasons, not necessarily as a sustainable mode of transport (Hamad et al., 2021). Studies also find that harsh weather conditions (Hamad et al., 2021; Motoaki and Daziano, 2015; Ribeiro et al., 2020), inconvenient bus services (Hamad et al., 2021), and car ownership (Ribeiro et al., 2020) function as obstacles for students to use public and active transport modes. Risk factors have a higher explanatory value on bike-to-campus frequency than campus infrastructure and programs. Female students are more concerned about risk-related indicators such as theft-, road-, and environment-related obstacles (Kelarestaghi et al., 2019), while they have a cheerful outlook toward campus-related improvements like pro-bike programs and they are significantly more sensitive to infrastructural and environmental conditions (Abasahl et al., 2018; Kelarestaghi et al., 2019). Faculty and staff show a positive attitude toward the road and environmentally related obstacles compared to the students (Kelarestaghi et al., 2019). The probability of choosing a bicycle on a day with extreme weather event depends on the type of the event (snow, rain, etc.), the skills and experiences of the cyclist, and external factors like road conditions (Fernández-Heredia et al., 2014; Motoaki and Daziano, 2015).
Undergraduate female students tend to bike less to campus than other groups of students, and longer travel times, distant trips, not having access to a bicycle, and unsafe environments prevent female students from bicycling (Abasahl et al., 2018). Kim and Lee (2023) reveal that policies that aim to change commuter attitudes toward sustainable transport modes play equally effective roles as actual improvements in transportation systems. Studies also find that individual, social-environment, and physical-environment factors play an essential role in choosing a bicycle to school (Emond and Handy, 2012).
Moniruzzaman and Farber (2018) find transit pass and bike ownership as significant determinants for the students’ sustainable travel mode choice in seven campuses of four universities in the Greater Toronto Area in Canada. The propensity to use sustainable mobility increases if the students are informed about environmental issues (Cattaneo et al., 2018). The data from the seven campuses of four universities in Toronto also reveals that female students whose destinations are downtown campuses use more transit and active transport modes than those whose destinations are suburban campuses (Hasnine et al., 2018). Driving solo by the students decreases if improvements are made in the public transportation system (Cattaneo et al., 2018; Zhou et al., 2018), where they tend to live near transit stations. These students use more non-driving transport modes if the commute time is shortened (Zhou et al., 2018).
The cost of driving and parking, parking availability, access to a car, travel time, physical environment, reliability, and attitudinal variables play crucial roles in students’ mode choice behavior (Mohammadzadeh, 2020). Literature also suggests that campus size, Latino and Asian student dominance, private universities, number of full-time students, faculty/staff, years in operation, fall semester, and average daily temperature are positively associated with the number of bike trips. In contrast, distance from central business districts, age, part-time students, weekends, public holidays, time between semesters, summer semesters, and severe weather events are negatively associated with bike trips on university campuses (Kutela and Teng, 2019). Emond and Handy (2012) argue that the perceived distance is more important than the actual distance for high school students.
The reviewed literature reveals factors that encourage adopting active travel modes like walking and biking while also suggesting factors that discourage choosing such modes. High parking costs, low transit fares, improved bicycle facilities and sidewalks, higher street density, and short commuting distance to the campus play positive roles in a college community’s decision to use active travel modes. Studies find that students who live near transit stations are more prone to use public transit and that bicyclists live near transit stations. In contrast, car ownership, inconvenient bus service, long commute distances, lack of sidewalks, inadequate and inconvenient bicycle parking facilities, and harsh weather conditions play a negative role in a college community’s decision to adopt active travel modes. Safety appears to be a significant factor as well that guides female students in adopting environment-friendly modes like walking and bicycling. This leads to the gender-based observation that male students use more active transport modes than their female counterparts. Risk-related indicators such as theft-, road- and environment-related obstacles, lack of streetlights at night, and lack of police presence make women less receptive to bicycles and non-motorized modes, although they are more receptive to public bus transit than males. Literature also shows that domestic students drive a car more than international students, students use active travel modes more than faculty members and staff, and the faculty members consider safety and education the most crucial factors in riding bicycles. Lastly, socio-cultural factors like positive walk and bicycle culture and the ecological footprint of campus also play roles in choosing active travel modes to commute to and on campus.
The reviewed literature explores a wide array of factors that affect travel mode choice for either commuting to or on college campuses. Unfortunately, there is a gap in the literature that investigates the travel behavior of a college community for commuting both to and on their campuses simultaneously. This paper fills this gap by investigating the factors that significantly affect the mode choice behavior of a college community for both commuting to the college campus from their residences and commuting on the campus from one building to another. Also, because the United States is a huge country with varying nature of weather and landscape conditions, it is important to understand the nature of the mode choice behavior of college communities representing different geographical regions in the United States. Unfortunately, although there are studies that investigate the travel behavior of college communities in different countries and a few cities in the United States, there is a lack of academic journal articles on the travel behavior of a mid-sized college community (2023 student enrollment of around 15,000) in the northeastern side of the Midwest region of the United States.
There are studies on a couple of college campuses in the Midwest region, though, which are remotely comparable to this study (Bopp et al., 2011; Akar et al., 2013). First, those university campuses are larger than the University of Toledo: Ohio State University campus in Columbus, Ohio, has around 60,000 students while Kansas State University, in Manhattan, Kansas has little over 20,000 students. Second, geographically Kansas State University is almost in the middle of the United States from both north-south and east-west directions and more than 800 miles away from the University of Toledo. Ohio State University, although located inside the state of Ohio, enjoys better weather in Columbus than in Toledo which gets a lot of lake effects. Ohio State University community also experiences the culture of a bigger city in Columbus. In contrast, the University of Toledo is in the northeastern side of the Midwest region of the United States. As such, both Ohio State University and Kansas State University are in contrast with the University of Toledo in terms of their population sizes and geographic locations. Third, Akar et al. (2013) in their study on Ohio State University, focus on bicycle choice and gender case study only; they do not focus on another active transport mode ‘walking.’ Finally, Akar et al. (2013) and Bopp et al. (2011) studies on Ohio State University and Kansas State University do not investigate commuting patterns for both to and on their respective campuses, which leaves us with a lacuna in terms of studies of campus travel behavior in a “mid-sized” college campus in the northeastern side of the Midwest region in the United States that investigates travel behavior of the college community for commuting to and on its campus. This study fills these gaps by analyzing the mode choice behavior of the University of Toledo community, which represents a mid-sized university in the northeastern side of the Midwest region in the United States.
3 Materials and Methods
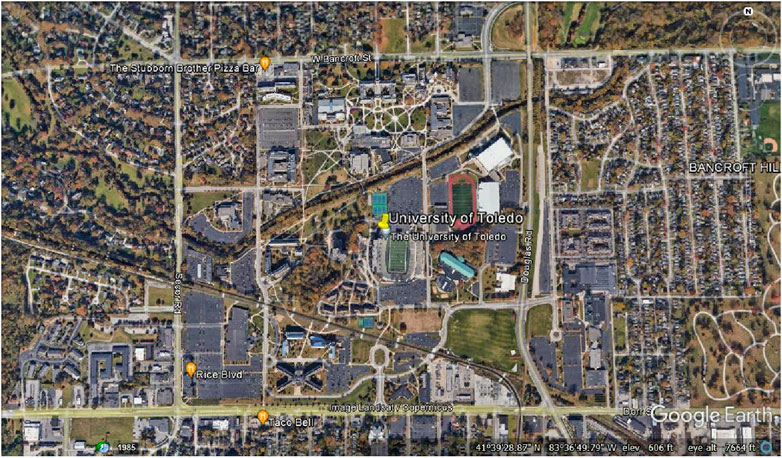
The University of Toledo is a public metropolitan university in northwest Ohio, United States. Established in 1872, it is a student-centered research university with around 15,000 enrolled students. It has three campuses: The Main campus, the Health Science campus, and the Scott Park campus (The University of Toledo, 2024). Among these campuses, the Main campus is the largest, having an area of 1.27 sq. miles, while the Health Science campus has an area of 0.70 sq. mile, and the Scott Park campus has an area of 0.25 sq. mile. The number of enrolled students is also higher on the Main campus. Figure 1 shows the relative location of the Main campus of the university compared to its surrounding built environment. It is surrounded by W. Bancroft Street in the North, Dorr Street in the South, Douglas Road in the East, and Secor Road in the West.
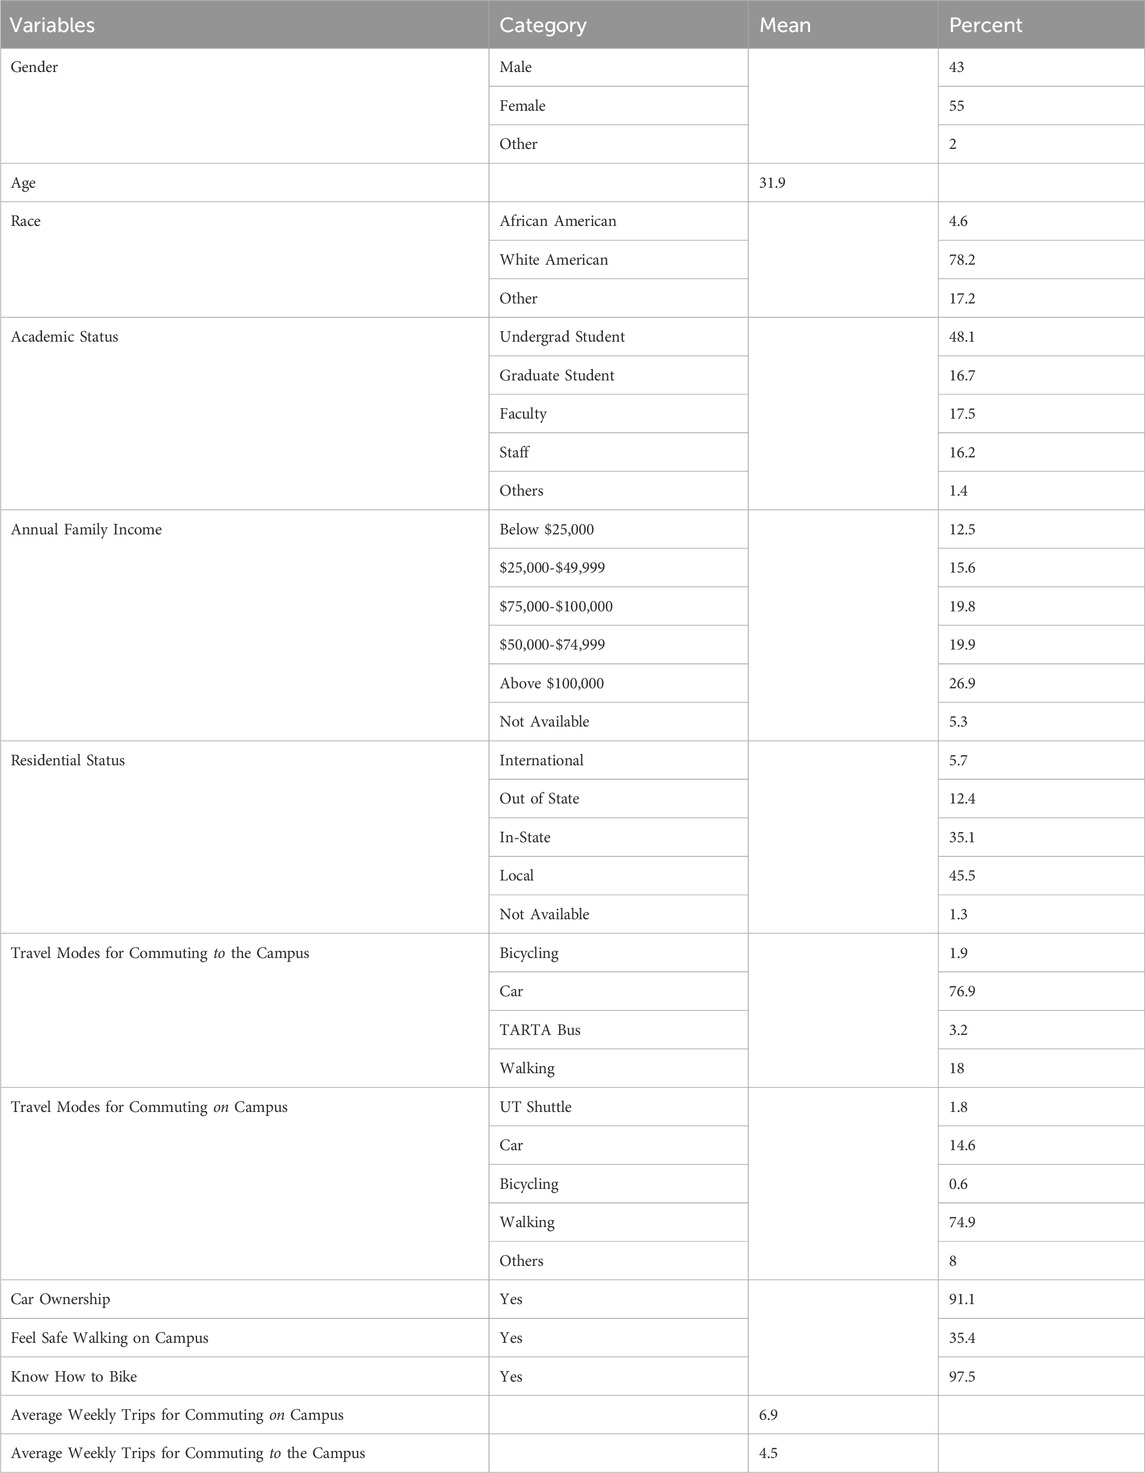
Data for the study was collected by a campus-wide detail survey. A total of 1210 students, faculty, and staff participated in the web-based survey. Table 1 displays the descriptive statistics of the respondents, which are self-explanatory. Among the survey respondents, 55% are female. The majority (52.2%) of the survey respondents are between 20 and 35 years old. The undergraduate students represent the highest (48.1%) proportion of the respondents.
The study developed discrete choice models for quantitative analysis. It employs multinomial logistic (MNL) regression models to deal with discrete mode choice outcomes. The first MNL regression model included 1147 responses, while the second one included 1150 responses. The models explain the effects of independent variables on the respondents’ mode choice decisions. Random Utility Theory is the basis of the discrete choice model. Here, the utility is the value of an index that makes the preference for a specific alternative. Random Utility Theory assumes that a decision-maker chooses the alternative that yields the highest utility (Ben-Akiva and Lerman, 1985). The following probability equations explain how a decision-maker chooses one alternate from a set of choices.
where, P(i\Cn) is the probability of a decision maker n choosing an alternative i from a choice set Cn, Uin is the utility observed by the decision maker n in choosing alternative i from a choice set Cn, j represents the alternative that the decision-maker n does not choose due to its lower utility than that of alternative i, and Cn represents different alternatives in a choice set. In this study, Cn represents alternative travel modes like walking, bicycling, TARTA, UT Shuttle, and car. TARTA is the public transport agency that has been serving the Toledo area since 1971. It connects the campus to dispersed parts of the city. UT Shuttle, on the other hand, serves the UT community on campus and its vicinity areas. The utility observed by the decision maker n in choosing alternative i from a Cn alternative is:
where, Vin is the known portion of the utility and ein is the unknown portion of the utility. Vin is dependent on the observed characteristics of the decision maker (xin) and vector of coefficients of the variables βin.
where, xin are the observed variables, βin is the vector of coefficients of the variables, and εin is the random component.
Ben Akiva and Lerman (1985) state that the logistic regression models arise from the assumption that the difference in the error terms is logistically distributed. As such, the study develops multinomial logistic regression equations to model the mode choice a person makes from a set of alternatives, Cn, like walking, bicycling, TARTA, UT Shuttle, and car. Multinomial log odds or logits explain the results of the MNL regression model. The odds ratio is the ratio of one probability compared to all other probabilities. Logit means the log of the odds ratio. In short, logit (p) = log (odds), where Odds= p/(1-p) (Ben-Akiva and Lerman, 1985). The coefficients of the MNL regression models indicate the log odds or the logits. The study sets ‘car’ as the base mode in both models. Equation 5 can express the logistic regression model.
where, p is the probability, β0 represent the y-intercept, β1, β2, ..., βn represent the coefficients of the independent variables, and X1, X2, ..., Xn indicate the independent variables.
Under the assumption of the multinomial logit model and based on the principles of Utility maximization, the probability of choosing an alternative i is given by Equation 6.
The notations have been discussed earlier while discussing Equations 1–5.
4 Results
4.1 Descriptive analysis
Travel mode choice is the dependent variable of the study, and its available options are driving, bicycling, walking, riding public transit named TARTA, and taking the UT shuttle. It is worthwhile to mention here that both TARTA and UT Shuttle are public transportation services that operate on fixed schedules. The independent variables are chosen based on the existing literature, authors’ knowledge of the topic and study area, and by running multiple experimental models. The study considers that being female may positively impact mode choice decisions and believes that faculty and staff may like to walk and bike less than driving cars. It assumes that extreme weather conditions might have a negative impact on the decision to walk or ride a bicycle and that knowing how to ride a bicycle might increase the probability of bicycling and decrease the likelihood of driving a car. The authors further consider that the probability of walking and bicycling have a positive relationship with the perception of safety and that bicyclists and pedestrians may change their travel mode with the change of semesters. The study assumes that trip frequency influences the campus community’s mode choice decision. As such, it derived the number of weekly trips as a potential factor to develop the model. In brief, the independent variables of the study are car ownership, travel distance, gender, residency status like in-state or out-of-state, perception of safety for walking, number of trips per week, weather, age of the respondent, academic standing of the students like graduate or undergraduate, income, whether the respondent knows how to bicycle, perception of safety in using UT shuttle, and status like faculty, staff, or students. The independent variables include both continuous and dummy variables. The authors ran two MNL models – one to identify the factors influencing people’s decision to choose travel modes for commuting to the UT Main campus, and the other one to identify the factors responsible for people’s decision to choose travel modes to commute on the UT Main campus.
The study uses the nearest road network intersection points from the respondents’ residences as the base locations for validating travel distances to the campus (Google Maps, 2024). Figure 2 displays approximately 95% of these intersection points to provide an overview of the locations of the respondents. The geographic locations of the rest of the respondents are further away from the UT Main campus and are not reflected in Figure 2. Figure 3 represents the relationship between travel modes and travel distance. It illustrates that 43% of car users live within five miles of the campus. Multiple mode users use more than one mode, i.e., walking, bicycling, and riding on a bus for commuting to the campus. Figure 3 also shows that 95% of multiple-mode users live within five miles of the campus. Respondents who use skating boards, hoverboards, unicycles, motorbikes, etc., are marked as “others” mode users in the study.
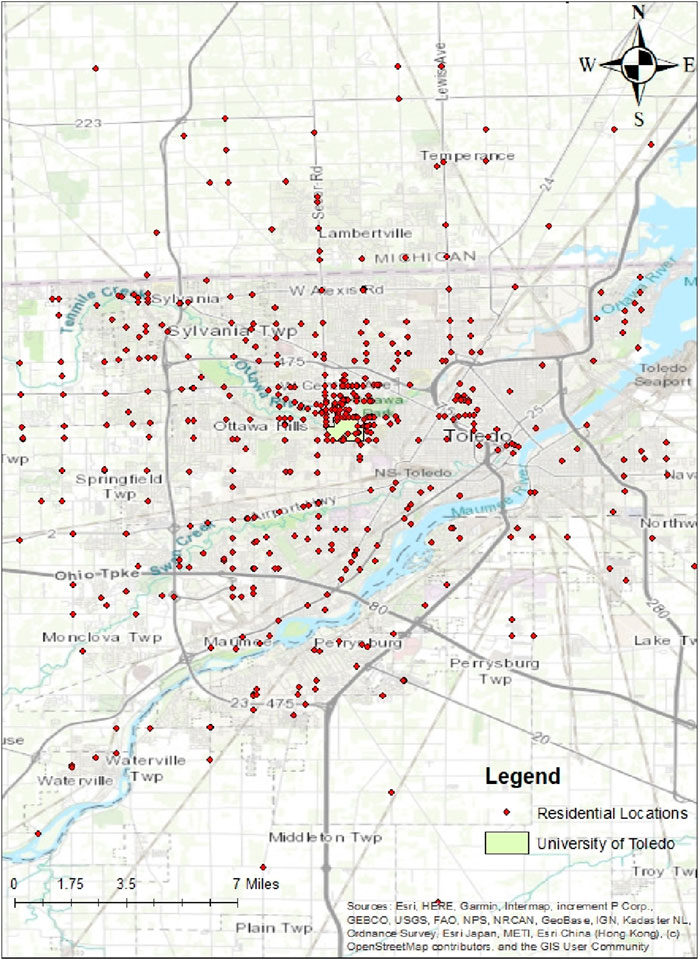
Figure 2. Nearest intersections of the residential locations of the respondents who commute to UT main campus.
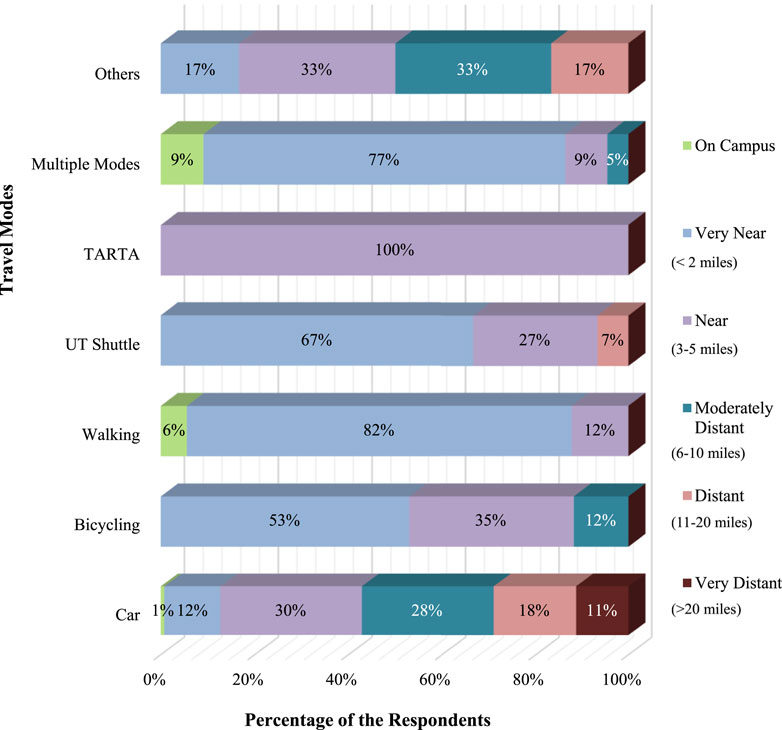
Figure 3. Relationships between percentages of respondents using different travel modes and travel distances to UT main campus.
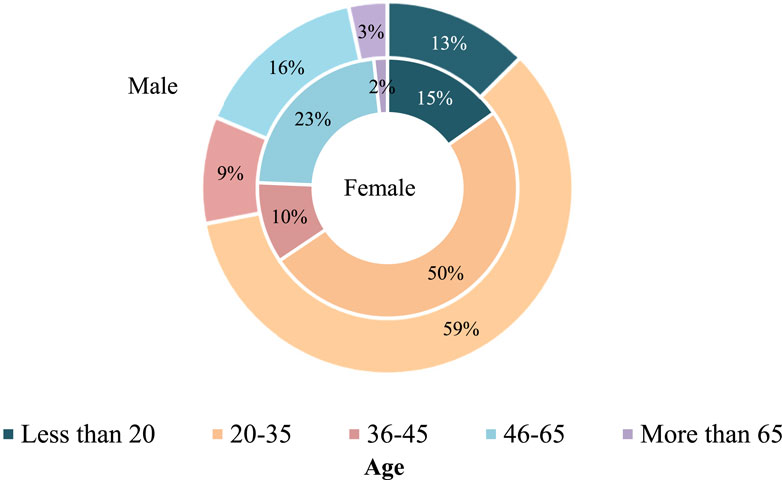
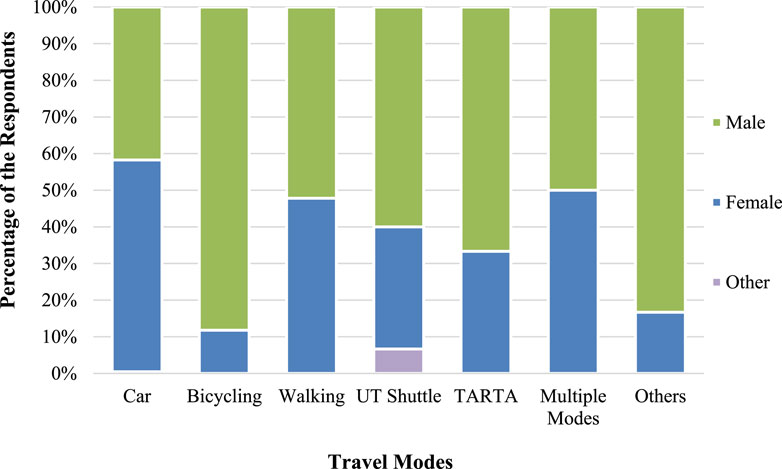
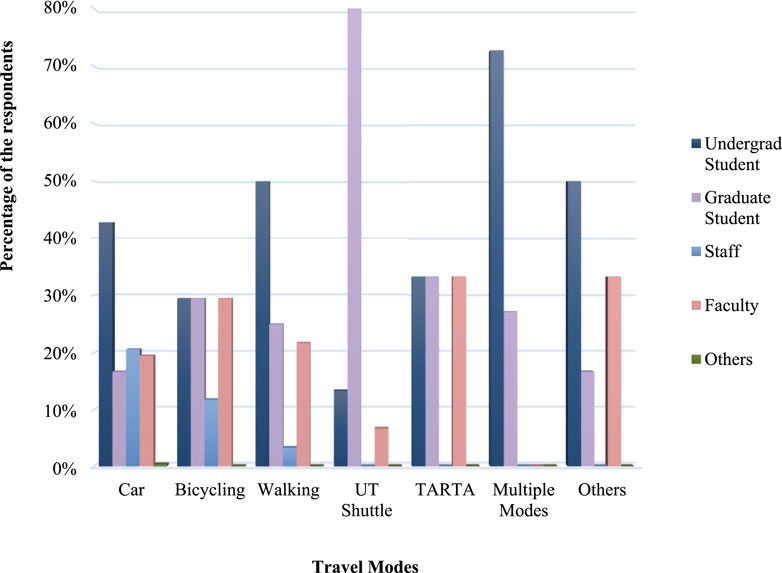
Figure 4 illustrates the relationships between age groups and gender of the participants. It shows that 59% of the male respondents are between 20 and 35 years old, while that for the female respondents is about 50%. The percentages of the teen respondents (younger than 20 years old) in the male and female groups are similar – 13% for the male and 15% for the female respondents, respectively. Figure 5 depicts that a major share of the female respondents (58%) use a car as their primary mode of transport for commuting to and on UT Main campus, while they ride a bicycle the least (little over 10%). In contrast, about 90% of the bicycling is done by male respondents. Among the TARTA users, about 67% are male. A little over half (53%) of the pedestrians are male, while the rest are female. Among the respondents who opt for multimodal transportation options, about half are female. Figure 6 illustrates that about 80% of the UT Shuttle users are graduate students, while only about 13% are undergraduate students. It also shows that about 7% of the UT Shuttle users are faculty members, while that for the staff members is negligible. The same figure also represents that about 50% of pedestrians in the study are undergraduate students, followed by 25% graduate students, 3% staff, and 22% faculty members. The study explores that among the respondents, the proportion of undergraduate students, graduate students, and faculty members who ride a bicycle is the same (29%), while that for the staff members is approximately 12%. Forty-three percent of the respondents who drive cars for commuting to and on campus are undergraduate students, while those for the graduate students, staff, and faculty members are 17%, 21%, and 19%, respectively. An interesting finding of the study is that the percentages of staff and faculty members who use multiple transport modes are negligible, while those for the undergraduate and graduate students are 73% and 27%, respectively. Like in the case of bicycle usage, the same proportions of undergraduate students, graduate students, and faculty members use the public transit mode TARTA, which is 33% for each group. Lastly, Figure 6 displays that about half of the respondents who use “other modes” are undergraduate students, while that for the graduate students and faculty members are 16% and 33%, respectively. The figure shows that the staff members are the group who utilize the active transport modes the least.
4.2 Multinomial logistic regression models
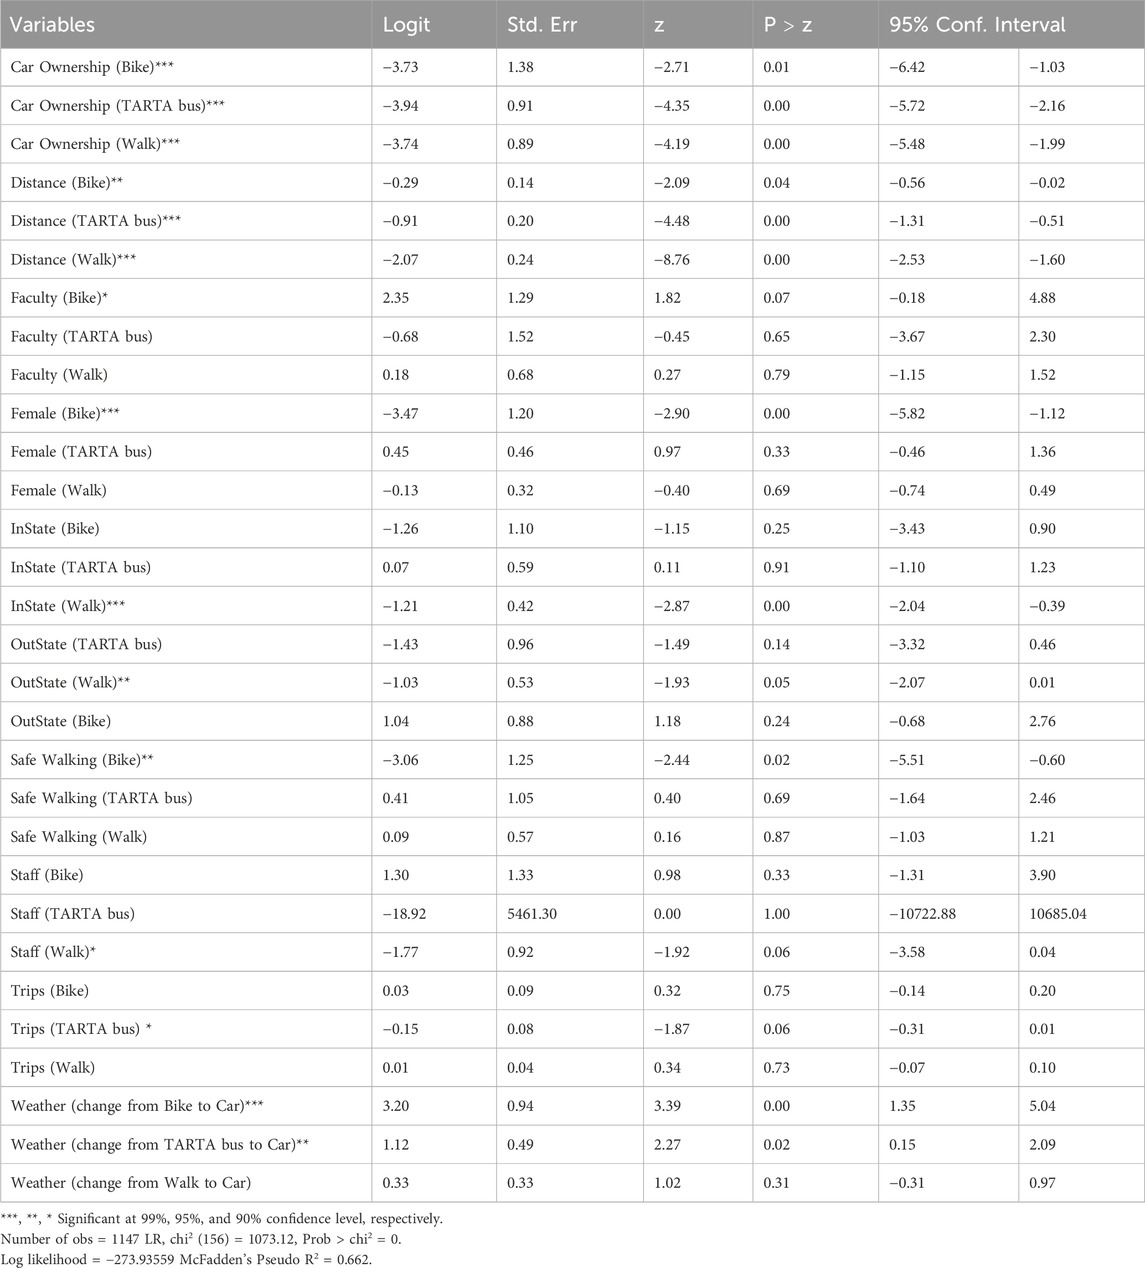
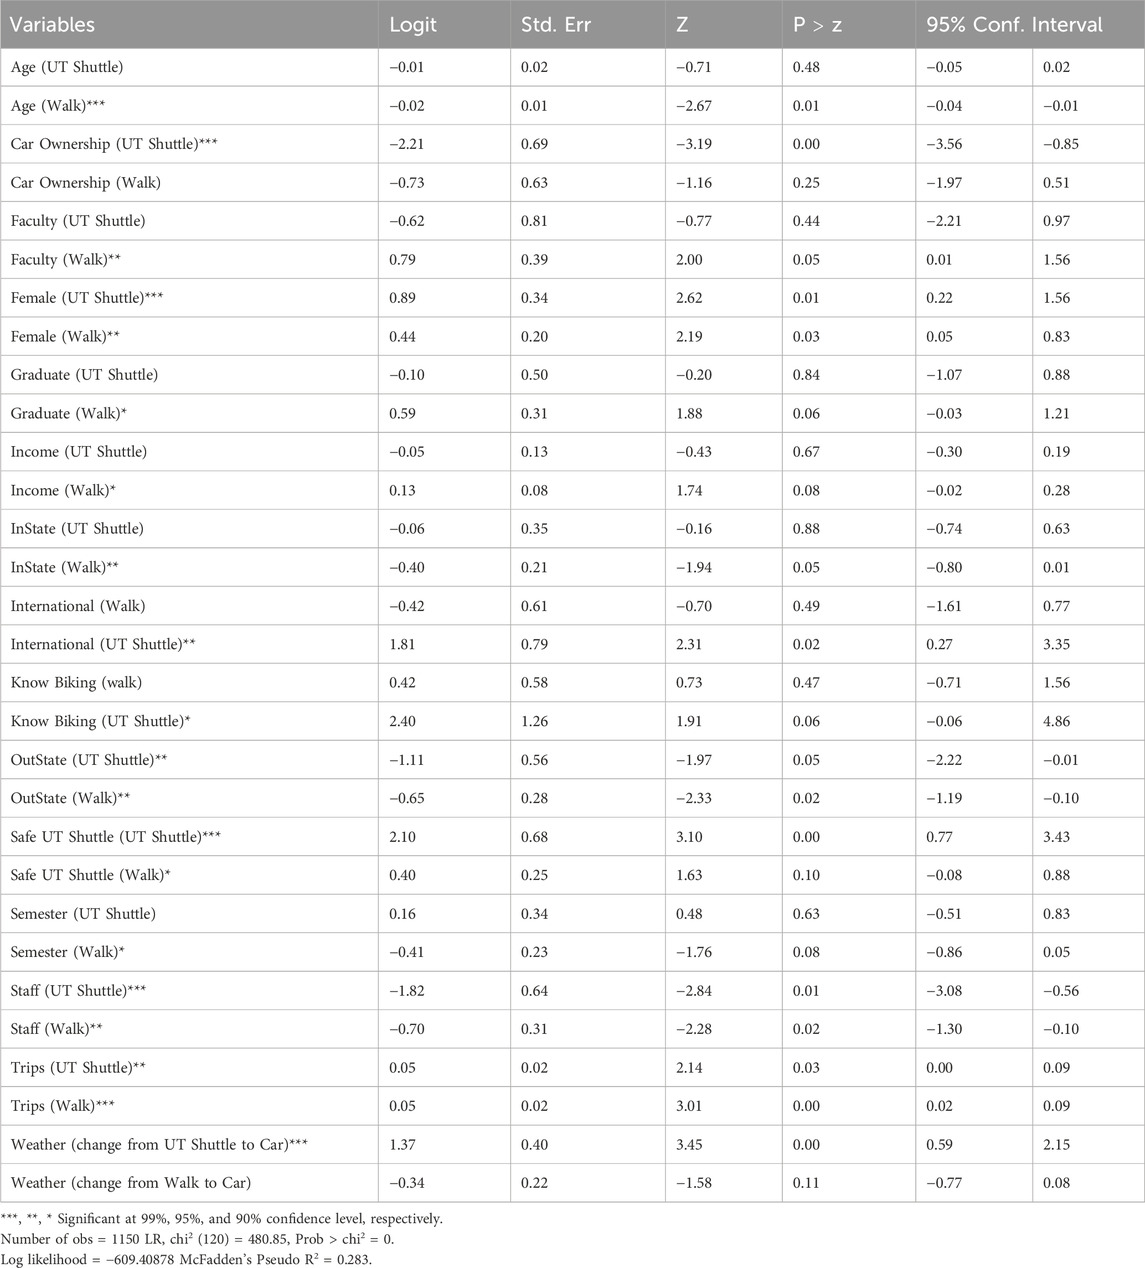
The study runs MNL regression models to identify the travel mode choice decisions of the UT Main campus community. For the first model (Table 2), the probability of obtaining the Chi-square statistic (1002.22) is 0.000 if there is no effect of the independent variables on the dependent variable for commuting to UT main campus. Similarly, the probability of obtaining the Chi-square statistic (421.66) is 0.00 for the second model (Table 3), which explores the relationships between the independent variables and the dependent variable for commuting on UT main campus. As the p-values for the Chi-square tests in both models are 0.000, we can state that the models are significantly better than the respective null models.
4.3 Mode choice decisions for commuting to UT main campus
Table 2 represents the results of the MNL regression model for commuting to the UT Main campus. It shows that travel distance is a major factor in choosing a travel mode. As expected, the study finds that people prefer a car to travel longer distances to reduce travel time. If travel distance increases, the UT community chooses cars over walking, bicycling, and riding a TARTA bus. The multinomial log-odds for bicycling compared to driving a car decrease by 0.29 units for a one-mile increase in travel distance. The multinomial log-odds for walking compared to driving a car decrease by 2.07 units if distance increases by one mile. Besides, if travel distance increases by one mile, the multinomial log odds for riding a TARTA bus compared to driving a car decrease by 0.91 units. Faculty members are more likely to ride bicycles and staff members are less likely to walk compared to undergraduate students. The multinomial logit for faculty members relative to undergraduate students is 2.35 units higher for bicycling compared to driving a car, given all other predictors constant. Awareness about sustainability and consciousness about health among the faculty members can be the reasons behind such results. The multinomial logit for staff members relative to undergraduate students is 1.77 units lower for walking compared to driving a car. The negative coefficient of female bicyclists indicates that women are less likely to ride a bicycle to commute to the campus. The multinomial logit for females relative to males is 3.47 units lower for bicycles compared to driving a car, given all other predictors constant. Lack of bicycling facilities and negative perception of safety may be the reasons behind the result.
The number of weekly trips also affects people’s mode choice decisions. The result indicates that if the number of trips increases by one, the probability of driving a car will be higher than riding a TARTA bus. The multinomial logit for the number of trips is 0.15 units lower for taking a TARTA bus than driving a car, given all other predictors constant. A longer headway between TARTA buses may be responsible for such a result. Compared to local people (originally from Toledo), in-state people (originally from Ohio but not from Toledo) prefer a car to walk. The multinomial logit for in-state people relative to local people is 1.21 units lower for walking than driving a car. The log odds for out-of-state people relative to local people is 1.03 units lower for walking than driving a car. Out-of-state people and in-state people usually live farther away relative to local people. Distant locations of residences of the people can be the reason behind such a result. Car ownership is negatively associated with mode choice probability. People who own a car are less likely to walk, bike, and ride a TARTA bus than to drive an automobile. The multinomial logits for car ownership are 3.74, 3.73, and 3.94 units lower with respect to those without car ownership for walking, biking, and riding a TARTA bus, respectively, compared to driving a car, given that all other predictor variables in the model are constant. Another essential factor of this model is weather. The results indicate that the UT community is less likely to ride bicycles and take TARTA bus in severe weather. The multinomial logit for “changing modes” from bicycling and taking a TARTA bus to driving a car based on extreme weather are 3.20 and 1.12 units, respectively. These indicate that in extreme weather like snow, the odds of the UT community driving a car is 3.2 units higher than bicycling and 1.12 units higher than taking a TARTA bus.
4.4 Mode choice decisions for commuting on UT main campus
Table 3 represents the results of the MNL regression model for mode choice behavior on the UT Main campus. The results show that age is negatively associated with walking mode. It denotes that people of older ages are less likely to walk on campus than to drive cars. If age increases by 1 year, the multinomial log-odds for walking compared to driving a car decrease by 0.02 units while holding other variables constant. Usually, older people are physically weaker than younger people. This can be a reason behind the finding. Car ownership is negatively associated with the mode choice probability of UT Shuttle users. People who own a car are less likely to ride the UT Shuttle. The multinomial logit for car ownership is 2.21 units lower for taking UT Shuttle on campus than driving a car. Compared to undergraduate students, faculty members are more likely to walk while staff members are less likely to walk and ride a UT Shuttle on campus. The multinomial logit for faculty members relative to the undergraduate students is 0.79 units higher for walking compared to driving a car. The multinomial logit for the staff members relative to the undergraduate students is 1.82 units lower for taking the UT Shuttle and 0.70 units lower for walking compared to driving a car. The results also show that graduate students walk more on campus than undergraduate students. The log odds of walking compared to driving a car on campus is 0.59 units higher for graduate students. Faculty and graduate students are more aware of sustainability and more conscious about health, which can be the reasons behind such findings. The coefficients of females for walking and taking UT Shuttle are positive compared to males. It indicates that women are more likely to walk and ride UT Shuttle on campus. The multinomial logit for females relative to males is 0.89 units higher for taking UT Shuttle and 0.44 units higher for walking than driving a car on campus.
The result denotes that people who feel safe riding the UT Shuttle are more likely to ride the UT Shuttle and walk on campus. The multinomial logit for people who feel safe riding the UT Shuttle is 2.10 units higher for taking the UT Shuttle and 0.40 units higher for walking compared to the people who feel unsafe riding a UT Shuttle. Income is a significant factor in mode choice decisions at a 90% confidence level. The result shows that higher-income people walk more than lower-income people. If annual family income goes one tier up, the multinomial log-odds for walking increases by 0.13 units. This finding is different from what the authors predicted. As the income of faculty members compared to other groups of people is higher and they prefer walking on campus, the authors find this finding making sense. Compared to local people, in-state and out-of-state people prefer cars to walking. The multinomial logit for in-state people relative to local people is 0.40 units lower for walking compared to driving a car. The log odds for outside Ohio people relative to local people is 0.65 units lower for walking and 1.11 units lower for taking the UT Shuttle than driving a car. The results show that the log odds for international people are 1.81 units higher for taking the UT Shuttle compared to driving a car. This means that international people use the UT Shuttle more than the local people. UT Shuttle provides a public place for international people to communicate and make new friends. For this reason, international people find riding the UT Shuttle more interesting than the locals. People who know how to ride a bicycle are less likely to drive a car compared to taking the UT Shuttle. The multinomial logit for people who know how to ride a bicycle is 2.40 units higher for taking UT Shuttle compared to driving a car, given all other predictors constant. The study finds from the descriptive statistics that international students are the highest percentage of UT Shuttle riders. Most of them know how to ride a bicycle and do not own a car. As such, they prefer UT Shuttle to move on campus.
The results also reveal that the number of trips per week is positively related to walking and riding UT Shuttle. If the number of trips increases, the UT Main Campus community chooses to walk and ride the UT Shuttle over driving a car. If the number of trips increases by one unit, the multinomial log-odds for walking and taking the UT Shuttle compared to driving a car increase by 0.05 units while holding all other variables in the model constant. It is tough to get car parking space available near the buildings. On the other hand, UT Shuttle moves frequently on campus. As a result, when the number of trips increases, a person prefers walking or taking UT Shuttle to drive a car. The results also denote that the UT community is more likely to drive a car compared to riding the UT Shuttle in severe weather conditions. The multinomial logit for “changing modes” from taking a UT Shuttle to driving a car based on extreme weather is 1.37 units. This indicates that in extreme weather like snow, the odds of the UT community driving a car is 1.37 units higher than taking a UT Shuttle. The results further show that the multinomial logit for changing travel mode based on semester is 0.41 units lower for walking compared to driving a car. It means that car users change their travel modes more than pedestrians as the semester changes. It is worthwhile to mention that there is no UT Shuttle in the summer semester when people drive cars to move on campus.
4.5 Marginal effects of significant factors on walking, biking, TARTA, and UT shuttle
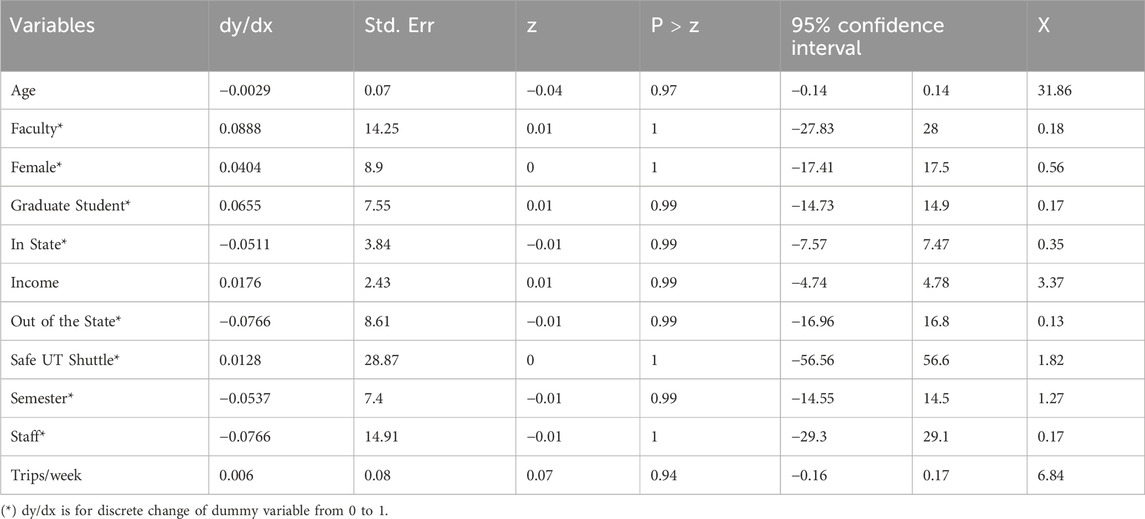
Tables 4–6 present the marginal effects of the significant factors in choosing bicycling, walking, and TARTA buses for commuting to the UT Main campus, respectively. The dy/dx notation denotes marginal effects estimated at the sample means of the covariates and represents the effect of a one-unit change in the explanatory variable on the probability of taking a certain transportation mode compared to driving a car. Results indicate that travel distance, weather, and car ownership are more sensitive factors for bicycling compared to walking and riding a TARTA bus. If distance increases by one mile, the probability of choosing a bicycle decreases by 0.0001 percentage points while the probability of walking and taking TARTA buses compared to driving a car decreases by 0.00003 and 0.00009 percentage points, respectively. Mild weather significantly increases the likelihood of riding a bicycle and TARTA buses compared to driving a car but does not affect the probability of walking. Weather shows a more significant impact on the probability of riding a bicycle compared to taking TARTA buses. The results show that in extreme weather, the probability of choosing a bicycle decreases by 0.0011 percentage points, while the probability of taking TARTA buses compared to driving a car decreases by 0.00011 percentage points. The results also show that car ownership is more sensitive to bicycling than walking and taking a TARTA bus. It shows that if a person owns a car, the probability of riding a bicycle decreases by 0.0013 percentage points, while that for walking and taking TARTA buses compared to driving a car decreases by 0.00006 and 0.00039 percentage points, respectively.

Table 4. Marginal effects of the significant factors (riding a bicycle for commuting to UT main campus).

Table 6. Marginal effects of the significant factors (riding a TARTA bus for commuting to UT main campus).
Tables 7, 8 show the marginal effects of the significant factors in choosing walking and UT Shuttle to move on campus, respectively. Table 7 shows that if age increases by 1 year, the probability of walking compared to driving a car decreases by 0.29 percentage points. Results show that compared to driving a car, the female respondents are more likely to walk on campus relative to the male respondents. If a person is female, the probability of walking relative to driving a car increases by 4.04 percentage points. Results also explore that if the annual family income of a person goes one tier up, the probability of walking on campus increases by 1.76 percentage points. Compared to undergraduate students, the probability of walking relative to driving a car increases by 8.88 percentage points if a person is a faculty member, while it increases by 6.55 percentage points compared to driving a car if a person is a graduate student. On the other hand, the probability of walking relative to driving a car decreases by 7.66 percentage points if a respondent is a staff member. The study shows that instate (not from Toledo, but from Ohio) and out-of-state people (not from Ohio, but from the US) are less likely to walk, by 5.11 and 7.66 percentage points, respectively, compared to driving a car relative to the local people (from Toledo). Table 7 shows that the probability of walking increases by 0.60 percentage points compared to driving a car if the number of weekly trips increases. Furthermore, it explores that if a person feels safe to ride on a UT Shuttle, the probability of walking compared to driving a car increases by 1.28 percentage points. Lastly, Table 7 shows that if a person chooses to change travel mode with the change of semester, the probability of walking decreases by 5.37 percentage points compared to driving a car – it is probably due to the snowy and icy road conditions in the spring semester.
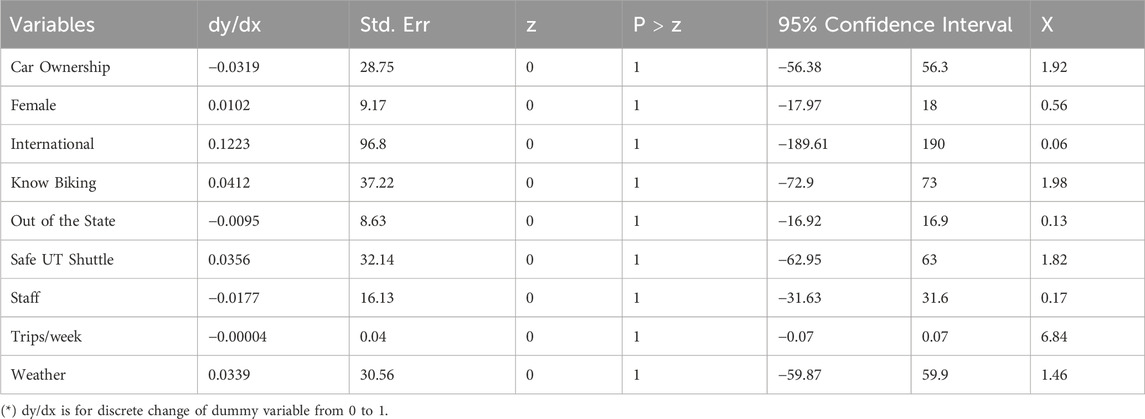
Table 8. Marginal effects of the significant factors (choosing UT shuttle for commuting on UT main campus).
Table 8 shows that female members of the university community are more likely to ride a UT Shuttle on campus than their male counterparts compared to driving a car. If a person is female, the probability of riding a UT Shuttle relative to driving a car increases by 1.02 percentage points. For on-campus travel for the staff members, the likelihood of taking a UT Shuttle relative to driving a car decreases by 1.77 percentage points. Results indicate that the out-of-state people (not from Ohio, but from the United States) relative to the local people (from Toledo) are less likely (a decrease of 0.95 percentage points) to take a UT Shuttle compared to driving a car. On the other hand, if a person is from outside the United States, i.e., the international people visiting UT, the probability of riding on a UT Shuttle increases by 12.23 percentage points compared to driving a car. Table 8 also identifies that if the number of weekly trips increases, the probability of taking a UT Shuttle decreases by 0.004 percentage points compared to driving a car. Car ownership reduces the likelihood of riding on a UT Shuttle compared to driving a car on campus. If a person owns a car, the probability of taking a UT Shuttle decreases by 3.19 percentage points. The study also indicates that if a person feels safe to ride on a UT Shuttle, the probability of taking the Shuttle compared to driving a car increases by 3.56 percentage points. It further finds that if a person knows how to ride a bicycle, the probability of riding a UT Shuttle compared to driving a car on campus increases by 4.12 percentage points. Lastly, the results indicate that the University of Toledo community is more likely to ride on a UT Shuttle in severe weather than to drive a car. It shows that in extreme weather, the probability of taking a UT Shuttle compared to driving a car increases by 3.39 percentage points.
5 Discussion and conclusion
The model results identify a few significant factors that determine the UT Main campus community’s mode choice decision for commuting to and on campus. Results show that car ownership, travel distance, age, gender, academic status, income, perception of safety, number of weekly trips, and weather conditions affect people’s mode choice decisions significantly. The study finds that increasing travel distance, age, and being a staff member positively impact car mode choice and that the faculty members are more likely to bike and walk compared to undergraduate students. Unlike the authors’ predictions, the results show that higher-income people are more likely to walk on campus. The results also show that car users change travel modes more often than active transport mode users based on semesters. Surprisingly, the results show that though women are less likely to bike to the campus, they are more likely to walk and bike on campus. The number of trips affects people’s mode choice decisions differently for both models. For the first model, if the number of trips increases, people prefer cars to walk, bike, and ride a TARTA bus to commute to the campus. Contrarily, if the number of trips increases for the second model, people prefer walking to driving a car on campus.
Because travel distance is a major factor that determines the campus community’s mode choice decision, it might be fruitful for the university authority to communicate with the city authority and collaborate on finding a rational solution in terms of providing more and better housing options near the campus. For instance, the university authority could contemplate providing less expensive housing or apartments near the university campus. It is expected to encourage and increase the number of walkers and bicyclists to commute to the campus. To contribute to sustainable city development by introducing an environment-friendly transport system on campus, the university authority can launch bike-share programs for the campus community. Furthermore, it can introduce a bike loan program and install more bike corrals on campus, monitored by security cameras. The study suggests that campus planners take a wide array of proper measures for promoting active transport modes on campus, which will help the city planners create environment-friendly, healthy, and sustainable cities. For example, the authors recommend improving walkways and bike lanes, providing better lighting systems, and making more police patrol at night to inspire the college community to adopt walking and biking for commuting to and on campus.
Using descriptive statistics and multinomial logistic regression models, the paper investigated the travel behavior of the students, faculty, and staff of the University of Toledo by examining the factors that affect their mode choice decisions for traveling to and on its main campus. It finds that the UT community opts for driving a car over walking, bicycling, and riding a TARTA bus if the distance between residence and the campus increases. Faculty members are more prone to bicycle commuting to the campus and more likely to walk on campus. The staff members are less likely to walk both to and on campus, and less prone to ride a UT shuttle while on campus. Female students ride a bicycle to the campus significantly less than males, but they walk and ride a UT shuttle more than their male counterparts on campus. The results reveal that both the instate (from within Ohio but outside Toledo) and out-of-state students walk significantly less for commuting to and on campus compared to the local students from the Toledo area. The out-of-state students also ride a UT shuttle less than their local counterparts. For commuting on campus, the graduate students walk more compared to the undergraduate students while the international students ride the UT shuttle compared to the local students. Also, for on-campus commutes, relative to driving a car, people with higher income walk more compared to their counterparts, people who know how to bicycle ride the UT shuttle more compared to those who do not know bicycling, car users change their travel modes more than pedestrians as semester changes, and increasing age leads to less walk. The people who feel safe walking to UT’s main campus ride a bicycle significantly less compared to those who feel unsafe walking. People who feel it safe riding a UT shuttle on campus walk and ride the UT shuttle compared to the people who feel unsafe taking a UT shuttle. In the event of extreme weather, the UT community is less prone to ride a TARTA bus and a bike to commute to the campus, while they are less likely to take a UT shuttle while on campus. If the number of trips goes up for the UT community, it makes less usage of the TARTA bus to commute to the campus while they walk and ride the UT shuttle more for commuting on campus. Finally, people who own a car are less likely to walk, bike, and ride a TARTA bus than to drive an automobile to commute to the campus compared to those without car ownership, while they are also less prone to ride a UT shuttle for commuting on campus.
6 Policy implications
Scientists have been relentlessly working to increase awareness among people about the impacts of climate change on our planet. They consider air pollution as one of the primary causes of global warming and climate change (Nayar and Najafi, 2012). They also claim that motorized transport is one of the major sources of air pollution. Considering this, urban planners strive to provide sustainable cities with fewer motorized vehicles. Similarly, campus planners have been working to introduce active transportation systems, i.e., bike share and safe walk programs on campuses that promote sustainable university campuses.
Achieving sustainable cities requires prioritization of active and non-motorized transport modes in urban and regional planning and design. Such prioritization should include creating safe campuses that are pedestrian- and bicycle-friendly, introducing pedestrian- and bicycle-friendly physical infrastructure, creating an environment that promotes the use of public transport, and introducing and implementing policies that discourage and deter the use of private automobiles. This extensive study on campus travel behavior in the Midwest United States aims to meet these objectives by identifying the factors that prevent the university community from walking and biking. The concerned authorities at this university, as well as in other universities with similar characteristics, are expected to make and implement the policies according to its findings to promote walking and biking to and on their campuses. Such policies will encourage the students, staff, and faculty to choose active transport modes over operating motorized modes. As an extensive study, this paper will help the campus planners, transportation planners, transit planners, and practitioners to get a comprehensive idea of the campus travel behavior of a mid-sized Midwest college community.
While studies have been focusing on the important theme of sustainable city development from different perspectives, it is also important to study the status and create environment-friendly and sustainable university campuses essential for developing sustainable cities. Such a noble goal deserves more research from a wide array of geographical locations to get a holistic idea about the existing conditions of travel behavior of university campuses around the world. The findings of this study are expected to help achieve this goal by assisting urban planners in building environment-friendly and sustainable college campuses, which will eventually help the city authorities meet the Sustainable Development Goals as described by the United Nations – particularly goal number 11, “to make cities and human settlements inclusive, safe, resilient and sustainable,” and thereby contribute to improving urban living conditions that will further contribute to improve general human conditions.
Data availability statement
The data analyzed in this study is subject to the following licenses/restrictions: The datasets presented in this article are not readily available because we did not receive respondents’ consent to share their data publicly. Our consent form stated that the data would be kept in a secure place and accessed only by the investigators themselves. Requests to access these datasets should be directed to BA; Ymh1aXlhbi5hbGFtQHV0b2xlZG8uZWR1.
Author contributions
TA: Conceptualization, Data curation, Investigation, Methodology, Validation, Writing–original draft, Writing–review and editing. BA: Conceptualization, Investigation, Methodology, Supervision, Validation, Writing–original draft, Writing–review and editing.
Funding
The author(s) declare that no financial support was received for the research, authorship, and/or publication of this article.
Conflict of interest
The authors declare that the research was conducted in the absence of any commercial or financial relationships that could be construed as a potential conflict of interest.
The author(s) declared that they were an editorial board member of Frontiers, at the time of submission. This had no impact on the peer review process and the final decision.
Publisher’s note
All claims expressed in this article are solely those of the authors and do not necessarily represent those of their affiliated organizations, or those of the publisher, the editors and the reviewers. Any product that may be evaluated in this article, or claim that may be made by its manufacturer, is not guaranteed or endorsed by the publisher.
References
Abasahl, F., Kelarestaghi, K. B., and Ermagun, A. (2018). Gender gap generators for bicycle mode choice in Baltimore college campuses. Travel Behav. Soc. 11, 78–85. doi:10.1016/j.tbs.2018.01.002
Akar, G., Fischer, N., and Namgung, Mi (2013). Bicycling choice and gender case study: the Ohio state university. Int. J. Sustain. Transp. 7, 347–365. doi:10.1080/15568318.2012.673694
Apardian, R., and Alam, B. (2015). Methods of crossing at roundabouts for visually impaired pedestrians: review of literature. Int. J. Transp. Sci. Technol. 4 (3), 313–336. doi:10.1260/2046-0430.4.3.313
Apardian, R., and Alam, B. (2020). Pedestrian fatal crash location analysis in Ohio using exploratory spatial data analysis techniques. Transp. Res. Rec. 2020, 1–13. doi:10.1177/0361198120950717
Balsas, C. J. L. (2003). Sustainable transportation planning on college campuses. Transp. Policy 10 (1), 35–49. doi:10.1016/s0967-070x(02)00028-8
Ben-Akiva, M., and Lerman, S. (1985). Discrete choice analysis: theory and application to travel demand (transportation studies). Reprint edition. MIT Press.
Bonham, J., and Koth, B. (2010). Universities and the cycling culture. Transp. Res. Part D Transp. Environ. 15 (2), 94–102. doi:10.1016/j.trd.2009.09.006
Bopp, M., Kaczynski, A., and Wittman, P. (2011). Active commuting patterns at a large midwestern college campus. J. Am. Coll. Health 59 (7), 605–611. doi:10.1080/07448481.2010.518327
Cattaneo, M., Malighetti, P., Morlotti, C., and Paleari, S. (2018). Students’ mobility attitudes and sustainable transport mode choice. Int. J. Sustain. High. Educ. 19 (5), 942–962. doi:10.1108/ijshe-08-2017-0134
Eluru, N., Vincent, C., and El-Geneidy, A. M. (2012). Travel mode choice and transit route choice behavior in Montreal: insights from McGill university members commute patterns. Public Transp. 4 (2), 129–149. doi:10.1007/s12469-012-0056-2
Emond, C. R., and Handy, S. L. (2012). Factors associated with bicycling to high school: insights from davis, CA. J. Transp. Geogr. 20 (1), 71–79. doi:10.1016/j.jtrangeo.2011.07.008
Ewing, R., Schroeder, W., and Greene, W. (2004). School location and student travel analysis of factors affecting mode choice. Transp. Res. Rec. J. Transp. Res. Board 1895, 55–63. doi:10.3141/1895-08
Fernández-Heredia, Á., Monzón, A., and Jara-Díaz, S. (2014). Understanding cyclists’ perceptions, keys for a successful bicycle promotion. Transp. Res. Part A Policy Pract. 63, 1–11. doi:10.1016/j.tra.2014.02.013
Field, A. (1999). The college student market segment: a comparative study of travel behaviors of international and domestic students at a southeastern university. J. Travel Res. 37 (4), 375–381. doi:10.1177/004728759903700407
Fu, T., Mundorf, N., Paiva, A., and Prochaska, J. (2012) “Promoting behavior change among campus commuters,” in The 53rd annual transportation research forum, tampa, Florida, transportation research forum.
Google Maps (2024). Google Maps. Available at: www.google.com/maps (Accessed February 14, 2024).
Hamad, K., Htun, P. T., and Obaid, L. (2021). Characterization of travel behavior at a university campus: a case study of Sharjah University City, UAE. Transp. Res. Interdiscip. Perspect. 12, 100488. doi:10.1016/j.trip.2021.100488
Hasnine, Md S., Lin, T. Y., Weiss, A., and Habib, K. N. (2018). Determinants of travel mode choices of post-secondary students in a large metropolitan area: the case of the city of Toronto. J. Transp. Geogr. 70, 161–171. doi:10.1016/j.jtrangeo.2018.06.003
Hu, L. (2021). Gender differences in commuting travel in the U.S.: interactive effects of race/ethnicity and household structure. Transportation 48, 909–929. doi:10.1007/s11116-020-10085-0
Kamargianni, M., Dubey, S., Polydoropoulou, A., and Bhat, C. (2015). Investigating the subjective and objective factors influencing teenagers’ school travel mode choice–an integrated choice and latent variable model. Transp. Res. Part A Policy Pract. 78, 473–488. doi:10.1016/j.tra.2015.06.011
Kelarestaghi, K. B., Ermagun, A., and Heaslip, K. P. (2019). Cycling usage and frequency determinants in college campuses. Cities 90, 216–228. doi:10.1016/j.cities.2019.02.004
Kim, J., and Lee, B. (2023). Campus commute mode choice in a college town: an application of the integrated choice and latent variable (ICLV) model. Travel Behav. Soc. 30, 249–261. doi:10.1016/j.tbs.2022.10.002
Krizek, K., Johnson, P., and Tilahun, N. (2005). Gender differences in bicycling behavior and facility preferences. Res. Women’s Issues Transp. 2, 31–40.
Kutela, B., and Teng, H. (2019). The influence of campus characteristics, temporal factors, and weather events on campuses-related daily bike-share trips. J. Transp. Geogr. 78, 160–169. doi:10.1016/j.jtrangeo.2019.06.002
Limanond, T., Butsingkorn, T., and Chermkhunthod, C. (2011). Travel behavior of university students who live on campus: a case study of a rural university in asia. Transp. Policy 18 (1), 163–171. doi:10.1016/j.tranpol.2010.07.006
Macioszek, E. ˙zbieta, Cie´sla, M., and Granà, A. (2023a). Future development of an energy-efficient electric scooter sharing system based on a stakeholder analysis method. Energies 16 (554), 1–24. doi:10.3390/en16010554
Macioszek, E. ˙zbieta, Granà, A., and Krawiec, S. (2023b). Identification of factors increasing the risk of pedestrian death in road accidents involving a pedestrian with a motor vehicle. Archives Transp. 65 (1), 7–25. doi:10.5604/01.3001.0016.2474
Mohammadzadeh, M. (2020). Exploring tertiary students’ travel mode choices in auckland: insights and policy implications. J. Transp. Geogr. 87, 102788. doi:10.1016/j.jtrangeo.2020.102788
Moniruzzaman, Md, and Farber, S. (2018). What drives sustainable student travel? Mode choice determinants in the greater Toronto area. Int. J. Sustain. Transp. 12 (5), 367–379. doi:10.1080/15568318.2017.1377326
Motoaki, Y., and Daziano, R. A. (2015). A hybrid-choice latent-class model for the analysis of the effects of weather on cycling demand. Transp. Res. Part A Policy Pract. 75, 217–230. doi:10.1016/j.tra.2015.03.017
Nayar, V., and Najafi, F. (2012) “Travel behavior of students reaching their origin and destination at the university of Florida,” in ASEE southeast section conference.
Proulx, F. R., Cavagnolo, B., and Torres-Montoya, M. (2019). Impact of parking prices and transit fares on mode choice at the university of California, berkeley. Transp. Res. Rec. 2469 (1), 41–48. doi:10.3141/2469-05
Pucher, J., Charles, K., and Paul, S. (1999). Bicycle renaissance in north America? Recent trends and alternative policies to promote bicycling. Transp. Res. Part A Policy Pract. 33 (7-8), 625–654. doi:10.1016/S0965-8564(99)00010-5
Ribeiro, P., Fonseca, F., and Meireles, T. (2020). Sustainable mobility patterns to university campuses: evaluation and constraints. Case Stud. Transp. Policy 8, 639–647. doi:10.1016/j.cstp.2020.02.005
Rybarczyk, G., and Gallagher, L. (2014). Measuring the potential for bicycling and walking at a metropolitan commuter university. J. Transp. Geogr. 39, 1–10. doi:10.1016/j.jtrangeo.2014.06.009
Schoner, J., and Levinson, D. (2014). The missing link: bicycle infrastructure networks and ridership in 74 US cities. Transportation 41 (6), 1187–1204. doi:10.1007/s11116-014-9538-1
Sisson, S., McClain, J., and Tudor-Locke, C. (2008). Campus walkability, pedometer-determined steps, and moderate-to-vigorous physical activity: a comparison of 2 university campuses. J. Am. Coll. Health 56 (5), 585–592. doi:10.3200/jach.56.5.585-592
Sisson, S., and Tudor-Locke, C. (2008). Comparison of cyclists’ and motorists’ utilitarian physical activity at an urban university. Prev. Med. 46 (1), 77–79. doi:10.1016/j.ypmed.2007.07.004
Soria-Lara, J. A., Marquet, O., and Miralles-Guasch, C. (2017). The influence of location, socioeconomics, and behaviour on travel-demand by car in metropolitan university campuses. Transp. Res. Part D Transp. Environ. 53, 149–160. doi:10.1016/j.trd.2017.04.008
The United Nations. 2015. United Nations Summit on sustainable development, New York. Available at: https://www.un.org/en/conferences/environment/newyork2015
The University of Toledo (2024). About UToledo. Available at: www.utoledo.edu/campus/about/(Accessed February 20, 2024).
Walton, S. (2011). Biking on campus: the impacts of administrative structure, policies, programs, and facilities on mode share. Columbus, OH: Doctoral dissertation, The Ohio State University.
Whalen, K., Páez, A., and Carrasco, J. (2013). Mode choice of university students commuting to school and the role of active travel. J. Transp. Geogr. 31, 132–142. doi:10.1016/j.jtrangeo.2013.06.008
Keywords: active transportation, mode choice behavior, commuting to and on college campus, sustainable cities and communities, sustainable development goals
Citation: Akter T and Alam BM (2024) Travel mode choice behavior analysis using multinomial logit models towards creating sustainable college campus: a case study of the University of Toledo, Ohio. Front. Future Transp. 5:1389614. doi: 10.3389/ffutr.2024.1389614
Received: 21 February 2024; Accepted: 27 September 2024;
Published: 09 October 2024.
Edited by:
Luigi Dell’Olio, University of Cantabria, SpainReviewed by:
Elżbieta Macioszek, Silesian University of Technology, PolandRubén Cordera, University of Cantabria, Spain
Copyright © 2024 Akter and Alam. This is an open-access article distributed under the terms of the Creative Commons Attribution License (CC BY). The use, distribution or reproduction in other forums is permitted, provided the original author(s) and the copyright owner(s) are credited and that the original publication in this journal is cited, in accordance with accepted academic practice. No use, distribution or reproduction is permitted which does not comply with these terms.
*Correspondence: Bhuiyan Monwar Alam, Ymh1aXlhbi5hbGFtQHV0b2xlZG8uZWR1
 Taslima Akter
 Bhuiyan Monwar Alam