 Gillian Harrison*
 Simon Shepherd
- Institute for Transport Studies, Faculty of Environment, University of Leeds, Leeds, West Yorkshire, United Kingdom
Introduction: In this paper we consider system dynamics (SD) modelling of tradable transport permit schemes (TTPS). TTPS are complex and uncertain, having not yet been implemented beyond experimental trials anywhere in the world, yet have for some time been suggested as an efficient and equitable policy response to reducing car-based travel and its associated externalities.
Method: Although there is a large number of econometric models that explore the potential of TTPS, there have been none published (to our knowledge) that have used the SD approach. SD is an appropriate method for developing our understanding of TTPS efficiency and equity as it captures feedbacks and tracks the influence of the TTPS over a period of time. Thus, we have developed an SD model of TTPS, drawing from the literature that already exists. It is a micro-level model that considers heterogeneity within a population on a daily basis over a matter of months. We carry out sensitivity testing of price sensitivity, initial permit price, daily preference and permit allocation and develop combined scenarios of these attributes.
Results: Our modelling results suggest a sensitivity of TTPS to heterogeneity across the population, which will influence the final equilibrium price. Trading encourages a redistribution of wealth across the population but may also mean that some travel needs are not met, which may require some allocation according to need or a certain portion of protected permits. The inclusion of non-car users within the allocation further encourages trading behaviours and allows for compensation for externalities of car use.
Discussion: Through an analysis of outputs we are able to bring new insights into the governance frameworks required for a successful TTPS. In particular we have shown the importance of allocation considerations in the design of a TTPS when issues of fairness across the population are considered. Although there is no data of existing schemes available for us to calibrate our models, we compare the trends with data from an in-the-field TTPS experiment.
1 Introduction
In this paper we consider system dynamics (SD) modelling of tradable transport permit schemes (TTPS). TTPS are an alternative to road pricing or taxation as an economic response to reducing congestion and environmental externalities. Despite being first proposed in the 1970s, and with much interest in the past 50 years, none have been implemented in practice. Academic studies have suggested that tradable schemes are more cost effective and equitable than conventional fiscal policy instruments, and have been considered and trialled by policymakers, but have many outstanding considerations regarding their development, governance and execution. New and emerging technologies (and their related data) offer potentially reliable and efficient opportunities to introduce such schemes. In combination with other new mobility services (such as car or bike sharing) and as part of Mobility-as-a-Service packages that could revolutionise the way we make our transport decisions within a carbon constrained environment. TTPS can be either alternatives for or complementary to road pricing, a policy that is currently being considered in the UK (and elsewhere), due to expected falling tax revenue as fleets are electrified. de Palma and Lindsey (2020) determined that a TTPS can be more efficient than pricing under certain conditions, e.g., when capacity is constrained, offers more flexibility, and better accounts for “unseen” externalities. A further advantage over road pricing is that there is no net monetary flow from users to governing authorities, but rather is between users (Brands et al., 2020).
Emissions trading at a country or industrial level, as an economic instrument to achieving GHG emissions have now been in place for a number of years, such as the EU Emissions Trading. On an individual level it is more problematic with many complex feedbacks and uncertainties. For this reason, SD offers a suitable approach to understanding the key relationships and significant variables that could lead to the success or failure of a TTPS. Although there is a large body of econometric models that explore the potential of TTPS, there have been none published (to our knowledge) that have used the SD approach. SD is an appropriate method for developing our understanding of TTPS efficiency as it captures feedbacks and tracks the influence of the TTPS over a period of time. Thus, we have developed an SD model of TTPS, drawing from the literature that already exists. It is a micro-level model that considers heterogeneity within a population on a daily basis over a matter of months. Through sensitivity testing and analysis of outputs we are able to bring new insights into the governance frameworks required for a successful TTPS.
The remainder of this paper is set out as follows. We first describe TTPS design considerations (policy target, allocation method and trading rules) that were considered to build the SD model. We have a particular interest in using the SD model to consider if a TTPS could be developed that would be expected to reduce car use and emissions while not increasing (or better reducing) transport related social exclusion. In Section 3 we present the model structure, describing the relationships and equations that have been implemented in the model, followed by presentation of our baseline results and sensitivity tests, allowing discussion of the TTPS sensitivities revealed by this model. Although there is no data of existing schemes available for us to calibrate our models, we compare the trends with data from an in-the-field TTPS experiment. The Results section details the baseline scenario, model sensitivities and a number of scenarios that represent heterogeneity within the population, such as daily preferences, car-dependence and price sensitivity, in order to assess the potential equity implications of the TTPS. Our results suggest that allocating permits according to need can lead to efficient and equitable trading whilst meeting policy targets. Although this is a simple model, such insights are important for the promotion and design of such schemes which may be introduced in the near future.
2 Tradable transport permit schemes
Tradable permit (or credit1) schemes are being proposed as an alternative to road pricing or taxation, which lack public acceptance (Dogterom et al., 2018), as an economic response to reducing congestion and environmental externalities, though have not been implemented in practise (Brands et al., 2020). First proposed in the late 1,960 s (for water pollution) (Verhoef et al., 1997; Fan and Jiang, 2013), the theoretical cost-effectiveness of tradable permits was proven in the early 1,970 s (Verhoef et al., 1997), and was considered for road transport in the late 1,990 s (Fan and Jiang, 2013). As defined by Dogterom et al. (2018), tradable transport permits are commonly understood as the allocation of “individual proportions of car use to drivers based on an aggregate target (formulated in, for example, units of distance or fuel consumption) that can be used and traded according to personal aspirations and prevailing market prices.” Variations in tradable permit schemes, and their advantages and disadvantages are set out in Table 1. The complexities of such schemes raise many issues of fairness and governance (Fan and Jiang, 2013), with the process of initial allocation being the most politically sensitive (Grant-Muller and Xu, 2014).
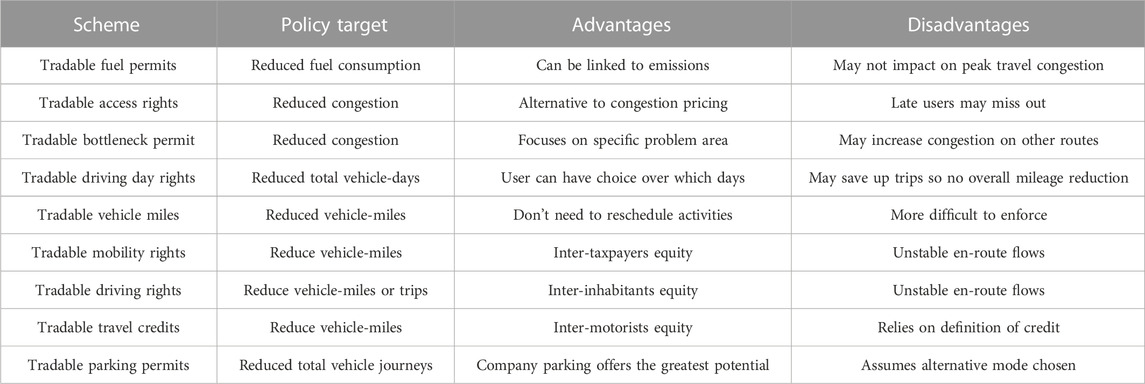
TABLE 1. User-Oriented tradable permit road transport schemes [based on (Verhoef et al., 1997; Fan and Jiang, 2013; Grant-Muller and Xu, 2014)].
There is growing literature regarding TTPS. The general potential of such schemes and state-of-the-art reviews have been revisited by numerous authors since the late 20th Century and increasingly over the past decade (e.g., (Verhoef et al., 1997; Raux, 2004; Raux, 2011; Fan and Jiang, 2013; Grant-Muller and Xu, 2014; Dogterom et al., 2017; Krabbenborg et al., 2021) There have been numerous studies analysing proposed schemes from both economic [e.g., (Gao and Hu, 2015; Fan et al., 2016; Lahlou and Wynter, 2017; Miralinaghi and Peeta, 2018; Mladenović et al., 2019; de Palma and Lindsey, 2020)] and socio-political perspectives (e.g., (Goddard, 1997; Wadud et al., 2008; Harwatt et al., 2011; Wadud, 2011; Dogterom et al., 2018). Drawing from this literature, we propose that a robust TTPS governance framework requires the following features: Policy Target; Allocation and Trading Rules.
2.1 Policy target
The policy target is to be set by the regulator in line with policy objectives, and should be in consultation with key stakeholders, though the policy objective itself may not be directly measurable (Raux, 2004). Targets include emissions, vehicle technology, fuel use, car ownership, VMT, trip rates or parking (see Table 1). Problems for determining the target mainly relate to having something that is measurable and monitorable, in particular for collecting baseline data (Grant-Muller and Xu, 2014). The measured unit should be the best way of achieving the desired objective. Selecting a target reduction is aspirational but could be unachievable (i.e., a target of zero would mean no travel at all). Assessing and deciding how much could be achievable requires numerous value judgements and normative assumptions that could make it problematic. A target that is too achievable could be seen as a waste of time. An alternative to this could be to set no reduction or to not allow any growth, though this would not tackle existing problems. Therefore, the best target would be to consider what is a manageable level (of congestion or emissions)—though this in itself would likely be accepting (indeed allowing) that some suffering is permissible (through air quality related health, noise, stress etc., as well as environmental degradation). In short, when deciding on the policy target, all options raise issues of monitoring and enforcement (see Section 2.3 Trading Rules), partially due to their spatial and temporal nature, but also through difficulties due to data collection. One option for overcoming this could be through smartphone applications (Brands et al., 2021).
2.2 Allocation
Acceptability of road pricing schemes is low (most commonly due to freedom and fairness concerns) but sensitive to socio-demographic factors, and public opinion favours tradable schemes over taxation (Dogterom et al., 2018), suggesting the design of the TTCS and allocation of permits would require detailed decision making. Assuming that a policy objective and the unit/form of measurement is agreed, then an initial number of permits to be distributed that correspond to achieving the target is required. This may be subjective to the unit of measurement, and could be integrated with the process of initial allocation. A key part of this may be through addressing the questions who should be allocated permits and how should permits be allocated between them. Many papers assume an initial group and allocation method (e.g., fair shares or by historic use) (Goddard, 1997; Brohe, 2010; Harwatt et al., 2011; Grant-Muller and Xu, 2014; Burgess, 2016; Lahlou and Wynter, 2017), though de Palma and Lindsey (2020) suggest that allocation needs further research. Most proposed schemes adopt a free initial allocation, though some require payment (Fan and Jiang, 2013). In most cases the scheme being considered includes the whole population of a country, hence there is no need to discuss who should be included in the allocation, though there are some mentions on if it should be per person (drivers, passengers, no-car), household or vehicle and if children should be included. There is no critical analysis of these choices. Bristow et al. (2010) carried out a stated preference survey on the acceptability of personal carbon trading. They found a preference towards permits including children and including additional allowances according to needs. Wadud et al. (2008) and Wadud (2011) consider personal carbon trading (credits) for transport focusing on fuel use. The former paper reported on four different allocation strategies, relating to equal shares (per capita or per vehicle, including or excluding non-vehicle owners), concluding that allocation to all individuals can be regressive for vehicle-owners, especially those who are lower-income The second paper evaluated TTPS allocation strategies with respect to cost efficiency, equity and effectiveness and found that similar allocation strategies attained carbon reduction targets but an individual allocation is more progressive across all households, though per vehicle allocation is more proportional.
In addition, it should be expected that the overall permits within the scheme could be reduced over time in line with the policy target, and assumed that this will be reduced proportionally across the permit holders. However, there also needs to be a mechanism for including newcomers into the scheme. One approach to this may be to have a certain amount of permits that are unallocated and held by the government that could then be released when needed. If these were included in the trading it would not be appropriate for the government to profit, though there may be some argument that some funding for the implementation and monitoring of the scheme may be required. Otherwise, the scheme would not be open to newcomers within any one trading period—leading to questions on how long this period should be. Under this situation the assumption would be that the newcomer would not be able to obtain their free allocation within their initial trading period, but would be able to enter the trading scheme to purchase permits.
2.3 Trading rules
Many papers suggest that there are only two actors–provider and the user, though in reality there may be several institutions involved in the provision (e.g., planning/design, operation/customer service, monitoring/enforcement) (Fan and Jiang, 2013). Trading itself should only occur between individuals, with no government or private profit [an advantage over road pricing (Brands et al., 2020)] though small costs to cover transaction fees may be imposed. However, the requirements will likely create large administration costs, so research into contractual arrangements with operators is required and several components of TTPSs would likely be subject to regulation rather than the free market, so subject to government inefficiencies in decision making (Fan and Jiang, 2013). For instance, speculative purchasing must be prevented to ensure the fairness of the system. It can also not be overlooked that some parties may be tempted to sell permits and opt for less desirable levels of accessibility if they have less financial capital to begin with. It is to some degree arguable that it is up to the individual how they value commodities, and as at present, more affluent individuals travel more, and so would require more. Should the initial allocation be equitable, and poorer individuals are willing to sell, then this could be acceptable. Another area of control would be the period of validity of the credits. Where some experimental schemes considered weekly credits (Brands et al., 2020), others advocate for a longer multi-period approach (Miralinaghi and Peeta, 2018). Two important aspects of ensuring trading rules are adhered to, and that the scheme operates as theoretically planned, are monitoring and enforcement. The success of these is dependent on initial design and choice of objectives that are measurable within real-time and there are mechanisms in place to prevent abuse. This is critical in success as the prevalence of abuse will not only lead to scheme failure in achieving the desired target, but also public mistrust and acceptability (further embedding scheme failure).
3 System dynamics model
The described governance framework is complex and uncertain. As such System Dynamics (SD) is an appropriate approach to addressing our problem. In the SD method, stocks and relationships, including feedbacks and delays, that drive the system are identified, in order to create a quantitative simulation model.
In this work, we present an SD approach to assessing TTPS, a micro-level model that represents the daily behaviours of individuals over a period of weeks. Although SD has been increasingly applied to the understanding of transport policies and schemes (Shepherd, 2014), to our knowledge there have been no published studies regarding a TTPS, though it has been used to study road user charging (Sabounchi et al., 2014; Jia et al., 2017; Naumann et al., 2022) and non-transport tradable permits (Zhao et al., 2019; Yu et al., 2021). This model was developed for the purpose of improving the understanding of the key interactions of a TTPS in order to assess the required design of the governance framework. In particular we focus on the impact of price sensitivities, travel needs and permit allocation on scheme success and equity across different groups. We do not model the possibility to avoid peak travel—it is a permit to travel on a given day irrelevant to time of travel.
A quantified stock-flow model has been built, partly drawing on Brands et al. (2020). One limitation of SD in this study is that SD is conventionally used to study aggregate behaviour, but tradable permits are dependent on the actions of heterogeneous individuals. In order to operationalise, we use representative sub-groups.
The stock flow model comprises of five stocks representing the Permits Held and Used, the Permit Price, the Bank (of Permits) and Individual Group Budget. Although a relatively simple model, it contains six feedback loops. Of particular importance is the Balancing loop between Demand, Use and Price. The model runs over a time period of 100 days, using a time-step of 0.25 days, though assuming a 5 day work week (i.e., weekend days are omitted). It was implemented in Vensim DSS 5.7 a using Euler integration. The key model equations are described in this section (note that apart from stocks, time subscripts have generally been omitted for simplicity), and the full model documentation is provided as Supplementary Material.
3.1 Policy objectives and permit distribution
In this model, we do not explicitly define what “car-use” is, though nominally assume a baseline Current Use (CUi) of 1 unit a day per car-user in group i for a 5 day work week. In this way it could be considered, for example, daily use, distance, zonal entry, parking or a tour to and from a place of work. Keeping a generic use in this simple model will allow future models to be developed for different measurements. Weekly Allocation of permits (AW,i) is determined by Equation 1. The model includes 11 representative groups i), where individuals within each group are assumed to have identical behaviour. Each group contains one individual I) in the base case, meaning the groups can be scalable. Ten of these groups are considered as car-users and one as non-car-users. Therefore, an overall weekly current car use across all individuals is 50 units. The Policy Objective (PO) is the amount by which the authorities wish to reduce the car use, and is 0.6 in the base case—so there are 30 permits available. We assume equal distribution (Ai) of the total permits across car-user groups in the base case (0.1), so each group (which consists of one representative individual in base) is allocated 3 (free) permits per week, and are allowed to use up to one permit per day. In the base run, we do not consider allocation to non-car users, and all car-users are assigned identical attributes.
Equation 1: Weekly Allocation of Permits for each group
3.2 Permit availability
The weekly allocation of permits to each group (AW,i) is an inflow into the stock of Permits Held (PH,i) (by each group) at the start of each week. PH,i (Equation 2) accumulates permits not only from this inflow but also through any Permits Bought (PB,i - Equation 3), which occurs when the Daily Permit Use (PUi) is greater than the target daily use of the authorities (i.e., the daily allocated permits). Conversely, they are depleted when Permits are Sold (PSi - Equation 4). It is assumed that groups will each day sell any excess permits when PUi is lower than target (AWi/5). In reality the group may also trade speculatively in response to the Permit Price or acquired knowledge, which is not considered in this model—see later explanation under “Trading”. There are two further out-flows which govern the PHi: PUi and Weekly Reset (RWi). PUi (which cannot be more than 1/day), is equal to Permit Demand at any point in time (PDi) (see later for details), and is also the inflow rate of the stock Used Permits (UPi (Equation 5) which is used to determine Permit Price (PP). It is also reset every week (URWi). RWi removes any residual permits that have not been used or sold at the end of each week, as per the scheme design. Groups do not get any income from these residual permits.
Equation 2: Permits Held Stock for each group
Equation 3: Permits Bought for each igroup
Equation 4: Permits Sold by each group
Equation 5: Permits Used Stock for each group
3.3 Trading
As described previously, groups buy and sell permits according to their Daily Permit Use (PUi) and the Weekly Allocation (AWi), so in effect we model convergence to a daily target. In reality, groups may also retain permits for a day later in the week, choose to buy and sell speculatively, or indeed be motivated to sell even if demand is not met. In this simple model, we do not include speculative transactions (though recognise the importance of these in trading behaviour), and assume that the minimum needs of groups are adjusted through their price sensitivities in the demand equation (see later). Additionally, although trade takes place between individuals, it is not direct person-to-person. In this scheme design, we follow that of Brands et al. (2020), who provide an intermediator Bank to manage the transactions. Thus, the stock of permits within the Bank at any time (PB) is determined by the rate of permits being bought (PBi) and sold (PSi) across all individual groups i) (Equation 6). Within such as scheme, the Bank would be run by an independent party (e.g., the local authority or agent/contractor thereof), who would not profit from the transactions, but it should be noted that the costs to run the system itself (which could be high) may need to be covered. Part of the role of the Bank is that additional permits (above the total within the system) can be purchased so that demand can be met. This may mean that in the initial short term, more permits enter the system. However, as this evolves, this means that the permit price will rise further before the targets are reached and a price equilibrium occurs. In this case, the payment for these additional permits is not transferred to other users in the system but is retained by the bank (and could be used to cover some costs)—so is analogous to road pricing for those permits used above target. Note that if the initial price is too high then the bank is at risk of buying permits which are not used as users would rather sell than travel at the target level.
Equation 6: Bank Permits
3.4 Permit price
The Permit Price (PP) is modelled as a stock (Equation 7), with the Change in Price (Δ) characterised in Equation 8 by a constant change in price (δ, equal to 0.1), determined by the balance between the total Permits allocated (Q) and a co-efficient (α, equal to 0.05), relative to those held (Zt) or used (Ut) by all individuals in the system at any point in time. Therefore, the price will rise if the amount of permits held or used within the system (Zt + Ut) exceeds those allocated (so if the bank has sold excess permits), and will fall when they are less than the initial allocation. The target is to reach equilibrium when there are no greater or fewer permits in the system than allocated. This is based on the work of Brands et al. (2020), though they did not include the co-efficient α, which we included in order to smooth the convergence towards an equilibrium price as part of the heuristic price setting algorithm. In the base case we start at a unit price of 1. What is not included directly here is a direct transaction cost, which could be implemented in the scheme in order to restrict speculative profiteering, as in this simple model we do not include speculative purchasing.
Equation 7: Permit Price Stock
Equation 8: Dynamic Permit Price (Brands et al., 2020)
3.5 Permit demand
In this model, demand is always met, as although trading between individuals is desired for reaching a target equilibrium, additional permits over those distributed to groups can be bought from the central Bank, as dictated in the relationship between Daily Permit Use (PUi) and Permits Bought (PBi). PDi is determined by the Desired Car Use (DCUi), Permit Price (PP) and Price Sensitivity (PSi) (Equation 9). Under base conditions, we assume a DCUi of one permit per day for each group (based on current use). We assume a linear demand function w.r.t. PP for simplicity and allow groups to have different PS in later scenarios. As PP increases, PDi reduces, and vice versa. We assume that all individuals have an equal PSi in the base case (0.1). In effect, PDi should tend towards the target daily use (AWi/5—which is equal to 0.6 at a PP of 4 units in the base case).
Equation 9: Permit Demand for each group
DCUi for each group is governed by the Daily Preference (DPi) and Current Group Use (CUi) (Equation 11). Under Base conditions, groups are considered to have no preference on which day of the week they choose to use their allocated permits (which is three per week in the base), so their DPi is equal to one for each day. However, in reality, each individual may have days with certain commitments that could require car use, or that the alternative has a higher cost to them. In later scenarios, we replicate this with an adjustment factor to DCUi, DPi, that gives a higher or lower weight to certain days that a group may prefer non-car, given the choice. In this simple model, this pattern repeats every week, however, it is conceivable that it could alter over time, not only as travel needs change, or for those with no regular preferences, but also in response to price signals they may notice (e.g., if many people travel on a certain day there may be higher demand for permits and thus a higher permit price—the individual may be thus motivated to either sell a permit, or not buy one as intended).
Equation 10: Desired Car Use for each group
3.6 Budget
The final section of the model to consider is the Budget stock (Equation 11). Here, the model replicates the personal budget of groups (Bi) as determined by the income from selling permits (PIi) and outgoing spend of buying permits (POi). We start the simulation with an initial budget (IBi) of 25 units for each individual, but do not assume any income other than through selling permits. Through this stock we are able to assess the financial burdens on the specific individuals and resulting equity issues.
Equation 11: Budget stock
4 Results
4.1 Baseline
In the section we briefly describe the model behaviour under baseline conditions, as follows:
• Policy Objective: 0.6 (of current use)—leading to 3 units each car group per week
• Current Use: 5/week for each group (all equal—car only)
• Individuals: one in each group
• Allocation: Equal across all car users (i.e., 3 permits each car group per week)
• Price Sensitivity: 0.1 for each group (All equal)
In the base case, where all groups are homogenous, no trading occurs (as we approach the equilibrium price from below): no group sells their permits, so permits additional to those allocated are bought directly from the bank (so analogous to road pricing or excess permits). Shown in Figures 1, 2, all groups are behaving homogenously and Permit Price grows uniformly until hitting an equilibrium of 4 units after ₹ (6 weeks) in line with the expected price given the price sensitivity of 0.1 and target use of 0.6 (in other words, individuals reduce weekly car trips from 5 to 3). Thus, this equilibrium is reached by groups using their permits for their own purposes and at no costs to them once in equilibrium.
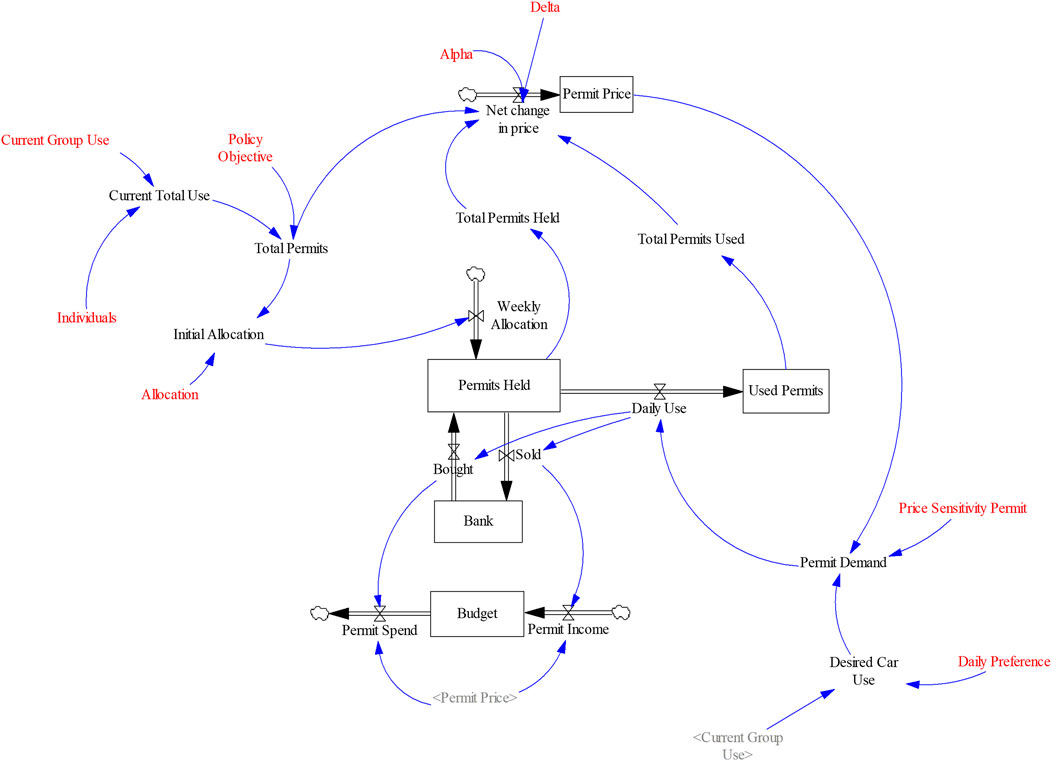
FIGURE 1. Micro-level SD Stock-flow model (red elements are constant inputs that are varied in sensitivity testing and scenarios).
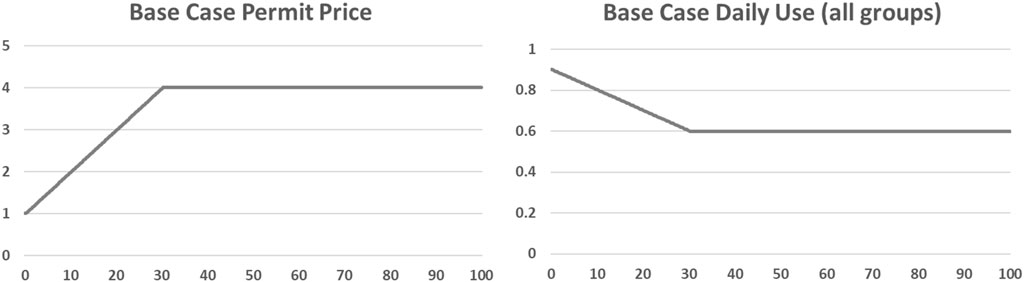
FIGURE 2. Permit price and daily car-use of car user groups under base conditions.
The increase in permit price over the initial period until an equilibrium point is reached corresponds with behaviour observed in the only “in-the-field” tradable transport permit experiment that we are aware of (Brands et al., 2021). Although our baseline did not include any permit selling (other than excess bank permits), the rising price is comparative as there is net buying in the scheme until equilibrium. This experiment involved two groups of participants taking part in a parking permit experiment for a period of 2 weeks on two consecutive occasions. Participants were given a starting budget and did not use their money, but were allowed to keep anything left at the end. An increasing price was observed here, evidence that participants were acting rationally, and that as the price increases the willingness to actively participate in the experiment also increases. As the experiment only lasted 4 weeks for each group (and 8 weeks in total), it appears that this was not long enough to reach an equilibrium point. However, it would appear that the price increase for both groups in the second period may be rising at a slower rate and reaching an equilibrium for group B. One note of the authors was that (due to the participation incentivisation design of the experiment) a number of participants were not fully active in their responses (see the paper for full details on this). Another observation was that as the experiment progressed, participants were beginning to respond to the gained knowledge that prices would rise towards the end of the period and thus began to change behaviours by buying permits (pcoins) earlier in the week when the prices were lower. We accept that this is a limitation of our model in that our population are not able to change their behaviours in this way.
4.2 Model sensitivities
Building on the baseline behaviour, we have subjected the model to some sensitivity testing to demonstrate the suitability for policy testing.
4.2.1 Coefficient alpha and price change delta
Two constants that could prove to be highly influential on the operation of the model are the coefficient α and price change δ that help determine the Permit Price in Equation 8. Therefore, we have carried out sensitivity tests for both of these inputs under the baseline condition. Using univariate random uniform distribution across 200 simulations we tested α over the range of 0.01 and 0.1 (base value = 0.05) and δ over the range of 0.01 and 0.5 (base value = 0.1). We find that the Permit Price has no sensitivity to α over the baseline conditions. On the other hand, we find significant sensitivity to δ. When the δ is higher than base, the equilibrium permit price is reached sooner (as may be expected), when lower it takes longer (and in some simulations an equilibrium price is not reached within the time frame of the simulation). However, not all values of δ lead to a flat line equilibrium under baseline, and indeed when both α and δ are varied together we obtain oscillations in permit price around the equilibrium price. This is a heuristic optimisation problem as we are using fixed values for α and δ. Using a fixed value for price changes was seen to be easy to understand from the user perspective. For our purposes, the choice of value is somewhat arbitrary but does bring a constant equilibrium in base line so will be used within our simulations.
4.2.2 Price sensitivity
Under baseline, all ten car-using groups have an equal sensitivity to the permit price of 0.1. We now test the sensitivities of our model to this by assigning differing sensitivities to this and between groups, as set out in Table 2. PS1 and PS2 also have equal sensitivities but of double and half the value of the base, so trading does not occur. PS3-5 have differing values between groups but with the same average sensitivity as the base. In this case, trading does occur as those with lower price sensitivities are encouraged to sell, though only from a number of weeks into the simulation. It is possible that a lower policy objective at the start that is gradually increased could encourage a transition while the price is increasing, and could also mitigate additional bank permits.
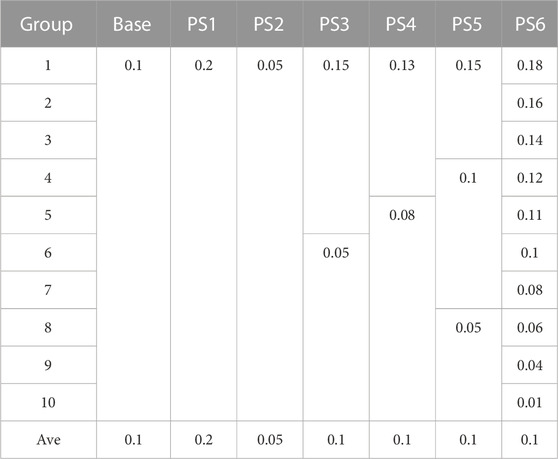
TABLE 2. Group price sensitivities.
4.2.2.1 Permit price
Shown in Figure 3A, price sensitivity of individuals has a significant influence on the key model outcomes, in particular the determination of the time to target and final equilibrium price. As would be expected, lower price sensitivities lead to a higher equilibrium price and a longer time to reach the target, as demand itself is greater due to a higher willingness to pay. This pattern is dependent on the average price sensitivity across all individuals, set out in Table 2.
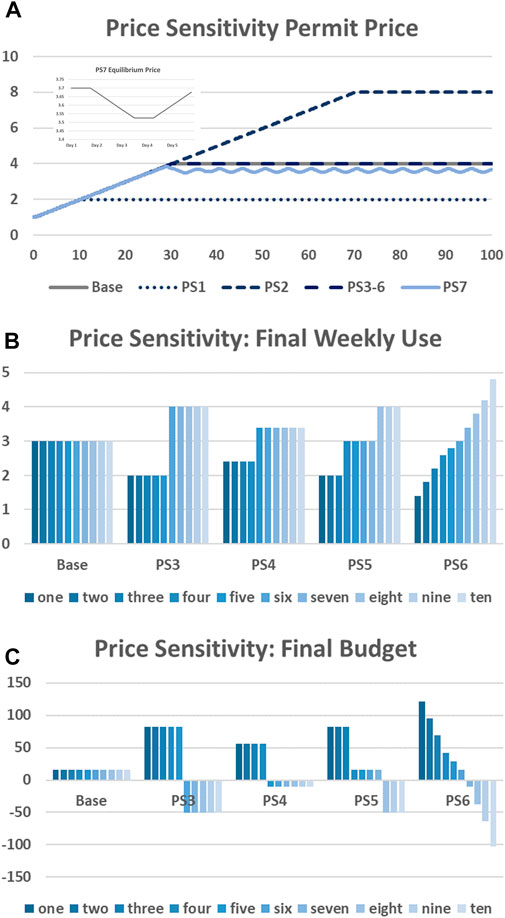
FIGURE 3. Price Sensitivities (A) Permit price (inset PS7 equilibrium price); (B) Final Weekly Use; (C) Final Budget.
Note that all scenarios except PS7 result in a flat line equilibrium. PS1 and PS3-6 have the same average price sensitivity, yet unequal sensitivities between groups (some symmetric, some asymmetric). It should however be noted that certain average price sensitivities can lead to non-constant equilibrium, similar to the effect of varying α and δ as discussed in the previous section. Of course, in reality it is unlikely that price sensitivities will results in a “neat” equilibrium, and this is to an extent an algorithm effect from the heuristic price setting we have employed to keep simplicity. As an example, PS7, is shown where all group sensitivities are 0.11. We see there an oscillation equilibrium between 3.527 and 3.7 (0.175 units), a slightly lower value than Base (as average price sensitivity is higher). Comparing this to the results of an app-based lab-in-the-field experiment (Brands et al., 2020) (where permits were theoretical), the permit price was also found to fluctuate but mostly stay within an equilibrium range (inset image in Figure 3). In explanation of the shape of the fluctuation, total permits held and used are within the co-efficient, α, of allocated permits (see Equation 8: 30 ± 0.05) for the first day, so there are no price changes triggered. There are enough permits held to meet individual needs, with more being sold (by those with higher price sensitivity) than being bought (by those with lower price sensitivity). The excess permits in the system exceed α in day 2 hence a negative price change occurs, leading to an increase in demand until once again the permit availability and demand is in equilibrium within α towards the end of day 3 and into day 4, where a new price equilibrium is reached. During this time, permit sales have been lower than permit purchases and so by day 4 banked permits are negative leading to the total number of permits within the system being more than the total allocated permits + α (30.05), leading to an increase in purchase price and a decrease in demand. Thus, we see how the purchase price equilibrium is sensitive to unequal sales and demand (trading), as well as to α and δ, which was not apparent in the simple cases. Although these price fluctuations may be more realistic, it should also be considered that users may not react well to rapidly fluctuating prices. It should however be noted that we have already damped the price response with the α coefficient to ease the understanding of a slow response compared to more reactive approaches, and that our time-step is only 0.25 – so transactions are carried out 4 times a day rather than the more frequent price changes in the experiment of Brands et al. (2020).
4.2.2.2 Permit use
When considering heterogeneous price sensitivities between groups, we see that trading allows those with the lowest price sensitivities to travel more than those with higher sensitivities. This is again due to the higher willingness to pay. This has the benefit to those with higher sensitivities that they are more willing to sell their permits (and gain the income), but at the same time, this could mean that their travel needs are not fully met, as they have effectively been priced out of the market, though they have been compensated, unlike an analogous road pricing scheme—as trading is occurring in the equilibrium. To demonstrate this, Figure 3B shows five different scenarios where there are differing sensitivities between individuals. These have been selected in such a way that the average sensitivity across individuals is the same in each scenario (and as the Base scenario)—as this determines the permit price and time to target. Under all price sensitivity scenarios, including the base, the policy target of a 60% reduction is met (hence the equilibrium price being achieved), and the same number of overall trips are achieved. However, we can clearly see that those with higher price sensitivities reduce their car use more than those with lower price sensitivities (as would be expected), but also that they are compensated for this, having the highest final budget, due to selling permits as well as buying less. For instance, under PS6 when each group has a different price sensitivity, group one, which has the highest sensitivity, reduces their car use to 1.4/week by the end of the time period, but also has the largest remaining budget of around 121 units (see Figure 3C). This selling (and related trading) does not initially occur—for the first weeks of the scheme it is similar to road pricing (for excess permits), because the starting price is low enough that those with high price sensitivity prefer to buy rather than sell. Our budget model here is relatively simple as we started off each group with the same amount in their budget (25) and allowed a negative budget to show the costs to each group (with an as assumption that that budget is available from elsewhere). However, the total final budget (across all groups) is the same in each scenario (158.88), therefore we can say that the total budget is redistributed within the population in different ways. If we consider that these higher sensitivities indicate the least affluent in society, then we can suggest that the trading offers a fair distribution of funds. However, there is some caution with this assumption, as it could also leave those vulnerable to over-sacrificing essential travel needs. It is noted that this total final budget of 158.88 units is lower than the initial total budget of 250 units. This discrepancy arises from initial permits being bought from the bank before any are sold and trading begins—as in our scheme this can be allowed. This “loss” of income to the bank could be mitigated by increasing the initial permit price (which we have not modelled in this study)—though if it is set too high, the bank could equally risk losing money if permits are sold when there is no demand. Alternatively, starting with a lower objective with a gradual increase over a transition period could also mitigate these effects.
4.2.3 Daily preferences
As explained previously, we recognise that it is likely that individuals may prefer to use their permits on specific days of the week. We tested the impact of these preferences by assigning two out of the five weekdays a lower “Desired Car Use” (0.9) than the remaining 3 days (1, the same as base). In DP1 all groups have a different preference pattern, in DP2 there are five preference patterns each assigned to two groups, and for DP3-6 all groups have the same preference pattern (which differs between DP3-6—M,Tu,W; W,Th,F; Tu,W,Th; M,W,F). It should be noted that as we do not model speculative or reactive trading (see earlier explanation) and we are modelling a daily target, that this approach of representing daily preferences is illustrative rather than demonstrating the exact behaviours that we would expect in a real-life scheme.
4.2.3.1 Permit price
We found that when this is implemented in the model, the permit price hits an “oscillating” equilibrium as the average permit sensitivity differs day by day (Figures 4A, B), though staying with an equilibrium range we discussed previously. We accept that this may be partly due to the heuristic price change function, as the variation is similar to what we found in PS7, though there is non-etheless some interesting dynamics to be observed regarding use (see next section). Firstly, although all follow the same uniform increase in price over the initial period, equilibrium is found (generally) at a lower level than the Base and more quickly. This is due to a lower overall average daily Desired Car Use than base, which in turn influences the average price sensitivity, which we have already identified as determining equilibrium price. In the Base, the Desired Car Use is assumed to be one for all groups for all 5 days. However, the oscillation differs between scenarios, despite overall price sensitivity and daily preference being the same. DP1 and 2, which demonstrate heterogeneity, result in the same patterns in permit price, oscillating between 3.5 and 3.65 (0.15 units). DP5 and 6, with preferences mid-week and evenly spread across the week, oscillate between 3.475 and 3.7 (0.225 units) and 3.475 and 3.725 (0.25 units) (resp.). However, the two extreme cases, DP3 and DP4, occur when preferences are at the start or end of the week, and note that these two scenarios have opposite trajectories in Figure 4B, as prices rise before falling for DP3 and fall before rising for DP4. In these cases, the equilibrium price is higher than base for DP3—oscillating between 3.925 and 4.1 (0.175 units) and much lower than other scenarios for DP4, which oscillates between 3.075 and 3.325 (0.25 units).
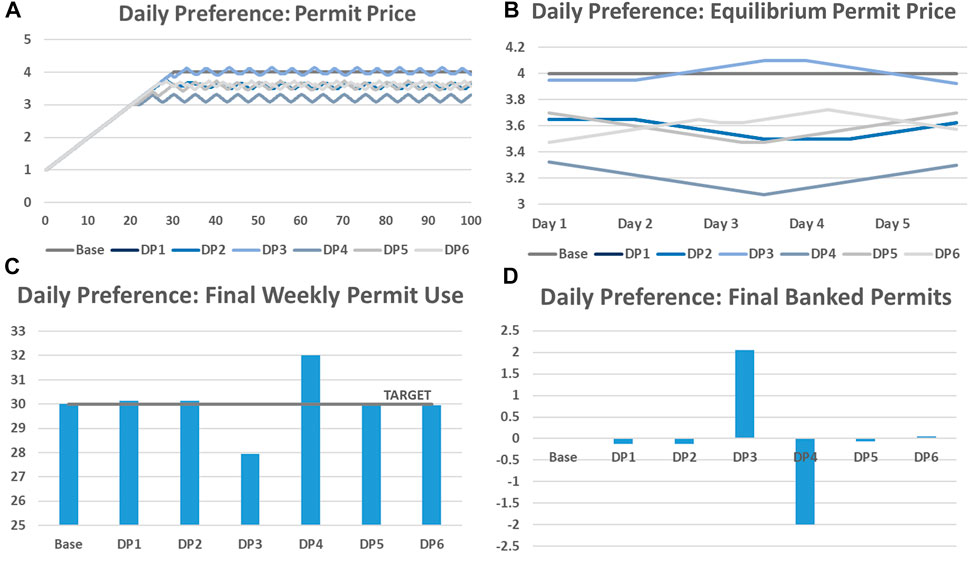
FIGURE 4. Daily Preferences: (A): Permit price; (B): Equilibrium permit price; (C): Final weekly permit use; (D) Final banked permits.
4.2.3.2 Permit use
As previously explained, in these scenarios, two of the 5 days have a daily preference lower than 1, so the overall average is lower than base. Shown in Figure 4C, we find that most scenarios result in almost meeting the target of 30 permits a week (once in equilibrium), with DP1, 2 and 5 being slightly above and DP6 being marginally below target, whereas the extreme scenarios DP3 and DP4 obviously are below and above target. Furthermore, we can see in Figure 4D that in these cases there is either a deficit or surplus of permits. In the extreme case of DP3, the desired driving days are at the start of the week, meaning a general increase in permit use earlier on (greater than the target of 0.6/day), so none are sold to the Bank, causing the Bank to produce more permits to meet demand and pushing up the price throughout the week. However, it is also the case that as demand reduces at the end of the week (below the target use of 0.6/day), excess permits are sold back, so the target reduction is over-reached (28/week). Whereas, in the other extreme case, where preferences are at the end of the week (DP4), equilibrium is met much earlier at a lower price, but misses the desired target reduction (32/week). Although a small number of permits are sold at the start of the week when demand is low, none are sold when demand increases towards the week end, so the Bank produces more permits and the target is missed. When the preference days are spread out across the week, as in DP5 and DP6, the trading is more balanced and the equilibrium is closer to the 0.6 daily target. This finding indicates the importance understanding the heterogeneity in society when it comes to daily travel preferences in the achievement of targets and distribution of permits. What we have not represented here is the impact of changing preferences across the weeks, speculation or reacting to expected price changes, merely that the daily preference is lower than base on certain days. What is revealed by this approach is that daily preferences can influence the equilibrium permit price in profound ways that merit further investigation in future work.
4.2.4 Allocation
Within this project we are interested in the design of a governance framework that would allow a TTPS to achieve a reduction in car use, without increasing social inequity. Key to this design is the method of allocation of permits to individuals, as this recognises existing issues of transport related social justice. Two approaches to allocation that are alternative to equal distribution across all car users are: inclusion of non-car users, and allocation according to need. In Table 3 we set out alternative permit allocations (of 30 total permits) between groups. All other attributes (price sensitivity, desired preference, current use) remain as in the base case. In A1—A3 non-car users are allocated permits equal to, double of and half of (resp.) that of car users. A4-A8 have unequal allocation between car-users, with and without non-car users.
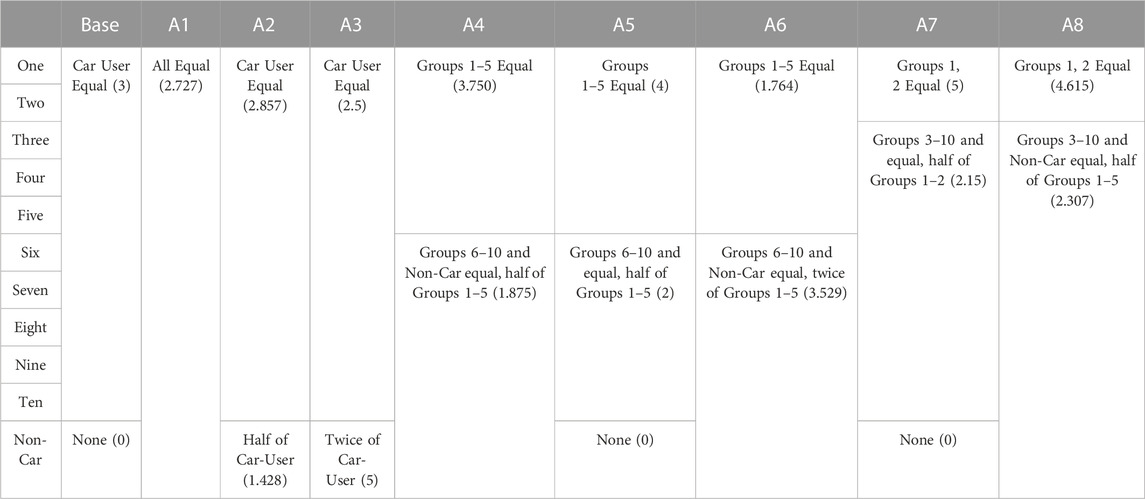
TABLE 3. Allocation of permits to non-car users and according to need (Individual share of total permits with number of permits in brackets).
4.2.4.1 Permit price
Under all allocation scenarios the permit price increase and equilibrium price are the same as under the base scenario. This is because the total number of permits available in the system is always the same so permits are sold and permit demand is always met in the same way. Where these differ from base is in the trading behaviour as permits are now traded between groups within the system (though in different ways in each scenario), rather than only buying excess permits from the bank as in base.
4.2.4.2 Permit use
As would be expected (because price is determined by demand), total permit use is also identical to base for all allocation methods.
4.2.4.3 Transactions and Budgets
What is interesting when considering the different allocation methods is the change in transaction behaviour and resultant impact on individual’s budgets. Under the base case no permits are sold across the whole time period. When non-car users are allocated permits, and car-users have equal allocation, permits are sold at a constant rate. Note that in this model the sell rate is dependent on available permits (Equation 6), not in reaction to demand. So early in the time period, when permit price is at it’s lowest, daily use is high, but there are less permits available to sell. Furthermore, when car-user groups are allocated more permits than are needed on an individual day, then a proportion will sell permits (and tend towards a reduction in travel in the same way as groups with lower need—see later when price sensitivities are also accounted for). On the other hand, car-user groups with a lower allocation than is required are needing to buy permits, which they do when price is lower than their group equilibrium price in the early part of the simulation, and are available for needs to be met due to the higher sales than in the base case.
As is demonstrated in Table 4, these complex transactions instigated by the different allocation methods lead to very different final budgets for each group than the base case where all car-users were equal and non-car has the same starting budget (as they did not have any permits). As with the base, all scenarios still incur additional permits in the early days bought from the bank in addition to those being traded with non-car, so some money is lost from the system, though all scenarios have the same final total budget (so the same amount is given to the bank in the early days). Thus, when non-car are allocated permits, they are capable of making profit (a compensation for the externalities of car-use) at the expense of car-users. So, we get the same end use and permit price, but all car-users are out of pocket compared to base case (where trading did not occur), and non-car users retain more of the total budget. At this stage, when the system is in equilibrium, trading is occurring between car-users and non-car-users, and is more efficient than base as it reduces money transferred to the bank. Likewise, when car-users are allocated amore permits for higher need, they can sell permits for a profit (though we accept in reality they may need to use these—see later when sensitivities are added). Alternatively, this could be seen as a compensation to them for the additional hardships they may face for reducing their car-use compared to other car-users.
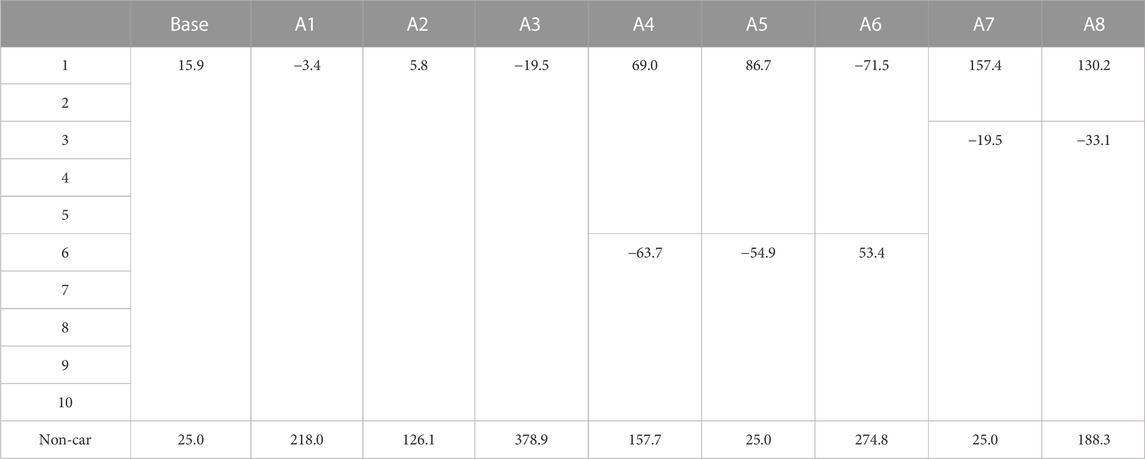
TABLE 4. Final budgets under different allocation methods.
4.3 Combined scenarios
For more realistic scenarios we are required to consider combinations of the sensitivity tests we have carried out on price sensitivity, daily preference, allocation, as well as considering different allocations of current use and group size.
4.3.1 CS1: Non-car group size
In the base model we have only one non-car group, represented by one individual. As we assume that each individual makes one trip per day, then this would be about 9% of trips. In the UK, around 68% of commuting trips are by car (though this is 27% in London) (DfT, 2021). There are many people who do not use a car (either by choice or inability), and so it can be argued [and has been—e.g., Wadud (2011)], that permit systems may only be fair if permits are allocated to all across the population, and this may even include children. As such, we would expect the group size for the non-car to be much larger than the 9% we have considered so far. In the following combined scenarios (see Table 5), for CS1 and CS2, we have increased the non-car group size to 10 (CS1.1 - so equal car users) and 20 (CS1.2—so more than car users). To test an extreme case we also consider what would happen if it is not known who are the car-users and non-cars users so an assumption is made that not only the non-car group is the same size as car-users, but also that they are also car-users with the same desired trip rate (CS1.3). In reality, this would not be a method of allocation as we would expect authorities to have knowledge of total number of trips (e.g., through traffic counts) and be able to identify car users (e.g., through car ownership). For all of these scenarios both permit sensitivity and daily preference are set at the base case.
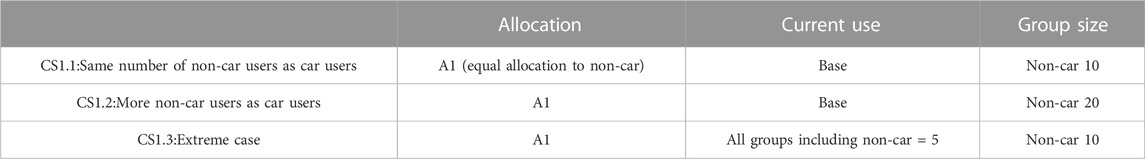
TABLE 5. CS1 scenarios.
An increased group size of non-car users (CS1.1, CS2.1) does not affect the permit price, or number of banked permits, as shown in Figure 5A, B. This is because although in both cases the car users are allocated less permits, there are sufficient permits available to purchase from the non-car users (and excess from the bank) to meet demand in the same way. For our extreme case, CS1.3, we see that permit price actually becomes negative (we accept this is not plausible and is for illustration only) as the market has been flooded with permits for trips that would never have been carried out in reality. We have a total number of 60 permits within the system, yet only 50 trips are required to meet car-users preference of one trip/day. Thus, although the number of permits used is reduced so the target would seem to be met—there is no real reduction in trips. This shows the importance of establishing baseline activity on which to base the permits issued and allocated.
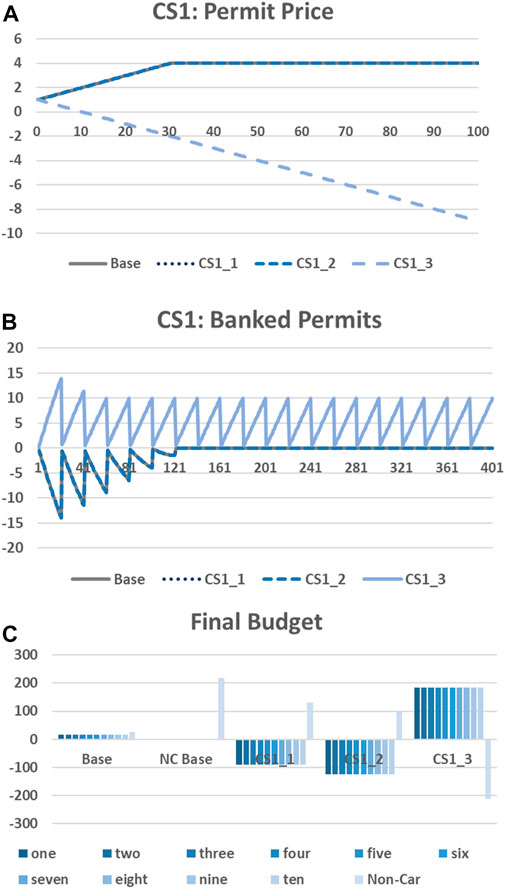
FIGURE 5. CS1 (A) Permit price; (B) Banked permits; (C) Final budget.
What is also interesting is the effect on the individual final budgets (Figure 5C). Recall under base conditions that the Bank can produce extra permits to meet demand, which takes some money out of the system. This still occurs in CS1.1 and CS1.2, but in CS1.3 there are enough permits sold to the bank to more than meet demand. Once the non-car group is increased then car-users are required to spend much more (as they require more permits to meet their demand), but each non-car individual earns less money (as permits have been shared with a larger group). Again, this shows careful consideration should be given on who is included in the allocation to ensure that the correct people are compensated (for example could be the difference between allocating to households or individuals). We see a quirk in the model regarding the extreme case CS1.3—permit prices are negative, but as per the scheme design individuals are forced to sell permits - so in effect the non-car group are paying the car users to take the permits. This is clearly not an optimal scheme design. A further difference from the allocation only scenarios is that we find that the overall budgets are not constant between scenarios—whereas in the base we have an overall budget of 184, this drops to −772, −1,161, and 1,626 in CS1.1, CS2.2 and CS1.3 respectively. This is because there are more permits in the system than the base case.
4.3.2 CS2: Allocation according to price sensitivity
In the allocation according to price sensitivity tests, set out in Table 6 (where current use is set at 5, the same as base), we considered the impact of individual price sensitivity to permit price, finding that heterogeneity in price sensitivity can effect equilibrium permit price and lead to those more highly sensitive to price travelling less, but earning more income. This could be seen as an adequate re-distribution of wealth, but on the other hand could mean than travel needs are not met by the highly price sensitive (who may already be more vulnerable in other ways). Similarly, we have considered how allocating more permits to groups with specific needs can allow targets to be met at the same permit price as the baseline, but with additional needs compensated for. In other words, if an individual is more price sensitive, then they qualify for additional needs, hence should also have a higher allocation. For all of these scenarios both daily preference and current use are set at the base case.
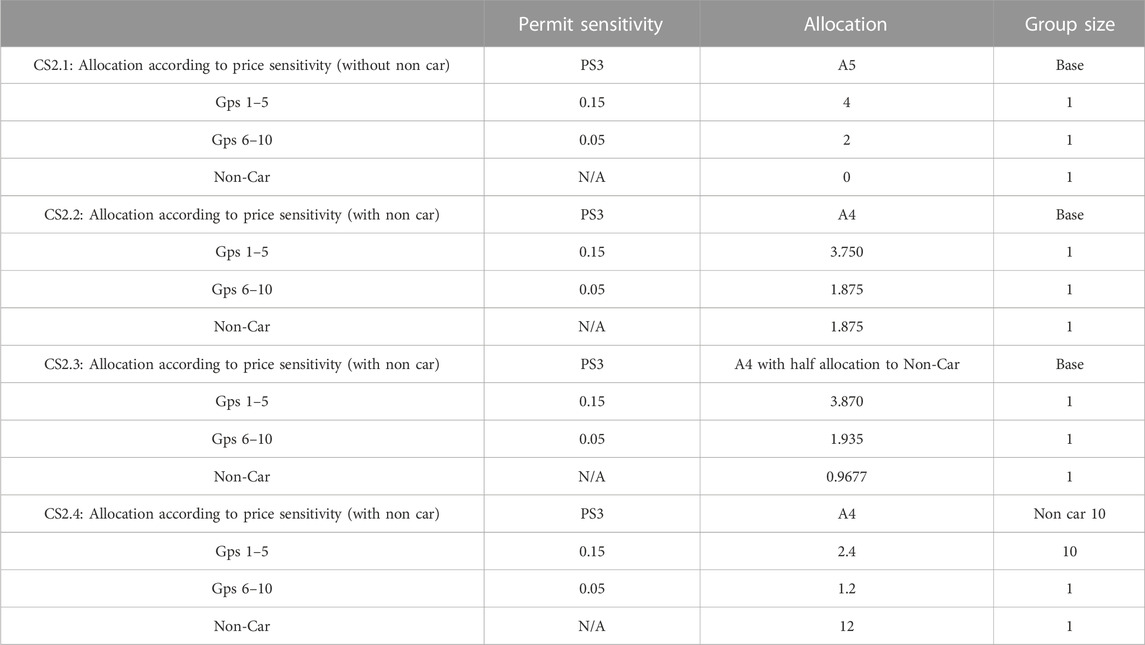
TABLE 6. CS2 scenarios.
Under all of these scenarios, permit price again follows the same progression as base, and targets are met. The equilibrium weekly permit use is the same as PS3 (where there is only a difference in price sensitivity), in that the higher price sensitive groups reduce to just two trips/week and lower sensitive groups reduce to four trips/week. As with our previous set of combined scenarios, the difference is once again in the trading behaviour and final budgets of the groups (Figure 6).
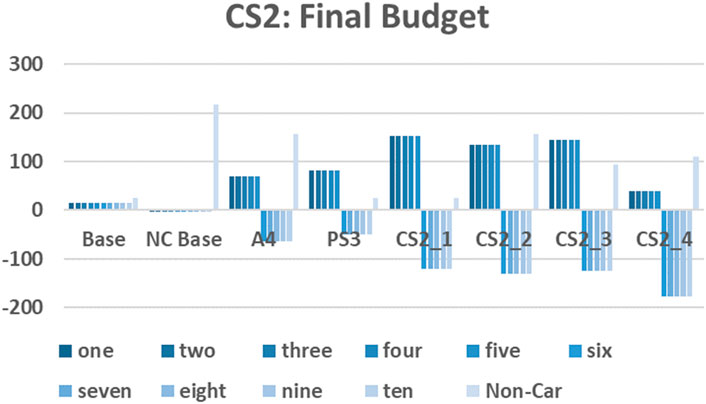
FIGURE 6. CS2 final budgets.
When allocating to price sensitivity (CS2.1), those with higher price sensitivity end up better off than both bases, A4 (allocation according to need, without accounting for sensitivity but including non-car users), and PS3, than those lower sensitivity worse off. Therefore, in CS2.1, although those with higher price sensitivity may still reduce their travel more than the lower price sensitive, they sell their permits to be compensated for that. If non-car users are included in the allocation with the same number of permits as the low sensitive group (CS2.2), they are slightly worse off than in the non-car base, as are all car-users to CS2.1, though only marginally. The final CS2.2 budget for non-car users is similar to A4 indicating that allocating car user permits according to need does not affect the compensation to non-car users.
In CS2.3, with a halved permit allocation to non-car (compared to low sensitive car-users), then car users are similar to CS2.1 and CS2.2, though high sensitive users and non-car are much better off than A4 or PS3, at the expense of non-car users. However, non-car are less well off than CS2.2 due to their half allocation. Thus, reducing the non-car compensation has limited benefit for car users. A larger non-car group (CS2.4) leads to all groups being worse off than CS2.1 and CS2.2. Therefore, in areas where there is a large portion of non-car users, allocation to that group may be more problematic (politically) towards car-users, and the allocation portion to non-car users would have to be carefully tested.
From the above discussions, we can conclude that allocating towards price-sensitivity needs can be beneficial for those with high price sensitivity without detriment to non-car users, but the fairness of doing so across the whole population is dependent on group size being accounted for. In reality the challenge of doing so would be in identifying those with higher price-sensitivity, as this could either be related to income or additional needs (e.g., unable to use other modes for some reason).
4.3.3 CS3: Allocation according to price sensitivity and daily preferences
In addition to assuming that those with higher price sensitivities may have additional permit needs, then one could also assume that those individuals may have specific days that they are most sensitive to. Therefore, as set out in Table 7, we have developed seven scenarios to understand how this may impact the success of the TTPS.
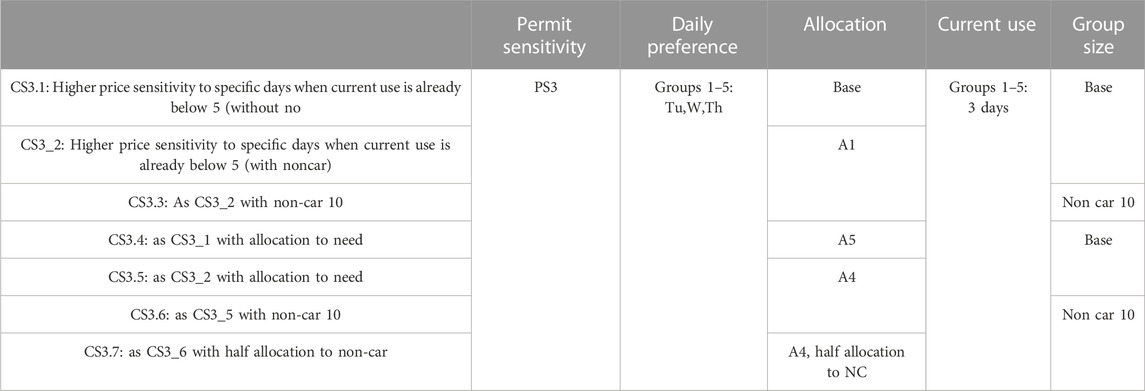
TABLE 7. CS3 scenarios.
Shown in Figure 7A, the seven CS3 scenarios result in a different equilibrium price than the base and single scenarios, which is lower and non-constant. This is because half of the car-users have both a lower current use (of 3) and daily preferences. Due to the dis-equilibrium the policy target is not quite met (24.03 permits are used per week instead of 24).
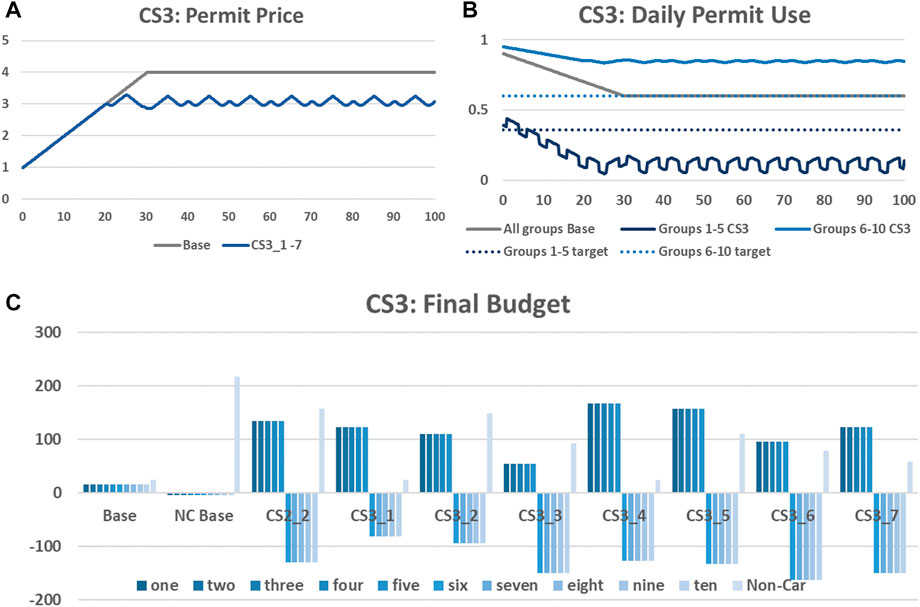
FIGURE 7. CS3 (A) Permit price; (B) Daily permit use; (C) Final budget.
The final budgets for CS3 are shown in Figure 7B. Comparing the final budget to CS2.2 (allocation according to price sensitivity), when there is a lower current use with a daily preference associated with the high price sensitivity (CS3.2), low price sensitive car users are slightly better off, whereas other groups are slightly worse off. The highly sensitive groups most benefit in CS3.4 and CS3.5 (and more so than under CS2.2), but at the expense of other groups. Under CS3.6 and CS3.7, with a non-car group size of 10, all groups are worse off. Thus, from these results, we can deduce that when accounting for daily preferences and current use in line with price sensitivities, it is important to allocate to need and to include allocation to non-car users, as this allows compensation to non-car users with limited impact on car-users.
As could be assumed by the identical permit price behaviour, the same permit use behaviour is happening under all CS3 scenarios. Similar to our findings regarding price sensitivity in Section 4.2.2.2 where we showed that groups with lower price sensitivity reduced their trip less than those with higher price sensitivity, we found that the higher use groups did not reduce their car use in line with targets, reducing from 1/day to around 0.85 rather than 0.6 (Figure 7C). On the other hand, the lower use groups reduced their car use to much below their 0.36/day target (reducing use from 0.6/day to around 0.15 Tu, W, Th, 0.06 M and 0.09 F). So, even though they are compensated for their reduced use, their higher price sensitivity may mean they make a greater sacrifice then their low sensitive counter-parts, as they start at a daily permit use lower than their desired current use (0.54/day) due to the price sensitivity. Although this is due to our assumptions, in that permit transactions are dictated by price sensitivities, this may highlight an argument for providing protected (non-tradable) allowances.
4.3.4 CS4: Disequilibrium in group size
In our final combined scenario (CS4) we test the impact of large groups which drive a small amount compared to small groups who drive a large amount. We set groups 1–5 as having 3 days per week of current use but a group size of 5, whereas groups 6–10 are kept as base levels. In this case, similar to CS3, the equilibrium permit price is lower than base and non-constant. There is a higher initial number of initial trips (100), leading to a higher target number of permits (60), which is not quite met due to the dis-equilibrium (60.43).
Shown in Figure 8, both groups reduce their daily use, however Groups 1–5, which drive less but contain more individuals reduce their use more (overreaching their target by around 10%) than Groups 6–10 who drive more but are smaller. These do not reach their target of 0.6, missing it by around 20%. Thus, a minority of high-mileage drivers are benefitting at the expense of the majority low-mileage drivers. This may be seen as unfair (especially as generally higher-mileage is associated with high income), though what we do not account for here is the reason for driving, which for some could be legitimate car dependence.
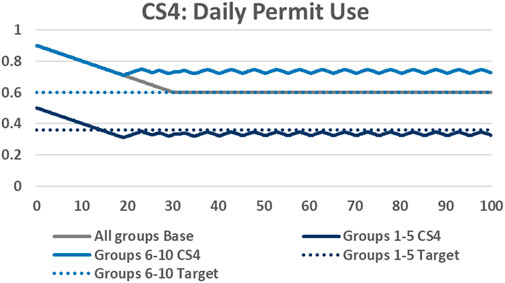
FIGURE 8. CS4 Daily permit use.
5 Discussion and conclusion
5.1 Policy recommendations
From the results presented in the previous section we have made the following observations:
• The TTPS modelled here with simple heuristic algorithms is sensitive to incremental price change, as well as heterogeneity across the population.
• Under baseline conditions with homogenous groups at equilibrium price no trading occurs and users simple travel the desired amount, which has reduced from the initial value. Prior to reaching equilibrium there is a transition period where the bank sells permits to meet demand and this can result in money leaving the group of users depending on price and demand. In our case, prices were initially low so that users paid the bank for excess permits.
• There are two types of equilibrium. Under baseline, where no trading occurs between the homogenous groups, the target is met and people have simply come to the equilibrium where permits are used for their own purposes. In the other forms of equilibrium, which occurs in all heterogeneous scenarios, trading occurs between groups and some groups will continue to pay each week for their travel needs while others receive that money in compensation for accepting a lower than preferred travel level.
• Trading (by car-users) does not occur at the start of the scheme if the initial permit price is set too low. Although policy objectives may be met (or close to being met) in all scenarios modelled here once an equilibrium permit price is achieved, this may not have equal impact across the population. Those with higher price sensitivities sell their permits, which allows for a re-distribution of wealth across the population, but this may lead to travel needs (possibly of the most vulnerable) not being met.
• Allocation of permits according to need may be required to redress this and could provide some further compensation but could still lead to needs not being met. In this case we think “protected permits” could offer a solution.
• Having different daily preferences in the population will influence the equilibrium permit price and final budget of an individual. This heterogeneity across the population will more-or-less even out at an aggregate level, but if preferred days are homogenous then targets could be missed.
• Including non-car users within the allocation allows for compensation for those who may be effected by the externalities of car use and encourages trading rather than purchasing additional permits from the bank. This then leads to further expense for the car users, the size of which is dependent on the number of non-car users in the population and the portion of permits allocated to them.
From this we can provide initial policy recommendations. First and foremost we would advocate for TTPS being considered within the policy options to reduce private car trips, as we have shown that targets can be met (if price sensitivity matches the target). This could be in relation to a road pricing scheme (Pattinson et al., 2022). Clearly, an accurate understanding of baseline behaviour is fundamental as this will be the determinant of the number of permits available. With increasing access to real-time, “real-world” data from new and emerging technologies this may become realistic (Harrison et al., 2020). However, who is included in the allocation and how permits are allocated is an important facet of the fairness of a TTPS. In line with the Unfair Burdens Argument (Tank, 2020), a TTPS may be beneficial for those already more wealthy who can still pay for higher travel, whilst the needs of the less wealthy may be unmet. Although this will mean some redistribution of funds across the population it may not be enough to compensate, and those with specific needs regarding travel would need some protections within the TTPS. Therefore, any allocation within a TTPS would need to account for both price sensitivity and travel needs of existing car users. For example, a certain amount of permits may need to be protected (i.e., not tradable) so that all users are guaranteed a certain minimum amount of car use. In reality, this could be problematic. If everyone is allocated a portion of free non-tradable permits then many of these permits may go unused, or could push up car use for those who are currently driving below the threshold amount (who use them because they can). Some users with both high need and high price sensitivities may still wish to sell if the price is high enough, so allocating non-tradable permits (or even an exemption entirely from the TTPS) may be required. It is also conceivable that if there is low price sensitivity across the population then permit price may continue to rise and not reach equilibrium within a desired time frame. In such a situation, there may be a political decision regarding a maximum permit price that acknowledges that the reduction target is not met. In addition, we would strongly recommend that non-car users are included within the allocation, to ensure fair compensation for externalities. It could also be argued that those individuals could then be allowed to carry out a car trip should they wish, though we did not model this. Although we did not consider who to include as a non-car user (e.g., children), we did identify that the larger the non-car use allocation the greater penalty on car-users. Although decisions on allocation portion and inclusion are political, a model such as this can help form such debates. Finally, we recognise that our base case is somewhat arbitrary and that the sensitivity to incremental price change is related to the heuristic algorithms we have implemented, so recommend that starting price and price change behaviour could be modelled dynamically and proportional in future developments. Though there will be a balance here with the reliability of an infrequent price change that would encourage acceptability.
5.2 Limitations and future work
We have presented a very simple model of a TTPS, designed to illustrate high level policy potential of such a scheme. The TTPS that we modelled was simplistic with a basic assumption of one car trip per day over a work week of 5 days, rather than containing the detail of TTPS that have been proposed in the literature such as access rights, vehicle miles or parking (See Table 1). The credits themselves were only valid for a week, rather than being multi-period, and the initial allocation was free. These designs will influence the effectiveness and efficiency of schemes, and such scheme design considerations can be developed in future work. Our focus on price sensitivities, daily preference and allocation can clearly result in many more scenarios though we have presented those that we found the most interesting within this paper. Of particular note, the development of more detailed and nuanced daily preferences, reflecting both travel habits and trading behaviours, and the consideration of weekly use rather than the daily use we have modelled could greatly increase the insight that this approach provides. In other terms, the heuristic price setting approach which we adopted could be adapted to be more adaptive and goal-seeking.
In addition to the design of algorithms and scenarios, there are many other areas in which we could refine the model beyond the simple assumptions that we have made and detailed in our discussions. In addition to these, our future work could focus on more practical long term policy, such as the proposed combination of TTPS with road pricing (which could be local or national), or the TTPS design could be expanded beyond car use as part of Mobility-as-a-service packages to help plan a journey—more informed choices could accelerate the time to target as well as lower the equilibrium market price. Both of these could also provide interesting further conclusions regarding equity. However, it should be noted that this is a micro model to understand the expected weekly dynamics of such a system. For long-term impact the outputs from this model will be integrated in the well-established LUTI model, MARS (Pfaffenbichler et al., 2008), where travel is represented between specific OD pairs within a study area and it can be evaluated against other new mobility policies and schemes.
6 Conclusion
Tradable Transport Permit Schemes (TTPS) offer great potential for an equitable, efficient and sustainable mechanism for reducing transport externalities. However, no wide-scale schemes have been implemented in any country, facing criticisms of acceptability and complex scheme design. In this simple system dynamics model we have shown how transport-related inequality related to price sensitivities and needs can be considered in the design of a TTPS, which reduces car use and meets policy objectives, with equilibrium occurring with or without trading. Careful consideration is needed in the TTPS design, in particular regarding the allocation of permits across the whole population, to ensure it is equitable, efficient and sustainable.
Data availability statement
The raw data supporting the conclusions of this article will be made available by the authors, without undue reservation.
Author contributions
GH and SS developed and designed the model. GH performed initial development of scenarios and analysis of results, under guidance of SS. GH drafted and revised the manuscript. SS reviewed and revised the manuscript.
Funding
Funding was provided through ESRC and co-funded by JPI-Europe for the UPASS project (Grant Ref: ES/T000074/1).
Acknowledgments
Thanks to colleagues in UPASS for their early feedback on this work.
Conflict of interest
The authors declare that the research was conducted in the absence of any commercial or financial relationships that could be construed as a potential conflict of interest.
Publisher’s note
All claims expressed in this article are solely those of the authors and do not necessarily represent those of their affiliated organizations, or those of the publisher, the editors and the reviewers. Any product that may be evaluated in this article, or claim that may be made by its manufacturer, is not guaranteed or endorsed by the publisher.
Supplementary material
The Supplementary Material for this article can be found online at: https://www.frontiersin.org/articles/10.3389/ffutr.2023.994349/full#supplementary-material
Footnotes
1There are subtle differences between the terms credits and permits, but we do not have the room to discuss this here. For ease we use the term permit throughout this paper.
References
Brands, D. K., Verhoef, E. T., Knockaert, J., and Koster, P. R. (2020). Tradable permits to manage urban mobility: Market design and experimental implementation. Transp. Res. Part A Policy Pract. 137, 34–46. doi:10.1016/j.tra.2020.04.008
Brands, D., Verhoef, E., and Knockaert, J. (2021). Pcoins for parking: A field experiment with tradable mobility permits. Tinbergen Institute Discussion Paper (TI 2021-029/VIII): Tinbergen Institute -available at: https://papers.tinbergen.nl/21029.pdf
Bristow, A. L., Wardman, M., Zanni, A. M., and Chintakayala, P. K. (2010). Public acceptability of personal carbon trading and carbon tax. Ecol. Econ. 69, 1824–1837. doi:10.1016/j.ecolecon.2010.04.021
Brohe, A. (2010). Personal carbon trading in the context of the EU emissions trading scheme. Clim. Policy 10, 462–476. doi:10.3763/cpol.2009.0050
Burgess, M. (2016). Personal carbon allowances: A revised model to alleviate distributional issues. Ecol. Econ. 130, 316–327. doi:10.1016/j.ecolecon.2016.08.002
De Palma, A., and Lindsey, R. (2020). Tradable permit schemes for congestible facilities with uncertain supply and demand. Econ. Transp. 21, 100149. doi:10.1016/j.ecotra.2019.100149
DFT (2021). (TSGB0101) Passenger transport by mode from 1952 In: DEPARTMENT FOR TRANSPORT, H. G. (ed.). Availabel at: https://www.gov.uk/government/statistical-data-sets/tsgb01-modal-comparisons (Accessed 21/06/22).
Dogterom, N., Bao, Y., Xu, M., and Ettema, D. (2018). Acceptability of a tradable driving credit scheme in The Netherlands and Beijing. Case Stud. Transp. Policy 6, 499–509. doi:10.1016/j.cstp.2018.06.003
Dogterom, N., Ettema, D., and Dijst, M. (2017). Tradable credits for managing car travel: A review of empirical research and relevant behavioural approaches. Transp. Rev. 37, 322–343. doi:10.1080/01441647.2016.1245219
Fan, J., He, H., and Wu, Y. (2016). Personal carbon trading and subsidies for hybrid electric vehicles. Econ. Model. 59, 164–173. doi:10.1016/j.econmod.2016.07.005
Fan, W., and Jiang, X. (2013). Tradable mobility permits in roadway capacity allocation: Review and appraisal. Transp. Policy 30, 132–142. doi:10.1016/j.tranpol.2013.09.002
Gao, G., and Hu, J. (2015). Optimal tradable credits scheme and congestion pricing with the efficiency analysis to congestion. Discrete Dyn. Nat. Soc. 2015, 1–6. doi:10.1155/2015/801979
Goddard, H. C. (1997). Using tradeable permits to achieve sustainability in the world's large cities: Policy design issues and efficiency conditions for controlling vehicle emissions, congestion and urban decentralization with an application to Mexico city. Environ. Resour. Econ. 10, 63–99. doi:10.1023/a:1026444113237
Grant-Muller, S., and Xu, M. (2014). The role of tradable credit schemes in road traffic congestion management. Transp. Rev. 34, 128–149. doi:10.1080/01441647.2014.880754
Harrison, G., Grant-Muller, S. M., and Hodgson, F. C. (2020). New and emerging data forms in transportation planning and policy: Opportunities and challenges for “Track and Trace” data. Transp. Res. Part C Emerg. Technol. 117, 102672. doi:10.1016/j.trc.2020.102672
Harwatt, H., Tight, M., Bristow, A. L., and Guehnemann, A. (2011). Personal Carbon Trading and fuel price increases in the transport sector: An exploratory study of public response in the UK. Eur. Transp. \ Trasporti Europei 47, 47–70.
Jia, S., Yan, G., Shen, A., and Zheng, J. (2017). A system dynamics model for determining the traffic congestion charges and subsidies. Arabian Journal for Science and Engineering 42, 5291–5304. doi:10.1007/s13369-017-2637-5
Krabbenborg, L., Molin, E., Annema, J. A., and Van Wee, B. (2021). Exploring the feasibility of tradable credits for congestion management. Transportation Planning and Technology 44, 246–261. doi:10.1080/03081060.2021.1883226
Lahlou, S., and Wynter, L. (2017). A Nash equilibrium formulation of a tradable credits scheme for incentivizing transport choices: From next-generation public transport mode choice to HOT lanes. Transportation Research Part B Methodological 101, 185–212. doi:10.1016/j.trb.2017.03.014
Miralinaghi, M., and Peeta, S. (2018). A multi-period tradable credit scheme incorporating interest rate and traveler value-of-time heterogeneity to manage traffic system emissions, Frontiers in Built Environment 4. doi:10.3389/fbuil.2018.00033
Mladenović, M. N., Abbas, M., Roncoli, C., and Chenani, S. B. (2019). A cooperative framework for universal basic mobility system: Mobility credits approach. IEEE Intelligent Transportation Systems Conference (ITSC) 27, 694–701.
Naumann, R. B., Sabounchi, N. S., Kuhlberg, J., Singichetti, B., Marshall, S. W., and Hassmiller Lich, K. (2022). Simulating congestion pricing policy impacts on pedestrian safety using a system dynamics approach. Accident Analysis & Prevention 171, 106662. doi:10.1016/j.aap.2022.106662
Pattinson, J.-A., Harrison, G., Mullen, C., and Shepherd, S. P. (2022). Combining tradable credit schemes with a new form of road -pricing: Producing liveable cities and meeting decarbonisation goals. Sustainability 14, 8413. doi:10.3390/su14148413
Pfaffenbichler, P., Emberger, G., and Shepherd, S. (2008). The integrated dynamic land use and transport model MARS. Networks and Spatial Economics 8, 183–200. doi:10.1007/s11067-007-9050-7
Raux, C. (2004). The use of transferable permits in transport policy. Transportation Research Part D Transport and Environment 9, 185–197. doi:10.1016/j.trd.2004.01.001
Raux, C. (2011). Tradable permits in the transport sector. Esher, SurreyJohn Libbey Eurotext. https://shs.hal.science/halshs-01741368/document.
Sabounchi, N. S., Triantis, K. P., Sarangi, S., and Liu, S. (2014). Dynamic simulation modeling and policy analysis of an area-based congestion pricing scheme for a transportation socioeconomic system. Transportation Research Part A Policy and Practice 59, 357–383. doi:10.1016/j.tra.2013.11.007
Shepherd, S. P. (2014). A review of system dynamics models applied in transportation. Transportmetrica B Transport Dynamics 2, 83–105. doi:10.1080/21680566.2014.916236
Tank, L. (2020). The unfair burdens argument against carbon pricing. The Unfair Burdens Argument Against Carbon Pricing 37, 612–627. doi:10.1111/japp.12429
Verhoef, E., Nijkamp, P., and Rietveld, P. (1997). Tradeable permits: Their potential in the regulation of road transport externalities. Environment and Planning B Planning and Design 24, 527–548. doi:10.1068/b240527
Wadud, Z., Noland, R. B., and Graham, D. J. (2008). Equity analysis of personal tradable carbon permits for the road transport sector. Environmental Science & Policy 11, 533–544. doi:10.1016/j.envsci.2008.04.002
Wadud, Z. (2011). Personal tradable carbon permits for road transport: Why, why not and who wins? Transportation Research Part A Policy and Practice 45, 1052–1065. doi:10.1016/j.tra.2010.03.002
Yu, X., Dong, Z., Zhou, D., Sang, X., Chang, C.-T., and Huang, X. (2021). Integration of tradable green certificates trading and carbon emissions trading: How will Chinese power industry do? Journal of Cleaner Production 279, 123485. doi:10.1016/j.jclepro.2020.123485
Keywords: tradable permits, system dynamics, mobility, transport policy, equity, modelling
Citation: Harrison G and Shepherd S (2023) Modelling a tradable transport permit scheme using system dynamics. Front. Future Transp. 4:994349. doi: 10.3389/ffutr.2023.994349
Received: 14 July 2022; Accepted: 10 January 2023;
Published: 30 January 2023.
Edited by:
Jonathan Köhler, Fraunhofer Institute for Systems and Innovation Analysis, GermanyReviewed by:
Mohammad Miralinaghi, Purdue University, United StatesAfroditi Anagnostopoulou, Centre for Research and Technology Hellas (CERTH), Greece
Copyright © 2023 Harrison and Shepherd. This is an open-access article distributed under the terms of the Creative Commons Attribution License (CC BY). The use, distribution or reproduction in other forums is permitted, provided the original author(s) and the copyright owner(s) are credited and that the original publication in this journal is cited, in accordance with accepted academic practice. No use, distribution or reproduction is permitted which does not comply with these terms.
*Correspondence: Gillian Harrison, Zy5oYXJyaXNvbkBsZWVkcy5hYy51aw==