- 1AKT II Limited, London, United Kingdom
- 2Department of Civil Engineering, School of Engineering, University of Birmingham, Birmingham, United Kingdom
Technological developments in Connected and Autonomous Vehicles (AVs) have created opportunities to allow groups of vehicles to travel in close proximity, through methods known as platooning. There are potential benefits from platooning in terms of fuel consumption, through a reduction in aerodynamic drag for trailing vehicles in the platoon; however, it is still not understood whether these benefits remain when the platoon is subject to crosswind. For the first time, this study examines the flow structure and aerodynamic response of a platoon of eight closely spaced lorry type vehicles subjected to a crosswind with a 30o yaw angle. The numerical study is conducted using a Delayed Detached Eddy Simulation. It is observed that there is an increase in the overall drag when compared to a similar simulation with no crosswinds. Streamline illustrations indicate that a recirculation region is formed on the leeside of the lorries, which with the chosen vehicle spacing does not exhibit any interactions with the consecutive lorry, resulting in a diminished drag reduction. High pressure on the windward side of the lorries and a low pressure region on the top of the lorry boxes results in high lift, side force and rolling moment coefficients, but relatively minor pitching and yawing moments.
1 Introduction
Advances in inter-vehicle communications and digital mapping technologies (Liaifar, 2013) have enabled connected and autonomous vehicles to safely travel in close proximity to one another. The advantages gained from these complex communication systems have enabled new autonomous methodologies for vehicle use, whereby vehicles travel closely together in a platoon; developed to exploit potential aerodynamic benefits with a view to reducing fuel consumption. The concept of platooning is however not a new concept; known as drafting or slipstreaming, the concepts are well-practised in motor racing and bicycle racing (Blocken et al., 2016). The main benefit of such formation is drag reduction. Previous studies on passenger cars indicate that savings up to 60% drag reduction can be obtained for the vehicles in a platoon when the inter-vehicle spacing is less than one vehicle length (Zabat et al., 1995; Tsuei and Savaş, 2001). However, Pagliarella et al. (2007), Watkins and Vino (2008) and Mirzaei and Krajnović (2016) noted from physical and numerical investigations that potential drag penalties may exist when it comes to two Ahmed body travelling at half vehicle length spacing. More recently, drag penalty for the last vehicle in a three-bluff-body platoon was observed by Le Good et al. (2019). Both experimental and numerical studies on two car platoon with different inter-vehicle spacing were conducted by Altinisik et al. (2015), using a 1/5th FIAT Linea model. Findings suggest that the lead car experiences substantial drag reduction (up to 50%), particularly at small inter-vehicle spacing, while no drag reduction was observed for the trailing car. However, research on heavy-goods vehicle (HGV) platoons suggests that drag reduction could always be achieved, at least for the trailing lorries due to platooning (Davila et al., 2013; Uystepruyst and Krajnović, 2013; Humphreys and Bevly, 2016; Bruneau et al., 2017; Veldhuizen et al., 2019).
In the aforementioned research, the effects of crosswinds have been ignored. Given the importance of such winds from a vehicle aerodynamics perspective this is rather surprising. Research has been carried out for decades mainly for single truck subject to various wind conditions. According to Baker and Reynolds (1992), about 400 wind-induced vehicle accidents occurred during the storm on 25th January 1990, resulting in death or injury in the United Kingdom. Extensive research has been undertaken since the 1990s on vehicles in crosswind using wind tunnel, CFD and numerical approaches (Coleman and Baker, 1990; Baker, 1991a; Baker, 1991b; Baker, 1991c; Baker and Reynolds, 1992; Coleman and Baker, 1994; Baker and Humphreys, 1996; Cheli et al., 2006; Hargreaves and Morvan, 2007; Quinn et al., 2007; Sterling et al., 2010; Cheli et al., 2011; Choi et al., 2014; Altinisik et al., 2015; McArthur et al., 2018). It was noted that the overall drag of the vehicle is normally the highest in the range of 20°–40° yaw wind compared to that at other yaw wind angles (Cheli et al., 2011; Altinisik et al., 2015), whilst the side force increases more or less linearly with the increase of yaw angle if it is less than 60° (Coleman and Baker, 1990; Coleman and Baker, 1994; Cheli et al., 2006; Cheli et al., 2011). The aforementioned research has shown that there are relatively strong crosswinds effects on a single ground vehicle but, as noted, there is very limited information on the effects of crosswinds on the aerodynamic performances of ground vehicle platoons.
Conventional methods of simulating crosswind conditions in an experimental wind tunnel for ground/rail vehicles include mounting a set of vertical axis shutters along the test section (Dominy and Ryan, 1999) and rotating the vehicle regarding the inlet flow of the wind tunnel to investigate a full range of yaw angles (Cheli et al., 2011). An innovative approach different from wind tunnel is to use a moving model test rig together with a crosswind generator test section; essentially a wind tunnel mounted perpendicularly to the moving vehicle to accurately create realistic yaw angle conditions (Soper, 2016; Gallagher et al., 2018). In terms of vehicle platoons, only limited experimental research (Marcu and Browand, 1999) on the unsteady aerodynamic response caused by crosswind and wind gusts have been conducted on vehicle platoons due to the complexity of the problem. In general, it is difficult to visualise the details of the flow around vehicles via an experimental approach unless costly PIV techniques are employed, while CFD provides flow information of the entire simulation domain. As noted above, Reynolds Averaged Navier Stokes (RANS) simulations have been widely used. However, the conventional RANS turbulence model is not suitable for simulating unsteady flows, particularly cases where vehicle’s wake turbulence interacts with the incoming flow, as these unsteady flows can only be partially reproduced using the RANS approach and results are given in a time-averaged form (Guilmineau, 2008). The Large Eddy Simulation (LES) approach shows great improvement compared to RANS but is computationally expensive, especially for high Reynolds number (Re) problems. As a result, there is growing interest in applying a hybrid approach, i.e., Detached Eddy Simulation (DES), which is a hybrid of RANS and LES. A large proportion of recent numerical research on ground vehicles aerodynamics has been based on DES due to its low demand for computational resources and the ability to gain a greater understanding of the unsteady components of the flow, with results shown to agree well with experimental data (Krajnović et al., 2007; Flynn et al., 2014; Ashton and Revell, 2015; Morden et al., 2015; Flynn et al., 2016; Humphreys and Bevly, 2016; Wang et al., 2017; Li et al., 2018).
The work outlined in the current paper extends our previous work (He et al., 2018; He et al., 2019) and aims to shed light on the flow around long platoons subject to a crosswind. He et al. (2018) investigated an eight-vehicle platoon subject to no crosswinds with three different inter-vehicle spacings, namely 0.5, 1.0 and 1.5 l, where L is the length of the vehicle in question and found that lorry spacing is a critical parameter in terms of the overall drag forces exerted on the lorries, with the conclusion that larger spacing allows the downstream turbulence to develop resulting in a higher pressure difference and the strongest flow-vehicle interaction occurs at 0.5 l inter-vehicle spacing. In light of these findings, He et al. (2019) carried out a Delayed Detached Eddy Simulation (DDES) investigation on an eight-lorry platoon with 0.5 l inter-vehicle spacing subject to no crosswinds, which indicated significant drag reduction for trailing lorries and a potential vulnerability to vehicle stability due to induced lateral forces by the aerodynamic flow. The main objective of this current research is to examine the flow structure and the unsteady aerodynamic response of eight closely running vehicles in a platoon formation subjected to crosswinds using DDES techniques. A 30o yaw angle is chosen as the literature indicates that generally this angle is believed to lead to the worse wind condition in terms of side forces and yawing moment (Ryan and Dominy, 1998), while the drag is among the highest compared to other yaw angles (Cheli et al., 2011). For a lorry running at the highest speed (60 mph) in a dual carriageway in England, 30° yaw wind is equivalent to a crosswind normal to the side of the lorry at 34.6 mph (15.5 m/s), which can be expected in extreme weather conditions, and it is this case which is examined further in what follows. As noted by He et al. (2019), a 0.5 l inter-vehicle spacing potentially results in the strongest flow-vehicle interactions and as such attention is focused on this particular scenario.
In section 2 the lorry model, computational domain and numerical setup are presented. The validation of the numerical results and mesh independence study is shown in section 3 and the results are presented in section 4. Finally, section 5 presents appropriate conclusions.
2 Computational Methods and Models
2.1 Configurations of the Lorry Model
The lorry chosen for this study is the Leyland DAF 45. The geometry of this box type lorry was scaled to 1/20th, with reduced complexity in order to save computational resources. Larger components on the lorry such as the front bumper, chassis, axle and wheels were maintained while smaller features such as the side view mirror, mudguard, and transmission shaft were not included. Removal of such small features makes the shape more generic and was found to have negligible effects on characteristic aerodynamic coefficients (He et al., 2019). The lorry has a length of L = 0.395 m, a height of H = 0.175 m and a width of W = 0.125 m (Figure 1). It should be noted that all the dimensions in this paper will be normalised with respect to the length of the lorry, L.
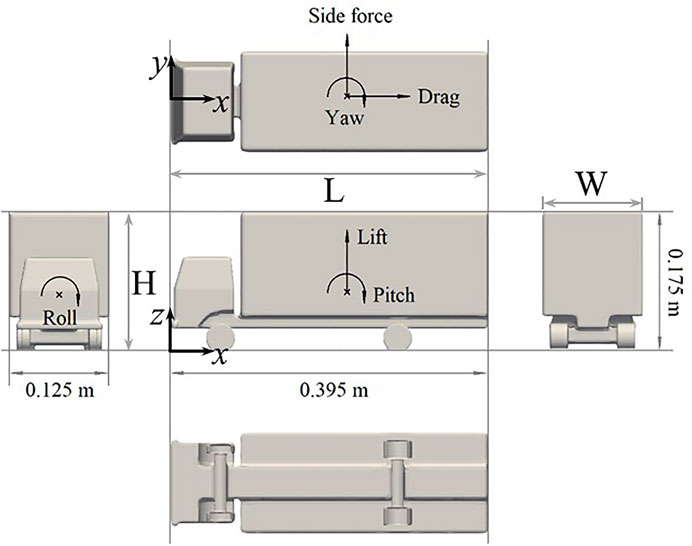
FIGURE 1. Orthogonal views of the simplified lorry geometry with definitions of the aerodynamic force and moment coefficients.
The adopted sign convention used herein is shown in Figure 1, where
where ρ is the density of air, u∞ is the uniform free-stream velocity at the inlet, Af is the projected frontal area of the lorry and Al is the projected lateral area. The coefficients of the rolling moment, pitching moment and yawing moment are defined as followed:
where h is the reference length, which is taken as the lorry height. The cross-section from the front of the lorry is used as the reference area. As well as understanding the overall forces on the vehicle, we will also consider the development of surface pressures for comparison with experimental studies. The surface pressure is presented in a dimensionless form, which is defined as:
where p is the time-averaged pressure distribution and p∞ is the free-stream pressure.
2.2 Numerical Setups and Boundary Conditions
For this current numerical study, DDESs were conducted. The DDES methodology is a variant of the conventional Detached Eddy Simulation, using Reynolds-Averaged Navier-Stokes with wall functions to solve the near wall flow whilst solving the detached flow by Large Eddy Simulation (LES) approach (Spalart et al., 2006). This hybrid methodology reduces the computational time required to resolve the near wall flow but maintains good accuracy for bluff-body vehicle aerodynamics research compared to LES (Hemida and Krajnović, 2009). The convection terms were discretised using the linear-upwind stabilised transport (LUST) scheme to maintain both stability and accuracy. LUST discretisation scheme has a fixed blend of 75% second order central differencing scheme and 25% second order upwind scheme (Openform, 2016). The implicit PISO solver was used with three corrections steps and 10 non-orthogonal correctors were used within each step so that the error due to low quality mesh is minimised. The time-averaging of velocity and pressure took place when the flow was fully developed along the whole platoon, which was ensured by monitoring the time histories of the aerodynamic coefficients of the first, middle and last lorries. The time averaging of the data was started once the boundary layer was fully developed and a period of 1.37 s was used for averaging. This averaging period was chosen as the value of aerodynamic coefficient no longer changes if the time averaging time decreases/increases, and is equivalent to the time taken for the flow to travel eight lorry lengths or 226 lorry heights.
The 1/20th 8-lorry model platoon is placed on the ground in the computational domain as shown in Figure 2. The rectangular domain has a length of 26 l in the stream-wise direction, 11.5 l in the span-wise direction and 3.1 l in the vertical direction and was created with such dimensions to ensure no interruption of the flow structures around the platoon due to the side boundaries of the computational domain. The first lorry is situated at a distance of 2.5 l away from inlet 1, with a spacing of 0.5 l between each individual lorries. These lengths have also been adopted for various research were found to be sufficient for flows around similar bodies (Hemida et al., 2005; Krajnovic and Davidson, 2005) In the present work, the platoon with 0.5 l inter-vehicle spacing was chosen as this as lorries travelling at such close spacing may potentially experience stronger flow-vehicle interaction (He et al., 2019).
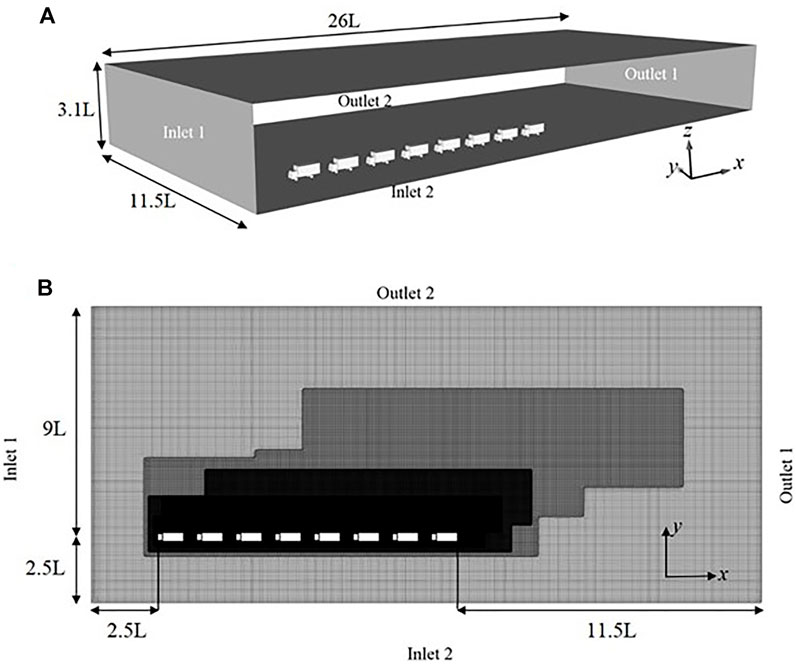
FIGURE 2. (A) Geometry and dimensions of the computational domain (B) The dimension and illustration of the computational mesh created at the cut plane normal to the z-axis at 0.1 m above the ground.
In the simulation, the side wind was introduced as uniform flow perpendicular to the side of the platoon. To simulate the relative motion between the platoon and the ground, the ground surface of the domain was set to be a moving wall at the same velocity as the main inlet. The main inlet, inlet 1, was created at the front of the computational domain whilst another inlet, inlet 2, was imposed on the side wall. Inlet one was set with free-stream velocity with uniform flow at u1 = 25 m/s, in keeping with the inlet velocity used by He et al. (2019), while inlet two was set with uniform flow at u2 = 14.43 m/s in order to reproduce crosswind effects of 30° yaw. The corresponding resultant freestream velocity is u∞ = 28.86 m/s. Results presented in this study are non-dimensionalized with respect to this velocity (where appropriate). The walls on the opposite sides of the inlet were applied with an outlet condition, outlet 1 and 2, to maintain the mass balance of the transverse direction, with the reference pressure of p∞ = 0. These outlet planes were set far away at a distance of 15 l stream-wise and 9 l span-wise to avoid the influence errors created by the gradient-free conditions at the outlets, as shown in Figure 2. The top surface of the domain was set with a slip wall boundary condition. A no-slip boundary condition was assumed on all the surface of the stationary lorries, whilst the ground is set with moving at free-stream velocity, u∞ to simulate relative motion of running lorry platoon. It should be noted that the atmospheric turbulence and shear are not simulated. The simulation setup is more comparable to the “low turbulence wind condition” employed in the study by Cheli et al. (2011), which will be used for validation in section 3.2.
Figure 2A shows an illustration of the computational mesh created at a plane normal to the z axis and 0.1 m above the ground. The meshes generated for the current simulation were dominated by hexahedron and prism cells. The mesh around the platoon of vehicles is refined by three refinement regions so that the flow characteristics can be well captured. In order to adapt to the shifted wake due to the crosswind, clusters of mesh to the rear and side of the lorries were increased significantly to resolve the flows near the walls. The regions around the bodies of the lorries have y+ between 10 and 50, which ensures a correct velocity gradient near the wall. Based on these values, the Spalding wall functions were applied in these simulations (Launder and Spalding, 1974).
3 Validation and Mesh Independence
3.1 Mesh Independence
In order to check the convergence of the obtained results regarding mesh grids, a mesh dependence study was performed which was based on Cp measured on the lorry surface for coarse and fine meshes, shown in Figure 3. The coarse mesh has 17 million cells while the fine mesh possesses 26 million cells. Lorries one and eight were used to assess the mesh independence. Two pressure profile line positions were taken at the symmetry plane of the lorry normal to y-axis and another plane normal to z-axis at z/L ≈ 0.57 above the ground, respectively.
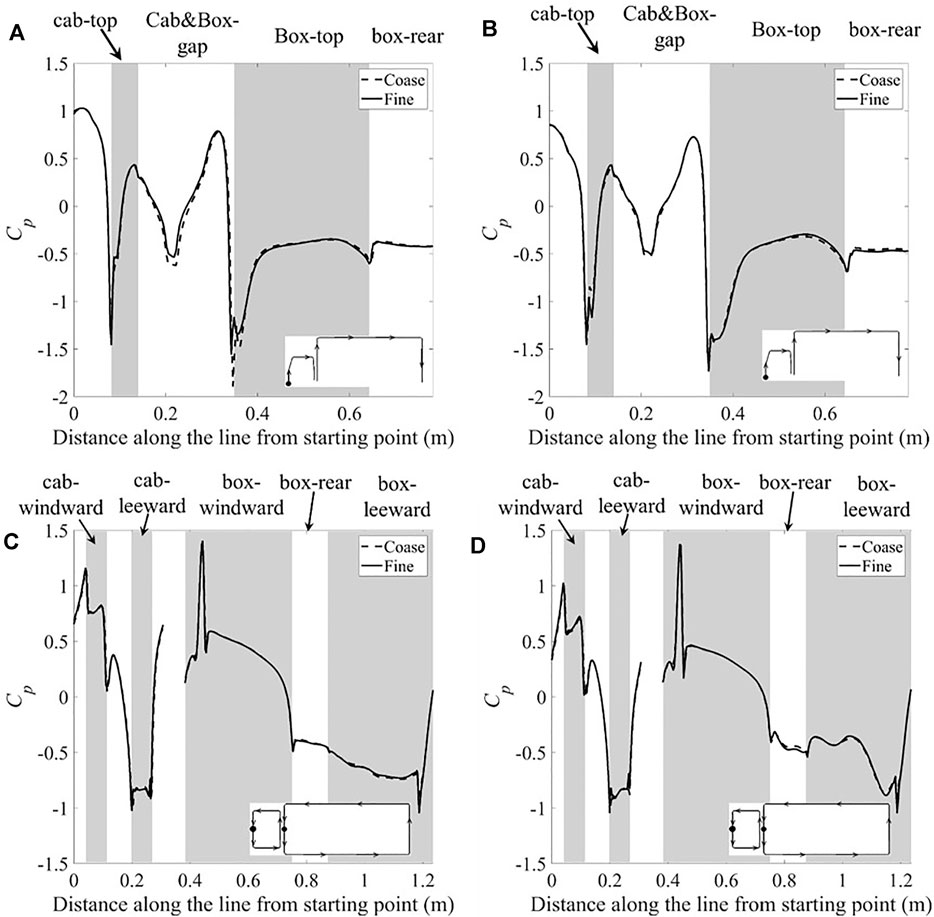
FIGURE 3. Surface pressure coefficient along two cross-sectional lines on two of the lorries in the platoon for coarse and fine meshes: (A). Lorry one at y/L = 0; (B). Lorry eight at y/L = 0; (C). Lorry one at z/L ≈ 0.57; (D). Lorry eight at z/L ≈ 0.57.
Figure 3 indicates good agreement between the results obtained from the coarse and fine grids as the results are almost identical for the majority of the sampled positions, especially for the pressure profile line taken at z/L ≈ 0.57. Only very minor discrepancies occur at the front box edge of the first lorry. It should be noted that the front edge of the cab of the first lorry, and the front edge on the windward side of the box of the lorries are the stagnation point, where the Cp is greater than 1.0, as shown in Figures 3C,D; this is due to the viscous effects of the fluid. The viscous work on the stagnation streamline fluid can result in a rise in the total pressure above that of freestream, thus leading to Cp greater than one at the stagnation point when the stagnation pressure is scaled by the freestream dynamic pressure (Issa, 1995; Batchelor, 2000). The mesh independence study suggests that the majority of the important eddies have been resolved and no further refinement of the mesh is needed. In this work, the results from the fine mesh grid were used for the investigation of the aerodynamics of platoon lorries in 30° yaw wind.
3.2 Validation of the Numerical Results
Due to the limited availability of data, validation of the simulation results was based on existing wind tunnel tests carried out by Cheli et al. (2011) on an isolated lorry with a similar vehicle shape at similar Re (105). The wind tunnel tests were carried out under two turbulence conditions, a low and high turbulence simulation, respectively. Only the results from the tests under low turbulence condition will be used herein, which are more comparable to the wind conditions in the simulations. Aerodynamic coefficients and surface pressure over a range of yaw wind angles were obtained.
Figure 4 shows the comparison of Cp over two cross-sectional loops on the lorry box between the present simulations and wind tunnel tests from Cheli et al. (2011). It is worth noting that the experimental data only contains the mean values, with the uncertainty assumed to be of the order of 5% (Sterling et al., 2010).
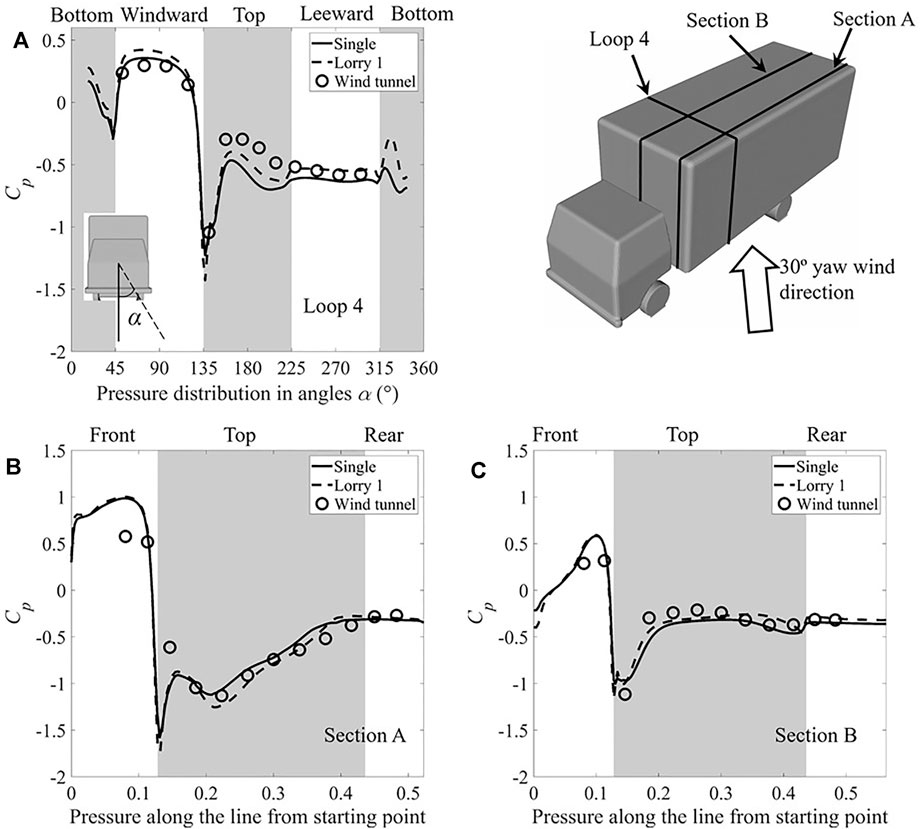
FIGURE 4. Cp distribution along cross-sectional loops on the lorry box (A). loop four at x/L = 0.365; (B). section A at y/L = -0.4; (C) section B at y/L = 0.
It can be seen from Figure 4 that the discrepancies mainly occurs near the front edge of the lorry box, where strong flow separation takes place. These differences can perhaps be attributed to a number of factors; the lorry model used in the current study is a simplified version of that used in the wind tunnel with the small features removed, such as door mirrors, underbody skirt etc., These differences can cause additional small-scale turbulence, resulting in an alteration of the wind characteristics. For the incident wind, the turbulence intensity and length scale can also impart alterations to the surface pressure of ground vehicles (Robinson and Baker, 1990; Baker and Humphreys, 1996). Taking the above effects into account, the overall agreement between the current work and both the full-scale and wind tunnel results is regarded as adequate.
4 Results and Discussion
4.1 Drag Coefficients of a Single Lorry and Lorries in the Platoon
Table 1 provides a summary of the aerodynamic coefficients obtained from the DDES simulation of a single lorry with 30° yaw wind are compared with existing literature for a similar lorry shape—Sterling et al. (2010) and Cheli et al. (2011).

TABLE 1. List of the aerodynamic coefficients obtained from the current work and literature of the similar lorry shape.
As can be seen from Table 1, the DDES results show good agreement with the aerodynamic coefficients for drag and side force found in the literature, but the values of the lift force coefficient are somewhat variable. This is not unusual and reflects the difficulties in properly simulating the ground beneath the vehicle which are inherent in all reduced model simulations.
A comprehensive comparison of all the drag, lift and side force coefficients, obtained from the platoon and single lorry cases under headwind and 30o yaw wind conditions, is shown in Figure 5. The presence of a crosswind causes a significant increase in the drag, side force and lift coefficients on the platoon. It is observed in Figure 5A that the leading lorry experiences the highest drag force, although a slight drag reduction of roughly 7.5% can be observed compared to that of an isolated lorry, which is half the reduction found in the no-crosswind case. The second lorry sees a reduction in drag compared to an isolated lorry (∼22.3%) with the same crosswind condition, which is similar to but much less significant than that in the no-crosswind case (He et al., 2019). The drag coefficients of the consecutive lorries (lorry 3–7) are at a similar level with slightly higher magnitudes than that of lorry 2, although there is a gradual increase as the lorry is situated further into the platoon. The last lorry has the highest drag coefficient among all the trailing lorries, which also resembles the last lorry in the no-crosswind case. A significant rise in lift coefficients of all the lorries can be observed in Figure 5B. While the lift coefficients of all the lorries in the platoon remain in the order of 0.01 if no crosswind is present, the lift coefficients increase to around 0.2 at the presence of the crosswind. The increase of the lift due to crosswind has been observed in a number of previous studies (Sterling et al., 2010; Cheli et al., 2011). In contrast to the drag force results, the first lorry exhibits the least lift force and a noticeable increase in lift force can be observed for the second lorry. The lift force coefficient then remains at the same level as that of lorry 2 with a slight continuous increase as the lorry is situated further into the platoon until the last lorry, which has a lower lift force compared to the penultimate lorry. This indicates slight changes in the flow around the lorries based on position in the platoon. Figure 5C indicates the presence of significant side force on each lorry due to crosswind. There is a clear decreasing trend in the side force coefficients as the lorry is situated further into the platoon, although a plateau can be observed for the lorries in the very middle of the platoon, i.e. lorry 3–5. It should be pointed out that the difference of drag, lift and side coefficient between the leading lorry of the platoon and single lorry is attributed to the flow around the leading lorry interacting differently with the consecutive lorry in comparison to a wake formed behind a single lorry, thus leading to the difference in forces (further discussion in Figure 6). Additionally, it is also worth noting that the mean side force coefficients in the headwind case are zero for all the lorries, as would be expected.
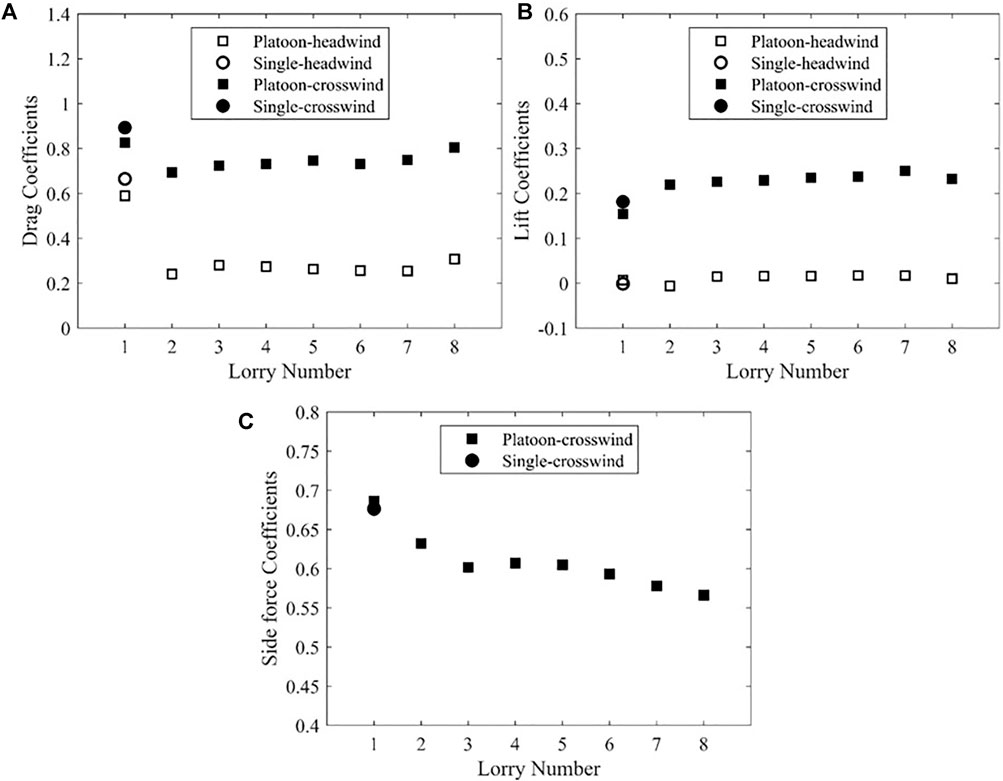
FIGURE 5. The aerodynamic coefficients obtained from the current study and He et al. (2019). (A). drag coefficients; (B). lift coefficients; (C). side coefficients.
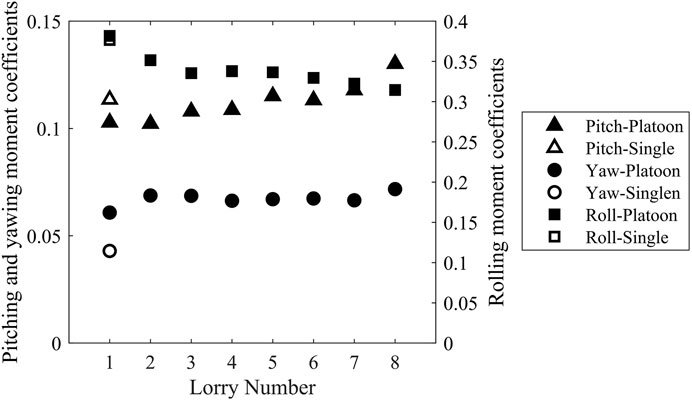
FIGURE 6. (A) Top view of contours of time-averaged velocity (top), Pressure coefficient (middle) and instantaneous Q-criterion (bottom). z/L = 0.25. (B) Side view of contours of velocity (top), Pressure (middle) and Q-criterion (bottom). y/L = 0.
Figure 7 shows the pitching, yawing and rolling moments coefficients for an isolated lorry and each lorry in the platoon under the presence of crosswind. As evident from Figure 6, all of the lorries are subject to rolling moment towards the lee face, based on the coordinate conventions defined in Figure 1. The first lorry suffers the highest rolling moment compared to the rest of the lorries in the platoon, which is even slightly higher than an isolated lorry. This is due to the higher side forces experienced by the first lorry in the platoon, compared to an isolated one. There is a gradual decrease, in terms of the magnitude, in the rolling moment from lorry 2 to 3, then the rolling moment remains consistent before reducing again from lorry 6 onwards. The trend in the rolling moment is identical to that in the side force, shown in Figure 5C, which indicates that the rolling moment is mainly due to the strong side forces caused by the crosswind, agreeing with the previous findings of Cheli et al. (2011). The pitching and yawing moments are relatively small in magnitudes compared to rolling. While yawing moments remain low and relatively consistent for all the lorries, noticeable pitching moments are found for all the other lorries in the platoon, which appears to continual increase with lorry number. It is also interesting to note that although small in magnitudes, the yawing moments of all the lorries in the platoon are visibly larger than that of an isolated lorry. This implies that the drivers of platoon lorries might have more difficulties with the steering when subject to crosswind.
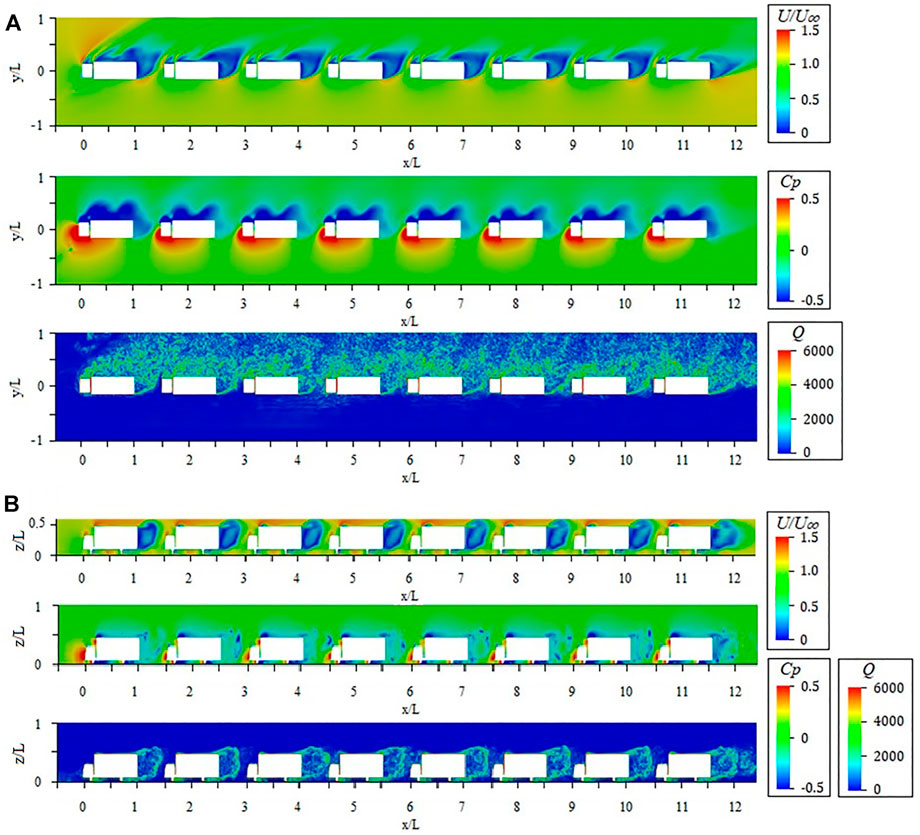
FIGURE 7. Comparisons of moment coefficients of lorries in a platoon with the presence of crosswind.
4.2 Time-Averaged Flow
In this section, the flow field of a platoon of lorries travelling under 30° yaw wind condition is examined through the contour plots of velocity, dimensionless pressure coefficient and Q-criterion. Q-criterion is a method for finding vortex structures, which was first proposed by Hunt (1988). It is the second invariant of the velocity gradient tensor, a positive value of which indicates the regions of vortices.
Figure 7A shows the top view of a plane normal to z-axis at z/L = 0.25. As can be seen in the figure, the velocity contour implies that the wake of the lorries swings towards the leeside, forming a low velocity region near the leeward box side surface and the rear surface. A narrow but relatively high velocity region is identified between the wake of the front lorry and the nose of the following neighbour lorry. In addition, the shape of the leeward and wake low velocity region seems to be inconsistent between the lorries on both ends and those in the middle, which could be linked to the trend of higher drag coefficient on both ends observed in Figure 5A. The pressure coefficient contour plot indicates that large positive pressure is located at the windward side, while the leeward side exhibits negative pressure, resulting in high rolling and yawing moments, as shown in Figure 6. The Q-criterion illustrates the instantaneous flow structure at the given plane. It is apparent that the downstream flow is highly turbulent. Due to the high yaw angle, the flow around the front lorry interacts differently with the consecutive lorry, compared to the headwind case (He et al., 2019); where flow separation was observed at the top of cab and front edge of the lorry box of the leading lorry, while all the trailing lorries were immersed in the downstream turbulent flow generated by the leading lorry. For the current case, in the gap between lorry 1 and 2, a relatively small region in front of lorry two is purely blue, indicating that the flow is less turbulent in that region. This small region shrinks as the flow passes a latter positioned lorry in the platoon until the gap between lorry 3 and 4, where the gap is fully filled with turbulent flow matching the given Q-criterion. This may cause a more unbalanced flow condition between the nose and rear of lorry 2 and 3, leading to higher yawing moment observed in Figure 6.
A side view of the same contours can be found in Figure 7B at a plane normal to y-axis at y/L = 0. The velocity contour in the top figure in Figure 7B shows a similar wake pattern for all the lorries in the platoon except the last one, which is obviously due to no following vehicles. Unlike the no-crosswind case, the low velocity region in the wake expands upwards to a height higher than the top surface of the lorry. The pressure coefficient contour in the middle of Figure 7B suggests that low pressure region can be identified on the top of the lorry box for each lorry, resulting in high lift coefficients.
In addition, there is an obvious greater positive region at the nose of the first lorry and a more negative pressure region at the rear surface of the last lorry, which causes higher drag for both lorries compared to all the middle vehicles. The Q-criterion contour agrees with the findings in Figure 7 that the wake of the first two lorries is relatively short, leaving a gap of less turbulent flow region before the front of the consecutive lorry. However, after the flow passes lorry 3, the highly turbulent flow region starts to extend to fill in the whole inter-vehicle spacing, as has also been identified from the bottom figure.
Figure 8A illustrates the normalised horizontal (U) component of the flow velocity distribution when the platoon passes various measurement positions. Similar patterns of velocity distribution are observed on the side of all lorries. The individual wakes can be observed at 0.5L, but not at 1 and 1.5 l away from the leeside of the platoon. Focusing on the distribution lines measured at the closest position from the platoon side, it clearly shows considerably less fluctuation of the flow velocity at a very low elevation above the ground. At higher positions, namely z/L = 0.12 and 0.25, a significant change in velocity is expected. When the front lorry passes the measurement position, a swift drop of velocity is observed, which is accompanied by a rapid rise when the following lorry is passing. There is a perceptibly larger drop after the first lorry, while the velocity variation is more or less the same as the trailing lorries pass. There is a reduced and delayed velocity drop after the whole platoon passes at approximately 0.7 l behind lorry 8.
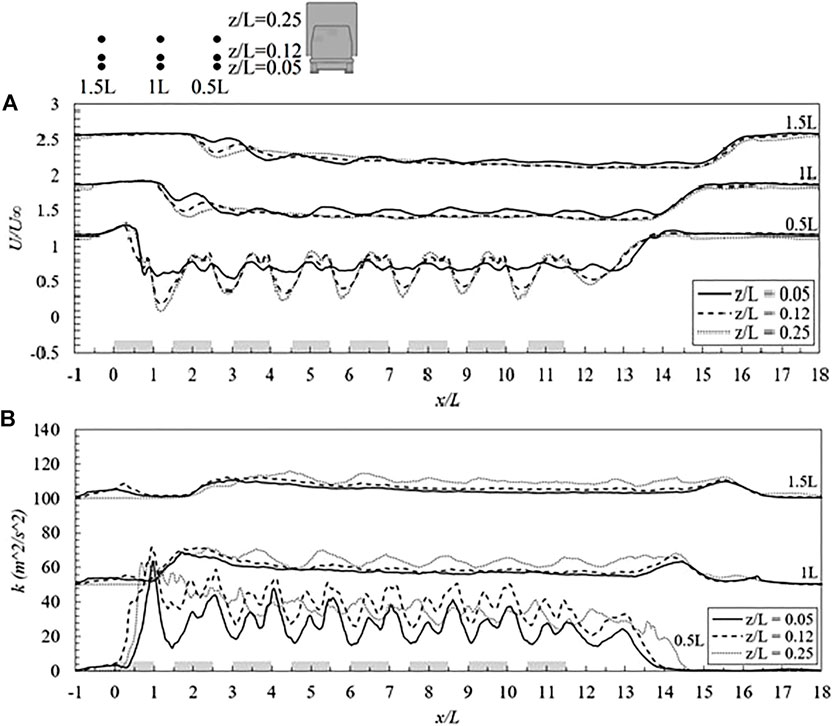
FIGURE 8. Horizontal profiles at the horizontal distance of 0.5, 1 and 1.5 L from the leeside of the lorries at z/L = 0.05, 0.12 and 0.25 of (A) Velocity distribution (B) Turbulent kinetic energy.
Figure 8B show s a similar measurement plot as Figure 8A but with regard to the turbulent kinetic energy (k). It can be seen that a high level of turbulent kinetic energy is usually generated when the rear of a lorry leaves the measurement position. Similar to the observations in Figure 8A, the highest fluctuation of the turbulent kinetic energy occurs after lorry 1 passes the measurement position and a gradual and less significant rise is detected in the wake of lorry 8, about 1.5 l away from the rear surface. However, this is quite different from the no-crosswind case, as can be seen in (He et al., 2019), the location of the highest turbulent kinetic energy is at the connection between the cab and box of each lorry, although the general trend of the variation of k remains similar.
4.3 Time-Averaged Pressure
In this section, the surface pressure distribution is observed at various cross-sections around the lorry surface. Figure 9A illustrates the pressure distribution of a cross-sectional line along the middle of the lorry at y/L = 0. As can be seen in Figure 9A, all the lorries in the platoon have relatively similar pressure distribution along the given cross-sectional line. The only exception lies in the nose of the first lorry and the rear of the last one, where greater positive pressure is identified at the nose of the first lorry, while more negative pressure occurs at the rear of the last vehicle. This exception of the pressure leads to higher overall drag experienced by the lorries at both ends of the platoon, as discussed above.
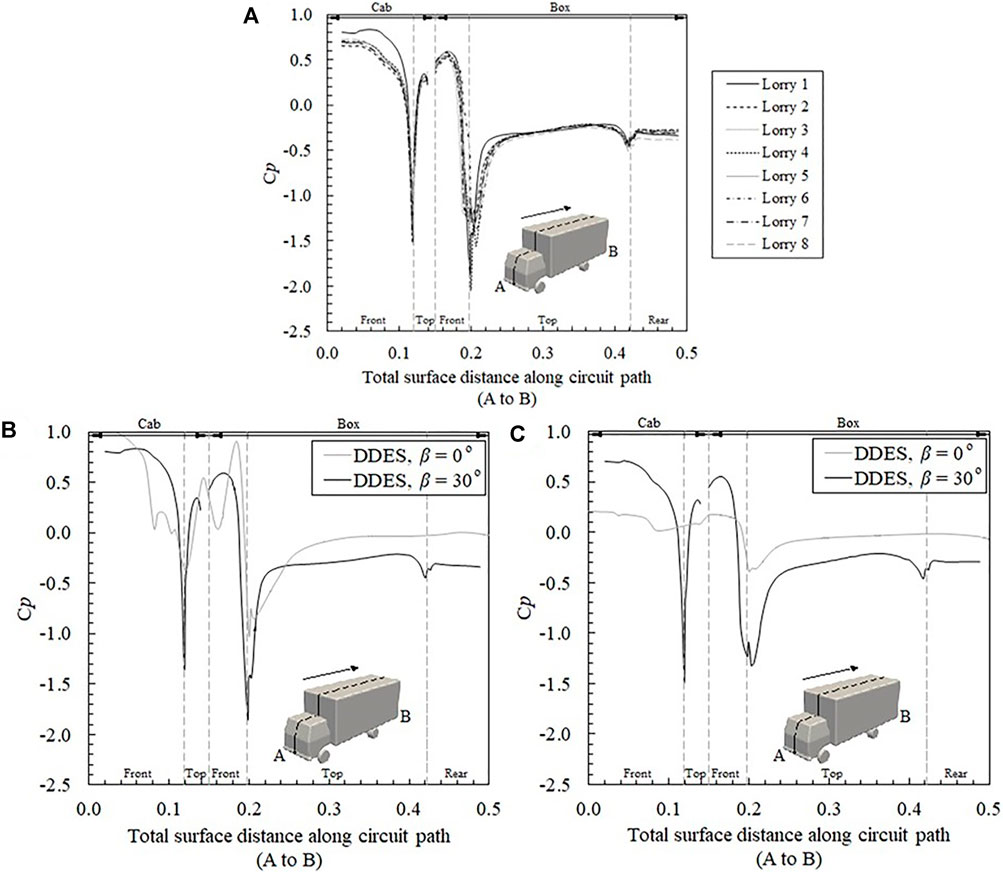
FIGURE 9. (A) Comparison of the distribution of pressure coefficient along the surface distance from the circuit path (A,B) on all lorries. Comparison between the crosswind and no-crosswind cases of the Cp distribution along the surface distance from the circuit path (A,B) on (B). lorry one and (C). lorry 5.
Figure 9B compares the surface pressure distribution along the lorry center line between the current crosswind case and the no-crosswind case (He et al., 2019). It clearly indicates a great difference in pressure distribution between the lead and one of the middle lorries subject to crosswind and in no-crosswind conditions. For the first lorry in the platoon, shown in Figure 9B, the positive pressure at the front region, with and without crosswind, is similar in magnitude. However, the negative pressure at the top and rear surfaces of the lorry box shows a significant difference, due to the increased flow separation under crosswind conditions.
As a result of a crosswind, both top and leeward surfaces suffer from more negative pressure, leading to higher drag and lift compared to those in the no-crosswind case. For the trailing lorries, using lorry 5 as a representative, substantial difference in the pressure distribution due to crosswind can be observed, as shown in Figure 9C. Greater positive pressure can be found at the frontal surface of both the cab and the lorry box, and more negative pressure is around the top and rear surfaces of the lorry box, similar to the lead lorry. The above-mentioned regions lead to the significant difference in drag and lift coefficients for lorry five between the crosswind and no-crosswind case.
Figure 10 shows the pressure distribution along cross-sectional lines at various longitudinal locations on the lorry box. In general, the curves at the same box location for different lorries show similarity, especially for all the trailing vehicles. Therefore, only lorry two is presented herein as an example. The windward surface pressure distribution for both lorry one and two show a comparable trend, i.e. the pressure from x/L = 0.25 up to 0.5 is constantly positive and at roughly the same level of magnitude. The pressure has a noticeable drop at x/L = 0.75 and a significant drop to negative values at x/L = 0.9. At the leeside, the pressure at all the locations considered in the present work is negative. In addition, it seems that the closer to the front edge, the more negative the pressure will be on the leeward lorry box surface. The top surface pressure is usually low with dramatic changes at the windward edge due to flow separation. The flow in the middle section of the lorry box re-attached quickly after passing half width of the surface, indicated by the recovered Cp on the top surfaces. However, for the location close to the front of the lorry, i.e., the line at x/L = 0.25, Figure 10 implies that there are no re-attachment. In order to further reveal the flow pattern, the time-averaged pressure contour and surface velocity tracer line are plotted in Figure 11 for lorry 1.
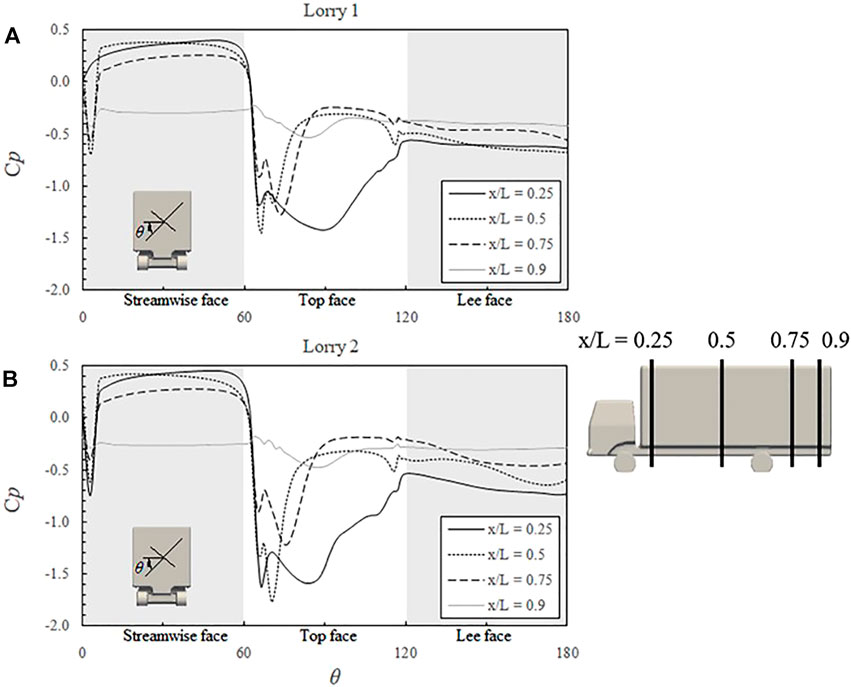
FIGURE 10. Comparison of the distribution of pressure coefficient along the surface distance around the box of the lorry at a different stream-wise distance (A). lorry 1; (B) lorry two.
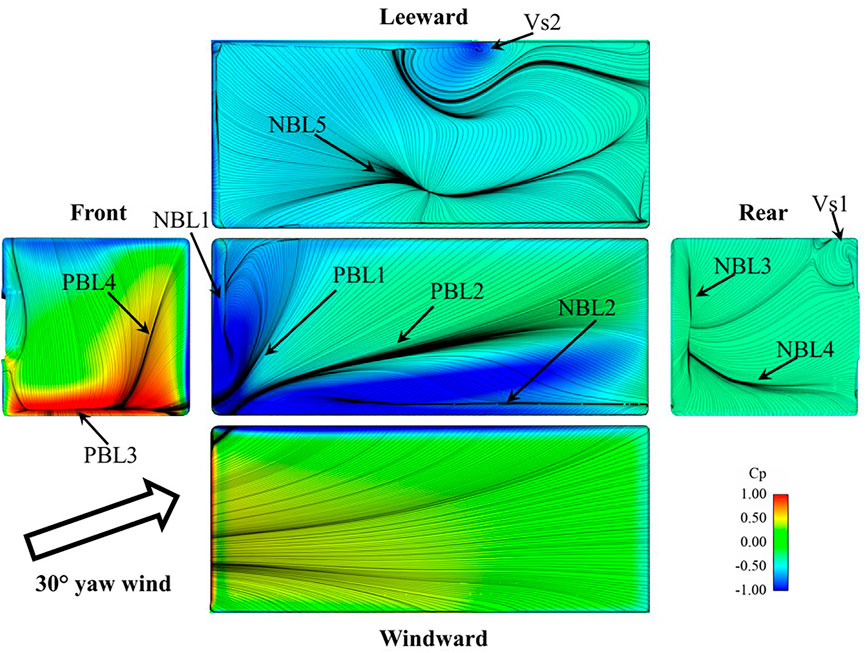
As clearly indicated from the top view in Figure 11, strong negative pressure areas were identified by two bifurcation lines pairs, i.e. NBL1-PBL1 and NBL2- PBL2, respectively (where NBL stands for negative bifurcation line and PBL represents positive bifurcation line). Based on the critical point theory (Perry and Chong, 1987), NBL shows the position of flow separation while PBL indicates where flow re-attaches. It seems that delta wing vortex structures, also identified by Coleman and Baker (1994) for a lorry with a similar shape, were formed on the top surface of the lorry box under crosswind condition, which leads to large negative top surface pressure and therefore large overall lift force. The front view shows the two PBLs which are equivalent to the stagnation position of the flow, associated with large positive pressure. The shape of the line suggests that the flow in the connection between the gap and box follows an oblique pattern. For the windward side, there seems to be no flow separation at all, leading to relatively uniform pressure distribution with a negative pressure gradient from the front to the rear. For the rear and leeward side surfaces, flow separation was identified by the NBLs. Therefore, the overall pressure on the surface is negative. In addition, the existence of two vortex cores can be identified by Vs.1 and Vs.2, based on the unique surface pattern. These vortices were generated by the yaw wind and separation at the lower edge of the lorry box.
4.4 Vortex Structures
In this section, the flow structures around the lorry platoon are investigated. A series of streamlines plots are created together with the visualisation of the vortex cores around a lorry in the platoon. Due to the strong similarity of the vortex structure between all the lorries in the platoon, only the flow structure around lorry one is presented in this work. It should be noted that the current work is limited to the simulation of uniform wind condition, which is different from atmospheric wind condition. The length scales of atmospheric turbulence overlap the geometry scales of the vehicle model and the turbulence at the overlapping scales could be expected to be important and disrupt the flow patterns. However, the current approach fits the purpose of this fundamental work, while the issue of turbulence needs further investigation and is out of the scope of this study.
Figure 12A, Figure 12B,C,D, and E exhibits the streamlines on a number of cross-sections at different longitudinal positions normal to x-axis, while Error! Reference source not found. shows the streamlines projected on a series of planes normal to z-axis at a different elevation above the ground. As indicated in Figures 12A,B, a large recirculation (V4) is identified on the leeside of the driver cab, which disappears when moving towards the connection between the cab and box. Its size maintains throughout the bottom up to the top of the cab, as seen in Figure 12B,C . At the middle of the leeside of the lorry box, there are two vortex cores, denoted by V1 and V2 in Figure 12C. (It is worth noting that V2 is essentially Vs.2 shown in Figure 11.)
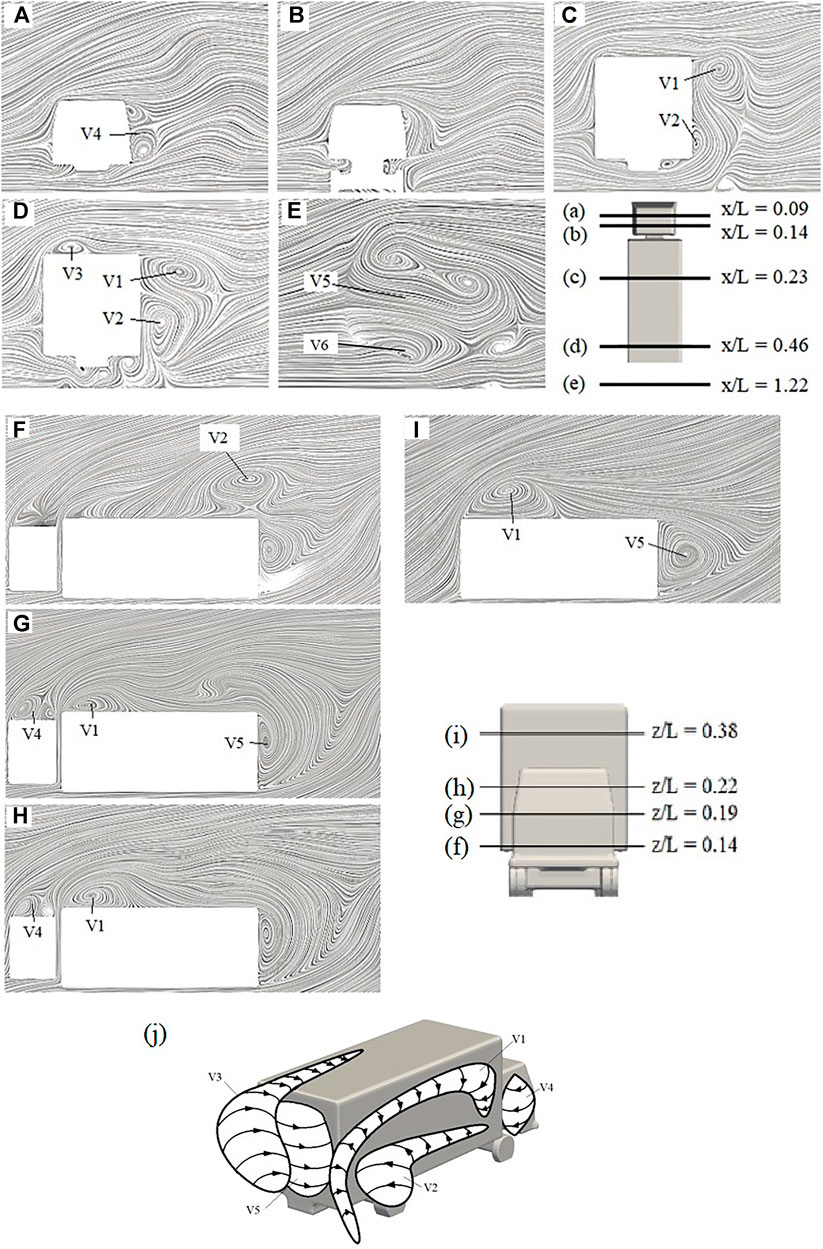
FIGURE 12. Time-averaged streamlines projected on cross sections normal to x-axis at different longitudinal positions, (A),(B),(C),(D), and (E). Time-averaged streamlines projected cross sections parallel to the ground of the lorry at a different height (F), (G), (H), and (I) (J) Schematic illustration of the time-averaged flow topology around lorry one in the platoon.
Figure 12D suggest V1 and V2 grow in size and travel towards the vertical centre position of the box surface, as the cross-sectional location moves further down to the rear of the box. Combined with Figure 12B,C, it can be observed that V1 is a vortex structure that develops from the top leeside corner of the longitudinal front edge of the lorry box and goes slightly down along the leeside edge of the top surface. V2 is generated from the bottom of the box on the leeside. It is small in size at the front locations but gradually increases towards the rear. It only exists from the bottom of the box up to the mid-height. Moreover, another recirculation (V3) seems to develop from position in Figure 12C,D on the top of the lorry box. In the wake region, as illustrated by Figure 12E, another recirculation area (V5) is identified with growing dimension from the bottom to the top of the lorry box (Figure 12B–D ). V5 is the vortex core (Vs.1) that previously seen in Figure 11. Based on the above discussion, the final schematic representation of the vortex core is presented in Figure 12J.
5 Conclusions
In this study, the effects of crosswinds acting on an eight-lorry platoon with half-vehicle length inter-vehicle spacing have been investigated using the DDES technique. The results were validated against wind tunnel data (Cheli et al., 2011) on the same lorry found in the literature. The headwind simulation of an identical lorry platoon (He et al., 2019) was used to signify the crosswind effects. A number of important conclusions based on the numerical results are as follows:
• The overall drag of the platoon is much higher when subject to crosswind than the no-crosswind case investigated in a previous study. The drag reduction gained by vehicle platooning when subjected to crosswind is approximately 22%, i.e., significantly less than that in the headwind case (∼70%). Apart from less drag reduction and higher magnitude, the drag coefficients of all the lorries in the platoon appear to follow a similar trend for both wind cases.
• The presence of crosswind causes the lorry platoon to experience high side force and rolling moment, but relatively minor pitching and yawing moments. Large regions of positive pressure are situated at the windward side of the lorries, resulting in higher rolling moment towards the lee face. The side force coefficients appear to be a function of the lorry number with the highest side forces on the first lorry while the smallest on the last one. The rolling moment coefficients exhibit an identical trend with the side force coefficients, suggesting the dominant contribution from the side forces to the rolling moments of the platoon lorries. The overall lift on all lorries is also higher when compared with cases without crosswind, this is due to the low pressure region building up on the top of the lorry box. The yawing moments of all platoon lorries are noticeably larger than that of an isolated lorry, resulting in potential increased difficulty in steering.
• The flow structure around the lorry platoon revealed that the presence of crosswind causes a narrow and high velocity region to occur between gaps of the lorries and the wake is generated towards the leeside and downstream of the lorries. The recirculation region was then formed on the leeside of the lorries without exhibiting any interactions with the consecutive lorry, resulting in the less drag reduction.
• The comparisons of profile lines at different distance and elevation from the leeside of the lorries show that strong fluctuations of flow velocity and turbulent kinetic energy occur at the inter-vehicle spacing between lorries in the platoon, with the highest fluctuation occurs at the rear region behind the first lorry. The fluctuation of flow velocity near the ground at the elevation of z/L = 0.05 is also significantly less drastic when comparing to the velocity at the elevation of z/L = 0.12 and z/L = 0.25.
• The pressure distribution along the central cross-sectional line on the leading lorry shows higher positive pressure at the nose, and the trailing lorry shows greater negative pressure at the rear section, resulting in higher drag experienced by the lorries at both ends; while all the other lorries in the middle of the platoon show very similar pressure distribution.
• Flow separates from the front windward edge, forming a roll of vortex sheet extending along the top surface of the lorry box downstream and overlaps with the recirculation zone at the rear. Two vortex structures were observed on the leeside of the lorry, a larger vortex sheet stretching from the top corner of the lorry box and then away from the surface, and a smaller circulatory flow at the bottom of the box on the leeside.
Data Availability Statement
The raw data supporting the conclusions of this article will be made available by the authors, without undue reservation.
Author Contributions
All authors listed have made a substantial, direct, and intellectual contribution to the work and approved it for the publication.
Conflict of Interest
The author MH is currently employed by AKT II Limited, though they were not employed by the company during the time of this research.
The remaining authors declare that the research was conducted in the absence of any commercial or financial relationships that could be construed as a potential conflict of interest.
Publisher’s Note
All claims expressed in this article are solely those of the authors and do not necessarily represent those of their affiliated organizations, or those of the publisher, the editors and the reviewers. Any product that may be evaluated in this article, or claim that may be made by its manufacturer, is not guaranteed or endorsed by the publisher.
Acknowledgments
The work outlined in this paper is part of an EPSRC funded project entitled ‘The aerodynamics of close running ground vehicles—EP/N004213/1’. The authors acknowledge the computational resources provided by Athena at HPC Midlands+ (funded by EPSRC on grant EP/P020232/1) and BlueBEAR at the University of Birmingham.
References
Altinisik, A., Yemenici, O., and Umur, H. (2015). Aerodynamic Analysis of a Passenger Car at Yaw Angle and Two-Vehicle Platoon. J. Fluids Eng. 137, 121107. doi:10.1115/1.4030869
Ashton, N., and Revell, A. (2015). Key Factors in the Use of DDES for the Flow Around a Simplified Car. Int. J. Heat Fluid Flow 54, 236–249. doi:10.1016/j.ijheatfluidflow.2015.06.002
Baker, C. J. (1991a). Ground Vehicles in High Cross Winds Part I: Steady Aerodynamic Forces. J. Fluids Struct. 5, 69–90. doi:10.1016/0889-9746(91)80012-3
Baker, C. J. (1991b). Ground Vehicles in High Cross Winds Part II: Unsteady Aerodynamic Forces. J. fluids Struct. 5, 91–111. doi:10.1016/0889-9746(91)80013-4
Baker, C. J. (1991c). Ground Vehicles in High Cross Winds Part III: The Interaction of Aerodynamic Forces and the Vehicle System. J. fluids Struct. 5, 221–241. doi:10.1016/0889-9746(91)90478-8
Baker, C. J., and Humphreys, N. D. (1996). Assessment of the Adequacy of Various Wind Tunnel Techniques to Obtain Aerodynamic Data for Ground Vehicles in Cross Winds. J. Wind Eng. Industrial Aerodynamics 60, 49–68. doi:10.1016/0167-6105(96)00023-2
Baker, C. J., and Reynolds, S. (1992). Wind-induced Accidents of Road Vehicles. Accid. Analysis Prev. 24, 559–575. doi:10.1016/0001-4575(92)90009-8
Blocken, C., Toparlar, Y., and Andrianne, T. (2016). Aerodynamic Benefit for a Cyclist by a Following Motorcycle. J. Wind Eng. Industrial Aerodynamics 155, 1–10. doi:10.1016/j.jweia.2016.04.008
Bruneau, C.-H., Khadra, K., and Mortazavi, I. (2017). Flow Analysis of Square-Back Simplified Vehicles in Platoon. Int. J. Heat Fluid Flow 66, 43–59. doi:10.1016/j.ijheatfluidflow.2017.05.008
Cheli, F., Belforte, P., Melzi, S., Sabbioni, E., and Tomasini, G. (2006). Numerical-experimental Approach for Evaluating Cross-Wind Aerodynamic Effects on Heavy Vehicles. Veh. Syst. Dyn. 44, 791–804. doi:10.1080/00423110600886689
Cheli, F., Corradi, R., Sabbioni, E., and Tomasini, G. (2011). Wind Tunnel Tests on Heavy Road Vehicles: Cross Wind Induced Loads-Part 1. J. Wind Eng. Industrial Aerodynamics 99, 1000–1010. doi:10.1016/j.jweia.2011.07.009
Choi, H., Lee, J., and Park, H. (2014). Aerodynamics of Heavy Vehicles. Annu. Rev. Fluid Mech. 46, 441–468. doi:10.1146/annurev-fluid-011212-140616
Coleman, S. A., and Baker, C. J. (1994). An Experimental Study of the Aerodynamic Behaviour of High Sided Lorries in Cross Winds. J. Wind Eng. Industrial Aerodynamics 53, 401–429. doi:10.1016/0167-6105(94)90093-0
Coleman, S. A., and Baker, C. J. (1990). High Sided Road Vehicles in Cross Winds. J. Wind Eng. Industrial Aerodynamics 36, 1383–1392. doi:10.1016/0167-6105(90)90134-x
Davila, A., Aramburu, E., and Freixas, A. (2013). Making the Best Out of Aerodynamics: Platoons. SAE Technical Paper 2013-01-0767. doi:10.4271/2013-01-0767
Dominy, R. G., and Ryan, A. (1999). An Improved Wind Tunnel Configuration for the Investigation of Aerodynamic Cross Wind Gust Response. SAE Trans. 108, 1564–1570. doi:10.4271/1999-01-0808
Flynn, D., Hemida, H., and Baker, C. (2016). On the Effect of Crosswinds on the Slipstream of a Freight Train and Associated Effects. J. Wind Eng. Industrial Aerodynamics 156, 14–28. doi:10.1016/j.jweia.2016.07.001
Flynn, D., Hemida, H., Soper, D., and Baker, C. (2014). Detached-eddy Simulation of the Slipstream of an Operational Freight Train. J. Wind Eng. Industrial Aerodynamics 132, 1–12. doi:10.1016/j.jweia.2014.06.016
Gallagher, M., Morden, J., Baker, C., Soper, D., Quinn, A., Hemida, H., et al. (2018). Trains in Crosswinds - Comparison of Full-Scale On-Train Measurements, Physical Model Tests and CFD Calculations. J. Wind Eng. Industrial Aerodynamics 175, 428–444. doi:10.1016/j.jweia.2018.03.002
Guilmineau, E. (2008). Computational Study of Flow Around a Simplified Car Body. J. Wind Eng. Industrial Aerodynamics 96, 1207–1217. doi:10.1016/j.jweia.2007.06.041
Hunt, J. C. R. (1988). Studying Turbulence Using Direct Numerical Simulation: 1987 Center for Turbulence Research NASA Ames/Stanford Summer Programme. J. Fluid Mech. 190, 375–392. doi:10.1017/s0022112088001363
Hargreaves, D. M., and Morvan, H. P. (2007). Towards the Validation of Crosswind Effects on a Static High-Sided Vehicle. NAFEMS Int. J. CFD Case Stud. 7, 17–31. doi:10.12989/was.2014.18.2.155
He, M., Huo, S., Hemida, H., Bourriez, F., Robertson, F. H., Soper, D., et al. (2019). Detached Eddy Simulation of a Closely Running Lorry Platoon. J. Wind Eng. Industrial Aerodynamics 193, 103956. doi:10.1016/j.jweia.2019.103956
He, M., Huo, S., Hemida, H., Soper, D., Sterling, M., and Baker, C. J. (2018). Numerical Simulations of Flow Around Ground Vehicles Running in Platoon. SAE Int. J. Commer. Veh. 5, 63–71. doi:10.4271/2012-01-0175
Hemida, H., Krajnovic, S., and Davidson, L. (2005). “Large-Eddy Simulations of the Flow Around a Simplified High-Speed Train Under the Influence of a Cross-Wind,” in 17th AIAA Computational Fluid Dynamics Conference, June 6–9, 2005 (Toronto, ON: AIAA).
Hemida, H., and Krajnović, S. (2009). Transient Simulation of the Aerodynamic Response of a Double-Deck Bus in Gusty Winds. J. Fluids Eng. 131, 031101. doi:10.1115/1.3054288
Humphreys, H., and Bevly, D. (2016). Computational Fluid Dynamic Analysis of a Generic 2 Truck Platoon. SAE Technical Paper 2016-01-8008. doi:10.4271/2016-01-8008
Issa, R. I. (1995). Rise of Total Pressure in Frictional Flow. AIAA J. 33, 772–774. doi:10.2514/3.12435
Krajnovic, S., and Davidson, L. (2005). Flow Around a Simplified Car, Part1: Large-Eddy Simulation. ASME J. Fluids Eng. 127, 907–918. doi:10.1115/1.1989371
Krajnović, S., Georgii, J., and Hemida, H. (2007). “DES of the Flow Around a High-Speed Train under the Influence of Wind Gusts,” in 7th International ERCOFTAC Symposium on Engineering Turbulence Modeling and Measurements, Limassol, Cyprus, 4 Jun 2008 (IEEE).
Launder, B. E., and Spalding, D. B. (1974). The Numerical Computation of Turbulent Flows. Comput. Methods Appl. Mech. Eng. 3, 269–289. doi:10.1016/0045-7825(74)90029-2
Le Good, G., Boardman, P., Resnick, M., and Clough, B. (2019). An Investigation of Aerodynamic Characteristics of Three Bluff Bodies in Close Longitudinal Proximity. SAE Int. J. Adv. Curr. Pract. Mobil. 3 (6), 2802–2830. doi:10.4271/2021-01-0952
Li, T., Hemida, H., Zhang, J., Rashidi, M., and Flynn, D. (2018). Comparisons of Shear Stress Transport and Detached Eddy Simulations of the Flow Around Trains. J. Fluids Eng. 140, 111108. doi:10.1115/1.4040672
Liaifar, A. (2013). LIDAR, Lasers, and Logic: Anatomy of an Autonomous Vehicle [Online]. Available: https://www.digitaltrends.com/cars/lidar-lasers-and-beefed-up-computers-the-intricate-anatomy-of-an-autonomous-vehicle/ (Accessed Feb 27, 2018).
Marcu, B., and Browand, F. (1999). Aerodynamic Forces Experienced by a 3-Vehicle Platoon in a Crosswind. SAE Technical Paper 1999-01-1324. doi:10.4271/1999-01-1324
McArthur, D., Burton, D., Thompson, M., and Sheridan, J. (2018). An Experimental Characterisation of the Wake of a Detailed Heavy Vehicle in Cross-Wind. J. Wind Eng. Industrial Aerodynamics 175, 364–375. doi:10.1016/j.jweia.2018.01.033
Mirzaei, M., and Krajnović, S. (2016). “Large Eddy Simulations of Flow Around Two Generic Vehicles in a Platoon,” in Proceedings of the 5th International Conference on Jets, Wakes and Separated Flows, Stockholm, June 15–18, 2015 (Cham: Springer International Publishing), 283–288. doi:10.1007/978-3-319-30602-5_35
Morden, J. A., Hemida, H., and Baker, C. J. (2015). Comparison of RANS and Detached Eddy Simulation Results to Wind-Tunnel Data for the Surface Pressures upon a Class 43 High-Speed Train. J. Fluids Eng. 137, 041108–0411089. doi:10.1115/1.4029261
Pagliarella, R., Watkins, S., and Tempia, A. (2007). Aerodynamic Performance of Vehicles in Platoons: The Influence of Backlight Angles. SAE Technical Paper 2007-01-1547. doi:10.4271/2007-01-1547
Perry, A. E., and Chong, M. S. (1987). A Description of Eddying Motions and Flow Patterns Using Critical-point Concepts. Annu. Rev. Fluid Mech. 19, 125–155. doi:10.1146/annurev.fl.19.010187.001013
Quinn, A. D., Sterling, M., Robertson, A. P., and Baker, C. J. (2007). An Investigation of the Wind-Induced Rolling Moment on a Commercial Vehicle in the Atmospheric Boundary Layer. Proc. Institution Mech. Eng. Part D J. Automob. Eng. 221, 1367–1379. doi:10.1243/09544070jauto537
Ryan, A., and Dominy, R. G. 1998. The Aerodynamic Forces Induced on a Passenger Vehicle in Response to a Transient Cross-Wind Gust at a Relative Incidence of 30. SAE Trans., 107, 958–966.
Robinson, C. G., and Baker, C. J. (1990). The Effect of Atmospheric Turbulence on Trains. J. Wind Eng. Industrial Aerodynamics 34, 251–272. doi:10.1016/0167-6105(90)90155-6
Soper, D. (2016). The Aerodynamics of a Container Freight Train. Springer Cham, NY: Springer. doi:10.1007/978-3-319-33279-6
Spalart, P. R., Deck, S., Shur, M. L., Squires, K. D., Strelets, M. K., and Travin, A. (2006). A New Version of Detached-Eddy Simulation, Resistant to Ambiguous Grid Densities. Theor. Comput. Fluid Dyn. 20, 181–195. doi:10.1007/s00162-006-0015-0
Sterling, M., Quinn, A. D., Hargreaves, D. M., Cheli, F., Sabbioni, E., Tomasini, G., et al. (2010). A Comparison of Different Methods to Evaluate the Wind Induced Forces on a High Sided Lorry. J. Wind Eng. Industrial Aerodynamics 98, 10–20. doi:10.1016/j.jweia.2009.08.008
Tsuei, L., and Savaş, Ö. (2001). Transient Aerodynamics of Vehicle Platoons during In-Line Oscillations. J. Wind Eng. Industrial Aerodynamics 89, 1085–1111. doi:10.1016/s0167-6105(01)00073-3
Uystepruyst, D., and Krajnović, S. (2013). LES of the Flow Around Several Cuboids in a Row. Int. J. Heat Fluid Flow 44, 414–424. doi:10.1016/j.ijheatfluidflow.2013.07.011
Veldhuizen, R., Van Raemdonck, G. M. R., and van der Krieke, J. P. (2019). Fuel Economy Improvement by Means of Two European Tractor Semi-trailer Combinations in a Platooning Formation. J. Wind Eng. Industrial Aerodynamics 188, 217–234. doi:10.1016/j.jweia.2019.03.002
Wang, S., Bell, J. R., Burton, D., Herbst, A. H., Sheridan, J., and Thompson, M. C. (2017). The Performance of Different Turbulence Models (URANS, SAS and DES) for Predicting High-Speed Train Slipstream. J. Wind Eng. Industrial Aerodynamics 165, 46–57. doi:10.1016/j.jweia.2017.03.001
Watkins, S., and Vino, G. (2008). The Effect of Vehicle Spacing on the Aerodynamics of a Representative Car Shape. J. Wind Eng. Industrial Aerodynamics 96, 1232–1239. doi:10.1016/j.jweia.2007.06.042
Keywords: CFD, DDES, platooning, High-sided lorry, Crosswind, Vehicle aerodynamics
Citation: He M, Huo S, Hemida H, Soper D, Sterling M and Baker C (2022) The Flow Around a Lorry Platoon Subject to a Crosswind—a Detached Eddy Simulation. Front. Future Transp. 3:901204. doi: 10.3389/ffutr.2022.901204
Received: 21 March 2022; Accepted: 02 May 2022;
Published: 06 June 2022.
Edited by:
Cheng Siong Chin, Newcastle University, United KingdomReviewed by:
Paolo Schito, Politecnico di Milano, ItalyZuobin Ying, City University of Macau, Macao SAR, China
Copyright © 2022 He, Huo, Hemida, Soper, Sterling and Baker. This is an open-access article distributed under the terms of the Creative Commons Attribution License (CC BY). The use, distribution or reproduction in other forums is permitted, provided the original author(s) and the copyright owner(s) are credited and that the original publication in this journal is cited, in accordance with accepted academic practice. No use, distribution or reproduction is permitted which does not comply with these terms.
*Correspondence: S. Huo, c2h1YW5yeWFuLmhAZ21haWwuY29t
†Present Address: M. He, White Collar Factory, London, United Kingdom
 M. He1†
 S. Huo
 H. Hemida
 D. Soper
 M. Sterling