 Ekant Mishra
 Krystoffer Mroz
 Bengt Pipkorn
 Nils Lubbe
94% of researchers rate our articles as excellent or good
Learn more about the work of our research integrity team to safeguard the quality of each article we publish.
Find out more
ORIGINAL RESEARCH article
Front. Future Transp., 27 June 2022
Sec. Transport Safety
Volume 3 - 2022 | https://doi.org/10.3389/ffutr.2022.883951
This article is part of the Research TopicCrash prevention and protection challenges for all road usersView all 10 articles
In high-severity crashes, occupant protection is challenging. Automated Emergency Braking (AEB) and seatbelt pre-pretensioning (PPT) are means to improve occupant protection; the purpose of this study was to quantify their effects on occupant injury risks in high-severity full-frontal crashes by Finite Element (FE) simulations. The SAFER Active average male Human Body Model was used as an occupant substitute. The crash pulses used were from separate full-frontal crash simulations using a Honda Accord FE model. The vehicle interior model comprised a seat, an instrument panel, a three-point pretensioned seatbelt system with a load-limiter of 3.1 kN force level, and a frontal passenger airbag. The effects of AEB and PPT were evaluated by simulating a 1 g pre-crash braking scenario for 0.5 s, with and without AEB, for three different PPT force levels: 0, 300, and 600 N. The impact speed of 80 km/h was reduced to 69 km/h by AEB. When neither system was activated, the predicted risk for an occupant to sustain two or more fractured ribs (NFR2+) was 100% for both 45- and 65-year-old male occupants. The risks were reduced when the AEB was activated, particularly for the 45-year-old occupant. When the AEB was activated, the risks of concussion and rib fractures were reduced; upper neck tension forces, pelvis Anterior Superior Iliac Spine (ASIS) forces, and lower extremity forces were also reduced. Increasing the PPT forces reduced the rib fracture risk further (to about 48% for a 45-year-old occupant with 600 N PPT force). The reduced speed due to AEB resulted in a lower concussion risk (from 71.3% to 31%). However, the concussion risk increased slightly with increased PPT forces.
Traffic safety continues to be a major health issue (World Health Organization, 2018). The travelling speed of a motor vehicle is a major factor influencing the probability and severity of a crash (Aarts and Van Schagen, 2006). Crash severity increases with speed: the greater the energy at impact, the more likely severe injuries to the occupants (Farmer, 2019). Crash testing that compared occupant injury risks at three crash speeds, 64, 80, and 90 km/h, illustrated that these increases in speed can have deadly consequences (Kim et al., 2021). Facial fractures and severe brain injuries were much more likely at 80 and 90 km/h compared to 64 km/h, due to contact of the head with the instrument panel (known as “strike through”) (Kim et al., 2021).
The safe speed limit for head-on collisions is considered to be 80 km/h, at least in Sweden (Eugensson et al., 2011). Beyond 80 km/h, the responsibility for ensuring safety should be on the road infrastructure design rather than the vehicle (Eugensson et al., 2011). However, as seen from crash testing, the risk of severe injuries, particularly to the head can be high at 80 km/h (Kim et al., 2021).
Avoiding collisions entirely or reducing impact speeds, two ways to reduce injury risk for vehicle occupants, can be at least partly achieved with active safety systems like Automated Emergency Braking (AEB). Low-speed AEB systems are on average estimated to decrease real-world rear-end crashes with injuries by 45% and all rear-end collisions (irrespective of injury) by about 38% (Fildes et al., 2015; Cicchino, 2017).
However, not all AEB systems are equal. Different AEB designs can differ substantially in activation logic; moreover, depending on the situation they respond to, they activate at different times (Dahl et al., 2018). Typically, the AEB activates as late as possible to still avoid a collision by braking, with further delay to account for the possibility of avoiding a collision by steering, which often is less time consuming than braking at higher speeds (Brännström et al., 2014). According to Lindman et al. (2010), the AEB systems typically brake fully (up to 1 g, only limited by road friction) after a ramp up. Situation criticality rarely requires, and the possibility of steer avoidance rarely allows for decelerations longer than 1 s; however, they are often longer than 0.5 s (Brännström et al., 2014; Spitzhüttl and Liers, 2019).
Pre-crash braking by AEB can displace occupants forward because of inertial forces (Schoeneburg et al., 2011). Even without AEB, driver-initiated evasive maneuvers (braking, steering) attempting to avoid crashes are frequent (Mages et al., 2011). As a result, occupant displacement just before the crash is common. During emergency maneuvers, occupants’ forward head excursions can reach up to 400 mm, although there is substantial variability (Reed, 2021). Excursion and deviations from the standard seating position may increase injury risks, due to altered interactions with the passive restraint systems (Mages et al., 2011; Boyle et al., 2020). Restraint systems adapting to these posture changes may prevent the likelihood of injuries (Boyle et al., 2020).
Systems such as seatbelt pre-pretensioning (PPT) can be activated in the pre-crash phase (even before any occupant movement) if an impending crash is detected in advance by environmental sensors using e.g., radar or video (Mages et al., 2011). While PPT systems tense the seatbelt and reduce belt slack in the pre-crash phase, they can even reduce the forward excursions significantly and return the occupants to their normal position (Mages et al., 2011). Moreover, reducing occupant forward displacement by pre-pretensioning in combination with the reduced impact speed due to AEB might reduce injury risks even further than AEB alone (Östh et al., 2015).
It is also important to capture the occupant response in pre-crash scenarios, since previous volunteer studies evaluating the effects of braking have determined that muscle contraction plays an important role in the forward displacement of occupants and the belt interaction forces (Ejima et al., 2007; Olafsdottir et al., 2013; van Rooij et al., 2013). Several active human body models (HBMs) exist today, Finite Element (FE) and multi-body; they employ different muscle activation strategies to reproduce the vehicle occupant pre-crash muscular response (Meijer et al., 2013; Östh et al., 2015; Devane et al., 2019). These models can predict occupant kinematics and injuries in addition to reproducing the pre-crash occupant response. The SAFER Active Human Body Model (SAFER A-HBM) is one such model, having actively controlled cervical, lumbar, and upper extremity muscles (Olafsdottir et al., 2013; Östh et al., 2015). It is an average male FE model based on the Total Human Body Model for Safety (THUMS) version 3 with updated head, neck, ribs, and lumbar spine (Kleiven, 2007; Iraeus and Pipkorn, 2019; Pipkorn et al., 2019). It has been validated for predicting whole-body kinematics, rib fractures, and concussions in frontal impacts, the most common car occupant injuries (Kleiven, 2007; Iraeus and Pipkorn, 2019; Pipkorn et al., 2019). It has also been validated for predicting pre-crash kinematics in emergency braking maneuvers with and without pre-pretensioned seatbelts by means of data from volunteer tests (Olafsdottir et al., 2013; Östh et al., 2015; Ólafsdóttir et al., 2019).
Previously, researchers have studied the combined effect of AEB and PPT on the occupant injury risks. Matsuda et al. (2018) investigated the influence of both braking and steering on the injury risks for frontal (56 km/h) and side collisions (32 km/h) using the versions 4 and 5 of the THUMS; the latter has active muscles. They also studied the effect of a pre-crash seatbelt. While they reported lower injury risks with the pre-crash seatbelt, the results with AEB but without pre-crash seatbelt were not conclusive (Matsuda et al., 2018). Östmann et al. also studied the effects of AEB and an electrical reversible seatbelt retractor (Östmann and Jakobsson, 2016). In frontal impacts with a travelling speed of 64 km/h, occupant accelerations were reduced by up to 70% due to AEB induced reduced impact speeds. However, they did not study any detailed injury criteria. Moreover, their simulations with the reversible retractor were inconclusive, as they did not terminate successfully (Östmann and Jakobsson, 2016). Saito et al. showed that increasing PPT forces led to reduced thoracic injury risk in addition to lower forward displacements in the pre-crash phase (Saito et al., 2016). However, they did not evaluate any strain-based injury risks (Saito et al., 2016). As noted, these studies either considered travelling speeds lower than the safe speed limit at 80 km/h (Eugensson et al., 2011; Östmann and Jakobsson, 2016; Matsuda et al., 2018) or did not evaluate any strain-based injury risk (Saito et al., 2016). We believe it is important to simulate travelling speeds up to 80 km/h, to develop better restraint systems to protect the occupants, as severe injuries occur at these speeds (Kim et al., 2021).
This study aimed to evaluate the effects of AEB and seatbelt PPT on the occupant injury risks and loadings in high-severity full-frontal crashes using the SAFER A-HBM.
Version 9.0.1 of the SAFER A-HBM was used to represent a passenger occupant. The SAFER A-HBM represents a 50th percentile male with a weight of 77 kg and a height of 175 cm (Robbins, 1983). It consists of approximately 127,000 solid elements, 108,000 shell elements, and 2,500 one-dimensional elements. The muscles are modelled with 1D Hill-type elements, and a closed-loop control strategy is followed for the muscle activation (Larsson et al., 2019).
The simulation matrix consisted of one driving speed, the safe speed of 80 km/h, and two different impact speeds, without AEB at 80 km/h and with AEB at 69 km/h. The crash pulses (Figure 1) were extracted from separate full-frontal crash simulations using a Honda Accord FE model, model year 2011 (Singh et al., 2016). The Honda Accord FE model has been validated for full frontal barrier test at 56 km/h and 40% offset frontal crash test at 64 km/h (Singh et al., 2016). The No_AEB+0N simulation represents driving speed and impact speeds of 80 km/h with no AEB or PPT. The simulations AEB+0N, AEB+300N, and AEB+600N represent an 80 km/h traveling speed and a 69 km/h impact speed in addition to PPT forces of 0, 300, and 600 N, respectively, as shown in Table 1. We chose a conservative, but realistic, duration of 0.5 s AEB, based on previously published data (Brännström et al., 2014; Spitzhüttl and Liers, 2019). The 1 g AEB pulse we used had a ramp up time of 0.4 s. The 69 km/h impact speed in AEB simulations was calculated based on the driving speed of 80 km/h and the 0.5 s 1 g AEB.
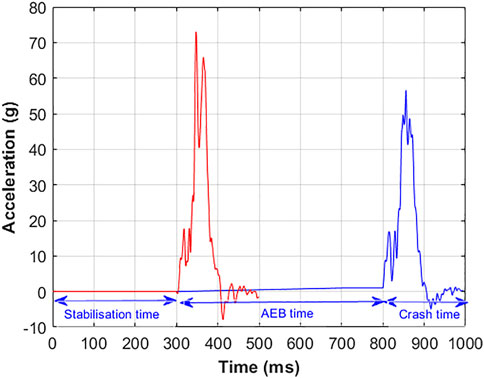
FIGURE 1. Crash and AEB pulses. The red curve represents the crash pulse for the No_AEB+0N simulation. The blue curve represents the AEB and the crash pulse for the simulations with AEB and crash phases. The first 300 ms in both curves represent the stabilization time.

TABLE 1. Simulation matrix.
The total simulation time for the No_AEB+0N simulation was 500 ms, which comprised an initial 300 ms model stabilization time (so that the SAFER A-HBM achieved equilibrium between the seat and the model and muscle activations were initialized) and a 200 ms crash phase. The total time for the simulations with AEB was 1,000 ms, which included the 500 ms pre-crash AEB duration. Both the pre-crash and the crash phases were simulated in the same run, without restarting the simulation. All the simulations were carried out using LS-DYNA explicit FE solver, double precision version R9.2.0 (LSTC, Livermore, CA, United States).
All the simulations were carried out for a belted, upright occupant seated in the passenger compartment of a midsize European car, which includes a state-of-the-art three-point seatbelt, frontal passenger airbag, and a deformable seat. The SAFER A-HBM was positioned in the FE model of the vehicle seat used in previous volunteer tests (Olafsdottir et al., 2013; Larsson et al., 2019).
The seatbelt comprises a b-pillar mounted shoulder retractor with pretensioning and load-limiting (3.1 kN) and an outboard lap belt pretensioner. The models of the shoulder retractor, lap belt pretensioner and webbing material properties, as well as the complete belt system, have been validated in-house (at both component and system levels) to match the performance of their mechanical counterparts. Validation information of the belt system is provided in the Supplementary Figure S1. The belt was routed tightly around the pelvis and chest, with the pelvis Anterior Superior Iliac spine (ASIS) points as the guiding points for the lap belt, and the shoulder belt portion crossing the middle of the sternum. The seatbelt model was used with and without a PPT at different force levels to prevent forward excursion of the SAFER A-HBM from the initial position during braking. The PPT was triggered with the onset of the AEB pulse. The retractor pretensioner and lap-belt pretensioner were activated 5 and 15 ms after crash initiation, respectively. The two different PPT force levels caused the belt to pull in about 80–110 mm of webbing. The retractor pretensioner further pulled-in between 20 and 40 mm of webbing, depending on the different simulation conditions. The belt pay-out in the No_AEB+0N condition was about 480 mm; it ranged between 340 and 370 mm for the other conditions, with more pay-out for the lower PPT force. The seatbelt pull-in and pay-out, and the shoulder and lap belt forces are shown in Supplementary Figure S3.
The airbag model was a based on a state-of-the-art frontal passenger airbag for a midsize European car, with a volume of 112 L and two ventilation holes of diameters of 45 mm. A validation of the airbag model is included in the Supplementary Figure S2. The airbag pressure was increased by reducing the ventilation hole area by 70% for all load cases, a technique that prevents a possible strike through of the head into the instrument panel (Boyle et al., 2020). The airbag was activated 14 ms after crash initiation. In the 69 km/h crash, peak in-crash airbag pressures of 47–53 kPa were measured, as shown in Figure 2. In comparison, the airbag pressure measured in an unmodified model (with normal ventilation hole areas) in a standard 56 km/h full-frontal crash is about 30 kPa, as shown in Supplementary Figure S4.
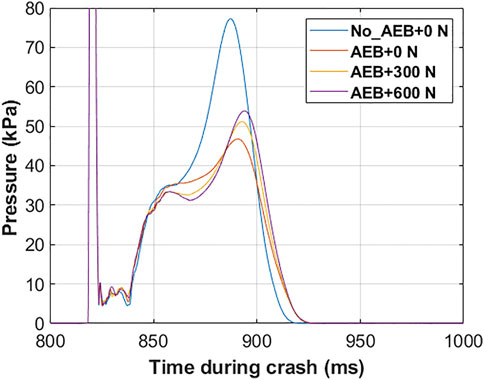
FIGURE 2. Airbag pressures for the different simulation conditions.
The maximum forward displacements for the head (head center of gravity), chest (T8), and pelvis (center of gravity H-point) relative to the vehicle displacements were compared for the different simulations.
We followed the HBM assessment criteria recommended in the SAFE-UP project to evaluate the risks of head, neck, thorax, lumbar spine, and pelvis injuries (Östling et al., 2022). The effect of AEB and PPT on the head and thorax injury risks were evaluated by comparing the AIS2 risk of concussion for an average male occupant and the AIS2+ risk of two or more fractured ribs (NFR2+) for a 45-year-old and a 65-year-old male occupant. The AIS2 concussion risk was calculated based on the maximal principal strain in the brain tissue (Kleiven, 2007). We also computed the head injury criterion (HIC15). The NFR2+ risks were estimated from the peak first principal strains in the cortical bone of each rib using a probabilistic method (Forman et al., 2012; Iraeus and Pipkorn, 2019; Pipkorn et al., 2019). The cumulative effects of AEB and PPT on head and thorax injury risks were also evaluated by calculating a joint probability of injury assuming independence of NFR2+ and AIS2 concussion risks, using the equation:
The upper neck tension forces (C1 vertebra) and lumbar spine compression forces (L1-L5 vertebrae) were measured using cross-section measurements with respect to a local coordinate system in each vertebral center (Mroz et al., 2022). For the pelvis loading, the resultant left, and right ASIS forces were measured using cross-sections on both sides of the pelvis, defined with respect to a local coordinate system (Mroz et al., 2022).
Furthermore, we also measured the resultant forces in the distal femurs and the proximal and distal tibias, as we expected leg-to-instrument panel contact. While these forces are not part of the SAFE-UP assessment criteria, they are included in the Euro NCAP frontal impact testing protocol (Euro NCAP, 2022). These forces were also measured using cross-sections of the bones (excluding soft tissues), defined with respect to a local coordinate system. The proximal and distal tibia forces were averaged. Note that the SAFER HBM is not validated to assess these cross-section force measurements. Therefore, the results should be read for trends, reduction or increases in forces, not absolute values.
Figure 3 compares the occupant forward displacements in the (A) pre-crash, and (B) crash phases. With the AEB alone, the occupant was already in a forward displaced position at the beginning of the crash phase. With increasing PPT force, the forward displacements in the pre-crash phase were reduced. However, the maximum forward displacements in the crash phase were only marginally affected by the AEB. The maximum forward pelvis and chest displacements varied negligibly with PPT. On the other hand, the maximum forward head displacement increased as PPT force increased. The head, chest, and pelvis trajectories in the XZ plane are shown in Supplementary Figure S5. The postures of the SAFER A-HBM at the beginning of the crash phase (the end of the pre-crash phase) and at the maximum forward head position during crash are shown in Supplementary Figure S6.
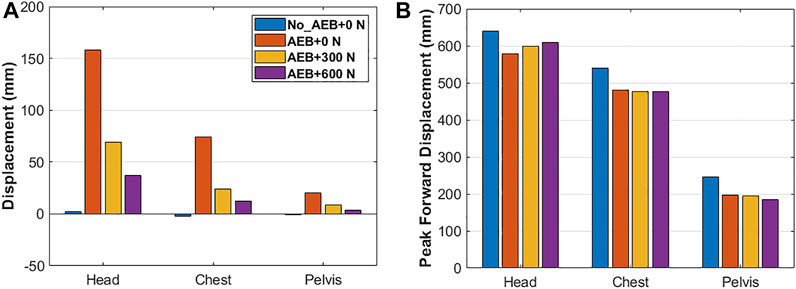
FIGURE 3. Head, chest, and pelvis forward displacements: (A) at the beginning of crash phase and (B) peak values in crash phase. Note: Y-axis scales differ.
The NFR2+ risk for both the 45-year and 65-year-old male occupants in the No_AEB+0N simulation was 100%. The risks were reduced with the AEB in the AEB+0N simulation, particularly for the 45-year-old occupant. Additionally, as shown in Figure 4, the NFR2+ risk decreased further with the increase in PPT force.
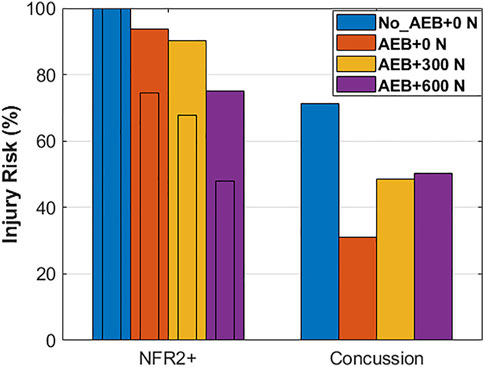
FIGURE 4. NFR2+ risk for 45-year-old (narrow bars) and 65-year-old (wide bars) male occupants, and AIS2 concussion risk for a male occupant of unspecified age.
AEB also reduced the concussion risk; the AIS2 concussion risk for the AEB+0N simulation was less than half of the No_AEB+0N simulation, as illustrated in Figure 4. However, the concussion risk increased with the increase in PPT force. The HIC15 value also increased with increase in PPT force, from 551 in the AEB+0N simulation to 1270 in the AEB+600N simulation, compared to 2610 in the No_AEB+0N simulation. The joint probability of injury calculated using Eq. 1 was lowest in the AEB+0N simulation for rib fractures for 45-year-old and concussion and in the AEB+600N simulation for rib fractures for 65-year-old and concussion.
For the other body regions, the forces in the No_AEB+0N simulation (Supplementary Table S1) were normalized to 100%. The forces in other simulations are shown as a percentage of the normalized values in Figure 5. The maximum upper neck (C1) tension force decreased to about 60% for the simulations with AEB. There was no clear trend in the upper neck tension forces as PPT force increased.
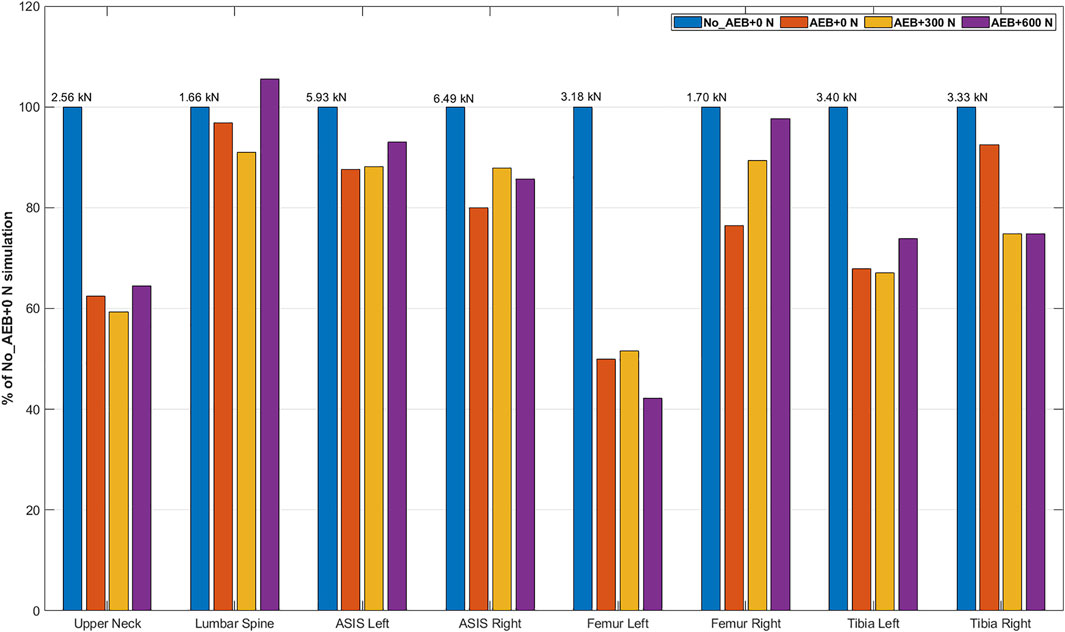
FIGURE 5. Comparison of the upper neck tension forces, lumbar spine compression forces, and ASIS, femur, and tibia resultant forces across the four simulations. The values on the top of each blue bar represent the peak forces of each body region in the No_AEB+0N simulation which were normalized to 100%.
The model-predicted maximum lumbar spine compression forces in the L1–L5 vertebrae were not affected by AEB or PPT. In all the simulations, the maximum compression force was measured in the L5 vertebra.
Resultant forces for the left and the right ASIS were lower for the AEB+0N simulation than the No_AEB+0N simulation. However, PPT force either increased or did not affect the ASIS forces.
Leg-to-instrument panel contact occurred in all the simulations. The resultant forces in the femur ranged from 1.3 to 1.7 kN for all conditions, except for 3.1 kN in the left femur in the No_AEB+0N simulation. The left tibia force in the AEB simulations were about 70% of the force in the No_AEB+0N simulation. For the right tibia, the effect of AEB was insubstantial, but some effect of PPT was seen as the forces were lower.
The sum of all percentage values across all assessments (except head and chest) comes to 800% in the No_AEB+0N, 614% in AEB_0N, 609% in AEB+300N, and 637% in AEB+600N simulations.
This study evaluated the effect of AEB and seatbelt PPT on the occupant injury risks and loadings in high-severity frontal car crashes by performing FE simulations of the SAFER A-HBM in the passenger position.
AEB reduced the AIS2 concussion and NFR2+ risks due to the reduced impact speed. The NFR2+ risk further reduced when increasing the PPT force, perhaps due to the occupant sitting in a position closer to the upright position at the beginning of the crash due to the PPT. Previous studies have shown that occupant postures due to pre-crash effects significantly influence the injury risks (Bose et al., 2008; Woitsch and Sinz, 2014). In contrast, the AIS2 concussion risk increased with increased PPT force. This is likely due to airbag interaction: higher PPT forces reduced initial displacement during the pre-crash braking and delayed the first airbag contact. The highest airbag pressures were observed for the highest PPT force, increasing linear acceleration of the head (as indicated by HIC15 values) and, in turn, brain strain and concussion risk.
The upper neck tension force decreased substantially due to the AEB-induced impact speed reduction. However, there was no considerable effect of the PPT. Neither AEB nor PPT substantially influenced lumbar spine compression. The highest loading was measured in the L5 vertebra in all the simulations. The reduced impact speed due to AEB also decreased the pelvis ASIS forces but the PPT either increased or did not affect the forces. This is likely due to the shorter pelvis frontal displacements (up to 20 mm) compared to the head and the chest (up to 160 mm and 75 mm, respectively). Even though increasing PPT forces reduced pelvis displacements in the pre-crash phase, the magnitudes and thus the effect of PPT were considerably lower to influence the pelvis ASIS forces in crash. The lap belt forces and the pelvis displacements in the crash phase followed the same trend as the pelvis ASIS forces, i.e., they were reduced due to AEB but mostly unaffected by PPT.
The leg to instrument panel contact was severe in the No_AEB+0N simulation, particularly on the left leg which explains the high forces in the left femur and left tibia. The left leg hits the glove box near its hinge, while the right leg hits near the center of the glove box. This, along with the higher severity of the No_AEB+0N simulation could explain the high forces in the left leg in the No_AEB+0N simulation. With the increase in PPT force, femur and tibia forces decrease as the leg to instrument panel contact is less severe. There is no consistent relationship between the increase in PPT force and the femur and tibia forces.
AEB was shown to substantially reduce injury risks at high impact speeds, even with an AEB duration of only 0.5 s. However, the reduced impact speed does not linearly translate to injury risk and loading reductions to all body regions as pre-crash occupant displacement and interaction with the vehicle interior and restraint systems substantially influence loading to the body regions and injury risks as well. These findings are consistent with previous studies which have also reported a mixed effect of PPT on injury risks (Saito et al., 2016; Matsuda et al., 2018). The injury reduction effect of AEB needs to be studied with an integrated safety analysis (Matsuda et al., 2018), analyzing the effect of interventions in the pre-crash and crash-phase together. Advanced occupant restraints, such as PPT, can ameliorate the effects of AEB as shown in this study and previous studies (Mages et al., 2011; Woitsch and Sinz, 2014; Östh et al., 2015).
Current crash test standards do not consider these aspects when evaluating occupant safety (Mages et al., 2011; Schoeneburg et al., 2011). Updates are needed. The current crash test standards should be adapted to an integrated active and passive safety evaluation. A first step could be to allow for pre-crash activation of restraints within existing passive safety assessment methods as already considered by Euro NCAP (Euro NCAP, 2017). Further, it has been demonstrated that speed reduction achievable by AEB can also be replicated in physical testing (Berg et al., 2011). However, current crash test dummies are not validated for pre-crash kinematics, and results of such physical testing therefore questioned. Virtual assessment with active HBM would allow seamless and biofidelic assessment of the pre-crash and crash phase. Harmonized integrated virtual assessment was developed in the OSCCAR project, a particular focus is on the validation of all components like vehicle environment, restraint systems, and HBM (Eggers et al., 2021). HBM-based assessment criteria for kinematics and injury can then be evaluated following a standardized virtual test procedure for occupant positioning, belt installation, etc. (Eggers et al., 2021).
We have analyzed the effects of AEB and PPT on occupant injury risks and loadings in high-severity crashes. However, there are limitations. The generalizability of these results can be questioned because the model represents one occupant in an upright sitting position wearing a seatbelt with no slack. The key real-world aspects regarding variability of occupants, seating postures, AEB pulses, crash pulses, restraint systems and their trigger times are important and should be considered in future studies. In particular, the effect of age and BMI should be considered as they significantly affect the head forward displacements in braking (Reed et al., 2018).
A major simplification is the increased airbag pressure by decreasing ventilation hole area to avoid strike through, as injury risks in strike-though conditions could not be evaluated with the models used. Current production airbags do not achieve such high pressures. A pressure of about 30 kPa is considered normal for a full-frontal crash at 56 km/h impact speed. Even if the effect of increasing airbag pressure on strike through has been studied before (Boyle et al., 2020), our focus in this study was not to study airbags. Other systems e.g., dual-depth airbags, adaptive airbags, or adaptive venting exist that similarly can reduce risks of strike-through and can be investigated in more detail.
The Honda Accord FE model used to extract the crash pulses has also not been validated for crashes at an impact speed of 80 km/h.
There are limitations in the HBM as well. As injury risk curves for the neck, lumbar spine, pelvis, and lower extremity were not available, only qualitative comparisons were possible.
In this study, the effects of AEB and seatbelt pre-pretensioning on the occupant injury risks and loadings at high-severity crashes were evaluated. The FE simulation results using the SAFER A-HBM show that AEB results in substantially lower rib fracture risk, lower concussion risk, lower neck forces, lower pelvis ASIS forces, and lower forces in the lower extremities. There was little effect of AEB on the lumbar spine compression forces.
Adding a PPT reduced rib fracture risk: the higher the force, the higher the reduction. PPT has negligible effect on the upper neck tension, lumbar spine compression, and pelvis ASIS forces. Moreover, there was no clear relationship between PPT force and femur and tibia forces. However, increasing PPT force increased concussion risk which can be attributed to the delayed first airbag contact.
The lowest joint injury probability for rib fractures and concussion was at 0 N PPT for 45-year-old and at 600 N PPT for 65-year-old, the lowest loading to other body regions at 300 N PPT. While variations in occupant anthropometrics, crash conditions and restraint characteristics are needed, it appears nevertheless necessary to study AEB and restraint performance not in isolation, as currently done in regulation and rating programs, but together in an integrated safety analysis.
The original contributions presented in the study are included in the article/Supplementary Material, further inquiries can be directed to the corresponding author.
EM: methodology, formal analysis, visualization, project administration, simulations, and writing—original draft. KM: methodology, formal analysis, writing—original draft, reviewing and editing. BP: conceptualization, supervision, funding acquisition, and writing—reviewing and editing. NL: conceptualization, supervision, resources, methodology, and writing—reviewing and editing. All authors contributed to the article and approved the submitted version.
This work was carried out as part of the Active Human Body Models for virtual occupant response, Step 4, and Step 5 projects, which have received funding from FFI (Strategic Vehicle Research and Innovation), by VINNOVA, the Swedish Transport Administration, the Swedish Energy Agency, and the industrial partners (Autoliv Research, Dynamore Nordic AB, and Volvo Cars).
The authors work at Autoliv Research, located in Vårgårda, Sweden. Autoliv Research is part of Autoliv (https://www.autoliv.com), a company that develops, manufactures, and sells for example protective safety systems to car manufacturers. Results from this study may impact how Autoliv choose to develop their products.
All claims expressed in this article are solely those of the authors and do not necessarily represent those of their affiliated organizations, or those of the publisher, the editors and the reviewers. Any product that may be evaluated in this article, or claim that may be made by its manufacturer, is not guaranteed or endorsed by the publisher.
The authors would like to thank our partners at SAFER—The Vehicle and Traffic Safety Centre at Chalmers, specifically Chalmers University of Technology, Dynamore Nordic AB, and Volvo Cars for their joint efforts in developing the SAFER HBM. The authors would also like to thank Dr. K. Mayberry for language revisions.
The Supplementary Material for this article can be found online at: https://www.frontiersin.org/articles/10.3389/ffutr.2022.883951/full#supplementary-material
Aarts, L., and Van Schagen, I. (2006). Driving Speed and the Risk of Road Crashes: A Review. Accid. Analysis Prev. 38, 215–224. doi:10.1016/j.aap.2005.07.004
Berg, A., Rücker, P., and Domsch, C. (2011). “Presentation and Discussion of a Crash Test Using a Car with Automatic Pre-crash Braking,” in Proceedings, ESV 2011, Gothenburg, Sweden, 11–318.
Bose, D., Crandall, J. R., Untaroiu, C. D., and Maslen, E. (2008). “Influence of Pre-collision Occupant Properties on the Injury Response during Frontal Collision,” in IRCOBI Conference, Bern, Switzerland, 135–147.
Boyle, K., Fanta, A., Reed, M. P., Fischer, K., Smith, A., Adler, A., et al. (2020). Restraint Systems Considering Occupant Diversity and Pre-crash Posture. Traffic Inj. Prev. 21, S31–S36. doi:10.1080/15389588.2021.1895989
Brännström, M., Coelingh, E., and Sjöberg, J. (2014). Decision-Making on when to Brake and when to Steer to Avoid a Collision. Int. J. Veh. Saf. 1 (7), 87–106. doi:10.1504/ijvs.2014.058243
Cicchino, J. B. (2017). Effectiveness of Forward Collision Warning and Autonomous Emergency Braking Systems in Reducing Front-To-Rear Crash Rates. Accid. Anal. Prev. 99, 142–152. doi:10.1016/j.aap.2016.11.009
Dahl, J., de Campos, G. R., Olsson, C., and Fredriksson, J. (2018). Collision Avoidance: A Literature Review on Threat-Assessment Techniques. IEEE Trans. Intell. Veh. 4, 101–113. doi:10.1109/tiv.2018.2886682
Devane, K., Johnson, D., and Gayzik, F. S. (2019). Validation of a Simplified Human Body Model in Relaxed and Braced Conditions in Low-Speed Frontal Sled Tests. Traffic Inj. Prev. 20, 832–837. doi:10.1080/15389588.2019.1655733
Eggers, A., Schießler, M., Ott, J., Peldschus, S., Mayer, C., Berger, A., et al. (2021). WP5 - Success Stories HBM Virtual Testing Procedures.
Ejima, S., Ono, K., Holcombe, S., Kaneoka, K., and Fukushima, M. (2007). “A Study on Occupant Kinematics Behaviour and Muscle Activities during Pre-impact Braking Based on Volunteer Tests,” in Proceedings of Ircobi (International Research Council on the Biomechanics of Injury) Conference 2007, Held Maastricht, the Netherlands, September 2007, 31–45.
Eugensson, A., Ivarsson, J., Lie, A., and Tingvall, C. (2011). “Cars Are Driven on Roads, Joint Visions and Modern Technologies Stress the Need for Co-operation,” in The 22nd ESV Conference, Washington, DC.
Farmer, C. M. (2019). The Effects of Higher Speed Limits on Traffic Fatalities in the United States, 1993–2017. Arlington, United States: Insurance Institute of Highway Safety.
Fildes, B., Keall, M., Bos, N., Lie, A., Page, Y., Pastor, C., et al. (2015). Effectiveness of Low Speed Autonomous Emergency Braking in Real-World Rear-End Crashes. Accid. Anal. Prev. 81, 24–29. doi:10.1016/j.aap.2015.03.029
Forman, J. L., Kent, R. W., Mroz, K., Pipkorn, B., Bostrom, O., and Segui-Gomez, M. (2012). “Predicting Rib Fracture Risk with Whole-Body Finite Element Models: Development and Preliminary Evaluation of a Probabilistic Analytical Framework,” in Annals of Advances in Automotive Medicine/Annual Scientific Conference (Association for the Advancement of Automotive Medicine), 109.
Iraeus, J., and Pipkorn, B. (2019). “Development and Validation of a Generic Finite Element Ribcage to Be Used for Strain-Based Fracture Prediction,” in Proceedings of the IRCOBI Conference, Florence, Italy, 193–210.
Kim, W., Kelley-Baker, T., Arbelaez, R., O’Malley, S., and Jensen, J. (2021). Impact of Speeds on Drivers and Vehicles–Results from Crash Tests. Arlington, United States: Insurance Institute of Highway Safety.
Kleiven, S. (2007). Predictors for Traumatic Brain Injuries Evaluated through Accident Reconstructions. Stapp car crash J. 51, 81–114. doi:10.4271/2007-22-0003
Larsson, E., Iraeus, J., Fice, J., Pipkorn, B., Jakobsson, L., Brynskog, E., et al. (2019). “Active Human Body Model Predictions Compared to Volunteer Response in Experiments with Braking, Lane Change, and Combined Manoeuvres,” in International Research Council on Biomechanics of Injury (IROCBI 2019), Florence, Italy, Sept 11–13, 349–369.
Lindman, M., Ödblom, A., Bergvall, E., Eidehall, A., Svanberg, B., and Lukaszewicz, T. (2010). Benefit Estimation Model for Pedestrian Auto Brake Functionality. Hannover: 4rd International Conference on Expert Symposium on Accident Research.
Mages, M., Seyffert, M., and Class, U. (2011). “Analysis of the Pre-crash Benefit of Reversible Belt Pre-pretensioning in Different Accident Scenarios,” in Proceedings of the 22nd ESV Conference, Washington, DC.
Matsuda, T., Yamada, K., Hayashi, S., and Kitagawa, Y. (2018). “Simulation of Occupant Posture Changes Due to Evasive Manoeuvres and Injury Predictions in Vehicle Frontal and Side Collisions,” in Annu Proc IRCOBI Conf., Athens, Greece, 512–523. IRC-18-81.
Meijer, R., Elrofai, H., Broos, J., and van Hassel, E. (2013). “Evaluation of an Active Multi-Body Human Model for Braking and Frontal Crash Events,” in Proceedings, ESV 2013, Seoul, South Korea. Washington, DC: NHTSA.
Mroz, K., Östling, M., Klug, C., Höschele, P., and Lubbe, N. (2022). Supplementing Future Occupant Safety Assessments with Severe Intersection Crashes Selected Using the SAFER Human Body Model. SAE Int. J. Transp. Saf. 10. doi:10.4271/09-10-02-0011
Ólafsdóttir, J. M., Östh, J., and Brolin, K. (2019). “Modelling Reflex Recruitment of Neck Muscles in a Finite Element Human Body Model for Simulating Omnidirectional Head Kinematics,” in IRCOBI Conference Proc., Florence, Italy, 308–323.
Olafsdottir, J. M., Östh, J., Davidsson, J., and Brolin, K. (2013). “Passenger Kinematics and Muscle Responses in Autonomous Braking Events with Standard and Reversible Pre‐tensioned Restraints,” in Ircobi Conference 2013, Gothenburg, Sweden, 602–617.
Östh, J., Brolin, K., and Bråse, D. (2015). A Human Body Model with Active Muscles for Simulation of Pretensioned Restraints in Autonomous Braking Interventions. Traffic Inj. Prev. 16, 304–313. doi:10.1080/15389588.2014.931949
Östling, M., Daddetta, G. A., Lubbe, N., Silva, J. L. d., and Zimmer, A. (2022). “Safe-Up D4.2: Architecture of Passive Safety Systems (No. D4.2),” in Proactive SAFEty Systems and Tools for a Constantly UPgrading Road Environment.
Östmann, M., and Jakobsson, L. (2016). “An Examination of Pre-crash Braking Influence on Occupant Crash Response Using an Active Human Body Model,” in Proceedings of the IRCOBI Conference, Malaga, Spain, 14–16.
Pipkorn, B., Iraeus, J., Björklund, M., Bunketorp, O., and Jakobsson, L. (2019). Multi-scale Validation of a Rib Fracture Prediction Method for Human Body Models,” in Proceedings of the IRCOBI Conference, Florence, Italy, 175–192.
Reed, M. P. (2021). The Importance of Considering Human Variability when Assessing Occupant Protection.
Reed, M. P., Ebert, S. M., Jones, M. L. H., Park, B.-K. D., Hallman, J. J., and Sherony, R. (2018). Passenger Head Kinematics in Abrupt Braking and Lane Change Events. Traffic Inj. Prev. 19, S70–S77. doi:10.1080/15389588.2018.1481957
Robbins, D. H. (1983). Anthropometric Specifications for Mid-sized Male Dummy, Volume 2, and for Small Female and Large Male Dummies. Final report. Vol. 3. Ann Arbor, Michigan: The University of Michigan Transportation Research Institute.
Saito, H., Matsushita, T., Pipkorn, B., and Boström, O. (2016). “Evaluation of Frontal Impact Restraint System in Integrated Safety Scenario Using Human Body Model with PID Controlled Active Muscles,” in Proceedings of the International Research Council on Biomechanics of Injury Conference, Malaga, Spain, 248–260.
Schoeneburg, R., Baumann, K.-H., Fehring, M., Ag, D., and Cars, M. (2011). “The Efficiency of PRE-SAFE Systems in Pre-braked Frontal Collision Situations,” in Proceedings of the 22nd ESV Conference, Washington, DC, 11–0207.
Singh, H., Kan, C.-D., Marzougui, D., Morgan, R. M., and Quong, S. (2016). Update to Future Midsize Lightweight Vehicle Findings in Response to Manufacturer Review and IIHS Small-Overlap Testing (No. Report No. DOT HS 812 237). Washington DC, USA: National Highway Traffic Safety Administration.
Spitzhüttl, F., and Liers, H. (2019). “Calculation of the Point of No Return (PONR) from Real-World Accidents,” in 26th International Technical Conference on the Enhanced Safety of Vehicles (ESV): Technology: Enabling a Safer Tomorrow, Eindhoven, Netherlands (National Highway Traffic Safety Administration).
van Rooij, L., Pauwelussen, J., den Camp, O. O., and Janssen, R. (2013). “Driver Head Displacement during (Automatic) Vehicle Braking Tests with Varying Levels of Distraction,” in 23rd ESV Conference on Enhanced Safety of Vehicles, May 27–30. Seoul, Korea: NHTSA.
Woitsch, G., and Sinz, W. (2014). Influences of Pre-crash Braking Induced Dummy–Forward Displacements on Dummy Behaviour during EuroNCAP Frontal Crashtest. Accid. Anal. Prev. 62, 268–275. doi:10.1016/j.aap.2013.10.012
Keywords: human body model, concussion, rib fracture, finite element simulations, pre-crash, crash
Citation: Mishra E, Mroz K, Pipkorn B and Lubbe N (2022) Effects of Automated Emergency Braking and Seatbelt Pre-Pretensioning on Occupant Injury Risks in High-Severity Frontal Crashes. Front. Future Transp. 3:883951. doi: 10.3389/ffutr.2022.883951
Received: 25 February 2022; Accepted: 30 May 2022;
Published: 27 June 2022.
Edited by:
Yong Han, Xiamen University of Technology, ChinaReviewed by:
Pengpeng Xu, South China University of Technology, ChinaCopyright © 2022 Mishra, Mroz, Pipkorn and Lubbe. This is an open-access article distributed under the terms of the Creative Commons Attribution License (CC BY). The use, distribution or reproduction in other forums is permitted, provided the original author(s) and the copyright owner(s) are credited and that the original publication in this journal is cited, in accordance with accepted academic practice. No use, distribution or reproduction is permitted which does not comply with these terms.
*Correspondence: Ekant Mishra, ZWthbnQubWlzaHJhQGF1dG9saXYuY29t
Disclaimer: All claims expressed in this article are solely those of the authors and do not necessarily represent those of their affiliated organizations, or those of the publisher, the editors and the reviewers. Any product that may be evaluated in this article or claim that may be made by its manufacturer is not guaranteed or endorsed by the publisher.
Research integrity at Frontiers
Learn more about the work of our research integrity team to safeguard the quality of each article we publish.