 Dimakatso Machetele
 Kowiyou Yessoufou
- Department of Geography, Environmental Management and Energy Studies, University of Johannesburg, APK campus, Johannesburg, South Africa
Globally, there are 1.35 million road fatalities every year, which are estimated to cost governments approximately US$ 518 billion, making road fatalities the eighth leading cause of death across all age groups and the leading cause of death of children and young adults. In South Africa, despite tremendous governmental efforts to curb the soaring trajectory of road crashes, the annual number of road fatalities has increased by 26% in recent years. By fitting a structural equation model (SEM) and a GARCH Model (Generalized Auto-Regressive Conditional Heteroskedasticity) to analyze and predict future trend of road crashes (number of road crashes, number of casualties, number of fatal crashes and number of persons killed) in South Africa, we propose and test a complex metamodel that integrates multiple causality relationships. We show an increasing trend of road crashes over time, a trend that is predictable by number of vehicles in the country, the population of the country and the total distance travelled by vehicles. We further show that death rate linked to road crashes is on average 23.14 deaths per 100,000 persons. Finally, in the next decade, the number of road crashes is predicted to be roughly constant at 617,253 crashes but can reach 1,896,667 crashes in the worst-case scenario. The number of casualties was also predicted to be roughly constant at 93,531 over time, although this number may reach 661,531 in the worst-case scenario. However, although the number of fatal crashes may decrease in the next decade, it is forecasted to reach 11,241 within the next 10 years with the worse scenario estimated at 19,034 within the same period. At the same time, the number of persons killed in fatal crashes is also predicted to be roughly constant at 14,739 but may also reach 172,784 in the worse scenario. Overall, the present study reveals perhaps the positive effects of government initiatives to curb road crashes and their consequences; we call for more stronger actions for a drastic reduction in road accident events in South Africa.
Introduction
Road crashes can be defined as events on the road that involve the collision of either two or more vehicles, or a vehicle and a vulnerable road user (cyclists or pedestrian), or a vehicle and a fixed object, e.g., bridge (RTMC, 2008). According to the leading road safety agency in South Africa, road crashes are classified into four categories of severity, namely: fatal crashes, major crashes, minor crashes, and damage-only crashes (RTMC, 2017). Fatal crashes result to death of one person or more; such crashes may result in serious and light injuries (RTMC, 2008). Major crashes are defined as crashes in which one person or more people are seriously injured (RTMC, 2017). Minor crashes are crashes in which one or more persons are slightly injured (RTMC, 2017) whereas damage-only crashes are crashes in which no one has been injured or killed but vehicles or property may be damaged (RTMC, 2008).
Globally, there are 1.35 million road fatalities every year, which are estimated to cost approximately US$ 518 billion to governments (WHO, 2018). Existing statistics indicate that more than 90% of road crashes are fatal in both low- and middle-income countries, and these fatal crashes often involve more than 50% of unregistered vehicles (WHO, 2009). The Global Status Report on Road Safety reported road fatalities to be the eighth leading cause of death across all age groups (Donaldson et al., 2009) and are now the leading cause of death of children and young adults aged 5–29 years (RTMC, 2019).
In response to these crashes, several initiatives have been taken by different governments across the world; however, the frequency of road crashes remains on the rise with unacceptable consequences (Benlagha and Charfeddine, 2020). For example, existing statistics indicate that more than 90% of road crashes are fatal especially in developing countries, and these fatal crashes often involve more than 50% of unregistered vehicles (WHO, 2009). The increasing ownership of vehicles is one of the major contributory factors to the rise of road fatalities and injuries in developing countries (Nantulya and Reich, 2002).
In South Africa and in the past few years, an increasing trend of road fatalities has been observed (RTMC, 2018), although the country made strides in reducing road fatalities since their peak in 2006 (ITF, 2018). The annual number of road fatalities increased every year between 2013 and 2016 (RTMC, 2017) and, between 1990 and 2017, they increased by 26% (ITF, 2018). The high number of road crashes and their associated consequences have a significant negative impact on the socioeconomic development of all South Africans (Labuschange et al., 2017). Impacts are measured in terms of loss of lives, grief and suffering as well as the heavy financial burden of road crashes on the country’s economy (Verster and Fourie, 2018). The primary underlying factors of road crashes in South Africa have been identified (Verster and Fourie, 2018). These factors are linked to vehicle (7.8%), environment and road (12%) as well as human (80%) (Verster and Fourie, 2018). In 2017 alone, the factor “vehicle” contributed 3% to road crashes in the country; environmental and road conditions 5% and human factors were responsible for 91% of road crashes (RTMC, 2018). However, still in the South African context, we still have limited understanding of the complexity of road accident events as several potential mediators of road crashes are generally not factored in the analysis of road crashes in the country. In the present study, a more complex approach is employed to analyse potential causality relationships between several variables linked to road accident events.
In the face of this alarming road accident statistics in South Africa, existing studies on road safety in the country focus mainly on identifying contributory factors, e.g., human, vehicle, and environmental factors, to road crashes (e.g., Verster and Fourie, 2018). Whilst other studies indicated that road accident events may be more complex than thought (e.g., Eboli and Mazzulla, 2007), we have limited understanding of this complexity in South Africa, owing to the simplistic approach we generally take in analysing road accident events.
The present study proposes and tests a more comprehensive metamodel (Figure 1) formulated by integrating multiple causality relationships among variables previously linked to road crashes. In the proposed theoretical metamodel, road crashes are represented by four main response variables, including total number of crashes (road crashes), total number of casualties, number of fatal crashes and number of persons killed each year. Our first prediction is that the total number of crashes would have a cascading effect on the other three main variables such that, as the total number of crashes increases over time, so too would the total number of casualties, number of fatal crashes and number of persons killed in a cascading manner.
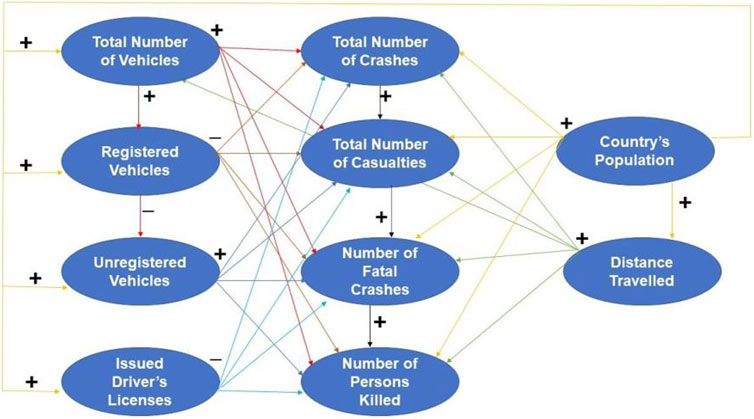
FIGURE 1. Proposed theoretical metamodel to explain road accident events in South Africa.
In addition, the metamodel includes six predictor variables. These include total number of vehicles in the country at a given year, number of registered vehicles, number of unroadworthy and unlicensed vehicles, number of driver’s license issued, the population of the country and the distance travelled by vehicles each year. Our prediction is that, as the total number of vehicles in the country increases over time, this would increase the likelihood of more crashes, which, as indicated above, would have a cascading effect on the total number of casualties, number of fatal crashes and number of persons killed (positive relationship; Figure 1). Similar to the total number of vehicles, we also predict that, if the number of unroadworthy and unlicensed vehicles increases over time, this would also increase the total number of crashes. This is grounded on the assumption that, not only the drivers of unroadworthy and unlicensed vehicles are more likely to not have a driver’s license, but their unroadworthy vehicles are more likely in a defective state conducive for road crashes. To illustrate this, Verster and Fourie (2018) reported that 7.8% of road crashes in South Africa are linked to vehicles, and in 2017 alone, the factor “vehicle” contributed 3% to road crashes in the country (RTMC, 2018). Again, an increase number of unroadworthy unregistered vehicles would thus increase the risk of more road crashes, which would have a cascading effect on the total number of casualties, number of fatal crashes and number of persons killed over time. Furthermore, we predict the increase in human population would also result in the increase in road crashes and thus the increase in total number of casualties, number of fatal crashes and number of persons killed. The rationale of this prediction is that when the population increases, the number of vehicle owners would increase such that more vehicles (both registered and unregistered) would be on the road, thus increasing the risk of road crashes. Also, when more vehicles are on the road, the total distance travelled by vehicles would increase, and this would reduce the quality and strength of the vehicles over time, and thus increasing the risk of road crashes.
As opposed to the positive relationships predicted above, we predict that the number of registered vehicles as well as the number of issued drivers’ license would cause a reduction in the number of road crashes, the total number of casualties, number of fatal crashes and number of persons killed. This is grounded in the assumption that the drivers of registered vehicles are more likely to have a driver license, and in theory, a licenced driver is relatively less likely to cause road crashes than non-licenced drivers. This leads to our last assumption, which predicts that the more driver’s licenses issued, the less likely the risk of more road crashes than the other way around. All these hypotheses/assumptions are graphically represented in Figure 1, which represents the metamodel proposed and tested to explain the complexity of road accident events in South Africa.
The aim of the study is to explain the complexity of road crashes in South Africa. The following objectives are set for the study: 1) to elucidate the temporal trends of road crashes and related consequences (number of crashes, causalities, fatal crashes, and deaths) in South Africa, 2) to propose and test a model to explain the complexity of road crashes in South Africa, 3) to predict future trends of road crashes and related consequences (number of crashes, casualties, fatal crashes, and road fatalities) in South Africa.
Materials and Methods
Study Area
The study site is South Africa, a country located right at the southern tip of the African continent (Tibane et al., 2016). South Africa stretches from 22°S to 35°S in latitude and 17°E to 33°E in longitude (Tibane et al., 2016). The country is bordered by Namibia, Zimbabwe, Mozambique, and Botswana (Thompson et al., 2019). The Atlantic Ocean and the Indian Ocean are the two coastlines found in the southwest and southeast direction, respectively. In 2019, the mid-year population was estimated at 58,78 million and approximately 51,2% (30 million) of the population is female (Stats SA, 2019).
South Africa is ranked 10th in the world in term of the volume of road network estimated at 750,000 km (Tibane et al., 2016). The South African National Road Agency (SANRAL) is responsible for 21 403 km of the national road network (Tibane et al., 2016). Out of the 21,403 km, 18 283 km (85%) are non-toll roads and 3,120 km (15%) are toll roads (DoT, 2002). SANRAL’s role is to provide effective strategic road infrastructure to assist with the development, accessibility, and finance towards the proclaimed national roads (Tibane et al., 2016). The country’s toll-road network consists of approximately 19% (3,120 km) of the national grid and SANRAL manages 1,832 km of these toll roads (DoT, 2002). In 2017, the number of registered vehicles in South Africa were 12.2 million, and the number of un-roadworthy and unlicensed vehicles had increased from 1.0 million vehicles in 2016 to 1.1 million vehicles in 2017 (RTMC, 2018). The Gauteng province accounted for approximately 40% of the registered vehicle population in the country (RTMC, 2018).
Data Collection
Various Variables for Which Data Were Collected
The variables for which data were collected are defined as follows:
• “Total number of vehicles” is the total sum of the number of registered vehicles and both the number of unroadworthy and unlicensed vehicles.
• “Number of registered vehicles” is the number of (motorised and towed) vehicles registered on the National Traffic Information System (NaTIS) (RTMC, 2018).
• “Unregistered vehicles” are vehicles which are not registered under the licensing department. The owners of unregistered vehicles might have failed to renew the vehicles’ licenses or failed to submit the vehicles for compulsory annual roadworthy tests within a certain period (RTMC, 2008).
• “The total distance travelled” variable is defined as the total distance travelled by vehicles on the road each year measured as million vehicle kilometres (mvk) (RTMC, 2018).
• “Drivers licenses issued” is the annual total number of issued driving licenses obtained by drivers after they have passed their driver’s license test (RTMC, 2019).
• “Estimated population of South Africa” is the estimate number of all residents of South Africa in a particular year (mid-year point) and based on the latest information (Stats SA, 2017).
• “Total number of crashes” is the number of road crashes (fatal, major, or minor crashes) that occurred in each year (RTMC, 2018).
• “Fatal crashes” are crashes that result to death of one person or more people in a road accident (RTMC, 2018).
• “Number of casualties” is the number of people that have been injured and/or killed in a crash (RTMC, 2019).
• “Fatalities” is defined as person or people that are killed during or immediately after a road accident, or death within 30 days after the accident has occurred as a direct result of the road accident (RTMC, 2019).
Sources of Data Analysed in This Study
Data analysed in the present study are retrieved from various sources. These sources include the Government’s online campaign database known as Arrive Alive (www.arrivealive.co.za), various reports of the Road Traffic Management Corporation (RTMC, 2006; RTMC, 2007; RTMC, 2011; RTMC, 2012; RTMC, 2013; RTMC, 2014; RTMC, 2015; RTMC, 2016; RTMC, 2017; RTMC, 2018) as well as reports from Statistics SA (Stats SA, 1995; Stats SA, 2008; Stats SA, 2009; Stats SA, 2010; Stats SA, 2011; Stats SA, 2012; Stats SA, 2013; Stats SA, 2014; Stats SA, 2015; Stats SA, 2016; Stats SA, 2017). Data from Arrive Alive (period of 1935–2000) was obtained by email request. The data from the RTMC (period of 1935–2017) was obtained from the corporation’s website; and the data from Statistics SA (period of 1936–2017) was retrieved from their website as well as by email request.
How were Data Collected by Various Sources?
Arrive Alive is the South African government’s campaign to promote road safety and public awareness. They make use of data from both the RTMC and Stats SA and compile their reports for public use or research. The RTMC is the leading agency on road safety and management (RTMC, 2018). They collect their data from the South African Police Service (SAPS), Provisional Traffic Authorities and the Metropolitan Municipalities through Accident Report and Quick Response forms (RTMC, 2015). The Accident Report forms are used to capture data for all road accident types (injuries and damages) while the Quick Response forms are used to record fatal road crashes and are captured by RTMC. Furthermore, the RTMC makes use of other data sources such as the Culpable Homicide Crash: Observation Report (CHoCOR) form, CAS Analyst Report, National Traffic Information System (NaTIS), Statistics South Africa (Stats SA) (RTMC, 2018). The limitation to the methodology the RTMC used to collect their data is that road traffic information on their reports are mainly based on fatal crashes only (RTMC, 2018). While reporting and capturing road accident, data sometimes are duplicated (RTMC, 2013). The process of verifying the data is a lengthy process, which involves comparing the initial data that was received from various police stations at the time of the crash with that received from the central SAPS database (RTMC, 2013). Another limitation is that the consolidated inputs from provinces may not be received on time during the period of data collection for the specific report (RTMC, 2013). There is still a need for the leading road traffic agency to conduct in-depth research to collect scientific based facts to complement their administrative data (RTMC, 2018).
Statistics South Africa (Stats SA) is the national statistical service of South Africa (Stats SA, 2019). For their mid-year population estimates of South Africa, they make use of the cohort-component method (Stats SA, 2007). In the cohort-component methodology, a base population is estimated that is consistent with the known demographic characteristics of the country (Stats SA, 2017). The mid-year population estimates are produced by making use of the Spectrum model developed by the Future Group alongside with UNAIDS, WHO and UNICEF (Stats SA, 2013). In 2011, Stats SA made use of census for population estimate. Census is a procedure used to collect basic information on the population and housing statistics of a country for socioeconomic development, creation, and the implementation of policies (Stats SA, 2012). South Africa has conducted three Censuses (1996, 2001 and 2011) (Stats SA, 2012). In addition, Stats SA follows the standards of the International Monetary Fund’s (IMF) Special Data Dissemination Standard (SDDS) to publish the mid-year population estimates annually (Stas SA, 2007). The limitation with the methodology Stats SA applies to collect data on the mid-year population estimates for South Africa is that the estimates may change as new data becomes available (Stats SA, 2017). The population estimates are accompanied by a series of revised estimates from the period of 2002–2017 (Stats SA, 2017).
Data Analysis
All analyses were done in R Development Core Team (2017), and R script used is provided as supplemental information.
Despite the efforts deployed to consult as many sources as possible, there are still some missing values in the dataset. Traditionally, prior to analysis, most statistical packages use listwise deletion to remove entire rows that have missing values; this practice leads to the loss of information sometimes critical for the understanding of the research question at hand or the hypothesis to be tested. To retrieve the information encapsulated in missing values in order to generate a comprehensive dataset, missing values have been imputed. This imputation was done as implemented in the R package Amelia (Honaker et al., 2011). Five different imputations were done concurrently on different computers and then combined in a single dataset. The means of those five imputed data were used for the analysis. The complete dataset is presented in Supplementary Table S1. In addition, during the analysis, because variables are not in the same scale (e.g., population in million vs. fatal crashes in hundred), variables were first re-scaled as follows: scaled variable = (observed-mean)/standard deviation.
To test the adequacy of the proposed metamodel to explain the complexity of road crashes in South Africa, a structural equation model (SEM) was fitted to the imputed data collected. Structural equation modelling (SEM) is a multivariate and powerful technique used to test and evaluate multivariate causal relationships (Fan, 2016). The benefits of an SEM is that various causal relationships can be defined and tested simultaneously in one SEM. Each of the relationships or paths in the SEM was translated into GLM models (Generalized Linear Model) with appropriate error structure, depending on the nature of the response variable.
In the present study, four main response variables were defined. These variables include total number of crashes, total number of casualties, number of fatal crashes and number of persons killed. These variables are all “count data”, meaning that the appropriate link function to specify in model fitting is “negative binomial” (O’Hara and Kotze 2010), given that count data should not be log-transformed (O’Hara and Kotze 2010). Six explanatory variables were defined: total number of vehicles, number of registered vehicles, number of unroadworthy and unlicensed vehicles, number of issued drivers’ licenses, population of the country and vehicle distance travelled. Since most of the response variables in the metamodel are “count data” except the variable “distance travelled”, the negative binomial GLM was fitted. GLM model with quasi-poison error family was appropriate to model “count data” but to avoid overdispersion the negative binomial GLM was better fitted as demonstrated by O’Hara and Kotze (2010). The GLM model was fitted to model the variable “distance travelled” rather by specifying the Gaussian family of error. All the GLM models were then combined in SEM which was fitted as implemented in the R library piecewiseSEM (Lefcheck, 2016). The adequacy of the metamodel was tested based on its overall Goodness-of-fit (C value) and the p value. C values are an indicator of whether an SEM is good enough to explain the data. To tell if an SEM is good enough, the lower the C value the better. Another key parameter of the goodness-of-fit is the p-value of the test of goodness-of-fit. The p-value here tests whether the proposed SEM is different from the best fit to the data at hand. If p < 0.05, this means that the proposed SEM is significantly different from the best fit and therefore should be rejected; if p > 0.05, this means that the SEM is no different from the best fit to the data and therefore can be used to explain the data (Schermelleh-Engel et al., 2003; Lefcheck 2016).
Prior to all these analyses, multicollinearity among predicting variables are first tested. Unlike in simple regressions, there is no straightforward way to deal with the problem of multicollinearity in SEM. Some authors even argue that multicollinearity is not an issue in SEM (e.g., Maruyama 1998; Malhotra et al., 1999; Verbeke and Bagozzi 2000). This is based on the ground that “if highly correlated variables can be regarded as indicators of a common underlying construct, multicollinearity problems can be avoided” (Grewal et al., 2004). Other authors argued that multicollinearity is a source of unreliable estimates of SEM parameters (e.g., Jagpal 1982; Grapentine 2000; Tarka 2018). There is no doubt that multicollinearity poses a problem in parameter estimates but the problem is particularly complex with SEM for the simple reason that, in SEM, an independent variable in one of the models that form the SEM can be a response variable in another model within the same SEM and vice versa.
In the present study, the following is how the multicollinearity problem was dealt with. For each of the models in the SEM, the variance inflation factor (VIF) was calculated in R and predicting variables with VIF > 5 (rules of thumb) were considered as highly collinear. Then, using the stepwise selection techniques, collinear variables were removed from the model starting from the variable with the highest VIF. After removing a collinear variable, the model is rerun, and the goodness-of-fit and p values calculated. This stepwise selection was repeated until the model is made up of only variables with VIF < 5. This process was followed for all the nine models that form the SEM. At the end, the SEM was reconstructed using only models with non-collinear variables and then was rerun. The AIC value for this SEM is: AIC = 1,788.486. The global goodness-of-fit for this SEM in which no model contains collinear variables is as follow: Fisher’s C = 1,718.486 with p-value = 0 on 56 degrees of freedom. For any SEM, p > 0.05 means the SEM is of a good fit for the data while p < 0.05 means that the SEM departs significantly from the data analysed (Lefcheck 2016). In the present case, p = 0, meaning that the SEM with only non-collinear variables could not be used to explain the data.
In that case, we started bringing back (into each of the models in the SEM) each of the variables initially removed from the model because of collinearity. In this case, only missing variables that show significant relationships with each response variable in the SEM were brought back into the model, but this was done using one missing variable at a time (stepwise process). Each time, the goodness-of-fit and p value were calculated. It is only when all significant variables were brought back into the SEM that an SEM with p > 0.05 was found, indicating that a suitable SEM to explain the data is found.
Furthermore, the R2 for each of the models in the SEM was calculated in scenario 1 where only non-collinear variables were included, and in scenario 2 where the final SEM is constructed with all previously missing but significant variables. This is summarized in Supplementary Table S2. In this table, R2 values do not change substantially in SEM with collinear variables in comparison with SEM without collinear variables, except for variable “driver licence”. This means that, although missing variables share similar information with other variables in each of the models in the SEM (that is why they are collinear), they also bear unique or complementary information (that is why it is only when they are added to the SEM that an SEM with p > 0.05 is found). These findings support our inclusion of all significant missing variables into the SEM.
The future of road accident in the country was predicted by fitting the Generalized Autoregressive Conditional Heteroskedasticity (GARCH) to the time-series data collected (Supplementary Table S1). GARCH model was selected to account for the expected high volatility of the variance in the time-series data of road accident (Bollerslev, 1986). The key assumption behind GARCH model is that variance is volatile or is not constant over time in a time series dataset. To test that this assumption is met, the Dickey-Fuller test (Fuller 1976) was run to test the null hypothesis that a unit root is present in an autoregressive model of each of the time series data, and that the process is thus not stationary (non-constant variance over time). The results confirm the null hypothesis, i.e., p > 0.05 for each response variable (fatal crashes, p = 0.20; persons killed, p = 0.09; casualties, p = 0.51 and crashes, p = 0.99), thus justifying the use of GARCH in this study. GARCH model was fitted as implemented in the R library rugarch (Ghalanos, 2020). Different variances of GARCH models were fitted depending on the starting time intervals for the modelling. The best GARCH model was selected using Akaike Information Criteria (AIC). This model was used to forecast future of road crashes in the next 10 years. Predicted values for each variable are presented in Supplementary Tables S3–S6.
Results
Temporal Trends of Road Crashes and Related Consequences
The data analysed include missing values for some of the variables; these missing values represent 20% of all values across all variables, i.e., 80% of all values are present in the dataset (Supplementary Figure S1). For further analysis, the missing values have been imputed such that the findings reported below are based on a complete dataset (i.e., without missing values). The descriptive statistics of all data are summarized in Supplementary Table S7. The analysis shows that the number of crashes increases steadily over time since 1935 but exhibits important variations from the year 2000 (Figure 2). A similar trend is found for the number of casualties, and interestingly, there are always less casualties than crashes (Figure 2): roughly 32% of crashes on average results in casualties (Supplementary Table S1).
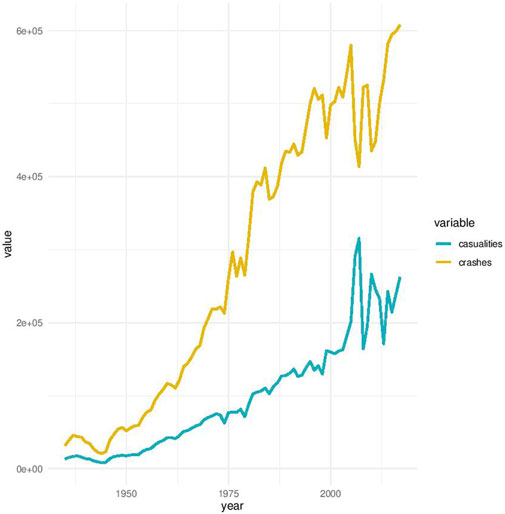
FIGURE 2. Trends in number of crashes (road crashes) and casualties over the period 1935–2017 covered in this study.
Some of these crashes are fatal, and as can be expected from the patterns in Figure 3, the number of fatal crashes and the number of persons killed in fatal crashes increase too over time with a sharp increase from the year 2000. Unfortunately, there have always been more deaths (persons killed) than the number of fatal crashes (Figure 3) such that, on average, the number of persons killed represents 1.15 times the number of fatal crashes and 0.03 times the total annual number of road crashes (Supplementary Table S1).

FIGURE 3. Trends in number of fatal crashes and number of persons killed over the period 1935–2017 covered in this study.
The death rate follows a polynomial shape (Figure 4) whose trend line follows the equation: y = −0.0114x2+1.2378x−2.2627 (R2 = 0.76) with y = death rate and x = year. This trend can be broken down into four noticeable periods (Figure 4): between 1935 and 1938, the death rate per 100,000 people increased from 6 to 9.5; from 1938 to 1945, there is a decrease from 9.5 to 4.18; the 1945–1972 period witnessed an exponential increase from 4.18 to 37.88 deaths per 100,000 people; this sharp increase has been slowing down since 1972 until 2017 where it decreased from 37.88 to 24.85 and reached the lowest rate of 19.60 in the year 2000 (Figure 4). These trends result in an average death rate of 23.14 deaths per 100,000 people.
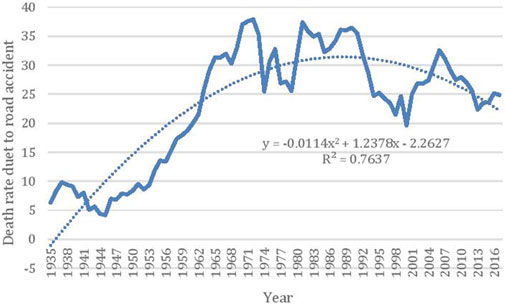
FIGURE 4. Trends in the death rate due to road accident. Death rate is estimated over 100,000 people.
Understand the Complexity of Road Crashes in South Africa
Structural Equation Model of Road Crashes
The metamodel represented in Figure 1 was tested. The following parameters of the metamodel suggest that the metamodel is suitable to explain the complexity of the mechanism driving road crashes: Fisher’s C = 3.895 with p-value = 0.143 on 2 degrees of freedom.
The coefficients of each of the models in the metamodel are summarized in Table 1. This Table shows that the number of crashes could significantly be explained by total number of vehicles (β = −0.32 ± 0.06, p < 0.001), number of registered vehicles (β = 1.76 ± 0.12, p < 0.001), number of unregistered vehicles (β = 0.14 ± 0.04, p = 0.003) and the population of the country (β = −0.88 ± 0.13, p < 0.001). As opposed to expectation, the number of driver licences issued, and total distance travelled by vehicles do not correlate significantly with number of crashes (p > 0.05).
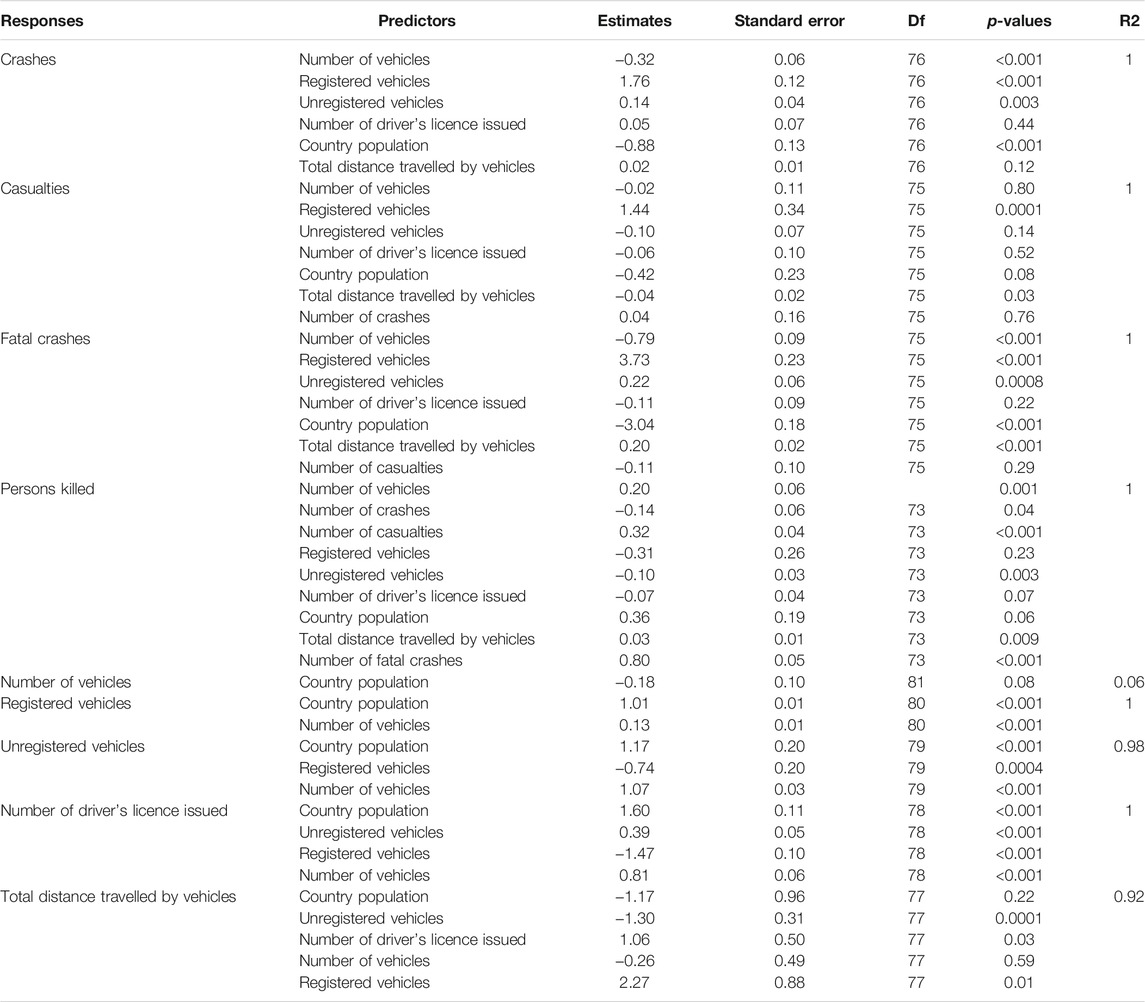
TABLE 1. Coefficients of the structural equation model fit to the dataset analysed in the present study.
Furthermore, the analysis reveals that the number of casualties could be linked significantly to number of registered vehicles (β = 1.44 ± 0.0.34, p < 0.001) and total distance travelled by vehicles (β = −0.04 ± 0.02, p = 0.03). None of the other variables tested correlates significantly with number of casualties (p > 0.05).
As of the number of fatal crashes, the analysis reveals that the total number of vehicles (β = −0.79 ± 0.09, p < 0.001), number of registered (β = 3.73 ± 0.23, p < 0.001) and unregistered vehicles (β = 0.22 ± 0.06, p < 0.001), the population of the country (β = -3.04 ± 0.18, p < 0.001) and the total distance travelled by vehicles (β = 0.20 ± 0.02, p < 0.001) correlate significantly with the number of fatal crashes. However, the number of casualties and again the number of driver licence do not seem to determine the number of fatal crashes (p > 0.05).
Finally, the findings of the SEM analysis reveal that the total number of vehicles (β = 0.20 ± 0.06, p = 0.0017), number of unregistered vehicles (β = −0.10 ± 0.03, p = 0.003), number of crashes (β = −0.14 ± 0.06, p = 0.04), number of casualties (β = 0.32 ± 0.04, p < 0.001), distance travelled (β = 0.03 ± 0.01, p = 0.009) and obviously the number fatal crashes (β = 0.80 ± 0.05, p < 0.001) are significant determinant of the number of persons killed in road crashes (Table 4.1).
Expected Trends of Road Crashes for the Future
Using the GARCH model, the future of road crashes was predicted. The number of crashes or crashes is predicted to be roughly constant over time at 617,253 crashes for the next 10 years, with the worse scenario suggesting that this number may reach 1,896,667 (Figure 5A). The number of casualties was also predicted to be roughly constant at 93,531 over time although this number may reach 661,531 in the worst-case scenario (Figure 5B). However, although the number of fatal crashes may decrease over time, it is forecasted to reach 11,241 fatal crashes within the next 10 years with the worse scenario estimated at 19,034 within the same period (Figure 5C). Finally, the number of persons killed is also predicted to be roughly constant at 14,739 but may also reach 172,784 in the worse scenario (Figure 5D).
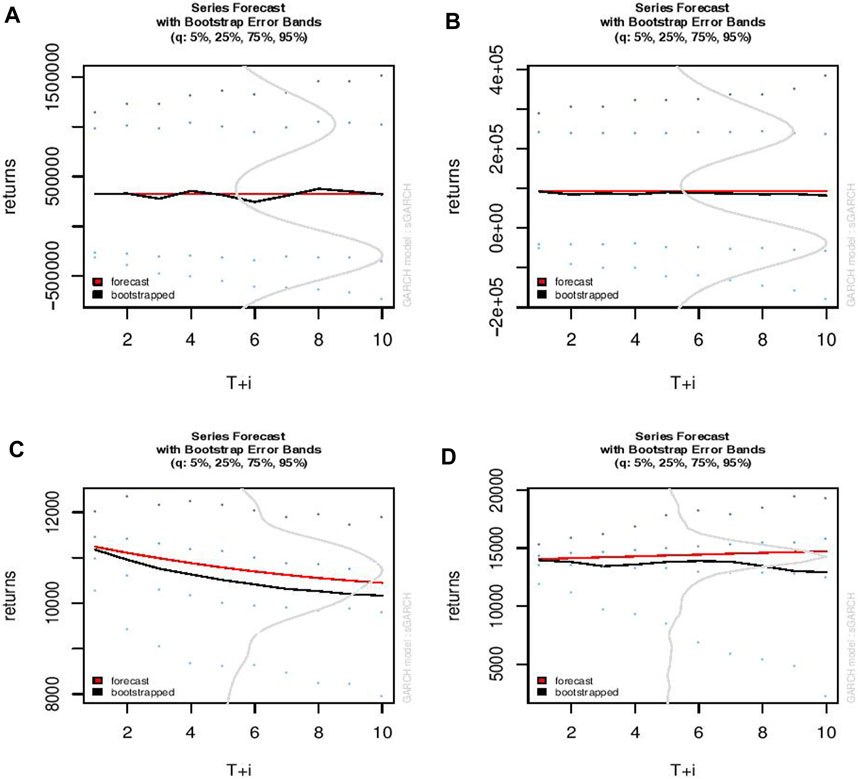
FIGURE 5. Prediction of the trends of road crashes and its consequences for the next 10 years in South Africa using GARCH model. (A) = number of crashes (road crashes), (B) = number of casualties, (C) = number of fatal crashes and (D) = number of persons killed.
Discussion
Temporal Trajectory of Road Crashes in South Africa
Over the 82 years (1935–2017) period covered in this study, the findings reveal an increasing trend in number of reported road crashes, casualties, fatal crashes, and deaths. The study also reveals that, unfortunately, 32% of crashes lead to casualties, and when these are fatal, the ratio persons killed: fatal crashes (referred to as accident severity rate in Verster and Fourie, 2018) is 1.15. In their recent study, Verster and Fourie (2018) estimated the severity rate at 1,2–1,3 between 2010 and 2015, a rate similar to what is revealed in the present study, although our present study covers a longer period of time than theirs. In any case, these findings suggest that, overall, in any fatal accident in South Africa, more than 1 person lose their lives. Verster and Fourie’s (2018) further showed that the severity rate is not uniform within a week, with the highest severity rates (1.22–1.25) found for Mondays, Fridays, Saturdays, and Sundays (South African Department of Transport, 2015; Verster and Fourie, 2018).
However, the number of road crashes fluctuated more notably from the year 2000 onward, resulting into a sharp increase of fatal crashes and the number of persons killed from the year 2000. This corresponds to a post-apartheid era where vehicle ownership started increasing in the country, which may account for the sharp increase that we observed in fatal crashes and persons killed. Furthermore, this year 2000 corresponds to the period where 75% of road crashes recorded in South Africa were linked to drivers driving under the influence of alcohol (Ncube et al., 2016). In 2000, the cost of road traffic crashes in South Africa was estimated at R13.8 billion (US$2 billion) (Ministry of Transport, 2001). South Africa is the world leading country in drunk driving followed by Canada and the US (McCarhy, 2016). The number of drunk drivers has increased by four times since 1980. It is therefore not surprising that we observe the notable fluctuations of road accident occurrence as well as the increase in fatal crashes and number of persons killed from 2000 onward. Surprisingly, it is in the same year 2000 that the lowest death rate of 19.60 was observed. This implies that the increase in fatal crashes did not result in high death rate after correcting for population size.
Specifically, the death rate increased drastically from 6 death per 100,000 persons in 1935–37.88 deaths per 100,000 people in 1972 before it decreased gradually to 24.8. This trend or shape of reverse curve is seems to be a global trend as it is reported in several parts of the world, including Australia, Poland, China, etc. (Borsos et al., 2012; Al-Madani 2018; WHO, 2018). Efforts need to be continuously deployed to maintain this decreasing trend because, after a long period of safety improvement, the risky behaviours leading to the re-increase in the number of road crashes may occur again (Bąk et al., 2019) as predicted in the behavioural theory (Wilde, 1988).
The overall trend found in the present study is similar to the one reported, also for South Africa, by WHO (2009), WHO (2018), which identified four key points in the trajectory of death rate. They reported that, from 1972 to 1992, the death rate fluctuated within a window of 25–40 deaths/100,000 people. They also indicated that this rate decreased to 20 death/100,000 people from 1992 to 2002, and then increased again to 35 deaths/100,000 people from 2002 to 2007 before it decreases to 21 death/100,000 people from 2007 to 2013 and then a slight increase to the present day. The similarity between the WHO’s trend and what is reported in the present study suggests that the data imputation done in the present study did not cause significant bias in the data analysed.
On average, the study reveals a death rate of 23.14 deaths per 100,000 people. This death rate is lower than that reported for low-income countries (27.5 deaths per 100,000 population) and for the African continent (26 deaths/100,000; WHO, 2018) but is similar to what is reported for Brazil in the last 10 years (WHO, 2018). However, it is three times the rate reported (8.3 deaths per 100,000 population) for developed world (WHO, 2018) and 4-times the 6 deaths/100,000 rate reported for Australia (Mooren et al., 2011). In this developed world, the death rate has been slowing down since the 1960s: 27% decrease in the US and 63% decline in Canada from 1975 to 1988 while an increase was noted in developing countries (an increase by 44% in Malaysia and 243% in China; Kopits and Cropper, 2003). Although we are losing globally 1,35 million people annually owing to road crashes, the youth (5–29 years old; WHO, 2019) is disproportionately the most affected. The consequences of these losses are significant: heavy deterioration of standard of living for family (Silcok, 2003), the loss of 1–2% of the gross national product of developing countries (Peden and Hyder, 2002). To South Africa, it costs 3.4% of its GDP (South African Department of Transport, 2016). This is unaffordable in a country where basic service delivery to community is still a problem, and therefore calls for vigorous actions. These actions may include enforcement of seat belt safety laws, enforcement of speed limits, and strict and unapologetic punishment for drunk driving.
The Proposed Metamodel for Road Crashes in South Africa and Future Trends
The parameters of the metamodel tested show that the metamodel in Figure 1 is suitable to explain the complexity of the mechanism driving road crashes. As predicted in the theoretical framework in Figure 1, the number of crashes is indeed predicted by the total number of vehicles but contrary to prediction, the relationship is negative. This negative relationship means that the increase in the number of vehicles do not lead to the increase in the number of crashes but the later actually decreases. This may imply that, while the number of vehicles is increasing, these vehicles may be in majority good roadworthy cars driven by licenced and careful drivers such that this increase in the number of cars does not result in an increase in crashes. For the next 10 years, the GARCH model employed in this study predicted a roughly constant number of crashes or road crashes (617,253 crashes), but this number may triple, in the worst-case scenario, reaching 1,896,667. This calls for vigorous actions against the worst scenario.
Similarly, the results of this study show a negative relationship between the population of the country and the number of crashes. The initial expectation is that the increase in human population would also result in the increase in road crashes (Al-Reesi et al., 2013). The rationale for this is that when the population increases, the number of vehicle owners would increase such that more vehicles (both registered and unregistered) would be on the road, thus increasing the risk of road crashes. Also, when more vehicles are on the road, the distance travelled by vehicles would increase, and this would reduce the quality and strength of the vehicles over time, and thus increasing the risk of road crashes. However, the total distance travelled by vehicles does not correlate significantly with number of crashes, discounting the importance of this variable. The finding reported in the present study matches what has been found for other countries, such as United Kingdom where, in the last 30-years, although the population size has grown by 15%, road fatalities have fallen by 68% (Department for Transport, 2015).
The counterintuitive finding of negative relationships between number of population and number of crashes could mean that the increase in population is followed by an increase in careful and licenced drivers. However, the part of the explanation linked to driver’s licence is discounted by the finding that, as opposed to expectation, the number of driver licences issued does not correlate significantly with number of crashes, putting into question the contribution of driver’s licences to good driving behaviour on the road. In Botswana, unlicensed drivers, or failure to produce a licence are found to correlate significantly to road fatalities (Mphela, 2011). Interestingly, matching the theoretical prediction, the number of crashes increases when the number of both registered and unregistered vehicles also increases. A potential explanation is that, irrespective of whether vehicles are registered or unregistered, too many vehicles on the road predisposes to an increase of the likelihood of crashes. Unregistered vehicles are likely to be unroadworthy and faulty; vehicle roadworthiness was reported as a major contributing factor to road crashes (Bayam et al., 2005; Verster and Fourie, 2018; WHO, 2018). Verster and Fourie (2018) reported that 7.8% of road crashes in South Africa are linked to vehicles, and in 2017 alone, the factor “vehicle” contributed 3% to road crashes in the country (RTMC, 2018).
Furthermore, as predicted for number of crashes, the expectation is also that the number of casualties would correlate positively and significantly with all six predictors analysed in the study. The findings in this study reveal that the number of casualties indeed correlate positively and significantly but with only the number of registered vehicles and negatively with total distance travelled by vehicles. The positive relationship is an indication that, as the number of registered vehicles increases, more vehicles are on the road, heightening the risk of crashes thus casualties. The negative relationship between casualties and distance travelled is unexpected and means that more vehicles on the road do not increase road casualties. Again, the GARCH model predict a roughly constant number of casualties for the next 10 years (93,531) but this may increase 6-fold in the worst-case scenario.
As expected, the analysis reveals that the total number of vehicles, number of registered and unregistered vehicles, the population of the country and the total distance travelled by vehicles correlate each significantly with the number of fatal crashes. However, the number of vehicles and the population of the country which were predicted to correlate positively with the number of fatal crashes show instead negative correlations. This is in contrast with the reports from other studies that reported the positive relationships predicted in the theoretical metamodel in the present study (Jacobs and Cutting, 1986; Aderamo, 2012). The contrasting findings in the present study mean that, as the total number of vehicles and the country’s population size increase, the number of fatal crashes decreases.
On a global scale, Jacobs and Aeron-Thomas (2000) predicted the road fatalities to reach between 900,000 and 1.1 million in 2010 and between 1 million and 1.3 million in 2020. For the next 10 years, the GARCH model predicted a decreasing trend of the number of fatal crashes, but this number may reach 11,241–19,034 in South Africa. Again, the observed decrease in fatal crashes is unexpected and could imply that one or more key variables that decrease the number of fatal crashes while the total number of vehicles and population size are increasing are not taken into consideration in the proposed metamodel in the present study. An example of such variable could be road policy enforcement or improvement, improvement of drivers’ consciousness or behaviour that may cause a decline in the frequency of fatal crashes (Shaw and McMartin, 1977; Farmer et al., 1997; Deffenbacher et al., 2002; Delen et al., 2006; Papantoniou et al., 2019; Sârbescu and Maracatu, 2019). Further variables, focused on the drivers’ characteristics such as age, gender, driving experience, the roadway length (for different road grades), the economic development, and education level that are not considered in the present study may be important too as reported in previous studies (Bayam et al., 2005; Eboli and Mazulla 2007; Papantoniou et al., 2019; Papantoniou et al., 2018). Additional factors that may be linked to road crashes but not included in our model are alcohol, seat belts, speed, fatigue, and red-light running as potential behavioral variables (Wegman et al., 2013), while Vanderschuren et al. (2020) emphasized the importance of examining infrastructure effects or pedestrian fatality trends. Nevertheless, several studies called for road crashes to be regarded as more driven by a failure of a system and not just of a person (the driver) (Reason, 2000). In that system is a complex of interactive factors and an accident is the consequence of a failure of the interactions (Reason, 2000; Bayam et al., 2005; Eboli and Mazulla, 2007; Aderamo, 2012; Hassan and Abdel-Aty, 2013, Bergel-Hayat et al., 2013; Theofilatos, 2017; Lee, et al., 2018; Verster and Fourie 2018; Papantoniou et al., 2019; Papantoniou et al., 2018).
In the present study, six interactive factors/predictors are tested as linked to road crashes and their effects (casualties, fatal crashes, number of persons killed, etc.). Counterintuitively, the number of casualties and the number of driver licences do not correlate significantly with the number of fatal crashes. The lack of significant correlation between number of casualties and number of fatal crashes disproves the cascading effects initially predicted in Figure 1, implying that an increase in road casualties does not necessarily lead to an increase in road fatalities. Again, this could be linked to a potential improvement of drivers’ consciousness or behaviour on the road. The lack of correlation between the number of drivers’ licence issued and number of fatal crashes dismiss the initial prediction that an increase in number of licences issued should mirror an improvement of driving behaviour or experience (da Silva et al., 2014) and thus limit the number of crashes/crashes and all inherent consequences (e.g., fatalities). This finding may not be that surprising given the corruption around driver’s licence delivery (Arrive Alive, 2020).
Finally, as expected, the total number of vehicles correlate significantly and positively with the number of persons killed: more cars mean high risk of fatalities. One relationship not predicted in Figure 1 is the positive significant correlation found between number of casualties and number of persons killed. In the predicted theoretical metamodel, it was suggested an indirect link between number of casualties and number of persons killed but mediated by number of fatal crashes. The analysis reveals instead a direct link between number of casualties and number of persons killed and reported above there is no significant link between number of casualties and number of fatal crashes. Overall, the finding here means that an increase in number of casualties may heighten the risk of more persons killed without necessarily increasing the number of fatal crashes. Similar positive and significant links were found between distance travelled on one hand and number of fatal crashes on the other with the number of persons killed. The link between distance travelled and number of persons killed were predicted in Figure 1 and means that more cars on the road increases the likelihood of more persons killed in case of road crashes. The positive significant link between number of fatal crashes and number of persons killed goes without saying. Surprisingly, while the number of unregistered vehicles increases, the number of persons killed decreases and similar relationship is found for the link between total crashes and persons killed. As indicated above, there must have been important variables (e.g., improvement in road enforcement, drivers behaviours, etc.) that are not included in the metamodel tested in the present study and which are the basis for the counter-intuitive relationships found in the present study. A constant pattern is predicted for the next 10-years using the GARCH model but could fluctuate between 14,739 and 172,784. In the Mthatha area in South Africa, Meel (2008) predicted 57 road death/100,000; if this rate is generalized to the total population of the country, this would be equivalent to 34,200 road deaths annually, well contained within the 14,739–172,784 range identified in the present study. For Africa, Al-Madani (2018) predicted the number of crash death to range between 87 640 and 126 000 during the 2014–2025 period. Our model’s predictions show the contribution of South Africa to the crash death predicted for the entire continent by Al-Madani (2018), and also reveal that the worst-case scenario (172 784 crash death) predicted for South Africa alone may even surpass the prediction for Africa. This calls for vigorous actions to avoid this scenario.
Based on the findings of the present study revealing significant correlations between vehicles and various road accident events, we recommend the following:
- Limit the usage of vehicles on the road. This can be done: by promoting a safe public transport system to reduce drastically the number of vehicles on the roads. This is based on our finding that the number of crashes correlate positively and significantly with the number of registered vehicles.
- Vehicles that are not registered should be impounded by traffic officers. This is based on our finding that the number of crashes correlates positively and significantly with the number of unregistered vehicles. We suggest that legal provisions must be made towards a harsh punishment of drivers of unregistered vehicles, e.g., jail time or heavy financial penalties.
- Reinforcing road traffic measures such as seat belt law enforcement, severe penalties for reckless and drunk drivers and speed control. This is based on our finding that the number of crashes correlates negatively with the country’s population. The number of crashes decreases when country’s population increases. This suggests that population growth and vehicle ownership do not increase at the same rate such that the increase in population may not lead to the increase in car ownership, and this, in conjunction with road traffic measures in place, may lead to the decrease in road crashes.
- Old vehicles must be removed from the road. This is based on our finding that “total distance travelled by vehicles” correlates positively and significantly with the “number of fatal crashes”. This means that the Traffic Department must set a threshold for kilometrage above which vehicles must not be allowed on the road. This requires a scientific study to identify such threshold. However, this removal must not be done systematically since some old cars may still be roadworthy. We suggest that the decision to remove or not must be based on not only the mileage but also the roadworthiness of the car.
- Identifying and promoting measures that are working successfully in reducing the number of fatalities in road accident, e.g., promoting seat belt, strict check-up of roadworthiness, severe punishment of drunk drivers. This has to be done by the traffic department. This is grounded on our finding that the number of persons killed correlates negatively with the number of crashes. That the number of persons killed in road crashes decreases with more crashes is unexpected. The finding may imply that not all crashes are fatal but also measures could have been taken so that there are less and less death in most crashes. Government’s Arrive Alive Road-Safety Campaign (https://www.arrivealive.co.za/) should be intensified. Emergency services should respond quicker to calls of road crashes in order to make it on time at an accident scene to save lives.
Potential Limitations of the Study
There are some debates around road accident data sources and their reliability (Joseph, 2013). A number of studies make use of two data sources (Benlagha and Charfeddine, 2020). The first data source includes police-recorded data (Manner and Wünsch-Ziegler, 2013; Feng et al., 2016; Lee et al., 2018). The second data source is insurance companies (Krishnan and Carnahan, 1985; Mills and Hambly, 2011). The debates emanate from the mismatch between both sources in term of data provided. For example, 1 out of 5 road deaths is reported by police in the Philippines (WHO, 1996). In Indonesia, police report 40% less road deaths than insurance companies (Lu et al., 1999). Even in China, the Beijing Research Institute of Traffic Engineering (Liren, 1996) estimated that the actual number of people killed in road crashes was over 40% more than the number reported by the police. In term of reliability of data, several studies suggest that insurance companies are more reliable than police-recorded data, given that, not only they are always informed once an accident occurs (fatal accident or not), but also given the professional way (unlike government officials; Joseph 2013) they handle data collection (Cohen, 2005; and; González Dan et al., 2017).
Another limitation is that our model did not take into account the fact that vehicle design has changed significantly since 1935, as have occupant protection measures and vehicle speeds. There is no doubt that these changes have important impact on the trends of road crashes. With these improvements in design and occupant protection measures, the impact to expect in the future is reduction in road crashes and consequences. However, given that this is what our model predictions show, this perhaps implies that our models may have captured this future improvement in design and safety measures. In the present study, a multiple-source approach was used as presented in the Methodology to minimize the influence of potential inconsistency in data reported in various sources(World Health Organisation, 2011; WHO, 2013; WHO, 2015).
Data Availability Statement
The original contributions presented in the study are included in the article/Supplementary Material, further inquiries can be directed to the corresponding author. All supplemental materials including the R script used can be found at: https://github.com/kowiyou/Kowiyou
Author Contributions
Conceptualization, KY and DM; methodology, KY; software, KY; validation, KY; formal analysis, KY; investigation, KY; resources, DM; data curation, DM; writing—original draft preparation, KY; writing—review and editing, KY; visualization, KY; supervision, KY; project administration, DM and KY; funding acquisition, DM and KY. All authors have read and agreed to the published version of the manuscript.
Funding
This research was funded partially by the National Research Foundation (NRF) South Africa, grant number 112113 to KY. DM benefited from the same funding as registration fee for her MSc programme.
Conflict of Interest
The authors declare that the research was conducted in the absence of any commercial or financial relationships that could be construed as a potential conflict of interest.
Publisher’s Note
All claims expressed in this article are solely those of the authors and do not necessarily represent those of their affiliated organizations, or those of the publisher, the editors and the reviewers. Any product that may be evaluated in this article, or claim that may be made by its manufacturer, is not guaranteed or endorsed by the publisher.
Acknowledgments
We acknowledged all who contributed to make data available as well as the University of Johannesburg for logistics. We also thank two reviewers who provided valuable comments that improve the initial version of this manuscript.
Supplementary Material
The Supplementary Material for this article can be found online at: https://www.frontiersin.org/articles/10.3389/ffutr.2021.760640/full#supplementary-material
References
Aderamo, A. J. (2012). Assessing the Trends in Road Traffic Accident Casualties on Nigerian Roads. J. Soc. Sci. 31, 19–25. doi:10.1080/09718923.2012.11893011
Al-Madani, H. M. N. (2018). Global Road Fatality Trends' Estimations Based on Country-wise Micro Level Data. Accid. Anal. Prev. 111, 297–310. doi:10.1016/j.aap.2017.11.035
Al-Reesi, H., Ganguly, S. S., Al-Adawi, S., Laflamme, L., Hasselberg, M., and Al-Maniri, A. (2013). Economic Growth, Motorization, and Road Traffic Injuries in the Sultanate of Oman, 1985-2009. Traffic Inj. Prev. 14, 322–328. doi:10.1080/15389588.2012.694088
Alive, Arrive. (2020). Corruption, Traffic Enforcement and Road Safety. Available at: https://www.arrivealive.mobi/corruption-traffic-enforcement-and-road-safety, (Accessed on September 02, 2020).
Bayam, E., Liebowitz, J., and Agresti, W. (2005). Older Drivers and Accidents: A Meta Analysis and Data Mining Application on Traffic Accident Data. Expert Syst. Appl. 29, 598–629. doi:10.1016/j.eswa.2005.04.025
Benlagha, N., and Charfeddine, L. (2020). Risk Factors of Road Accident Severity and the Development of a New System for Prevention: New Insights from China. Accid. Anal. Prev. 136, 105411–105415. doi:10.1016/j.aap.2019.105411
Bergel-Hayat, R., Debbarh, M., Antoniou, C., and Yannis, G. (2013). Explaining the Road Accident Risk: Weather Effects. Accid. Anal. Prev. 60, 456–465. doi:10.1016/j.aap.2013.03.006
Bollerslev, T. (1986). Generalized Autoregressive Conditional Heteroskedasticity. J. Econom. 31, 307–327. doi:10.1016/0304-4076(86)90063-1
Borsos, A., Koren, C. S., Ivan, J. N., and Ravishanker, N. “Long-term Safety Trends Related to Vehicle Ownership in 26 Countries”, in Proceedings of the Paper presented at: Annual Meeting of the Transportation Research Board, Washington, DC, USA, January 22–26 .
Bąk, I., Cheba, K., and Szczecińka, B. (2019). The Statistical Analysis of Road Traffic in Cities of Poland. Transportation Res. Proced. 39, 14–23.
Cohen, A. (2005). Asymmetric Information and Learning: Evidence from the Automobile Insurance Market. Rev. Econ. Stat. 87, 197–207. doi:10.1162/0034653053970294
Deffenbacher, J. L., Lynch, R. S., Oetting, E. R., and Swaim, R. C. (2002). The Driving Anger Expression Inventory: A Measure of How People Express Their Anger on the Road. Behav. Res. Ther. 40, 717–737. doi:10.1016/s0005-7967(01)00063-8
Delen, D., Sharda, R., and Bessonov, M. (2006). Identifying Significant Predictors of Injury Severity in Traffic Accidents Using a Series of Artificial Neural Networks. Accid. Anal. Prev. 38, 434–444. doi:10.1016/j.aap.2005.06.024
Department for Transport, (2015). Reported Road Casualties, Great Britain: 2015 Annual Report. Available at: https://assets.publishing.service.gov.uk/government/uploads/system/uploads/attachment_data/file/556406/rrcgb2015-02.pdf(Accessed on September 2, 2020).
Donaldson, L. H., Brooke, K., and Faux, S. G. (2009). Orthopaedic Trauma from Road Crashes: Is Enough Being Done? Aust. Health Rev. 33, 72–84. doi:10.1071/ah090072
Eboli, L., and Mazzulla, G. “A Structural Equation Model for Road Accident Analysis,” in Proceedings of the 4th International SIIV Congress, Palermo, 12-14 September 2007 (Palermo, Italy: University of Calabria).
Fan, Y., Chen, J., Shirkey, G., John, R., Wu, S. R., Park, H., et al. (2016). Applications of Structural Equation Modeling (SEM) in Ecological Studies: An Updated Review. Ecol. Process. 5, 19. doi:10.1186/s13717-016-0063-3
Farmer, C. M., Braver, E. R., and Mitter, E. L. (1997). Two-Vehicle Side Impact Crashes: The Relationship of Vehicle and Crash Characteristics to Injury Severity. Accid. Anal. Prev. 29, 399–406. doi:10.1016/s0001-4575(97)00006-7
Feng, S., Li, Z., Ci, Y., and Zhang, G. (2016). Risk Factors Affecting Fatal Bus Accident Severity: Their Impact on Different Types of Bus Drivers. Accid. Anal. Prev. 86, 29–39. doi:10.1016/j.aap.2015.09.025
Fuller, W. A. (1976). Introduction to Statistical Time Series. New York: John Wiley & Sons. ISBN 0-471-28715-6.
Ghalanos, A. (2020). Package ‘rugarch’ Version 1.4-4. Available at https://bitbucket.org/alexiosg, (Accessed on September 16, 2020).
González Dan, J. R., Arnaldos, J., and Darbra, R. M. (2017). Introduction of the Human Factor in the Estimation of Accident Frequencies through Fuzzy Logic. Saf. Sci. 97, 134–143. doi:10.1016/j.ssci.2015.08.012
Grapentine, T. (2000). Path Analysis vs. Structural Equation Modeling. Marketing Res. 12 (3), 12–20.
Grewal, R., Cote, J. A., and Baumgartner, H. (2004). Multicollinearity and Measurement Error in Structural Equation Models: Implications for Theory Testing. Marketing Sci. 23, 519–529. doi:10.1287/mksc.1040.0070
Hassan, H. M., and Abdel-Aty, M. A. (2013). Predicting Reduced Visibility Related Crashes on Freeways Using Real-Time Traffic Flow Data. J. Saf. Res. 45, 29–36. doi:10.1016/j.jsr.2012.12.004
Honaker, J., King, G., and Blackwell, M. (2011). Amelia II: A Program for Missing Data. J. Stat. Softw. 45 (7), 1–47. doi:10.18637/jss.v045.i07
ITF (International Transport Forum) (2018). Road Safety Annual Report 2018: South Africa. East Jerusalem.
Jacobs, G., Aeron-Thomas, A., and Astrop, A. (2000). “Estimating Global Road Fatalities”,. TRL Report 445.
Jacobs, G. D., and Cutting, C. A. (1986). Further Research on Accident Rates in Developing Countries. Accid. Anal. Prev. 18, 119–127. doi:10.1016/0001-4575(86)90056-4
Jagpal, H. S. (1982). Multicollinearity in Structural Equation Models with Unobservable Variables. J. Marketing Res. 19, 431–439. doi:10.1177/002224378201900405
Joseph, R. (2013). Who Are South Africa’s Worst Drivers? the Truth Doesn’t Lie in the Data. Africa Check. Available at: https://africacheck.org/2013/07/04/who-are-south-africas-worst-drivers-the-truthisnt-in-the-data/, (Accessed on January 12, 2018).
Kopits, E., and Cropper, M. (2003). Traffic Fatalities and Economic Growth. The World Bank, Policy Research Working Paper No. 3035 (Washington, DC: World Bank).
Krishnan, K. S., and Carnahan, J. V. (1985). Analysis of the Effect of Car Size on Accident Injury Probability Using Automobile Insurance Data. Accid. Anal. Prev. 17, 171–177. doi:10.1016/0001-4575(85)90019-3
Labuschange, F., De Beer, E., Roux, D., and Venter, K. “The Cost of Crashes in South Africa 2016”, in Proceedings of the 36th Southern African Transport Conference (SATC 2017), Pretoria, South Africa, July 2017. Conference Partners.
Lee, J., Chae, J., Yoon, T., and Yang, H. (2018). Traffic Accident Severity Analysis with Rain-Related Factors Using Structural Equation Modeling - A Case Study of Seoul City. Accid. Anal. Prev. 112, 1–10. doi:10.1016/j.aap.2017.12.013
Lefcheck, J. S. (2016). PiecewiseSEM : Piecewise Structural Equation Modelling in R for Ecology, Evolution, and Systematics. Methods Ecol. Evol. 7, 573–579. doi:10.1111/2041-210x.12512
Liren, D. (1996). Viewing China Road Traffic Safety and the Counter Measures in Accordance with International Comparison, Proceedings of the Second Conference in Asian Road Safety, Beijing, 28-31 October 1996, Beijing: Beijing Research in Traffic Engineering.
Lu, T. H., Chou, M. C., and Lee, M. C. (1999). Regional Mortality from Motor Vehicle Traffic Injury: Relationships Among Place-Of-Occurrence, Place-Of-Death, and Place-Of-Residence. Accid. Anal. Prev. 32 (2000), 65–69. doi:10.1016/s0001-4575(99)00051-2
Malhotra, N. K., Peterson, M., and Kleiser, S. B. (1999). Marketing Research: A State-Of-The-Art Review and Directions for the Twenty-First Century. J. Acad. Marketing Sci. 27 (2), 160–183. doi:10.1177/0092070399272004
Manner, H., and Wünsch-Ziegler, L. (2013). Analyzing the Severity of Accidents on the German Autobahn. Accid. Anal. Prev. 57, 40–48. doi:10.1016/j.aap.2013.03.022
McCarthy, N. (2016). The Worst Countries in the World for Drunk Driving (Infographic). Available at: https://blogs-images.forbes.com/niallmccarthy/files/2016/08/20160709_Drunk_Driving.jpg(Accessed on August 11, 2016).
Meel, B. L. (2008). Fatal Road Traffic Crashes in the Mthatha Area of South Africa, 1993 – 2004. South Afr. Med. J. 98, 716–719.
Mills, B. N., Andrey, J., and Hambly, D. (2011). Analysis of Precipitation-Related Motor Vehicle Collision and Injury Risk Using Insurance and Police Record Information for Winnipeg, Canada. J. Saf. Res. 42, 383–390. doi:10.1016/j.jsr.2011.08.004
Ministry of Transport (2001). The Road to Safety 2001-2005: Building the Foundations of a Safe and Secure Road Traffic Environment in South Africa. Available at: http://www.transport.gov.za/projects/index.html(Accessed on June 12, 2006).
Mooren, L., Grzebieta, R., and Job, S. “Safe System – Comparisons of This Approach in Australia”, in Proceedings of the Australasian College of Road Safety Conference, Melbourne, VIC, Australia, September 2011.
Mphela, T. (2011). The Impact of Traffic Law Enforcement on Road Accident Fatalities in Botswana. J. Transport Supply Chain Management 5, 264–277. doi:10.4102/jtscm.v5i1.77
Nantulya, V. M., and Reich, M. R. (2002). The Neglected Epidemic: Road Traffic Injuries in Developing Countries. Br. Med. J. 324, 1139–1141. doi:10.1136/bmj.324.7346.1139
Ncube Cheteni, P. P., and Sindiyandiya, K. (2016). Road Crashes Fatalities Trends and Safety Management in South Africa. Probl. Perspect. Management 14, 627–633.
O’Hara, R. B., and Kotze, D. J. (2010). Do Not Log-Transform Count Data. Methods Ecol. Evol. 1, 118–122.
Papantoniou, P., Antoniou, C., Yannis, G., and Pavlou, D. (2018). Which Factors Affect Accident Probability at Unexpected Incidents? A Structural Equation Model Approach. J. Transportation Saf. Security 11, 544–561. doi:10.1080/19439962.2018.1447523
Papantoniou, P., Yannis, G., and Christofa, E. (2019). Which Factors Lead to Driving Errors? A Structural Equation Model Analysis through a Driving Simulator Experiment. IATSS Res. 43, 44–50. doi:10.1016/j.iatssr.2018.09.003
Peden, M., and Hyder, A. A. (2002). Road Traffic Injuries Are a Global Public Health Problem. Br. Med. J. 324, 1153. doi:10.1136/bmj.324.7346.1153
Reason, J. (2000). Human Error: Models and Management. Br. Med. J. 320, 768–770. doi:10.1136/bmj.320.7237.768
RTMC (Road Traffic Management Corporation) (2008). 2007 Road Traffic Report on Number of Registered, Un-roadworthy and Un-licenced Vehicles, Driving Licences and PrDPs and Fatal Crashes and Fatalities. Pretoria East: Road Traffic Management Corporation.
RTMC (Road Traffic Management Corporation) (2019). Parow: Violence, Injury and Peace Research Unit SAMRC Alcohol and its Implications for Road Traffic Crashes in South Africa Phase A- Review; Pretoria East: Road Traffic Management Corporation.
RTMC (Road Traffic Management Corporation) (2007). Interim Road Traffic and Fatal Crash Report for the Year 2006. Pretoria East: Road Traffic Management Corporation.
RTMC (Road Traffic Management Corporation) (2016). Road Traffic Calendar Report 1 January- 31 December 2015. Pretoria East: Road Traffic Management Corporation.
RTMC (Road Traffic Management Corporation) (2017). Road Traffic Calendar Report 1 January-31 December 2016. Pretoria East: Road Traffic Management Corporation.
RTMC (Road Traffic Management Corporation) (2013). Road Traffic Calendar Report 31 December 2012. Pretoria East: Road Traffic Management Corporation.
RTMC (Road Traffic Management Corporation) (2014). Road Traffic Calendar Report 31 December 2013. Pretoria East: Road Traffic Management Corporation.
RTMC (Road Traffic Management Corporation) (2015). Road Traffic Calendar Report 31 December 2014. Pretoria East: Road Traffic Management Corporation.
RTMC (Road Traffic Management Corporation) (2011). Road Traffic Report 31 December 2010. Pretoria East: Road Traffic Management Corporation.
RTMC (Road Traffic Management Corporation) (2018). State of Road Safety Report: January-December 2017. Pretoria: Department of Transport.
RTMC (Road Traffic Management Corporation) (2012). Traffic Calendar Report 31 December 2011. Pretoria East: Road Traffic Management Corporation.
RTMC (Road Traffic Management Corporation) (2006). Year 2005 Traffic Report. Pretoria East: Road Traffic Management Corporation.
Sârbescu, P., and Maricuţoiu, L. (2019). Are You a "bad Driver" All the Time? Insights from a Weekly Diary Study on Personality and Dangerous Driving Behavior. J. Res. Personal. 80, 30–37. doi:10.1016/j.jrp.2019.04.003
Schermelleh-Engel, K., Moosbrugger, H., and Müller, H. (2003). Evaluating the Fit of Structural Equation Models: Tests of Significance and Descriptive Goodness-Of-Fit Measures. Methods Psychol. Res. 8, 23–74.
Shaw, J. I., and McMartin, J. A. (1977). Personal and Situational Determinants of Attribution of Responsibility for an Accident. Hum. Relations 30, 95–107. doi:10.1177/001872677703000106
Silcok, B. R. (2003). Guidelines for Estimating the Costs of Road Crashes in Developing Countries. London: U.K. Department for International Development.
Silva, F. P. d., Santos, J. A., and Meireles, A. (2014). Road Accident: Driver Behaviour, Learning and Driving Task. Proced. - Soc. Behav. Sci. 162, 300–309. doi:10.1016/j.sbspro.2014.12.211
Stats SA (Statistics South Africa) (2012). Census 2011. Pretoria: Department of Statistics South Africa.
Stats SA (Statistics South Africa) (2007). Mid-Year Population Estimates 2007. Pretoria: Department of Statistics South Africa.
Stats SA (Statistics South Africa) (2008). Mid-Year Population Estimates 2008. Pretoria: Department of Statistics South Africa.
Stats SA (Statistics South Africa) (2010). Mid-Year Population Estimates 2010. Pretoria: Department of Statistics South Africa.
Stats SA (Statistics South Africa) (2013). Mid-Year Population Estimates 2013. Pretoria: Department of Statistics South Africa.
Stats SA (Statistics South Africa) (2014). Mid-Year Population Estimates 2014. Pretoria: Department of Statistics South Africa.
Stats SA (Statistics South Africa) (2015). Mid-Year Population Estimates 2015. Pretoria: Department of Statistics South Africa.
Stats SA (Statistics South Africa) (2017). Mid-Year Population Estimates 2017. Pretoria: Department of Statistics South Africa.
Stats SA (Statistics South Africa) (2019). Mid-Year Population Estimates 2019. Pretoria: Department of Statistics South Africa.
Stats SA (Statistics South Africa) (2009). South African Statistics, 2009. Pretoria: Department of Statistics South Africa.
Stats SA (Statistics South Africa) (1995). Suid-Afrikaanse Statistieke- South African Statistics. Pretoria: Department of Statistics South Africa.
Tarka, P. (2018). An Overview of Structural Equation Modeling: its Beginnings, Historical Development, Usefulness and Controversies in the Social Sciences. Qual. Quant 52, 313–354. doi:10.1007/s11135-017-0469-8
Theofilatos, A. (2017). Incorporating Real-Time Traffic and Weather Data to Explore Road Accident Likelihood and Severity in Urban Arterials. J. Saf. Res. 61, 9–21. doi:10.1016/j.jsr.2017.02.003
Thompson, L., Bundy, C., Lowe, C., Mabin, A., Vigne, R., and Gordon, D. (2019). South Africa. Available at: https://www.britannica.com/place/South-Africa(Accessed on September 15, 2019).
Tibane, E., Lentsoane, N., Honwane, M., and Kraamwinkel, J. (2016). South Africa Yearbook 2015/2016. Pretoria: Government Communications (GCIS).
Vanderschuren, M., Arendse, M., Lane-Visser, T., and Janmohammed, A. (2020). Combatting the Road Safety Burden in the Developing World: The Case of South Africa. Transportation Res. Proced. 48, 1174–1184. doi:10.1016/j.trpro.2020.08.141
Verbeke, W., and Bagozzi, R. P. (2000). Sales Call Anxiety: Exploring what it Means when Fear Rules a Sales Encounter. J. Marketing 64, 88–101. doi:10.1509/jmkg.64.3.88.18032
Verster, T., and Fourie, E. (2018). The Good, the Bad and the Ugly of South African Fatal Road Crashes. South Afr. J. Sci. 114, 63–69. doi:10.17159/sajs.2018/20170427
Wegman, F., Schermers, G., and van Schagen, I. (2013). Towards a National Road Safety Strategy for South Africa. The Netherlands: SWOV Institute for Road Safety Research, 65.
WHO (World Health Organisation) (2013). Global Status Report on Road Safety 2013: Supporting a Decade of Action. Geneva: The World Health Organization.
WHO (World Health Organisation) (2015). Global Status Report on Road Safety 2015. Geneva: The World Health Organisation.
WHO (World Health Organisation) (2018). Global Status Report on Road Safety 2018. Geneva: The World Health Organisation.
WHO (World Health Organisation) (2009). Global Status Report on Road Safety: Time for Action. Geneva: World Health Organisation.
WHO (World Health Organisation) (2019). Road Traffic Injuries. Available at: https://www.who.int/newsroom/fact-sheets/detail/road-traffic-injuries(Accessed on September 21, 2019).
Wilde, G. J. S. (1988). Risk Homeostasis Theory and Traffic Accidents: Propositions, Deductions and Discussion of Dissension in Recent Reactions. Ergonomics 31, 441–468. doi:10.1080/00140138808966691
World Health Organisation (WHO) (2011). Global Plan for the Decade of Action for Road Safety 2011-2020. Available at: https://www.who.int/roadsafety/decade_of_action/plan/plan_english.pdf?ua=1.
Keywords: road crashes, fatalities, casualties, persons killed in road crashes, GARCH model, South Africa
Citation: Machetele D and Yessoufou K (2021) A Decade Long Slowdown in Road Crashes and Inherent Consequences Predicted for South Africa. Front. Future Transp. 2:760640. doi: 10.3389/ffutr.2021.760640
Received: 18 August 2021; Accepted: 24 September 2021;
Published: 03 November 2021.
Edited by:
Bingbing Nie, Tsinghua University, ChinaReviewed by:
Wesley Kumfer, University of North Carolina at Chapel Hill, United StatesJie Wang, Changsha University of Science and Technology, China
Copyright © 2021 Machetele and Yessoufou. This is an open-access article distributed under the terms of the Creative Commons Attribution License (CC BY). The use, distribution or reproduction in other forums is permitted, provided the original author(s) and the copyright owner(s) are credited and that the original publication in this journal is cited, in accordance with accepted academic practice. No use, distribution or reproduction is permitted which does not comply with these terms.
*Correspondence: Kowiyou Yessoufou, a293aXlvdXlAdWouYWMuemE=