 Yadav Sapkota
 Jacob F. Berkowitz
 Camille L. Stagg
 Ryan R. Busby
- 1Environmental Laboratory, U.S. Army Engineer Research and Development Center, Vicksburg, MS, United States
- 2U.S. Geological Survey, Wetland and Aquatic Research Center, Lafayette, LA, United States
- 3Construction Engineering Research Laboratory, U.S. Army Engineer Research and Development Center, Champaign, IL, United States
Freshwater forested wetlands account for ~76% (918 M ha) of the total global wetland extent. However, freshwater forested wetlands are difficult to distinguish from upland forest due to canopy coverage, the abundance of wetland-nonwetland mosaics, seasonal hydropatterns, and fewer readily observable connections to large surface water bodies relative to marshes and other emergent habitats. Therefore, freshwater forested wetland ecosystems are often misclassified as upland forests in carbon accounting models, underestimating soil organic carbon (SOC) storage. This study highlights freshwater forested wetland SOC accounting challenges and presents SOC densities/stocks from a global literature synthesis across different freshwater forested wetland types. We reviewed 374 forested wetland articles, compiling and calculating carbon densities by depth from 90 freshwater forested wetland studies to construct a database of 334 study sites including nine countries. The median (± median absolute deviation) SOC stock was 91.2 ± 46.4 Mg C ha−1 and 235.3 ± 125.6 Mg C ha−1 in the top 30 cm and 100 cm of soil, respectively. The tidal freshwater forested wetland had highest SOC stock (341.6 ± 98.4 Mg C ha−1) in the upper 100 cm soil profile followed by rainforest (285.6 ± 75.8 Mg C ha−1), non-tidal swamps (229.3 ± 120.4 Mg C ha−1), and floodplain forested wetlands (176.6 ± 84 Mg C ha−1). Within the conterminous United States forest type groups, the Tsuga/Picea group had the highest median SOC stocks (353.6 ± 82.9 Mg ha−1) in the top 100 cm of soil followed by Quercus/Pinus (246.6 ± 82.3 Mg ha−1) and Quercus/Liquidambar/Taxodium (207.9 ± 87.7 Mg ha−1) groups, likely driven by variability in litter degradability, wetland hydroperiod, geomorphic positions, and regional climatic factors. This literature synthesis highlights SOC accounting in freshwater forested wetland carbon pools when estimating carbon stocks and fluxes. Results can be used to improve carbon modeling outcomes, as well as inform regional, national, and global management of wetland carbon resources.
1 Introduction
Wetlands play a significant role in the global carbon cycle, influencing nutrient cycling, atmospheric temperature fluctuations, and the maintenance of habitats for a variety of species. Nature-based carbon sequestration, mainly as plant biomass and soil organic carbon (SOC) accumulation, has been increasingly recommended as a strategy to reduce flood risk and increase the resiliency of human populations to natural perturbations (e.g., droughts; hurricanes) (Sapkota and White, 2020; Robertson et al., 2022). Globally, the top 100 cm of the soil contains two times the amount of carbon present in the earth’s atmosphere, so additional research into soil carbon pools is warranted (Lal, 2008).
In particular, wetland soils contain about one-third of all SOC resources despite occurring across a small proportion (5%) of the earth’s surface area (Reddy and DeLaune, 2008). Wetlands are one of the most productive ecosystems in the world, characterized by higher rates of primary productivity and lower rates of organic matter decomposition relative to other ecosystems (Brinson, 1993; Mitsch and Gosselink, 2015). The large storage of SOC in wetlands is attributable to saturated soil conditions that create anaerobic conditions limiting microbial organic matter decomposition efficiency and inducing a net gain in soil carbon (Day and Megonigal, 1993; Trettin et al., 2006; Reddy and DeLaune, 2008). As a result, wetland soils disproportionately sequester large amount of carbon for extended periods ranging from hundreds to thousands of years (Mcleod et al., 2011). For example, almost 98% of the carbon in North American wetlands is stored in the soil, mainly in peatlands (83%) (Bridgham et al., 2006).
Globally, wetlands occupy approximately 1,210 M ha of the earth’s surface (Davidson et al., 2018) of which freshwater forested wetlands (918.4 M ha) account for the largest spatial extent (Trettin et al., 2019). Wetlands occur on <6% (47.1 M ha) of the conterminous United States (CONUS), and 95% of the wetland area occupies freshwater landscape positions (Lang et al., 2024; Stewart et al., 2024). Among the freshwater wetlands, freshwater forested wetlands cover the largest extent (21.2 M ha) with cumulative SOC stocks 8–10 times greater than non-forested tidal freshwater, oligohaline, and salt marshes (Lang et al., 2024; Nahlik and Fennessy, 2016; Uhran et al., 2021). Freshwater forested wetlands are defined as areas with hydric soils, wetland hydrology, and hydrophytic vegetation characterized by a tree stratum ≥6 m in height that typically occupies ≥30% of the aerial cover (Cowardin et al., 1979). Freshwater forested wetlands play an important role in terrestrial carbon cycling due to high SOC storage (Krauss et al., 2018), and the distribution of carbon between aboveground and belowground biomass/necromass (Davidson et al., 2022), transporting labile organic matter to downstream environments (D’Amore et al., 2015), and non-ebullitive CH4 flux from groundwater through tree stems (Pangala et al., 2017). In addition to large SOC stocks, freshwater forested wetland live and dead wood generally contains more carbon than upland forests within the temperate zone and elsewhere (Ricker et al., 2019).
Despite the fact that freshwater forested wetlands have the potential to sequester more carbon than most of the classically defined blue carbon ecosystems including saltmarsh, mangroves, and seagrass (Mitsch and Gosselink, 2015), few studies focus on freshwater forested wetland carbon stocks and dynamics, and uncertainties persist regarding the role of freshwater forested wetlands in national and global carbon accounting (Adame et al., 2024). Insufficient data exist to reduce variability in freshwater forested wetland carbon density, and few flux measurements are available to inform both carbon modeling and management approaches (Davidson et al., 2022). Here, we conducted a global literature synthesis of freshwater forested wetland SOC data across different geomorphic and ecological settings and forest type groups. The objective of this study was to estimate SOC stock variabilities across different freshwater forested wetland landscapes and vegetation communities. This synthesis highlights SOC accounting in freshwater forested wetland carbon pools and can help to improve the estimates of carbon stock and fluxes in freshwater forested wetland landscapes in the context of natural resource management.
2 Methods
2.1 Dataset generation and organization
The literature reporting freshwater forested wetland soil carbon data was gathered through a Web of Science search, conducted in January 2024, with the search stream “soil* AND carbon* AND forested* AND wetland*” which yielded 374 peer-reviewed publications. All 374 articles were thoroughly reviewed to extract reported soil carbon values from freshwater forested wetland studies. The initial inclusion criteria were: (1) studies examining freshwater forested wetlands including tidal freshwater forested wetlands with salinity ≤0.5 mg/L and (2) availability of soil carbon data regardless of reporting units (i.e., percent organic matter, total organic carbon, carbon density, or carbon stock). This initial review yielded 89 peer-reviewed publications. In addition, a U.S. Forest Service report (Francl et al., 2004) was added, yielding a total of 90 included studies (Supplementary Figure 1; Supplementary Table 1).
From these 90 studies, data compilation included the study country and states/provinces, latitude and longitude, specific study site location, whether the study included natural and/or restored areas (and years since restoration if relevant), geomorphic and ecological settings, dominant forest tree species, soil series if reported, soil sample depth intervals (depth minimum and depth maximum), the number of samples per site, and (when available) the bulk density, percent organic matter, percent organic carbon, carbon density, and carbon stock. Most of the studies reported latitude and longitude coordinates of study sites, and studies with missing coordinates were derived from Google Earth to provide the approximate location of the study sites. The resultant forested wetlands SOC dataset included 600 data points from 334 study sites.
2.2 Spatial distribution of study sites
The study sites were distributed across nine countries with the majority of sites in the conterminous U.S. (70%) or the wider inclusion of North America (80%) (Figure 1). In addition to site-specific data, some regional and national averages were reported for different freshwater forested wetlands. Nahlik and Fennessy (2016) reported the U.S. national average for palustrine forested wetlands derived from the 2011 National Wetlands Condition Assessment (NWCA) data. Zamora et al. (2020) summarized SOC stock data for freshwater forested wetlands in Mexico. Hansen and Nestlerode (2014) derived Northern Gulf of America (Mexico) regional averages for different forested wetland types from multiple field studies. McNicol et al. (2019) modeled SOC storage in the coastal rainforest of the Pacific Northwest (PNW) in the U.S. and Canada, and Stewart et al. (2024) modeled forested wetland SOC stock data for the Hoh River watershed in Washington, U.S. The modeled data included were well validated and helped to represent the relatively underrepresented freshwater forested wetlands of U.S. and Canada Pacific Northwest region. These national and regional averages based on wetland types or forest species were also included as individual study sites within the database. Among the study locations, 286 sites were natural while 44 sites were restored. The restored sites were either planted or underwent natural regrowth after harvest and/or project implementation.
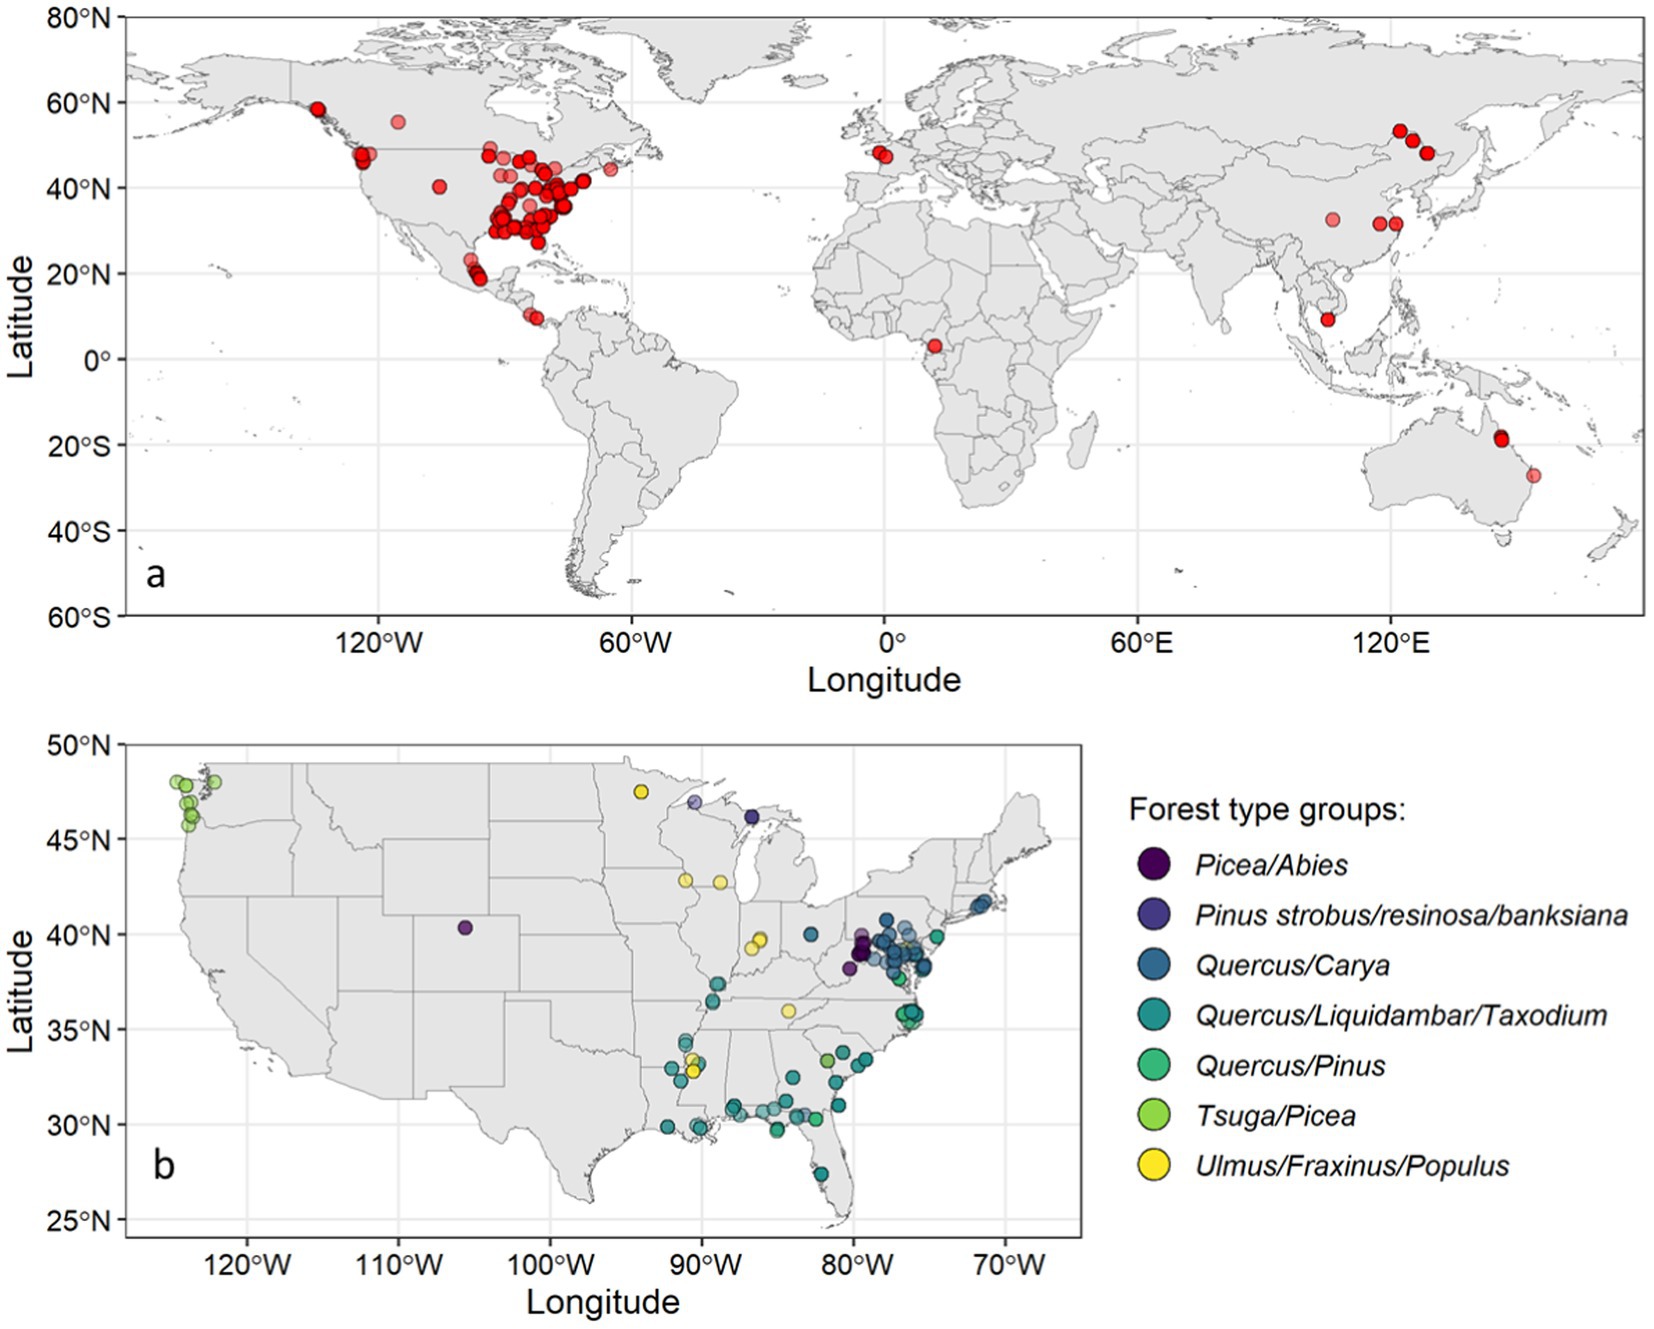
Figure 1. (a) Global distribution of freshwater forested wetland study sites (n = 334) and (b) Distribution of freshwater forested wetland study sites across the CONUS forest type groups (n = 235).
2.3 Geomorphic setting
Forested wetlands exhibit a wide range of vegetation community compositions that occur across different hydrogeomorphic settings including depressions, riverine, slopes, wet flats, lacustrine fringe, estuarine landscapes, and continental biogeography globally (Brinson, 2009; Euliss et al., 2004; Trettin et al., 2019). Many forested wetlands in high-latitude boreal regions are dominated by conifers with deciduous species occupying riparian corridors. Conversely, deciduous hard- and softwood species characterize the temperate forested wetlands of the southeastern United States accompanied by some coniferous species occurring in certain landscapes (e.g., Pinus spp. on wet flats; Taxodium spp. in depressions). The temperate and sub-tropical forested wetlands contain a wide variety of forest species such as Taxodium spp. and Nyssa spp. adapted to extended periods of soil saturation and warm temperatures (Trettin et al., 2019).
All study sites (global) were differentiated into five major forested wetland geomorphic and ecological settings based on the site descriptions provided in each study. The wetlands groups included: floodplain forested wetlands (n = 129), tidal freshwater forested wetlands (n = 40), non-tidal swamps (n = 123), rainforests (n = 7), and forested bogs (n = 35). The “non-tidal swamps” included sites described as forested swamps and pocosins swamps. The forested bog, fen, vernal pools, and high-elevation depressional forested wetlands whose general characteristics align with the ecology of bogs were included in the “forested bogs” group.
2.4 Forest type groups
All freshwater forested wetland sites were classified as broad leaf (n = 139), needle leaf (n = 125), and mixed (n = 46) forest types. In addition, the U.S Department of Agriculture (USDA) Forest Service forest type group classification scheme described in Perry et al. (2022) was applied to each CONUS freshwater forested wetland site. The 235 CONUS study sites derived from 58 publications represent eight forest type groups including Quercus/Liquidambar/Taxodium (oak/gum/cypress), Quercus/Carya (oak/hickory), Quercus/Pinus (oak/pine), Pinus taeda/echinata (loblolly/shortleaf pine), Ulmus/Fraxinus/Populus (elm/ash/cottonwood), Picea/Abies (spruce/fir), Pinus strobus/resinosa/banksiana (white/red/Jack pine), and Tsuga/Picea (hemlock/Sitka spruce). Among the forest types, Pinus taeda/echinata had only surface (0–15 cm) data points but shared similar spatial distribution and surface SOC density to the Quercus/Pinus group. As a result, the Pinus taeda/echinata and Quercus/Pinus groups were merged for data analysis. Hereafter, the freshwater forested wetland classification based on the leaf shape is identified as “forest types” whereas the CONUS freshwater forested wetland classification based on the USDA Forest Service classification is identified as “forest type groups.”
2.5 Bulk density calculations
Out of 90 studies, 46 studies (350 data points) reported dry bulk density, and 25 studies (108 data points) reported either SOC densities or stocks without reporting bulk density. The remaining 19 studies (142 data points from 67 study sites) contained data on SOC fraction, but did not report bulk density, SOC density, or SOC stocks. We used the ideal mixed model developed by Morris et al. (2016), which describes how bulk density varies from purely mineral to purely organic soils, to predict missing bulk density values of the 142 data points lacking this information. This model is based on the concept that the bulk volume of soil approximates the summation of self-packing volumes of organic and mineral components. Thus, bulk density is the function of organic matter as well as the organic (k1) and mineral (k2) self-packing densities (Equation 1) (Morris et al., 2016; Holmquist et al., 2018).
Where,
OM = organic matter fraction.
k1 = self-packing density of pure organic matter (g cm−3).
k2 = self-packing density of pure mineral matter (g cm−3).
Morris et al. (2016) reported k1 and k2 coefficients of 0.085 g cm−3 and 1.99 g cm−3, respectively, for the best fitted (R2 = 0.78) tidal wetland and mangrove model. Conservatively, we adopted the same relationship for forested wetlands. The independent validation of this model with our forested wetland dataset, which reported both organic matter fraction and bulk density (n = 156), yielded a significant relationship (R2 = 0.82, p < 0.001) between actual and modeled bulk density values. This validation result suggests that the ideal mixed model and coefficient values can conservatively be applied to predict forested wetland soil bulk density from organic matter fraction data.
2.6 SOC density and stock calculations
Soil carbon concentrations were reported as percent organic matter, percent organic carbon, or as carbon density (i.e., carbon per unit volume). Out of 90 included studies, five studies (134 data points) reported carbon concentration as the percentage of organic matter (OM). We converted OM values to percent organic carbon (OC) (and vice-versa) using the Equation 2 developed by Maxwell et al. (2023):
Then carbon density was calculated using the Equation 3 (Maxwell et al., 2023):
The SOC density data was converted to SOC stocks by multiplying SOC densities by the reported thickness of the soil sampling interval (Maxwell et al., 2023):
To account for differences in sample designs across studies, soil data were grouped into five soil depth interval classes including 0–15 cm, 15–30 cm, 30–50 cm, 50–100 cm, and 100+ cm based on the mid-point of the starting and ending sampling depths reported in each study.
2.7 Data analysis
The data was analyzed in R (R Core Team, 2022) using R Studio (Posit Team, 2022). The study site locations (latitude and longitude) were plotted on a world base map to show the spatial distribution of freshwater forested wetland study sites included in the synthesis (Figure 1). In addition, CONUS sites were plotted on the U.S. map to show the spatial distribution of different freshwater forested wetland forest type groups. The distribution of each percent organic carbon, bulk density, SOC density, and soil depth were accessed using histograms created in the R package ggplot2. In addition, bulk density, percent organic carbon, and SOC density distribution by depth intervals were accessed using data violin frequency/density plots. Violin plots visualize the distribution of numerical variables for one or several groups using density curves.
The summary statistics of percent organic carbon, bulk density, SOC density, and soil depth were calculated in R. The mean and median SOC densities for each sample depth interval were calculated using summarySE function in R. The mean and median carbon stock within each depth interval was calculated using Equation 4 above. In addition, the cumulative carbon stocks within the top 30 cm and 100 cm of soil were determined. The SOC densities and stocks within each depth interval were also calculated based on geomorphic settings and forest types based on leaf shape. Similarly, the mean and median SOC density and stock values were calculated for each depth interval of CONUS freshwater forested wetland forest type groups. Violin frequency/density plots were used to visualize the distribution of SOC density within each depth interval for each forested wetland type based on geomorphic settings, forest types, and forest type groups.
In addition to histogram plots, normality of dataset was accessed using Shapiro–Wilk test. The percent organic carbon, bulk, density, and SOC density were not normally distributed (p > 0.05). The log or square root transformed data did not convert the distribution to the normal. Thus, non-parametric test (Kruskal-Wallis chi-squared test) was applied to access the variation of median carbon densities across depths, geomorphic and ecological settings, forest types based on leaf shape, and CONUS forest type groups. In addition, Dunn’s test was used for multiple comparisons (post hoc) of carbon densities at different geomorphic settings and forest type groups. Bonferroni correction was applied to control family-wise error rate (FWER).
The mean SOC densities and stocks within each depth interval were associated with large variance and standard deviations (Table 1). Thus, median values, along with the median absolute deviation, were evaluated as they have been shown to provide a better estimate of the forested wetland SOC density and stocks (Maxwell et al., 2023). The median absolute deviation is a measure of variability in a dataset calculated as the median of absolute differences between each datapoint and the median of the entire dataset. The median carbon stock in the top 30 cm and 100 cm of soil were calculated based on geomorphic settings, forest types, forest type groups. We then multiplied global median SOC stock by the area of the freshwater forested wetlands to calculate total CONUS and global SOC stock in freshwater forested wetlands.
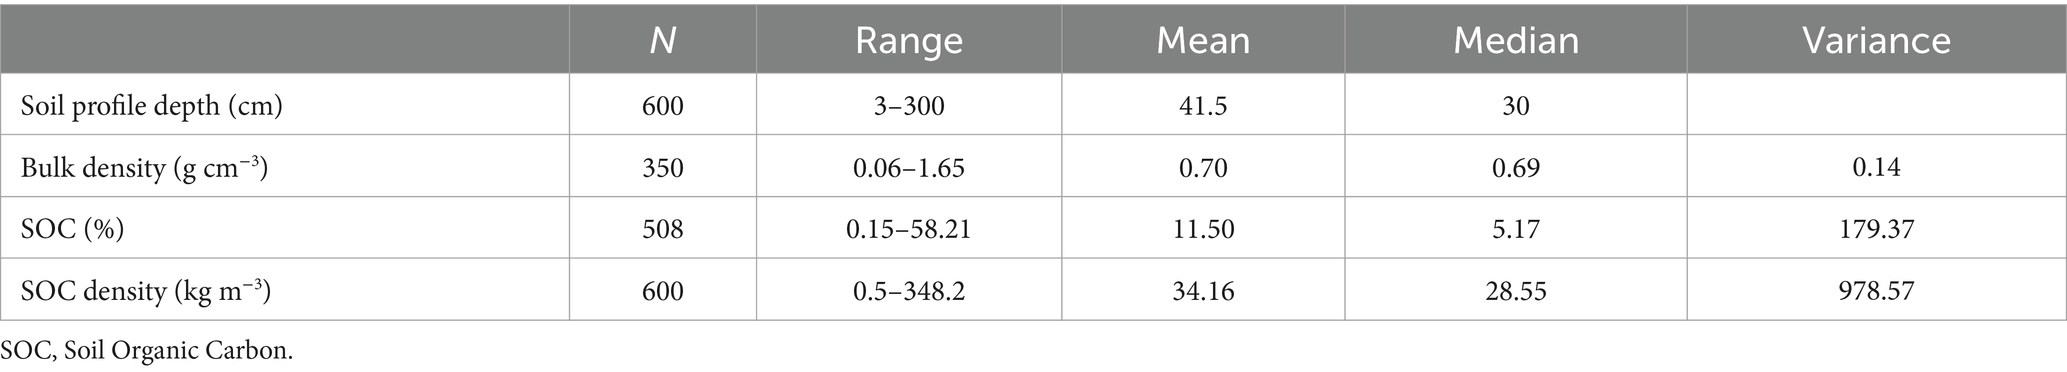
Table 1. Summary statistics of the freshwater forested wetland soil carbon data across all geomorphic settings and reported depths (3–300 cm).
3 Results and discussion
3.1 Soil physiochemical properties
The freshwater forested wetland SOC dataset included results from 90 papers published between 1999 and 2025 (Supplementary Figure 1). Within the dataset, maximum sampling depths ranged from as shallow as 3 cm to as deep as 300 cm below the soil surface. The mean and median sampling depths were 43 cm and 30 cm, respectively (Table 1). The data points were concentrated toward the surface of the soil, but the dataset contained sufficient information to evaluate freshwater forested wetland SOC densities and stocks to a depth of 100 cm (Supplementary Figure 2). While the carbon density is generally higher in the major rooting zone near the soil surface (0–30 cm), the majority of the SOC stocks are present within soils deeper than 30 cm (Nahlik and Fennessy, 2016). As a result, published studies recommend evaluating SOC stocks to 1 m depth (or more) when examining wetland carbon budgets, and recent studies increasingly report wetland soil carbon at deeper depths (Nahlik and Fennessy, 2016; Holmquist et al., 2018; Sapkota and White, 2021; Maxwell et al., 2023).
Soil bulk density values (n = 350) ranged from 0.06–1.65 g cm−3 (Supplementary Figure 2). The mean and median bulk densities were 0.65 and 0.67 g cm−3, respectively. Bulk density varied across soil depths, geomorphic locations, and forest type groups (Table 2). The median bulk density (± mean absolute deviation) was smallest (0.56 ± 0.52 g cm−3) at the surface and gradually increased with depth to the value of 0.77 ± 0.29 g cm−3 at 50–100 cm depth (Figure 2). The floodplain forested wetlands had the highest median bulk density (0.94 ± 0.33 g cm−3) followed by non-tidal swamps (0.72 ± 0.43 g cm−3), and tidal freshwater forested wetlands (0.48 ± 0.23 g cm−3). This result aligns with the function of floodplain forests which frequently receive high density mineral soil inputs during periods of overbank flooding, influencing SOC stocks (Naiman et al., 2010; Ensign et al., 2014; Heger et al., 2021). While non-tidal swamps are often underlain by fine textured sediments or spodic materials, hydrodynamics are generally reduced. They occupy landscape positions further from sediment sources (e.g., backswamp or depressional terrace geomorphologies) that decrease the contribution of high density mineral riverine sediments. As a result, these non-tidal swamps experience long periods of standing water that enhances organic matter accumulation (Smith and Klimas, 2002; Schafale, 2023). Tidal freshwater forested wetlands exhibit a range of mineral:organic substrate density ratios based on the dynamics of tidal and riverine sedimentation and organic matter accumulation dynamics (Nyman et al., 1990).
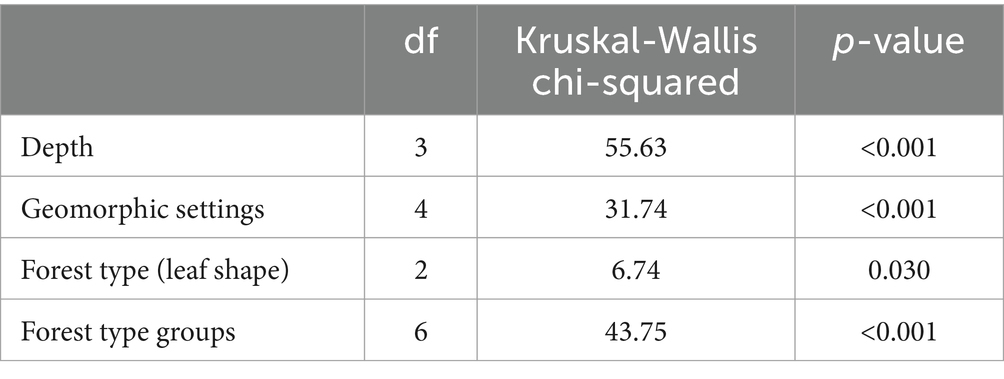
Table 2. Kruskal-Wallis chi-squared test results on median carbon density variations at different depth intervals, geomorphic and ecological settings, forest types based on leaf shape, and CONUS forest type groups.
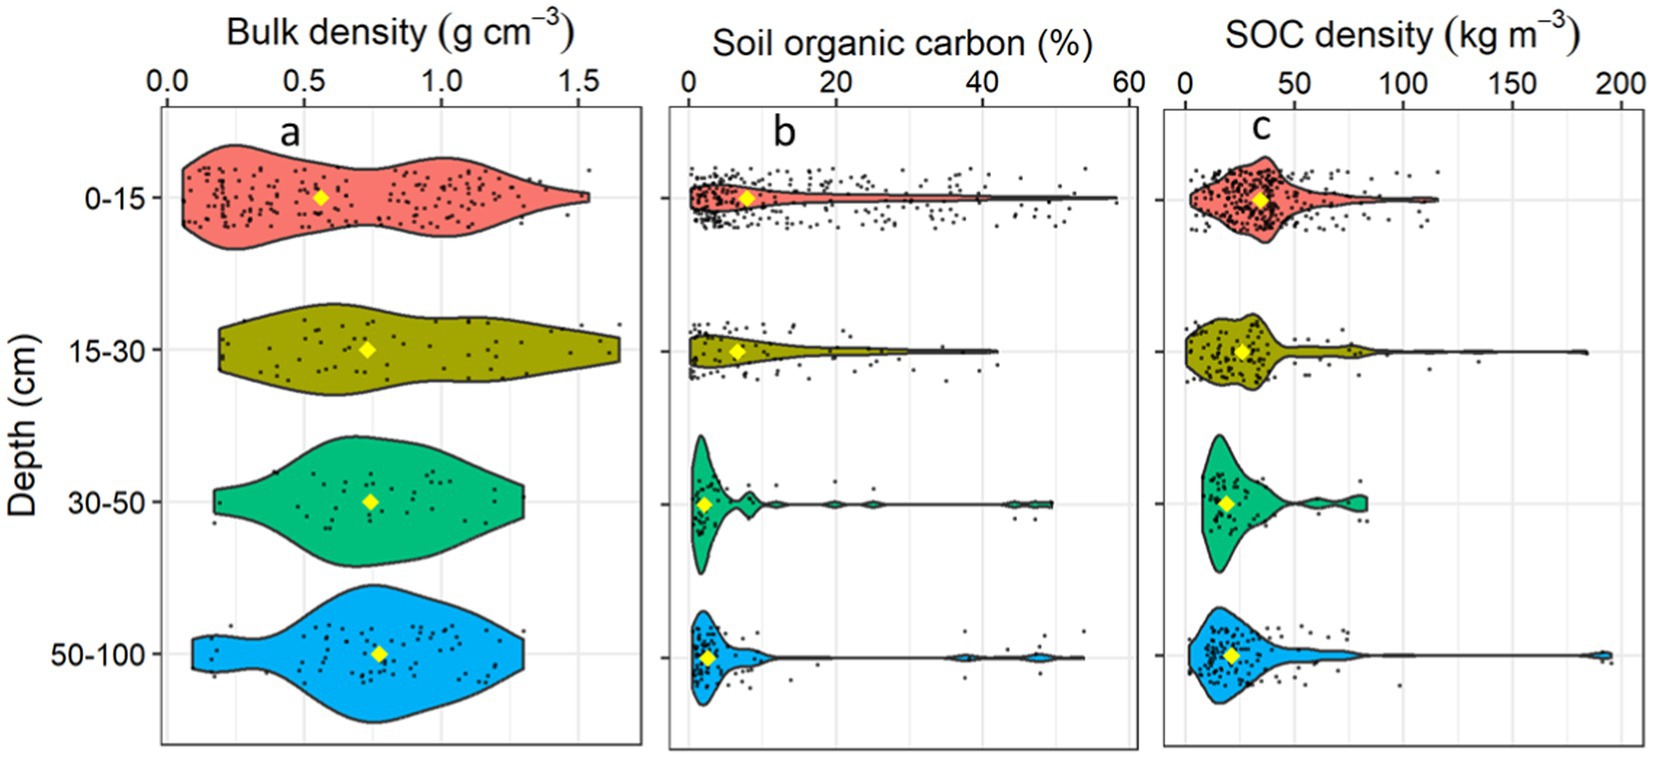
Figure 2. Frequency plots showing the distribution of freshwater forested wetland carbon characteristics by soil depth intervals synthesized from the dataset, including (a) bulk density, (b) percent soil organic carbon (SOC), and (c) SOC density. The yellow diamond identifies the median value at each depth interval, black points indicate the density/frequency of available data.
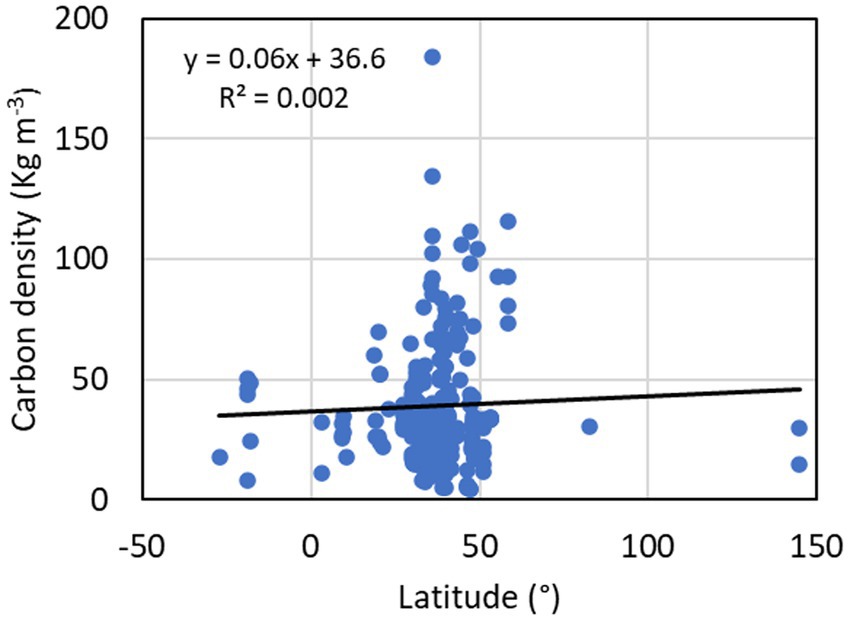
Figure 3. Latitudinal variation of freshwater forested wetland soil organic carbon (SOC) stock in the top 100 cm soil profile. Positive latitude values represent sites in the northern hemisphere, and negative latitude values represent sites in the southern hemisphere.
Tidal freshwater forests consistently rely on a combination of organic matter accretion and mineral sediment deposition to maintain elevation relative to changing sea levels whereas inland floodplain systems with higher bulk densities, accretion is dominated by mineral sediment deposition during flood events (Mudd et al., 2009; Noe et al., 2016). Among the CONUS forest type groups, the Quercus/Carya group had the highest median bulk density (1.11 ± 0.3 g cm−3) whereas the Tsuga/Picea group had the lowest median bulk density (0.51 ± 0.16 g cm−3) in top 1 m of the soil profile. The high bulk density in the Quercus/Carya group is mainly attributed to their common geomorphic setting in floodplains which receive inorganic sediments during flooding events, including within the Mississippi River Valley and other drainages where heavy clay soil particles are common (Noe and Hupp, 2009; Davidson et al., 2022). The low bulk density of the Tsuga/Picea group result from higher organic matter contents at depths reaching ~3 m supported by high primary productivity in combination with relatively low temperatures and recalcitrant leaf litter that reduce microbial respiration and organic matter decomposition (Kauffman et al., 2020).
The percent soil organic carbon (OC) content ranged from 0.15–58.2% (mean = 11.5%; median = 5.2%). The OC results were skewed (Supplementary Figure 2), due to a large number of data points from forested wetlands dominated by mineral soil textures that often contain less soil organic matter (i.e., <6% OC) and have more seasonal hydroperiods than study locations with thick organic soil layers and consistent saturation such as forested fens and bogs (Noble and Berkowitz, 2016). The OC varied with soil depth, geomorphic locations, and forest type groups (p < 0 0.001). The median OC was highest at 0–15 cm depth (7.9 ± 8.8%) and gradually decreased to the lowest concentration (2.6 ± 2.1%) at 50–100 cm depth (Figure 2). Among the geomorphic locations, rainforest wetlands had the highest median OC (25.7 ± 19.1%) whereas floodplains had the lowest OC (2.8 ± 2.2%) in the upper 100 cm of the soil profile. Among the forest type groups, the Tsuga/Picea group had the highest median organic carbon concentration (7.4 ± 4%), followed by the Quercus/Pinus (6.5 ± 4.8%), and Quercus/Liquidambar/Taxodium (3.6 ± 3.3%) in the upper 1 m of the soil profile. These variations of OC concentrations align with the underlying hydrodynamic and biogeochemical processes discussed above and were consistent with the bulk density variations since bulk density is inversely related to OC. The observed wide ranges of bulk density and OC concentration values highlight the variability of forested wetland soils across study locations and soil sampling intervals, further suggesting that the misclassification of forested wetland characteristics can increase errors in carbon accounting and management. In response, the following section examines forested wetland SOC densities and stocks across the full dataset, and makes comparisons across geomorphic settings, forest type groups, and created/restored and natural scenarios.
3.2 Forested wetland SOC densities and stocks within the full dataset
The SOC density was variable with values ranging from 0.5–348.2 kg m−3 (Table 1). The SOC densities varied with depth, geomorphic positions, distance from the equator, forest types, and forest type groups (Table 2; Figures 2–5). The median SOC density was highest in the 0–15 cm depths (34.7 ± 15.5 kg m−3), decreased to 18.8 ± 7.5 kg m−3 in the 30–50 cm depth interval, and then remained similar down to 100 cm depth (Figure 2).
The overall global freshwater forested wetlands median (± median absolute deviation) SOC density derived from our dataset was 32.5 ± 16.1 kg m−3 in the upper 30 cm of the soil profile and 28.6 ± 16.2 kg m−3 within 100 cm of the soil surface. We report SOC density within the top 100 cm of soil that is comparable to the conservative mean carbon density (27 kg m−3) reported for CONUS tidal saline wetlands (Holmquist et al., 2018). However, the freshwater forested wetlands have a larger spatial extent leading to greater SOC stocks than non-forested tidal wetlands in CONUS (Nahlik and Fennessy, 2016; Uhran et al., 2021).
Similarly, the freshwater forested wetland global median SOC stock in the dataset was 91.2 ± 46.4 Mg C ha−1 in the top 30 cm and 235.3 ± 125.6 Mg C ha−1 in the top 100 cm soil of the forested wetlands (Table 3; Figure 6). Our estimated global freshwater forested wetland SOC stock in the top 1 m of soil was greater than all forest soils (i.e., upland and wetland) global average (180 Mg C ha−1) and the CONUS average (108 Mg C ha−1) indicating the importance of freshwater forested wetlands as SOC hotspots compared to upland forests (Dixon et al., 1994; Lal, 2005).
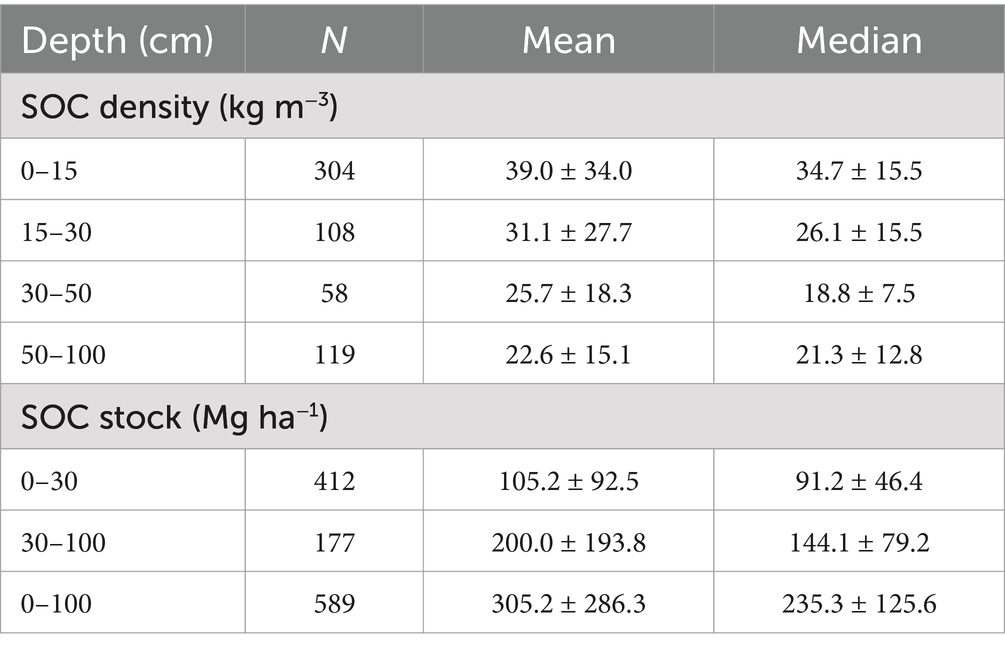
Table 3. Global mean (± standard deviation) and median (± median absolute deviation) soil organic carbon (SOC) densities and SOC stocks at different depth intervals.
The freshwater forested wetland median SOC stock we synthesized was comparable to values reported in the literature. For example, Nahlik and Fennessy (2016) derived CONUS mean (± standard error) SOC stock for palustrine, riverine, and lacustrine forested of 109 ± 8 Mg C ha−1 in the top 30 cm and 315.5 ± 7.6 Mg C ha−1 in the top 100 cm soil using U.S. Environmental Protection Agency (EPA) NWCA data. However, our global SOC stock values were lower than several regional averages of temperate freshwater forested wetlands. For example, Davidson et al. (2022) reported a mean SOC stock of 190–264 Mg C ha−1 at the top 30 cm soil and 630–798 Mg C ha−1 in the top 100 cm of soil when evaluating temperate forested wetlands in Canada and CONUS. Similarly, Kauffman et al. (2020) reported a mean (± standard deviation) SOC stock of 360.5 ± 35 in the top 100 cm soil of the Pacific Northwest tidal freshwater forested wetlands. The higher SOC stock in temperate forested wetlands may be due to the interaction of colder temperature, precipitation, hydrologic setting, and litter quality relative to the wide variability of the conditions included in our dataset (Lal, 2005; Davidson et al., 2022).
Notably, the forested wetland global median soil carbon stock we synthesized was comparable to the estimated SOC stocks in tidal marshes (Holmquist et al., 2018; Maxwell et al., 2023). For example, Maxwell et al. (2023) reported tidal marsh global median SOC stock of 79.2 ± 38.1 Mg C ha−1 in the top 30 cm and 231 ± 134 Mg C ha−1 in the top 100 cm soil. The median absolute deviation in our estimates and tidal marshes estimates were comparable indicating large uncertainty in SOC stock estimation across wetland types. Tidal marshes (both freshwater and saline) are dominated by herbaceous vegetation species that allocate significant carbon resources to belowground biomass compared to the woody shrubs and trees that dominate forested wetlands where carbon resources are devoted to aboveground biomass to compete for sunlight in addition to belowground rooting structures (Adame et al., 2017). The slower degradability of wood and other recalcitrant litter in forested wetlands compared to non-forested tidal wetland herbaceous litters (Stagg et al., 2017) may result in comparable SOC stocks between forested wetlands and non-forested tidal wetlands (Stoler and Reylea, 2020). The woody stem and root material decompose more slowly than herbaceous litter due to relative tissue toughness and the presence of lignin (Akanil and Middleton, 2011; Cornwell et al., 2008). For example, the decomposition of leaf tissues was found to be 6–11 times faster than the wood tissue in Taxodium spp. swamps (Middleton, 2020). In the Mississippi Alluvial Valley, the half-life of dead woody Taxodium spp. tree is up to 300 years, which helps maintain SOC stocks in inland forested wetlands (Middleton, 2020).
3.3 Forested wetland SOC densities and stocks variation across geomorphic settings
Among the geomorphic settings, floodplain freshwater forested wetlands were most studied (129 sites) followed by non-tidal swamps (123 sites), whereas the rainforests were least studied (7 sites) according to the author descriptions provided in the database. The SOC density varied by geomorphic settings and soil sampling depth interval (Table 2; Figure 4; Supplementary Table 2). Tidal freshwater forested wetlands had the highest median SOC density, whereas the floodplain forested wetlands had the lowest median SOC density in the upper 100 cm of the soil profile.
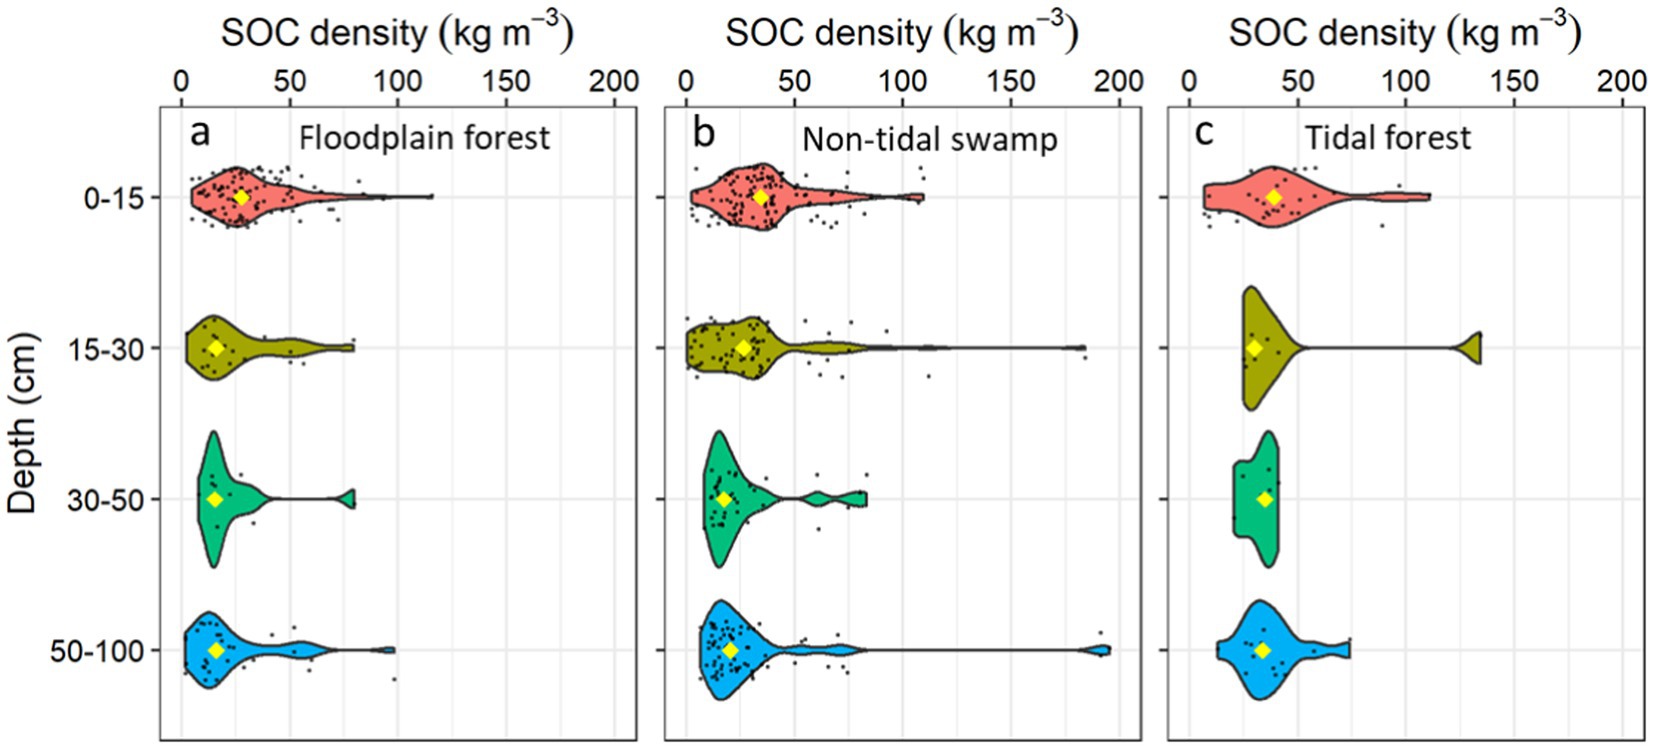
Figure 4. Frequency plots showing the distribution of freshwater forested wetland soil organic carbon (SOC) density by soil depth intervals in different geomorphic settings including (a) floodplain forest (n = 129 sites), (b) non-tidal swamps (n = 123 sites), and (c) tidal freshwater forests (n = 40 sites). The yellow diamond identifies the median value within each depth interval, black points indicate the density/frequency of available data.
Similarly, the tidal freshwater forested wetlands had the highest median SOC stock (341.6 ± 98.4 Mg ha−1) followed by rainforests (285.6 ± 75.8 Mg ha−1) and non-tidal swamps (229.3 ± 120.4 Mg ha−1) in the upper 100 cm of the soil profile. Rainforests, tidal freshwater forests, non-tidal swamps, and forested bogs had similar SOC stocks in the upper 30 cm of the soil profile (Table 4; Figure 7). The highest SOC stocks in tidal freshwater forested wetlands are attributed to high primary productivity in combination with longer hydroperiods due to frequent tidal connections that support near continuous soil saturation and low decomposition rates in many areas (Krauss et al., 2018). The floodplain forested wetlands had the lowest SOC stock at both upper 30 cm and 100 cm (176.6 ± 84 Mg ha−1) of the soil profile (Table 4; Figure 7) mainly due to the addition of inorganic sediments during flooding events (Davidson et al., 2022). In addition, many floodplain forests also exhibit limited hydroperiods that allow for aerobic decomposition to reduce organic matter accumulation during dry portions of the growing season when increased temperatures and microbial respiration are common (Noe and Hupp, 2009).
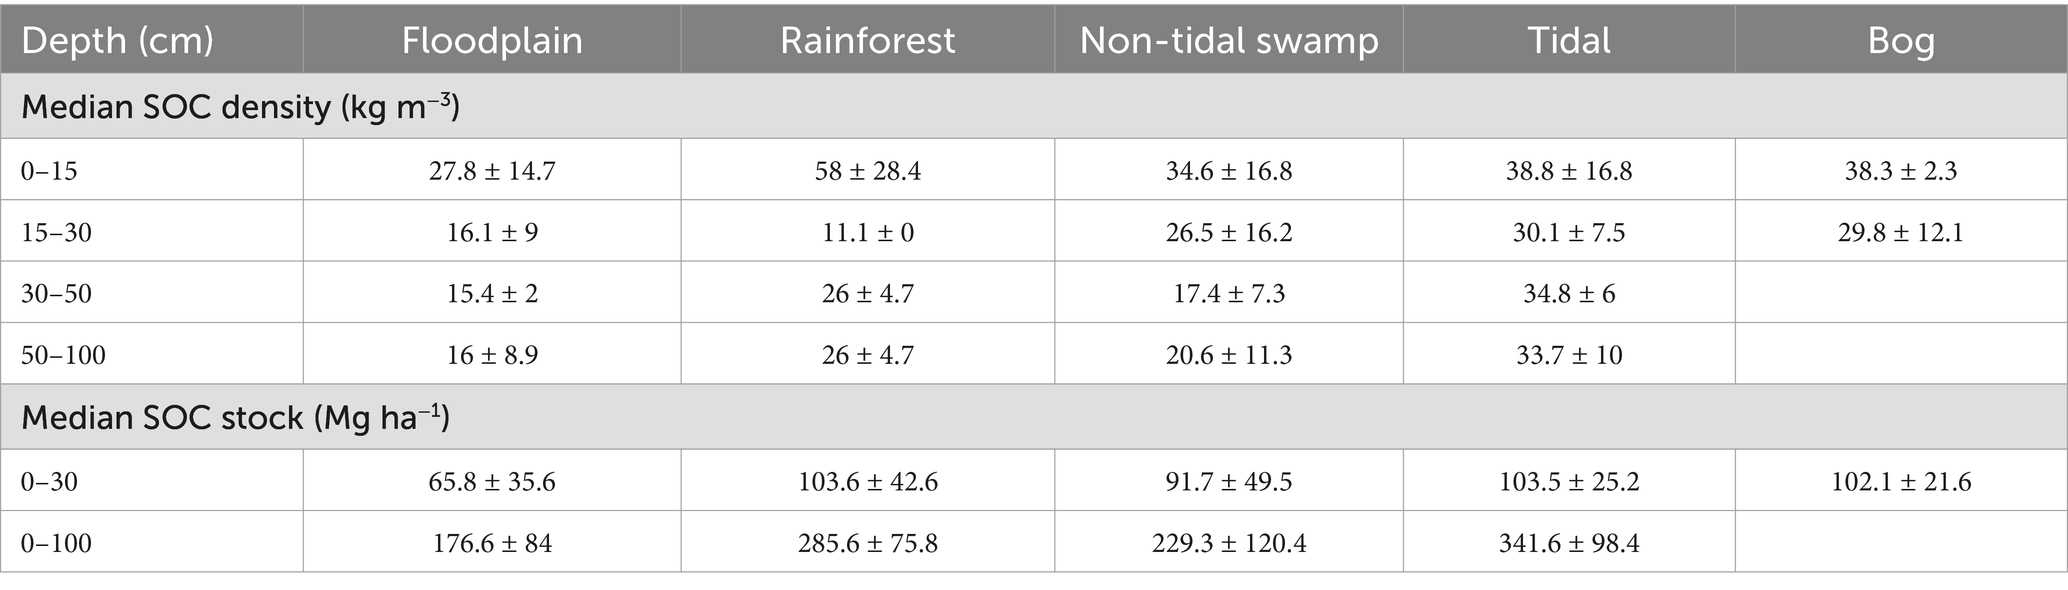
Table 4. Global median (± median absolute deviation) soil organic carbon (SOC) density and SOC stock at different depth intervals of different geomorphic and ecological settings.
3.4 Forested wetland SOC densities and stocks variation by forest types
In the global dataset, the SOC densities varied by forest types based on leaf shape (Table 2). The mixed (needle leaf and broad leaf) forested wetland sites had highest median SOC densities followed by needle leaf and broad leaf forested wetlands (Supplementary Table 3). Similarly, mixed leaf and needle leaf forested wetlands had greater median SOC stocks than broad leaf forested wetlands in the upper 30 cm and 100 cm soil profile (Figure 6) consistent with other observations reported in the literature (Byun et al., 2022; Jandl et al., 2021).
Among the 235 CONUS forested wetland study sites in the database, the Quercus/Liquidambar/Taxodium was the most studied forest type group (100 sites) while the Pinus strobus/resinosa/banksiana was the least studied (6 sites). The SOC density varied by forest type groups and soil sampling interval depth (Table 2; Figure 5). The Tsuga/Picea group had higher SOC density at all depth intervals compared to other forest type groups (Table 5; Supplementary Table 4). The SOC density generally decreased with depth at all forest type groups; however, the carbon density decrease with depth was smaller in the Tsuga/Picea group due to large SOC stocks up to 3 m below the soil surface (Kauffman et al., 2020).
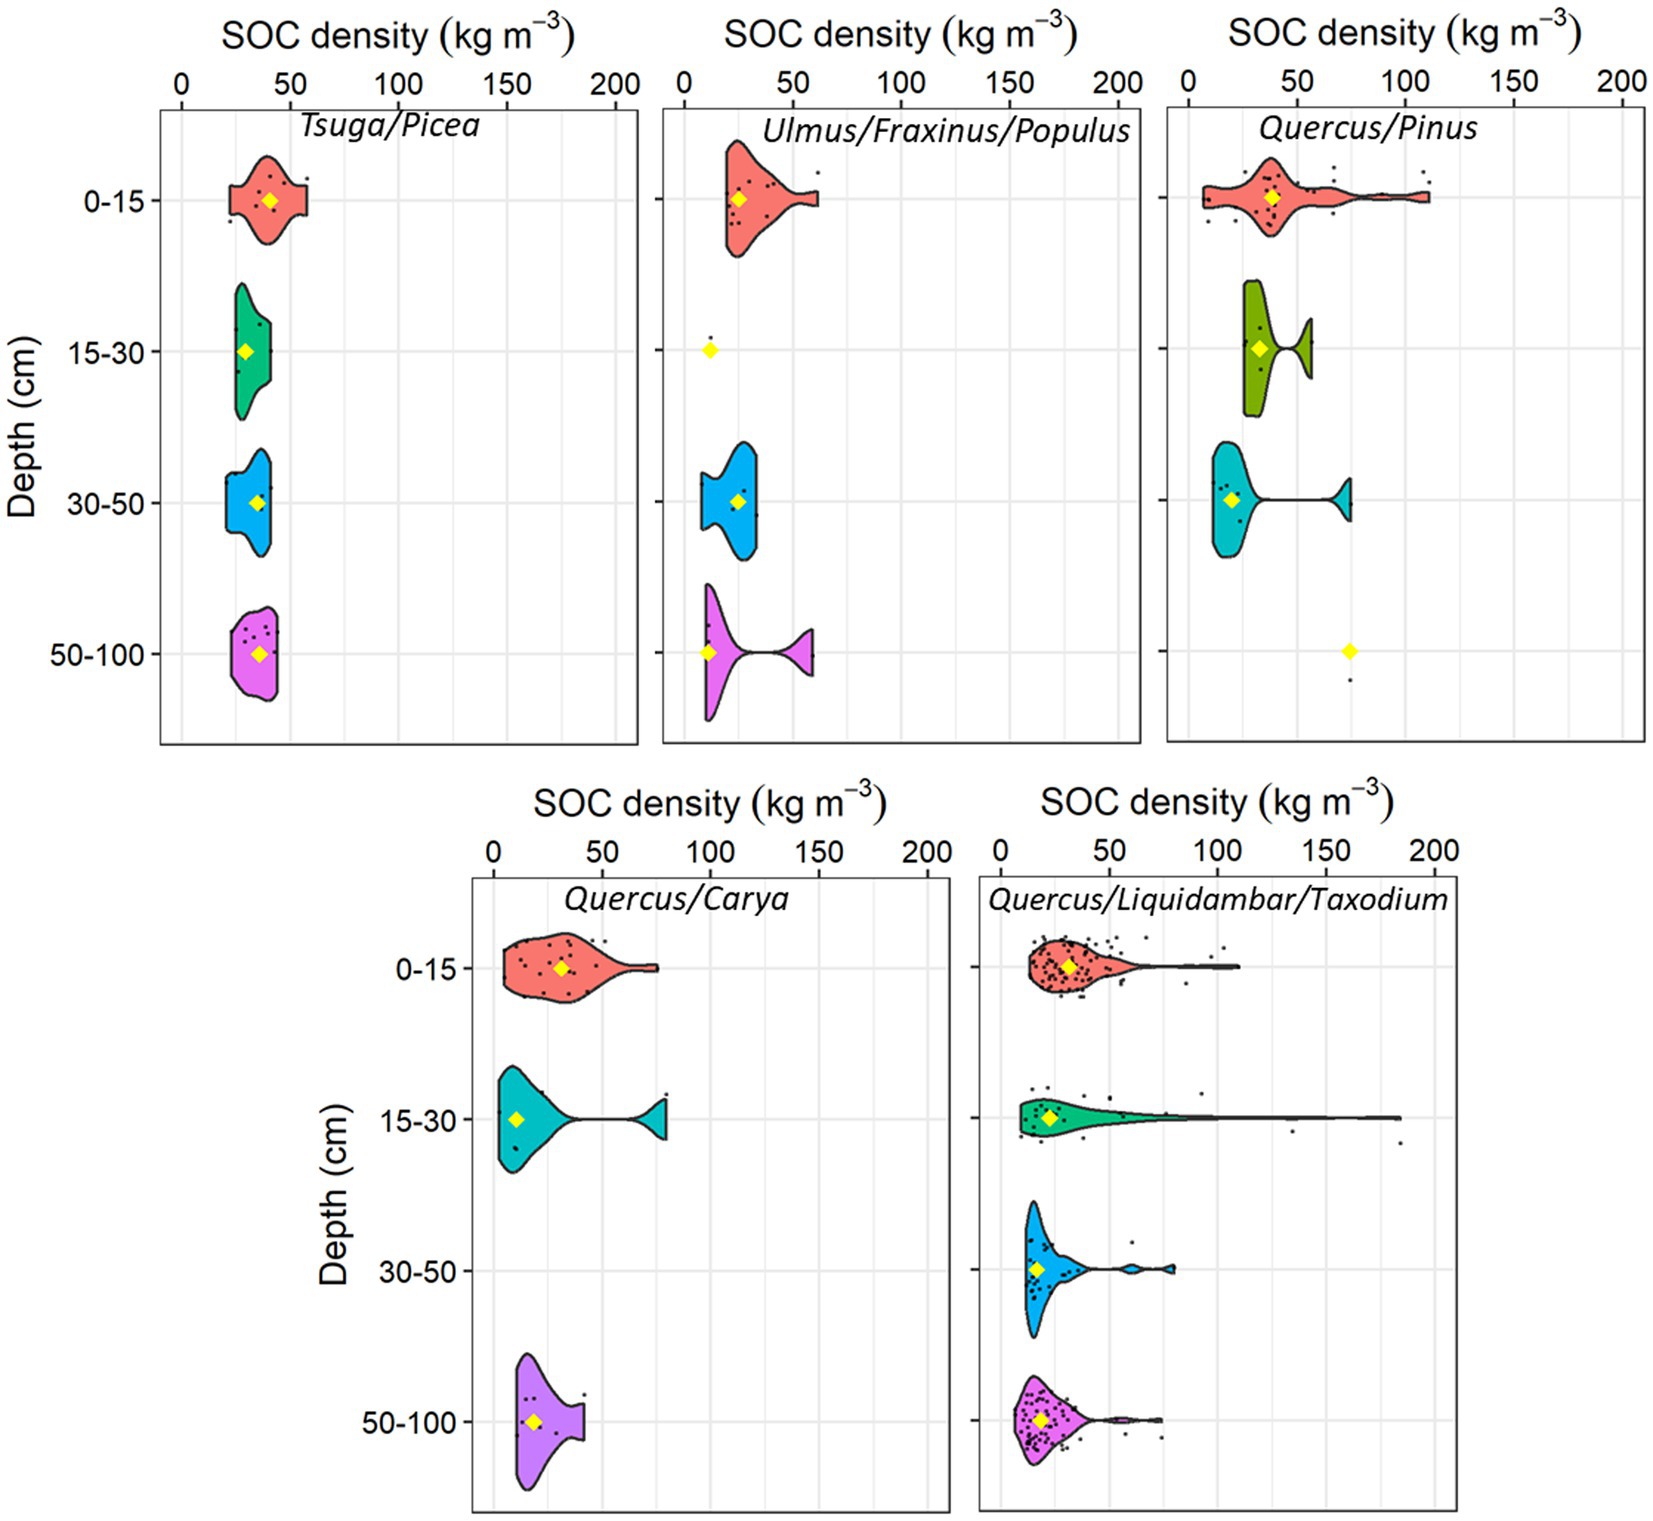
Figure 5. Frequency plots showing the distribution of CONUS forested wetland soil organic carbon (SOC) density by soil depth intervals at different forest type groups. The yellow diamond identifies the median value within each depth interval, black points indicate the density/frequency of available data.
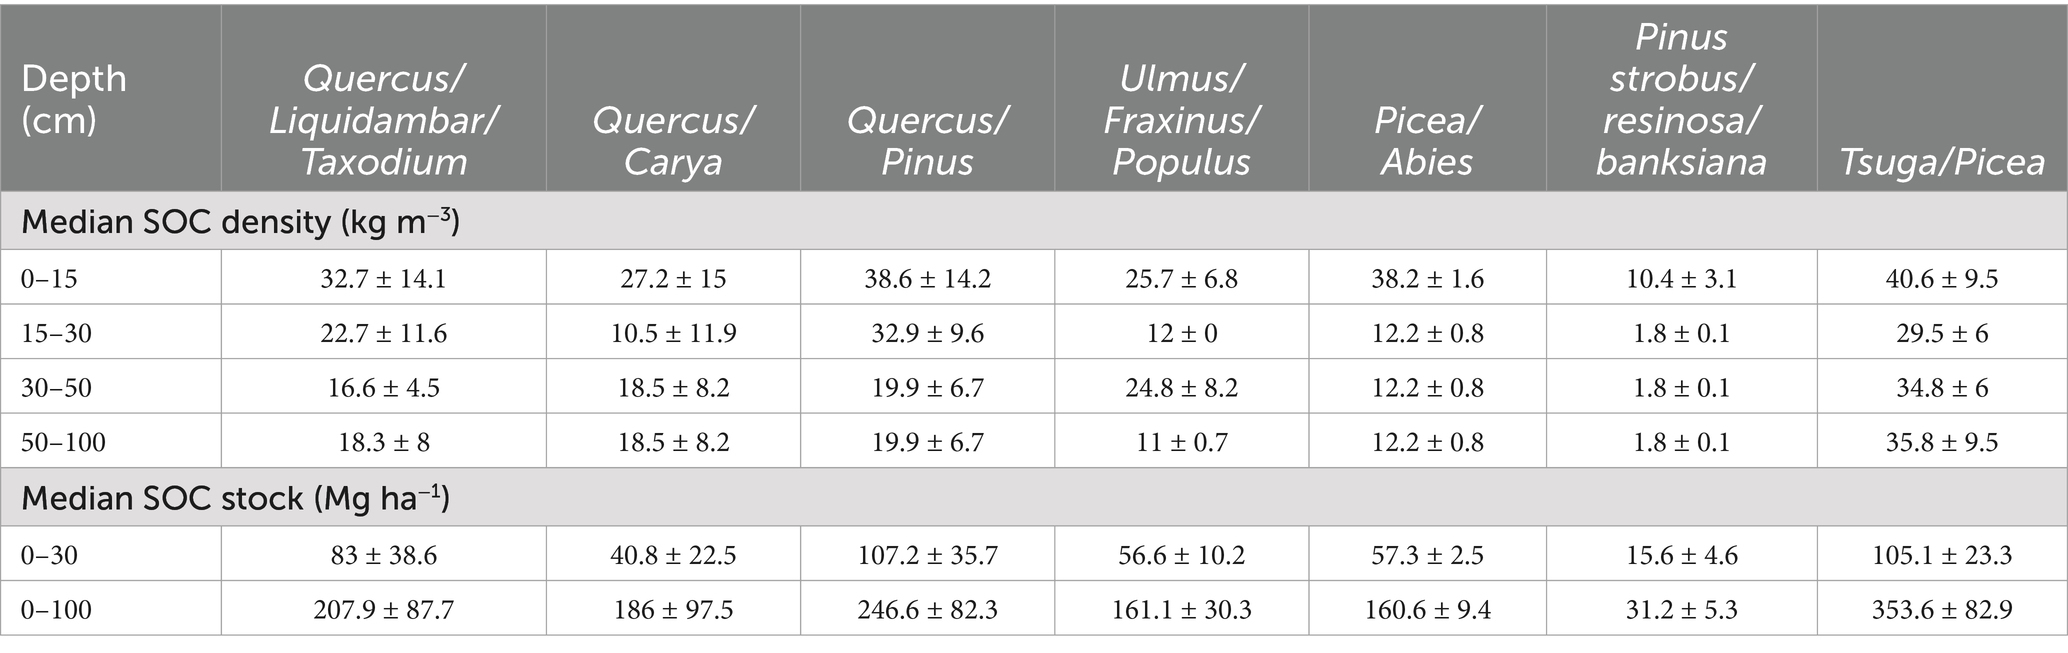
Table 5. CONUS median (± median absolute deviation) soil organic carbon (SOC) density and SOC stock at different depth intervals for forest type groups.
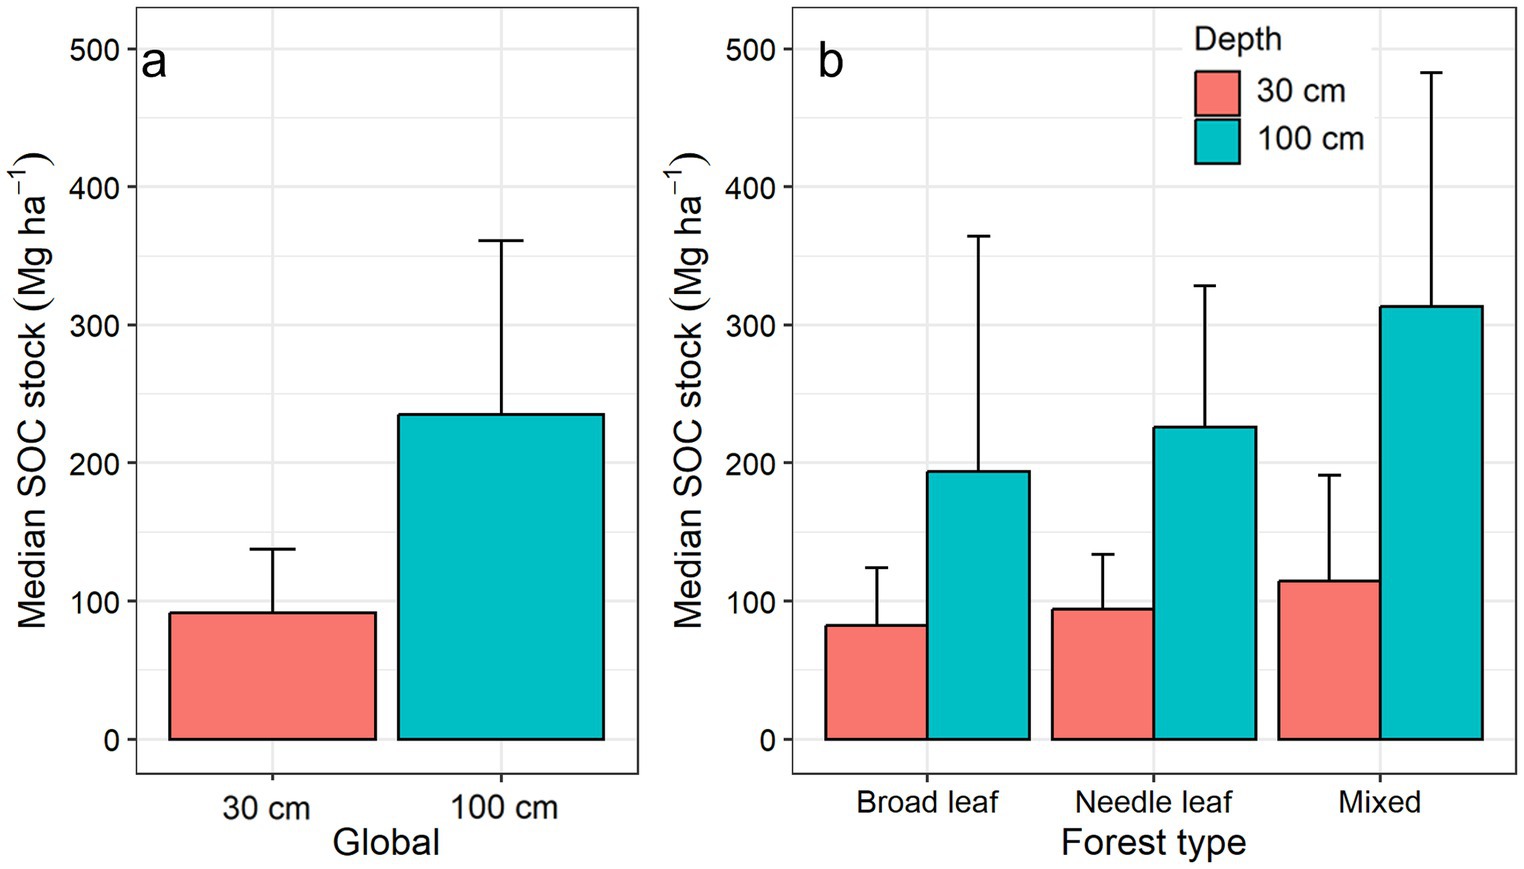
Figure 6. (a) Global median freshwater forested wetland soil organic carbon (SOC) stock in the top 30 cm and 100 cm of soil, (b) SOC stock in the top 30 cm and 100 cm of soil in broad leaf, needle leaf and mixed type of forested wetlands. The error bar indicates the median absolute deviation.
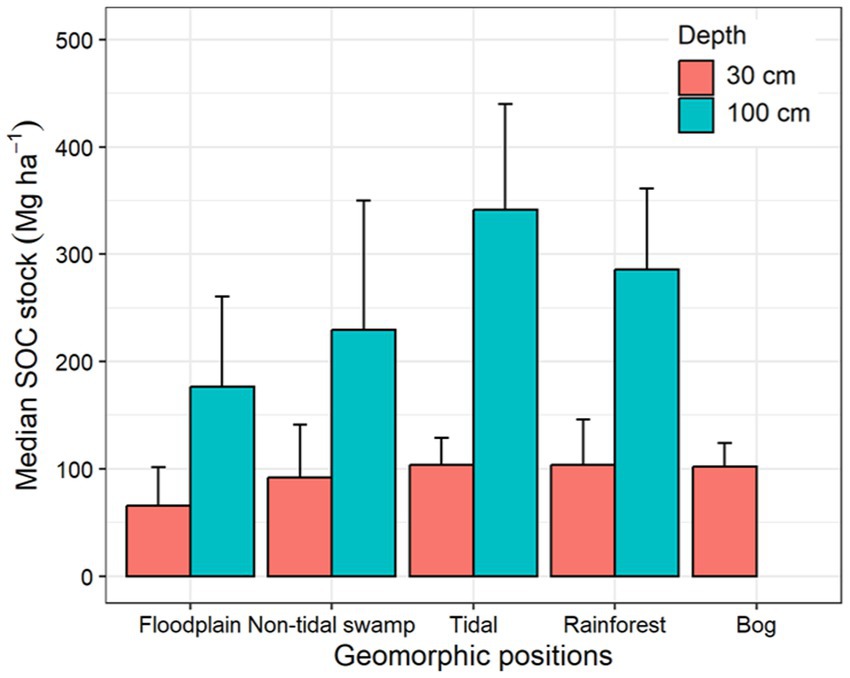
Figure 7. Median soil organic carbon (SOC) stock in the top 30 cm and 100 cm of soil in different freshwater forested wetland geomorphic settings. The error bars show median absolute deviation.
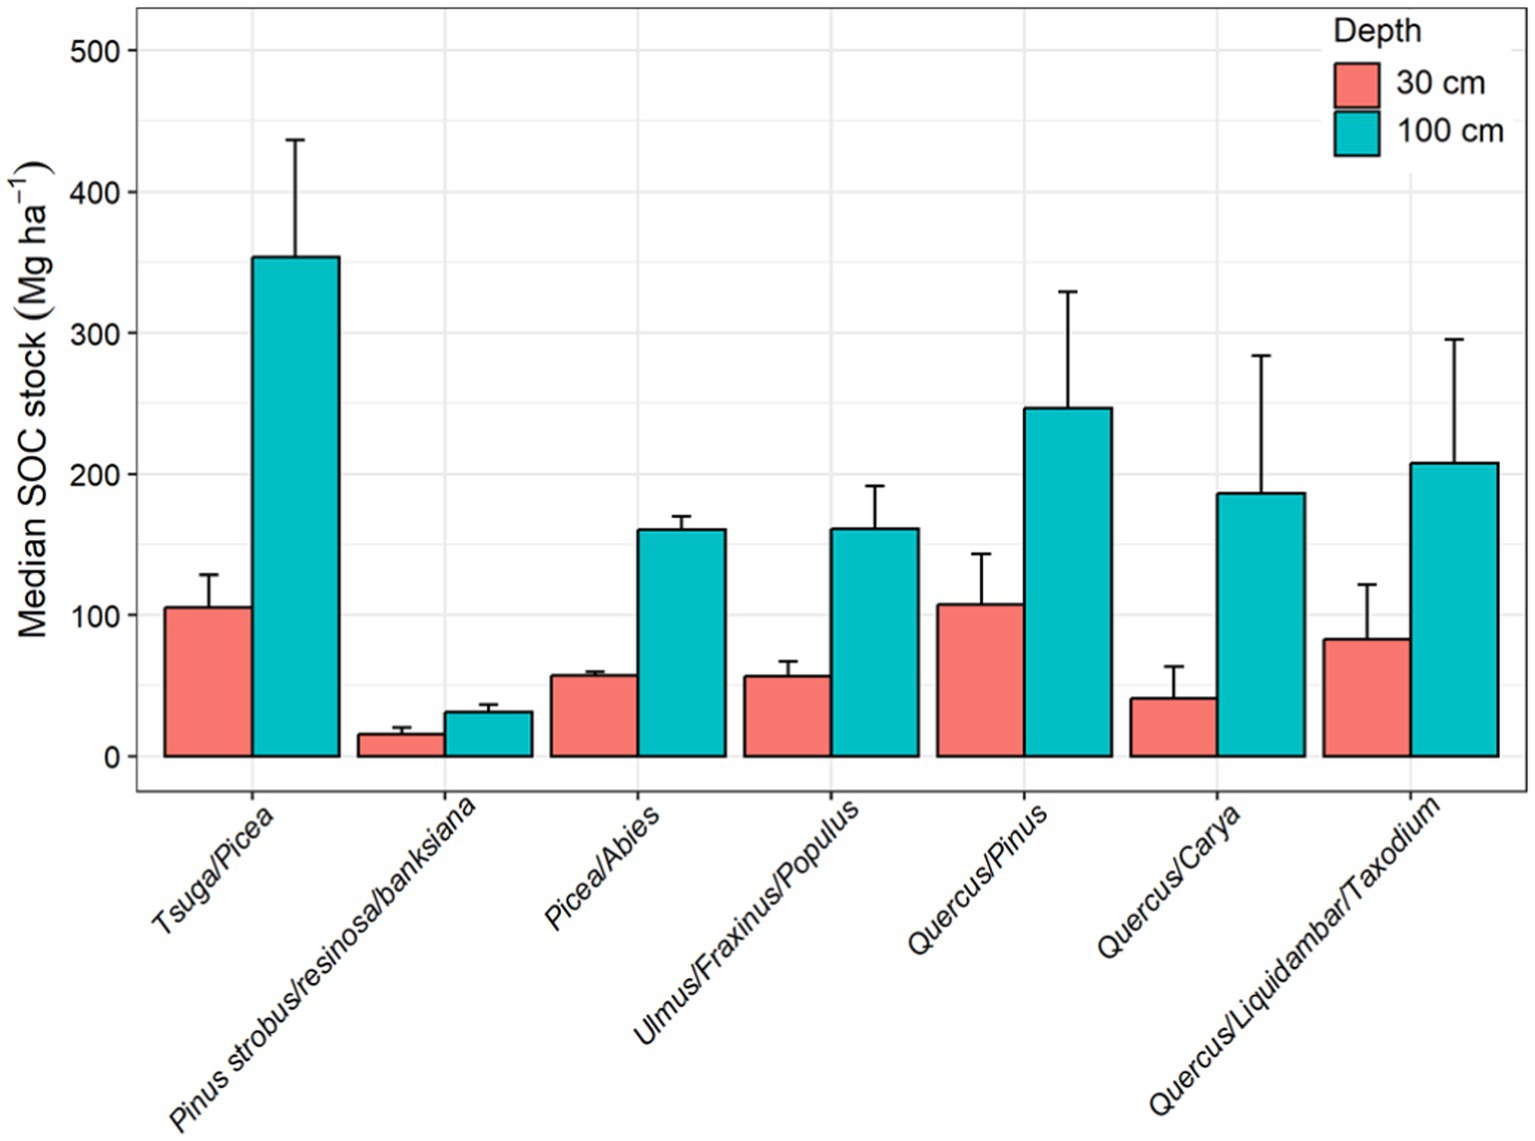
Figure 8. Median soil organic carbon (SOC) stock in the top 30 cm and 100 cm of soil in different forest type groups in the CONUS. The forest type groups are arranged based on their spatial location starting from the eastern CONUS to the western CONUS. The error bars show median absolute deviation.
Similarly, the temperate Tsuga/Picea group had the highest median SOC stock (353.6 ± 82.9 Mg ha−1) in the upper 1 m of soil followed by oak/pine (246.6 ± 82.3 Mg ha−1) and Quercus/Liquidambar/Taxodium group (207.9 ± 87.7 Mg ha−1), potentially driven by variability in degradability of the litter and regional climatic factors (Table 5; Figure 8). Studies have shown that coniferous forested wetlands have greater SOC stock than mixed deciduous forested wetlands (Byun et al., 2022; Jandl et al., 2021). The recalcitrant needles of the Tsuga/Picea and Quercus/Pinus groups result in higher SOC stock. In addition, the Tsuga/Picea forest type is primarily located in the Pacific Northwest (PNW) region of the US and Canada, where the temperate climate and recalcitrant needle-leaved trees are dominant features of many forested wetlands. Conversely, deciduous oak forests (e.g., Quercus/Liquidambar/Taxodium, Quercus/Carya) produce more labile leaf litter and occur in warmer climates with more mineral, fine textured sediments (e.g., floodplains) resulting in the lower SOC stocks compared to the Tsuga/Picea group. In addition, the seasonal water table declines in deciduous oak forests promote decomposition, reducing carbon stocks. For example, Batson et al. (2015) reported lower CO2 emissions due to SOC decomposition in more frequently inundated backswamps and toe slopes, along with higher decomposition rates in well-drained levees of the forested floodplain wetlands.
3.5 Forested wetland SOC stock variation in natural and restored sites
The number of natural forested wetland study sites (286) was greater than the restored forested study sites (44). The stand age of the restored sites ranged from 3–33 years with a median age of 16 years. The median SOC density was greater at natural sites than at restored sites at all depth intervals (Supplementary Table 5). Similarly, median SOC stock at the top 1 m soil was greater in natural forested wetland sites (236.1 ± 129.9 Mg C ha−1) than in restored forested wetland sites (147.6 ± 100.6 Mg C ha−1). This variation in SOC stock is likely primarily related to the stand age (Lal, 2005). In addition, lower soil moisture content in the restored sites compared to the natural sites may explain the lower SOC stock in restored sites. The restored sites are accumulating SOC stocks, but will require additional time to reach the SOC levels observed at natural sites. The carbon dynamics in forested wetland systems have been studied on a chronosequence approach rather than long-term studies at the same site; however, available data suggests that while the carbon profile of restored areas becomes more similar to natural reference areas over decadal timescales restoration sites remain on unique carbon resource trajectories (Lal, 2005; Berkowitz et al., 2015; Abbott et al., 2019; Berkowitz et al., 2022). The natural forested wetlands store SOC sequestered for decades to centuries but are vulnerable to loss due to natural and anthropogenic threats. The conservation and restoration of these wetlands could preserve the long-term SOC stocks which otherwise are prone to decomposition and carbon dioxide emission (Sapkota and White, 2021). As a result, the creation or restoration of wetlands in strategic locations that protects established, at-risk forested wetland carbon can provide an actionable mechanism to increase additionality benefits within a carbon accounting framework.
3.6 Synthesis
Forested wetlands contain ~19% of the organic carbon stored in forested landscapes, despite occurring on only 5% of the forested landmass (Lal, 2005). SOC is one of the most significant carbon pools in forested landscapes. Almost two-thirds of the terrestrial organic carbon in the forested ecosystem is contained in soils, with a higher proportion stored in freshwater forested wetland soils when compared to non-wetland forest soils (Dixon et al., 1994; Lal, 2005). However, the remote sensing techniques used to account for biomass (and soil) carbon often fail to effectively differentiate between wetland and upland forests due to canopy cover that constrains our ability to document saturated or inundated soils. Collectively, this results in underestimates of forested wetland SOC stocks in many instances. For example, Stewart et al. (2024) found that the forested wetland SOC stock in the upper 100 cm soil profile has been underestimated by 482% in the Hoh River Watershed (area = 68,145 ha) in the Pacific Northwest of the U.S. We derived forested wetlands global median (± median absolute deviation) SOC stocks of 237.5 ± 126.4 Mg C ha−1 in the top 100 cm of the soil profile which is substantially greater than the SOC stock estimate of the non-wetland forest soils (180 ± 82 Mg C ha−1; Lal, 2005). The SOC stock we derived was variable across forest types, forest type groups (CONUS), geomorphic and ecological settings, soil depths, and management types. The variability within each group were also larger. The magnitude of forest SOC stocks depend on complex interactions between climate effects, soils, tree species composition, management, and the quality of forest litter (Lal, 2005). Thus, considering the major sources of variability may help better estimate SOC stocks in forested wetlands.
Our dataset indicates that SOC studies in the forested soils are disproportionally concentrated toward the soil surface (0–30 cm). However, we found that forested wetlands, like other wetland types, produce long-term SOC stocks and most long-term SOC storage occurs >30 cm below the soil surface (Nahlik and Fennessy, 2016; Holmquist et al., 2018). As a result, limiting carbon stock accounting to the upper soil profile (e.g., < 30 cm) vastly underestimates carbon stock in wetlands (Nahlik and Fennessy, 2016). Understanding carbon dynamics in forested wetlands, and properly accounting SOC stocks, can help estimate role of forested wetlands in carbon sequestration and effectively manage carbon resources (Dai et al., 2023).
Globally, approximately 216 Pg of organic carbon is stored in the top 100 cm of the forested wetland soils (Table 6), representing approximately 28.4% of the atmospheric carbon concentration (760 Pg; Lal, 2008). The SOC stored in forested wetland soils plays an important role in regulating carbon cycling, and uncertainty persists as to how forested wetland carbon pools and fluxes may change in response to perturbations (Bridgham et al., 2006). However, forested wetland ecosystems are vulnerable to erosion, management activities (i.e., drainage, logging), and other changes in the quality and quantity of water moving through these systems which alter the hydrologic cycle, forest litter characteristics, or other factors (Trettin et al., 2006). Additionally, areas subject to saltwater intrusion into tidal freshwater forested wetlands, which occupy the upper intertidal zone between upland nontidal hardwood forests and tidal marsh, may be subject to reduced carbon stocks (Cormier et al., 2013). Saltwater intrusion has been shown to degrade freshwater forested wetlands, affecting SOC cycling and storage (Krauss et al., 2018). The strategic conservation and restoration of forested wetlands with high SOC densities such as Tsuga/Picea, Quercus/Pinus, and Quercus/Liquidambar/Taxodium communities, provides a potential mechanism to maintain and expand carbon resources from wetland drainage, drought, or degradation (Nahlik and Fennessy, 2016).
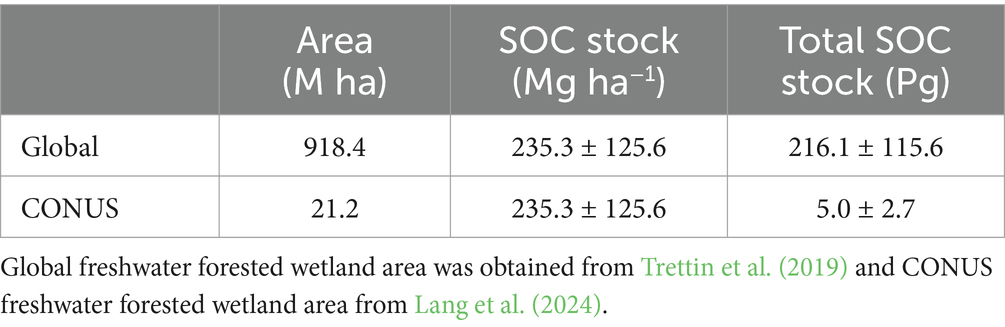
Table 6. Estimated total soil organic carbon (SOC) stock in global and CONUS freshwater forested wetlands.
This synthesis was able to capture the SOC stock variabilities among and between forest types, geomorphic and ecological settings and forest type groups (CONUS). However, caution should be used in global-scale interpretation of these results, as the available literature were concentrated in the CONUS (70%) or North America (80%). Our findings identified research gaps in field studies, especially outside CONUS, focused on SOC stocks in forested wetlands. In addition, the factors that may control SOC stock variabilities within geomorphic settings or forest type groups, such as precipitation regime, temperature, soil moisture, sedimentation rates and water table depths, were not analyzed in this study. Future synthesis may focus on the drivers of SOC stock variabilities in different geomorphic settings and forest type groups.
3.7 Implications for carbon markets and carbon accounting models
Forested wetland landscapes have been increasingly identified as hot spots for nature-based solutions to a variety of challenges due to their carbon sequestration potential as aboveground plant biomass and belowground soil organic carbon storage resources (Sapkota and White, 2020; Robertson et al., 2022). Land managers (private, public, or government) can benefit from the adoption of nature-based solutions by generating carbon credits for sale in carbon markets, generating additional income [United States Department of Agriculture (USDA), 2023]. However, accurate carbon accounting for crediting purposes in the forested landscape has always been (and remains) challenging due to the lack of effective remote sensing techniques to account for SOC stocks, coupled with the need to demonstrate management benefits within the framework for rating and quantifying carbon resource additionality (Sapkota and White, 2020). This challenge has been further elevated in the forested wetland system due to the lack of accurate techniques to delineate forested wetlands at large scales. The measurement difficulties coupled with validation and verification challenges of the carbon credit projects further inhibit the realization of these carbon offset benefits (Mack et al., 2021). Despite these challenges, the forestry sector dominates the carbon credit market (58% of the issued carbon credits) in the U.S [United States Department of Agriculture (USDA), 2023]. This forested wetland SOC literature synthesis highlights consideration of forested wetlands in the carbon credit market.
A wide array of private corporations, non-profit organizations, and governments seek to manage wetlands as carbon assets and resources (Mack et al., 2021; Sapkota and White, 2020). In particular, the capacity of wetlands to serve as nature-based solutions for managing carbon dynamics has received increased attention (Creed et al., 2022). Organizations with substantial wetland extents have recognized the potential benefits of managing wetlands for a variety of environmental and societal outcomes, including flood risk reduction and water quality improvements. For example, the U.S. Department of Defense (DoD) manages >12 M ha of land encompassing many diverse wetland ecosystems, including forested wetlands that store large soil carbon stocks (Larson et al., 2017; Trettin and Jurgensen, 2002). The DoD expressed interest in enhancing carbon resources on its lands (Department of Defense, 2023). For example, the Department of Navy (a DoD organization) committed to the implementation of additional nature-based solutions by 2027 (Department of the Navy, 2022). Forested wetlands have been highlighted in these initiatives and those undertaken by other large organizations (Department of Defense, 2023; GHGMMIS, 2023).
Carbon stock assessments at the state, ecoregion, and CONUS scale have been primarily focused on terrestrial ecosystems (Liu et al., 2016; Sleeter et al., 2019; Selmants et al., 2021; Sleeter et al., 2022). However, given recent prioritization of wetlands in nature-based solution planning, there is increased effort to update these terrestrial models for application in wetland ecosystems. For example, the Land Use and Carbon Scenario Simulator (LUCAS) developed by the U.S. Geological Survey for forested ecosystems is a comprehensive modeling framework that assesses the impact of changes in climate and land cover on ecosystem carbon storage and fluxes. The LUCAS framework couples a State-and-Transition Simulation Model (STSM) to track changes in land cover, with a Stock and Flow Model based on the CBM-CFS3 (Kurz et al., 2009) to estimate carbon storage and flux across labile and recalcitrant pools (Daniel et al., 2016; Sleeter et al., 2022; Sleeter et al., 2017; Daniel et al., 2018). Models, like LUCAS, that estimate the carbon consequences of land change require accurate land cover classification to avoid uncertainties associated with misclassification of wetland forest as upland forest.
Furthermore, improved forested wetland carbon model development requires the estimation of SOC stocks in different forest types (e.g., wet pine savannah, cypress-tupelo swamp). However, the lack of widely accepted remote sensing techniques to estimate soil carbon densities coupled with challenges associated with the uncertainties of accurate canopy coverage mapping increases the complexity of estimating SOC densities across forested wetland ecosystems. The Soil Survey Geographic Database (SSURGO) is one of the most widely used database containing soil carbon stocks available in the U.S. at regional and national scales, but studies report large uncertainties in predicting SOC stock using this tool (Uhran et al., 2021). The synthesis presented herein provides improved estimates of SOC stocks in different forest type groups, which can enhance forested wetland carbon modeling at broad scales. This synthesis further suggests consideration of geomorphic settings and forest types (needle vs. broad leaf), in addition to CONUS forest type groups, to better account for variation in SOC stocks in carbon accounting models.
Proper identification of forested wetlands and adequate measurement of SOC stocks can help to deliver effective carbon accounting models of SOC stocks and forecasting future scenarios. Accounting of SOC in forested wetland landscapes can be improved with (1) better techniques to delineate forested wetlands, (2) accounting for SOC stocks in the upper 100 cm of the soil profile (or deeper), (3) refining the recalcitrance and thus the permanence of the SOC in forested wetland landscapes, (4) evaluating how SOC respond to environmental perturbations such as drought, fire, and storm surges, and (5) accounting of the SOC stocks preserved by restoration and conservation efforts which would otherwise be lost as the result of degradation, erosion, respiration (i.e., additionality).
4 Conclusion
Freshwater forested wetland soil stores a large amount of organic carbon in the top 100 cm of the soil profile compared to non-wetland forests. Freshwater forested wetland SOC storage is different among geomorphic settings, forest types (needle vs. broad leaf), and CONUS forest type groups, indicating consideration of geomorphic locations and forest species composition in carbon accounting models. Proper delineation of forested wetlands would likely account for underestimated SOC stocks in forested ecosystems around the world. The appropriate accounting of forested wetland SOC stocks supports informed management of carbon resources, opportunities to improve the operation of natural resource marketplaces, and the delivery of multiple ecological functions and services (e.g., flood water retention, improved water quality) that can benefit society.
Data availability statement
The original contributions presented in the study are included in the article/Supplementary material, further inquiries can be directed to the corresponding author.
Author contributions
YS: Conceptualization, Data curation, Formal analysis, Investigation, Methodology, Writing – original draft. JB: Conceptualization, Funding acquisition, Supervision, Writing – review & editing. CS: Conceptualization, Supervision, Writing – review & editing. RB: Conceptualization, Funding acquisition, Supervision, Writing – review & editing.
Funding
The author(s) declare that no financial support was received for the research and/or publication of this article.
Acknowledgments
We acknowledge Andre Rovai, Ken Krauss, and Greg Noe for their review of this manuscript. Any use of trade, firm, or product names is for descriptive purposes only and does not imply endorsement by the U.S. Government. The funding for this research was provided by Carbon Sequestration Toolkit for DoD Lands project in the U.S. Army 6.4 VEQT Program and U.S. Geological Survey, Ecosystems Mission Area, Land Management Research Program and LandCarbon Program.
Conflict of interest
The authors declare that the research was conducted in the absence of any commercial or financial relationships that could be construed as a potential conflict of interest.
Generative AI statement
The authors declare that no Gen AI was used in the creation of this manuscript.
Publisher’s note
All claims expressed in this article are solely those of the authors and do not necessarily represent those of their affiliated organizations, or those of the publisher, the editors and the reviewers. Any product that may be evaluated in this article, or claim that may be made by its manufacturer, is not guaranteed or endorsed by the publisher.
Supplementary material
The Supplementary material for this article can be found online at: https://www.frontiersin.org/articles/10.3389/ffgc.2025.1528440/full#supplementary-material
References
Abbott, K. M., Elsey-Quirk, T., and DeLaune, R. D. (2019). Factors influencing blue carbon accumulation across a 32-year chronosequence of created coastal marshes. Ecosphere 10:e02828. doi: 10.1002/ecs2.2828
Adame, M. F., Cherian, S., Reef, R., and Stewart-Koster, B. (2017). Mangrove root biomass and the uncertainty of belowground carbon estimations. For. Ecol. Manag. 403, 52–60. doi: 10.1016/j.foreco.2017.08.016
Adame, M. F., Kelleway, J., Krauss, K. W., Lovelock, C. E., Adams, J. B., Trevathan-Tackett, S. M., et al. (2024). All tidal wetlands are blue carbon ecosystems. Bioscience 74, 253–268. doi: 10.1093/BIOSCI/BIAE007
Akanil, N., and Middleton, B. (2011). Leaf litter decomposition along the Porsuk River, Eskisehir, Turkey. Canadian J. Botany 75, 1394–1397. doi: 10.1139/b97-853
Batson, J., Noe, G. B., Hupp, C. R., Krauss, K. W., Rybicki, N. B., and Schenk, E. R. (2015). Soil greenhouse gas emissions and carbon budgeting in a short-hydroperiod floodplain wetland. J. Geophys. Res. Biogeo. 120, 77–95. doi: 10.1002/2014JG002817
Berkowitz, J. F., Beane, N. R., Hurst, N. R., Jung, J. F., and Philley, K. D. (2022). A multidecadal assessment of dredged sediment beneficial use outcomes part 1: ecological outcomes. J. Dredging 20, 54–75.
Berkowitz, J., Bene, N. R., Evans, D. E., Suedel, B., and Corbino, J. M. (2015). Ecological survey of a dredged material-supported wetland in the Atchafalaya River, Louisiana: an engineering with nature case study. Wetland Sci. Pract. 31, 14–18. doi: 10.1672/UCRT083-285
Bridgham, S. D., Megonigal, J. P., Keller, J. K., Bliss, N. B., and Trettin, C. (2006). The carbon balance of North American wetlands. Wetlands 26, 889–916. doi: 10.1672/0277-5212(2006)26[889:TCBONA]2.0.CO;2
Brinson, M. M. (1993). A hydrogeomorphic classification for wetlands. Wetlands 5, 181–190. doi: 10.1007/BF03160796
Brinson, M. M. (2009). “The United States HGM (hydrogeomorphic) approach” in The wetlands handbook. eds. E. Maltby and T. Barker (Hoboken, NJ: John Wiley & Sons), 486–512.
Byun, E., Cowling, S. A., and Finkelstein, S. A. (2022). Holocene regional climate change and formation of southern Ontario’s largest swamp inferred from a kettle-lake pollen record. Quat. Res. 106, 56–74. doi: 10.1017/QUA.2021.54
Cormier, N., Krauss, K. W., and Conner, W. H. (2013). Periodicity in stem growth and litterfall in tidal freshwater forested wetlands: influence of salinity and drought on nitrogen recycling. Estuar. Coasts 36, 533–546. doi: 10.1007/s12237-012-9505-z
Cornwell, W. K., Cornelissen, J. H. C., Amatangelo, K., Dorrepaal, E., Eviner, V. T., Godoy, O., et al. (2008). Plant species traits are the predominant control on litter decomposition rates within biomes worldwide. Ecol. Lett. 11, 1065–1071. doi: 10.1111/j.1461-0248.2008.01219.x
Cowardin, L. M., Carter, V., Golet, F. C., and LaRoe, E. T. (1979). Classification of wetlands and Deepwater habitats of the United States. Washington, DC: U.S. Department of the Interior, Fish and Wildlife Service.
Creed, I. F., Badiou, P., Enanga, E., Lobb, D. A., Pattison-Williams, J. K., Lloyd-Smith, P., et al. (2022). Can restoration of freshwater mineral soil wetlands deliver nature-based climate solutions to agricultural landscapes? Front. Ecol. Evol. 10:932415. doi: 10.3389/fevo.2022.932415
D’Amore, D. V., Edwards, R. T., Herendeen, P. A., Hood, E., and Fellman, J. B. (2015). Dissolved organic carbon fluxes from hydropedologic units in Alaskan coastal temperate rainforest watersheds. Soil Sci. Soc. Am. J. 79, 378–388. doi: 10.2136/SSSAJ2014.09.0380
Dai, Z., Trettin, C. C., Burton, A. J., Tang, W., and Mangora, M. M. (2023). Estimated mangrove carbon stocks and fluxes to inform MRV for REDD+ using a process-based model. Estuar. Coast. Shelf Sci. 294:108512. doi: 10.1016/j.ecss.2023.108512
Daniel, C. J., Frid, L., Sleeter, B. M., and Fortin, M. J. (2016). State-and-transition simulation models: a framework for forecasting landscape change. Methods Ecol. Evol. 7, 1413–1423. doi: 10.1111/2041-210X.12597
Daniel, C. J., Sleeter, B. M., Frid, L., and Fortin, M. J. (2018). Integrating continuous stocks and flows into state-and-transition simulation models of landscape change. Methods Ecol. Evol. 9, 1133–1143. doi: 10.1111/2041-210X.12952
Davidson, S. J., Dazé, E., Byun, E., Hiler, D., Kangur, M., Talbot, J., et al. (2022). The unrecognized importance of carbon stocks and fluxes from swamps in Canada and the USA. Environ. Res. Lett. 17:053003. doi: 10.1088/1748-9326/AC63D5
Davidson, N. C., Fluet-Chouinard, E., and Finlayson, C. M. (2018). Global extent and distribution of wetlands: trends and issues. Mar. Freshw. Res. 69, 620–627. doi: 10.1071/MF17019
Day, F. P., and Megonigal, J. P. (1993). The relationship between variable hydroperiod, production allocation, and belowground organic turnover in forested wetlands. Wetlands 13, 115–121. doi: 10.1007/BF03160871
Department of Defense. (2023). Department of Defense Plan to reduce greenhouse gas emissions. Office of the under Secretary of defense for acquisition and sustainment.
Department of the Navy (2022). Department of the Navy Climate Action 2030. Department of the Navy, Office of the Assistant Secretary of the navy for energy, installations, and environment. Washington, DC: Department of the Navy.
Dixon, R. K., Brown, S., Houghton, R. A., Solomon, A. M., Trexler, M. C., and Wisniewski, J. (1994). Carbon pools and flux of global forest ecosystems. Science 263, 185–190. doi: 10.1126/science.263.5144.185
Ensign, S. H., Noe, G. B., and Hupp, C. R. (2014). Linking channel hydrology with riparian wetland accretion in tidal rivers. J. Geophys. Res. Earth 119, 28–44. doi: 10.1002/2013JF002737
Euliss, N. H., Labaugh, J. W., Fredrickson, L. H., Mushet, D. M., Laubhan, M. K., Swanson, G. A., et al. (2004). The wetland continuum: a conceptual framework for interpreting biological studies. Wetlands 24, 448–458. doi: 10.1672/0277-5212(2004)024[0448:TWCACF]2.0.CO;2
Francl, K., Ford, W., and Castleberry, S. (2004). Characterization of high elevation central Appalachian wetlands. Newtown Square, PA: U.S. Department of Agriculture, Forest Service, northeastern Research Station.
GHGMMIS (2023). U.S. greenhouse gas measurement, monitoring, and information system. A report by the greenhouse gas monitoring and measurement interagency working group. Washington, DC: The White House.
Hansen, V. D., and Nestlerode, J. A. (2014). Carbon sequestration in wetland soils of the northern Gulf of Mexico coastal region. Wetl. Ecol. Manag. 22, 289–303. doi: 10.1007/s11273-013-9330-6
Heger, A., Becker, J. N., Navas, L. K. V., and Eschenbach, A. (2021). Factors controlling soil organic carbon stocks in hardwood floodplain forests of the lower middle Elbe River. Geoderma 404:115389. doi: 10.1016/j.geoderma.2021.115389
Holmquist, J. R., Windham-Myers, L., Bliss, N., Crooks, S., Morris, J. T., Megonigal, J. P., et al. (2018). Accuracy and precision of tidal wetland soil carbon mapping in the conterminous United States. Sci. Rep. 8, 1–16. doi: 10.1038/s41598-018-26948-7
Jandl, R., Ledermann, T., Kindermann, G., and Weiss, P. (2021). Soil organic carbon stocks in mixed-deciduous and coniferous forests in Austria. Front. Forests Global Change 4:688851. doi: 10.3389/ffgc.2021.688851
Kauffman, J. B., Giovanonni, L., Kelly, J., Dunstan, N., Borde, A., Diefenderfer, H., et al. (2020). Total ecosystem carbon stocks at the marine-terrestrial interface: blue carbon of the Pacific northwest coast, United States. Global Change Biol. 26, 5679–5692. doi: 10.1111/GCB.15248
Krauss, K. W., Noe, G. B., Duberstein, J. A., Conner, W. H., Stagg, C. L., Cormier, N., et al. (2018). The role of the upper tidal estuary in wetland blue carbon storage and flux. Glob. Biogeochem. Cycles 32, 817–839. doi: 10.1029/2018GB005897
Kurz, W. A., Dymond, C. C., White, T. M., Stinson, G., Shaw, C. H., Rampley, G. J., et al. (2009). CBM-CFS3: A model of carbon-dynamics in forestry and land-use change implementing IPCC standards. Ecological Modelling. 220, 480–504. doi: 10.1016/J.ECOLMODEL.2008.10.018
Lal, R. (2005). Forest soils and carbon sequestration. For. Ecol. Manag. 220, 242–258. doi: 10.1016/J.FORECO.2005.08.015
Lal, R. (2008). Carbon sequestration. Philos. Trans. Royal Soc. B 363, 815–830. doi: 10.1098/RSTB.2007.2185
Lang, M. W., Ingebritsen, J. C., and Griffin, R. K. (2024). Status and trends of wetlands in the conterminous United States 2009 to 2019. Washington, DC: U.S. Department of the Interior; Fish and Wildlife Service, 43.
Larson, S. L., Martin, W. A., Medina, V. F., Busby, R., Hiemstra, C. A., Seman, P. M., et al. (2017). Sustainable carbon dioxide sequestration as soil carbon to achieve carbon neutral status for DoD lands. Hanover, NH: US Army Engineer Research and Development Center, Environmental Laboratory, Construction Engineering Research Laboratory, Cold Regions Research and Engineering Laboratory.
Liu, J., Sleeter, B. M., Zhu, Z., Heath, L. S., Tan, Z., Wilson, T. S., et al. (2016). Estimating carbon sequestration in the piedmont ecoregion of the United States from 1971 to 2010. Carbon Balance Manag. 11:10. doi: 10.1186/s13021-016-0052-y
Mack, S. K., Lane, R. R., Cowan, R., and Cole, J. W. (2021). “Status and challenges of wetlands in carbon markets” in eds. K. W. Krauss, Z. Zhu, and C. L. Stagg. Washington, D.C., USA Wetland carbon and environmental management. doi: 10.1002/9781119639305.ch23
Maxwell, T. L., Rovai, A. S., Adame, M. F., Adams, J. B., Álvarez-Rogel, J., Austin, W. E. N., et al. (2023). Global dataset of soil organic carbon in tidal marshes. Scientific Data 10, 797–714. doi: 10.1038/s41597-023-02633-x
McLeod, E., Chmura, G. L., Bouillon, S., Salm, R., Björk, M., Duarte, C. M., et al. (2011). A blueprint for blue carbon: toward an improved understanding of the role of vegetated coastal habitats in sequestering CO2. Front. Ecol. Environ. 9, 552–560. doi: 10.1890/110004
McNicol, G., Bulmer, C., D’Amore, D., Sanborn, P., Saunders, S., Giesbrecht, I., et al. (2019). Large, climate-sensitive soil carbon stocks mapped with pedology-informed machine learning in the North Pacific coastal temperate rainforest. Environ. Res. Lett. 14:aaed52. doi: 10.1088/1748-9326/aaed52
Middleton, B. A. (2020). Trends of litter decomposition and soil organic matter stocks across forested swamp environments of the southeastern US. PLoS One 15, e0226998–e0226923. doi: 10.1371/journal.pone.0226998
Morris, J. T., Barber, D. C., Callaway, J. C., Chambers, R., Hagen, S. C., Hopkinson, C. S., et al. (2016). Contributions of organic and inorganic matter to sediment volume and accretion in tidal wetlands at steady state. Earth’s Future 4, 110–121. doi: 10.1002/2015EF000334
Mudd, S. M., Howell, S. M., and Morris, J. T. (2009). Impact of dynamic feedbacks between sedimentation, sea-level rise, and biomass production on near-surface marsh stratigraphy and carbon accumulation. Estuar. Coast. Shelf Sci. 82, 377–389. doi: 10.1016/j.ecss.2009.01.028
Nahlik, A. M., and Fennessy, M. S. (2016). Carbon storage in US wetlands. Nat. Commun. 7, 1–9. doi: 10.1038/ncomms13835
Naiman, R. J., Bechtold, J. S., Beechie, T. J., Latterell, J. J., and Van Pelt, R. (2010). A process-based view of floodplain forest patterns in coastal river valleys of the Pacific Northwest. Ecosystems 13, 1–31. doi: 10.1007/s10021-009-9298-5
Noble, C. V., and Berkowitz, J. F. (2016). “Wetland soils and the hydrogeomorphic classification of wetlands” in eds. M. J. Vepraskas and C. B. Craft. (2nd edn.). CRC Press. doi: 10.1201/b18996
Noe, G. B., and Hupp, C. R. (2009). Retention of riverine sediment and nutrient loads by coastal plain floodplains. Ecosystems 12, 728–746. doi: 10.1007/S10021-009-9253-5
Noe, G. B., Hupp, C. R., Bernhardt, C. E., and Krauss, K. W. (2016). Contemporary deposition and long-term accumulation of sediment and nutrients by tidal freshwater forested wetlands impacted by sea level rise. Estuar. Coasts 39, 1006–1019. doi: 10.1007/s12237-016-0066-4
Nyman, J. A., DeLaune, R. D., and Patrick, W. H. (1990). Wetland soil formation in the rapidly subsiding Mississippi River deltaic plain: mineral and organic matter relationships. Estuar. Coast. Shelf Sci. 31, 57–69.
Pangala, S. R., Enrich-Prast, A., Basso, L. S., Peixoto, R. B., Bastviken, D., Hornibrook, E. R. C., et al. (2017). Large emissions from floodplain trees close the Amazon methane budget. Nature 552, 230–234. doi: 10.1038/nature24639
Perry, C. H., Finco, M. V., and Wilson, B. T. (2022). Forest atlas of the United States. FS-1172. Washington, DC: Department of Agriculture, Forest Service, 54.
Posit Team (2022). RStudio: Integrated development environment for R. Posit Software, PBC, Boston, MA. Available online at: http://www.posit.co/
R Core Team. (2022). R: A language and environment for statistical computing. R Foundation for Statistical Computing, Vienna, Austria. Available online at: https://www.R-project.org/
Reddy, K. R., and DeLaune, R. D. (2008). Biogeochemistry of wetlands: Science and applications. Boca Raton, FL: CRC Press.
Ricker, M. C., Blosser, G. D., Conner, W. H., and Lockaby, B. G. (2019). Wood biomass and carbon pools within a floodplain Forest of the Congaree River, South Carolina, USA. Wetlands 39, 1003–1013. doi: 10.1007/s13157-019-01150-1
Robertson, G. P., Hamilton, S. K., Paustian, K., and Smith, P. (2022). Land-based climate solutions for the United States. Glob. Chang. Biol. 28, 4912–4919. doi: 10.1111/GCB.16267
Sapkota, Y., and White, J. R. (2020). Carbon offset market methodologies applicable for coastal wetland restoration and conservation in the United States: a review. Sci. Total Environ. 701:134497. doi: 10.1016/j.scitotenv.2019.134497
Sapkota, Y., and White, J. R. (2021). Long-term fate of rapidly eroding carbon stock soil profiles in coastal wetlands. Sci. Total Environ. 753:141913. doi: 10.1016/j.scitotenv.2020.141913
Schafale, M. P. (2023). Classification of the natural communities of North Carolina: Fourth approximation. Raleigh, NC: North Carolina Natural Heritage Program, NC Department of Natural and Cultural Resources.
Selmants, P. C., Sleeter, B. M., Liu, J., Wilson, T. S., Trauernicht, C., Frazier, A. G., et al. (2021). Ecosystem carbon balance in the Hawaiian islands under different scenarios of future climate and land use change. Environ. Res. Lett. 16:104020. doi: 10.1088/1748-9326/ac2347
Sleeter, B. M., Frid, L., Rayfield, B., Daniel, C., Zhu, Z., and Marvin, D. C. (2022). Operational assessment tool for forest carbon dynamics for the United States: a new spatially explicit approach linking the LUCAS and CBM-CFS3 models. Carbon Balance Manag. 17:1. doi: 10.1186/s13021-022-00201-1
Sleeter, B. M., Marvin, D. C., Cameron, D. R., Selmants, P. C., Westerling, A. L., Kreitler, J., et al. (2019). Effects of 21st-century climate, land use, and disturbances on ecosystem carbon balance in California. Glob Change Biol. 25, 3334–3353. doi: 10.1111/gcb.14677
Sleeter, R., Sleeter, B. M., Williams, B., Hogan, D., Hawbaker, T., and Zhu, Z. (2017). A carbon balance model for the great dismal swamp ecosystem. Carbon Balance Manag. 12, 1–20. doi: 10.1186/s13021-017-0070-4
Smith, R. D., and Klimas, C. V. (2002). A regional guidebook for applying HGM approach to assessing wetland functions of selected regional wetlands subclasses, Yazoo basin, lower Mississippi River alluvial valley. Washington, DC: US Army Corps of Engineers ERDC/EL TR-02-4.
Stagg, C. L., Schoolmaster, D. R., Krauss, K. W., Cormier, N., and Conner, W. H. (2017). Causal mechanisms of soil organic matter decomposition: deconstructing salinity and flooding impacts in coastal wetlands. Ecology 98, 2003–2018. doi: 10.1002/ECY.1890
Stewart, A. J., Halabisky, M., Babcock, C., Butman, D. E., D’Amore, D. V., and Moskal, L. M. (2024). Revealing the hidden carbon in forested wetland soils. Nat. Commun. 15, 726–713. doi: 10.1038/s41467-024-44888-x
Stoler, A. B., and Reylea, R. A. (2020). Reviewing the role of plant litter inputs to forested wetland ecosystems: leafing through the literature. Ecol. Monogr. 90:e01400. doi: 10.1002/ecm.1400
Trettin, C. C., and Jurgensen, M. F. (2002). “Carbon cycling in wetland forest soils” in The Potential of U.S. FOREST SOILS to Sequester Carbon and Mitigate the Greenhouse Effect, 311–331.
Trettin, C. C., Jurgensen, M. F., and Dai, Z. (2019). Effects of climate change on forested wetland soils. Adv. Soil Sci. 36, 171–188. doi: 10.1016/B978-0-444-63998-1.00009-4
Trettin, C. C., Laiho, R., Minkkinen, K., and Laine, J. (2006). Influence of climate change factors on carbon dynamics in northern forested peatlands. Soil Sci. Soc. Am. J. 86, 269–280. doi: 10.4141/S05-089
Uhran, B., Windham-Myers, L., Bliss, N., Nahlik, A. M., Sundquist, E. T., and Stagg, C. L. (2021). Improved wetland soil organic carbon stocks of the conterminous U.S. through data harmonization. Front. Soil Sci. 1, 1–16. doi: 10.3389/fsoil.2021.706701
United States Department of Agriculture (USDA) (2023). “A general assessment of the role of agriculture and forestry in the U.S. carbon markets” in Report to congress. Written in support of the greenhouse gas technical assistance provider and third-party verifier program (Washington DC: United States Department of Agriculture (USDA)).
Zamora, S., Sandoval-Herazo, L. C., Ballut-Dajud, G., Del Ángel-Coronel, O. A., Betanzo-Torres, E. A., and Marín-Muñiz, J. L. (2020). Carbon fluxes and stocks by Mexican tropical forested wetland soils: a critical review of its role for climate change mitigation. Int. J. Environ. Res. Public Health 17:7372. doi: 10.3390/IJERPH17207372
Keywords: carbon stock, carbon accounting, wetland soil, carbon cycling, geomorphic settings, forest type groups
Citation: Sapkota Y, Berkowitz JF, Stagg CL and Busby RR (2025) A synthesis of freshwater forested wetland soil organic carbon storage. Front. For. Glob. Change. 8:1528440. doi: 10.3389/ffgc.2025.1528440
Edited by:
Andreas Schindlbacher, Austrian Research Centre for Forests (BFW), AustriaReviewed by:
Robert Jandl, Federal Research and Training Centre for Forests, Natural Hazards and Landscape (BFW), AustriaJeffrey Kelleway, University of Wollongong, Australia
Copyright © 2025 Sapkota, Berkowitz, Stagg and Busby. This is an open-access article distributed under the terms of the Creative Commons Attribution License (CC BY). The use, distribution or reproduction in other forums is permitted, provided the original author(s) and the copyright owner(s) are credited and that the original publication in this journal is cited, in accordance with accepted academic practice. No use, distribution or reproduction is permitted which does not comply with these terms.
*Correspondence: Jacob F. Berkowitz, amFjb2IuZi5iZXJrb3dpdHpAdXNhY2UuYXJteS5taWw=