 Theodore R. Keeping1,2*
 Boya Zhou3
 Wenjia Cai3Theodore G. Shepherd4
 I. Colin Prentice2,3
 Karin van der Wiel5
 Sandy P. Harrison1,2
- 1Geography and Environmental Science, University of Reading, Reading, United Kingdom
- 2Leverhulme Centre for Wildfires, Environment and Society, Imperial College London, London, United Kingdom
- 3Georgina Mace Centre for the Living Planet, Department of Life Sciences, Imperial College London, Ascot, United Kingdom
- 4Department of Meteorology, University of Reading, Reading, United Kingdom
- 5Royal Netherlands Meteorological Institute (KNMI), De Bilt, Netherlands
Realistic projections of future wildfires need to account for both the stochastic nature of climate and the randomness of individual fire events. Here we adopt a probabilistic approach to predict current and future fire probabilities using a large ensemble of 1,600 modelled years representing different stochastic realisations of the climate during a modern reference period (2000–2009) and a future characterised by an additional 2°C global warming. This allows us to characterise the distribution of fire years for the contiguous United States, including extreme years when the number of fires or the length of the fire season exceeded those seen in the short observational record. We show that spread in the distribution of fire years in the reference period is higher in areas with a high mean number of fires, but that there is variation in this relationship with regions of proportionally higher variability in the Great Plains and southwestern United States. The principal drivers of variability in simulated fire years are related either to interannual variability in fuel production or atmospheric moisture controls on fuel drying, but there are distinct geographic patterns in which each of these is the dominant control. The ensemble also shows considerable spread in fire season length, with regions such as the southwestern United States being vulnerable to very long fire seasons in extreme fire years. The mean number of fires increases with an additional 2°C warming, but the spread of the distribution increases even more across three quarters of the contiguous United States. Warming has a strong effect on the likelihood of less fire-prone regions of the northern United States to experience extreme fire years. It also has a strong amplifying effect on annual fire occurrence and fire season length in already fire-prone regions of the western United States. The area in which fuel availability is the dominant control on fire occurrence increases substantially with warming. These analyses demonstrate the importance of taking account of the stochasticity of both climate and fire in characterising wildfire regimes, and the utility of large climate ensembles for making projections of the likelihood of extreme years or extreme fire seasons under future climate change.
1 Introduction
Recent wildfire events have prompted concern about future changes in wildfire regimes. Analyses of remotely sensed burned area show significant declines since 2001 in Europe, sub-Saharan Africa, southern Africa and Central Asia, but no significant trends in other regions of the world (Zubkova et al., 2023). However, there has been an overall increase in burned area as a result of wildfires in the United States between 1983 and 2022 (EPA, 2024). Other aspects of the fire regime are also changing. Extreme wildfire events have become more frequent and intense globally (Cunningham et al., 2024) and the fire season has lengthened significantly in many regions over the past four decades (Smith et al., 2020). There has been a strong response of fire regimes to warming and land-use change during past centuries (Sayedi et al., 2024). A similar response is expected with future global warming, with fire risk projected to increase over the 21st century as a result of changes in meteorological conditions (Arias et al., 2021). Fuel accumulation is also projected to increase with warming (Lu et al., 2024), and fuel moisture is projected to decrease across the plant productivity gradient (Ellis et al., 2022).
A recent UNEP report (Sullivan et al., 2022), using outputs from four climate models under the RCP2.6 and RCP6.0 scenarios, predicted a significant increase in burned area globally in the 21st century and an increasing trend in the likelihood of extreme wildfire events from 2020 to 2100. That study reflects the spread of burned area outcomes given modelled conditions - based on the distribution of possible model parameters from the training data (Kelley et al., 2019) - but does not reflect the full spread due to the chance of different realisations of weather that affect the likelihood of wildfire occurrence. This second component of the uncertainty can be addressed by using a large ensemble (LE) of climate simulations. As the drivers of wildfire likelihood (such as temperature, moisture, and vegetation productivity) vary between years in a given climate, considering a large distribution of simulated years for a given global mean temperature, or climate state, allows the full variability in potential fire years to be defined (Van der Wiel et al., 2021). Modelling this aleatoric component of the uncertainty allows us to characterise the otherwise unknown spread of the annual wildfire distribution that arises from the limited length of the recent wildfire record, and to understand the possible extremes of the modern fire regime through better resolution of the tails of the distribution.
LEs are a standard method in climate and climate impact science where ensemble runs are used to represent the distribution of possible outcomes and extremes. LEs have been widely adopted in flood modelling (Cloke and Pappenberger, 2009) and have been used to predict extremes for heavy snowfall (Sasai et al., 2019), drought (Van der Wiel et al., 2021), extreme heat (Suarez-Gutierrez et al., 2020), and fire weather (Squire et al., 2021). This approach is very applicable in the context of fire, which is sensitive to meteorological variability between years (Chuvieco et al., 2021) and to changes in vegetation properties caused by this variability. LE methods have been adopted for projection or attribution of extreme fire weather events (Touma et al., 2022; Squire et al., 2021), but have not been applied to other factors influencing fire regimes. Significant spread has been shown between General Circulation Model (GCM) predictions of wildfire in California (Dye et al., 2023; Yue et al., 2014) and the northern United States (Kerr et al., 2018). These studies represent a combination of aleatoric and systematic uncertainty, and hence cannot be interpreted probabilistically (Shepherd, 2019). It is important to understand how this uncertainty impacts projections, particularly given the rapidly moving target due to climate and land-use change.
Accounting for interannual stochasticity in modelling wildfire under present-day and future conditions is important in model products designed for the wider fire community. Fire management is often based on the extrapolation of observed incidence, meaning that the effect of future environmental change on the fire regime is viewed in terms of increasing risk relative to local operational experience. However, this approach ignores the possibility that the observed occurrence of fires does not provide a full representation of the potential fire regime - including unseen extremes. The modern observational record does not necessarily reflect the mean response to climate since it is strongly influenced by variability due to the small sample of years considered. Adopting an LE allows a characterisation of the distribution of possible events, meaning that the likelihood of extremes can be more robustly determined. Additionally, climate change can have a different effect on average versus extreme fire years. LEs allow a robust characterisation of the full distribution of fire years to define vulnerability to extremes as well as changes to the landscape’s expected average susceptibility to wildfire.
Here, we apply a previously established modelling methodology for the likelihood of wildfire occurrence using an LE to assess the distribution of the expected number of fires per year for the contiguous United States. We then assess the regional drivers of fire variability and variability in the length of the fire season across North American ecological regions, or ecoregions (Commission for Environmental Cooperation (Montréal, Québec) and Secretariat, 1997). Finally, we consider how these distributions change when subject to an additional 2°C of warming, identifying regionally distinct effects of climate change on both the mean and spread of fire year outcomes.
2 Methods
We use a model that predicts the daily likelihood of fire as a function of meteorological, vegetation, and human-activity variables. We take bias-corrected meteorological variables from the Royal Netherlands Meteorological Institute Large Ensemble Time Slice (KNMI-LENTIS) ensemble for a “modern” period (2000–2009) and a hypothetical future (+2°C global warming relative to the modern ensemble). We also use these bias-corrected variables as input to a light-use efficiency model to derive gross primary production (GPP). Factors related to land cover and human activities are held constant. We then analyse the ensemble distribution of fire years under modern and future conditions, using a climate reanalysis-driven model as a baseline, focusing on how the variability between years varies spatially; extreme fire years; and variation in the length of the fire season.
2.1 Fire modelling approach
We use an existing model for the daily probability of fire occurrence at 0.1° spatial resolution for the contiguous United States (Keeping et al., 2024), trained on occurrence data from the Fire Programme Analysis fire-occurrence database (Short, 2022). The original model selects 12 variables from a suite of 47 candidate variables associated with the likelihood of wildfire occurrence, including instantaneous and antecedent predictors of weather conditions, plant productivity, plant type, population, and landscape development. The selected variables are then used to predict the daily likelihood of a wildfire occurrence using a power-law rescaled generalized linear model. Here, a reduced set of 31 candidate predictors (Supplementary Table 1) are used because some of the original variables could not be obtained from the KNMI-LENTIS ensemble, and some were eliminated because they were not selected across 1,000 randomly sampled training datasets. The selected ensemble-derived variables were GPP, precipitation, vapour pressure deficit (VPD), snow cover, diurnal temperature range (DTR), and windspeed across a range of antecedences. Inputs derived from KNMI-LENTIS were downscaled to the resolution of the fire model since the effect of wildfire drivers varies across spatial scales (Parisien and Moritz, 2009) and the modelled relationships and the thresholds used for these relationships would therefore not necessarily be appropriate at coarser scale.
The reanalysis model based on the reduced set of variables performs as well as the original model. It shows good separability for fire occurrence, with an area under the receiver operating characteristic curve (AUC) statistic of 0.89. It also performs well spatially, with a geospatial normalised mean error (NME) of 0.46, in predicting both how concentrated the fire season is (seasonal concentration NME = 0.78) and when the peak of the fire season occurs (mean seasonal phase difference = 0.13), and in predicting interannual variability (interannual NME = 0.67). The model driven by reanalysis data provides a point of comparison for the realised likelihood of wildfire given the weather that occurred. However, as a reanalysis derived product, it cannot include the full stochasticity of the actual weather.
2.2 KNMI-LENTIS ensemble
KNMI-LENTIS (Muntjewerf et al., 2023) provides a large ensemble run of EC-Earth3 (Döscher et al., 2021) for two climate periods, 2000–2009 and +2°C warming from this “modern” period (2075–2084 under SSP2-4.5 in EC-Earth3). Each ensemble consists of 160 simulations of 10 years. These 160 ensemble members are created combining “macro” initialization and “micro” perturbations, with 16 different starting conditions created by starting the model at 25-year intervals in the pre-industrial spin-up, and running long transient (historical and SSP2-4.5) simulations. Each of these 16 runs is then subject to nine very small perturbations to the atmospheric temperature field at the start of the modern and modern + 2°C decades to produce two ensembles of 160 members each. These 160 members yield 1,600 years of data for two climates that are considered relatively stable (the 2000s and that climate subject to +2°C warming) since any climate trend will be limited in a 10-year period. Antecedent GPP over the preceding year was selected as a predictor, although none of the longer antecedent GPP predictors was found to be important in the model training. Antecedent 1-year GPP was calculated by repeating the first year of the ensemble following Van der Wiel et al. (2019).
2.3 Bias correction and generation of input data
The KNMI-LENTIS outputs were bias-corrected and downscaled by the climate imprint (CI) method (Hunter and Meentemeyer, 2005) using ERA5-Land data (Muñoz-Sabater et al., 2021) for the period 1990–2019 at 0.1° (~10 km resolution). Bias-correction of the meteorological and plant growth predictors reduces the general overestimation of GPP and the under/over-estimation of windspeed and snow cover in some regions (Supplementary Figure 6) which, because of the threshold relationships inherent in the fire probability model, would result in the prediction of unrealistically high likelihoods of fire occurrence (Supplementary Figure 7).
Although KNMI-LENTIS and ERA5-Land are both ECMWF products, the core atmospheric modules are different (IFS Cy36r4 and Cy45r1 respectively), IFS Cy45r1 performs better then IFS Cy36r4 (ECMWF, 2025), and ERA5-Land also uses observational data assimilation. Thus, the modelling schemes and implementation are sufficiently different for ERA5-Land to be considered as an independent source for bias-correction and downscaling of EC-Earth3. Whilst reanalysis products are an imperfect representation of reality and can be subject to bias, assessments of ERA5-Land show that it performs better than other products in reproducing extratropical northern hemisphere land temperatures (Muñoz-Sabater et al., 2021), United States temperature extremes (Ibebuchi et al., 2024), precipitation in the northeastern United States (Crossett et al., 2020) and extratropical precipitation patterns more generally (Lavers et al., 2022). The representation of precipitation extremes is not as good (Lavers et al., 2022) but this is not important since the wildfire model is not sensitive to precipitation exceeding 13 mm/day (Keeping et al., 2024).
The reanalysis data were averaged by the day-of-year and smoothed by a 31-day centred window, thus preserving the seasonality but eliminating error introduced by limited sampling of stochastically varying years (on leap-years, day 366 was grouped with day 365 for this reason). Modern ensemble data was converted into single delta values relative to the ensemble day-of-year mean. Zero-bounded variables, such as precipitation, were treated multiplicatively whilst non-bounded variables, such as temperature, were treated additively. This delta version of the ensemble was then bilinearly downscaled and applied to the day-of-year averaged and smoothed reanalysis data. The bias correction was applied to all variables separately. The same procedure was followed for the +2°C ensemble data, but the difference was between the future ensemble data and the modern ensemble day-of-year mean. As some ensemble variables have a 3-h resolution, times of day were bias-corrected separately to respect potentially different distributions in different parts of the diurnal cycle.
The 0.1°, 3-hourly or daily bias corrected data were used to generate climate predictors for the fire model. Diurnal temperature range was derived from the difference between the daily minimum and maximum temperature. Daily and 5-daily precipitation were derived from daily precipitation data. Windspeed was derived from the daytime mean of 3-hourly windspeed data, which in turn had been calculated from westerly and northerly components prior to the bias correction. Snow cover was derived from daily data. Vapour pressure deficit was calculated according to the Buck formula (Buck, 1981) from 3-hourly temperature and dewpoint data, which was then used to derive the daytime mean value.
The top four moments (mean, variance, skewness and kurtosis) were calculated for the reanalysis and bias-corrected ensemble data aggregated by time of day; month; and 2π the ensemble resolution. The mean and variance showed good agreement for all the bias-corrected variables except windspeed (Supplementary Table 2a). A single-value variance rescaling was thus applied to further correct windspeed (Supplementary Table 2b).
2.4 The GPP model
Predictions of GPP were made using a light-use efficiency model (the P model) that combines the Farquhar-von Caemmerer-Berry photosynthesis model for instantaneous biochemical processes with two eco-evolutionary hypotheses to account for the spatial and temporal acclimation of carboxylation and stomatal conductance to environmental variations at weekly to monthly time scales (Wang et al., 2017; Stocker et al., 2020). The model uses an empirical function to take account of the effect of soil moisture stress on photosynthesis, as defined in Stocker et al. (2020). The inputs to the P model are air temperature (°C), VPD (Pa), air pressure (Pa), incident photosynthetic photon flux density (PPFD, μmol m−2 s−1), the fraction of absorbed photosynthetically active radiation (fAPAR), and ambient CO2 concentration. The meteorological inputs to drive the P model were the bias-corrected and downscaled variables from the KNMI-LENTIS ensemble, with the +2°C scenario using CO2 concentrations corresponding to the SSP2-4.5 scenario for 2075–2084. fAPAR was derived from a prognostic model of the seasonal cycle of the leaf area index (LAI) (Zhou et al., 2025), since fAPAR can be derived from LAI using Beer’s law. This model derived the steady-state LAI timeseries from the GPP time course based on a general linear relationship between “steady-state” LAI, the LAI when environmental conditions remain unchanging, and GPP. The actual estimated LAI is then calculated as the time-lagged average of the steady-state LAI. A seasonal maximum fAPAR model was embedded in this model to limit seasonal LAI predictions (Zhu et al., 2023; Cai et al., 2025).
2.5 Ecoregions
To conduct regional analyses of wildfire patterns, we aggregated data using the Level I Ecological Regions of North America (Commission for Environmental Cooperation (Montréal, Québec) and Secretariat, 1997). Two ecoregions that occupy relatively small areas in the contiguous United States were merged with a closely related ecoregion, following Balik et al. (2024). Specifically Tropical Wet Forests (in southern Florida) were merged with Eastern Temperate Forests, and Southern Semi-arid Highlands (in southeastern Arizona) were merged with Temperate Sierras. The eight ecoregions used here are: Eastern Temperate Forests; Great Plains; Marine West Coast Forest; Mediterranean California; North American Deserts; Northern Forests; Northwestern Forested Mountains; and Temperate Sierras (Supplementary Figure 1a). When describing more specific geographical regions, we followed the naming convention of the United States Census Bureau (Supplementary Figure 1b).
2.6 Fire year metrics
The ensemble-driven fire model is compared to the reanalysis-driven fire model rather than to the observations to provide a like-for-like comparison of the contemporary probability of wildfire, because of the stochasticity of the realised wildfire record. The fire occurrence model is daily, accounting for the daily extremes that drive the annual likelihood of fire, but the analysis here is annual to focus on variability between fire seasons and not on daily scale variability in weather. The spread of the ensemble is defined as the 1st to 99th percentile of the ensemble fire years by grid cell since this is more robust than the maximum and minimum of the distribution (Supplementary Figure 2). A leave-one-out (LOO) approach was used to identify the predictor that contributes most to interannual variability in fire occurrence. A version of the ensemble was generated for each of the eight climate predictors by taking the average for each day of the year across the full ensemble to eliminate interannual variability of that predictor. This approach preserves seasonality but means that all years are identical for that predictor across ensemble members. The mean absolute difference between the original and LOO annual number of fires was used to measure the contribution of that predictor to variability. The length of the fire season was defined as the number of days exceeding a threshold of 50% of the average of the week with the most fires at each location in the reanalysis model. We also compared the reanalysis maximum fire years (from the 1990s, 2000s and 2010s) to the 160 ensemble decades by ecoregion to determine whether the observed decadal maximum falls in the distribution of possible decadal maxima for a similar environment. This also allows us to examine if there was a trend in the reanalysis period that could affect the comparison with the ensemble model.
3 Results
3.1 Modern day fire regimes
The spatial pattern of number of fires in the reanalysis-based model is broadly consistent with the observational record (Short, 2022), although as expected the observed map is less smooth (Figure 1). Despite the good overall agreement with observations, there are some differences - for example the greater extent of wildfires in northern parts of the Mountain West and East North Central, and the sharper boundaries of regions where wildfire does not occur in heavily farmed regions of the East North Central (the Corn Belt) and East South Central (the Mississippi Valley). The model is a reliable predictor for the probability of wildfire occurrence, and the reanalysis-based model mean shows good agreement (R2 = 0.96) with the KNMI-LENTIS modern ensemble mean, indicating that the bias-corrected ensemble data is also reliable. Without bias-correction and downscaling, the fire model shows the correct geographic patterns but seriously overestimates the probability of fire in high-likelihood regions (Supplementary Figure 7).
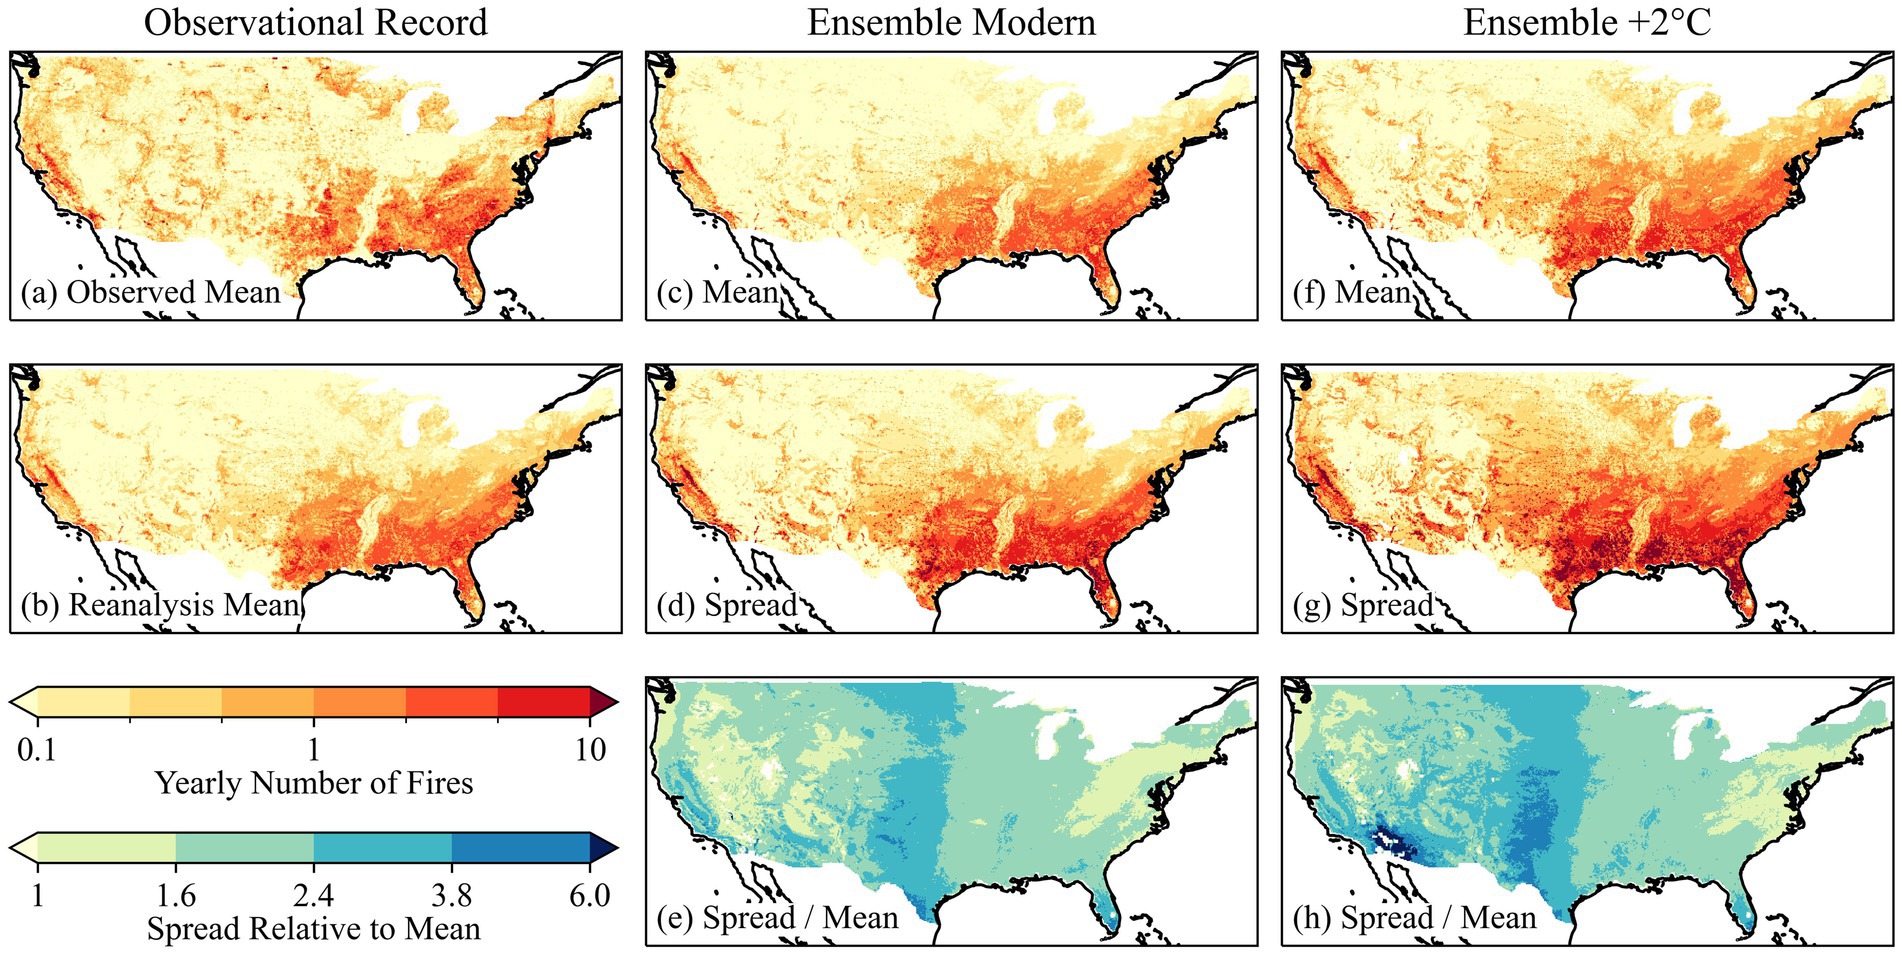
Figure 1. Modelled and observed patterns in the annual number of wildfires greater than 0.1 hectares, with both the mean and 1st-99th percentile spread shown. The plots show (a) the observed annual mean of the wildfire occurrence record for 1992–2020; (b) the modelled reanalysis mean for 1990–2019; (c) the modelled ensemble mean for the modern (2000–2009 climate); (d) the modelled ensemble spread for the modern; (e) the ratio of model spread and mean for the ensemble modern; (f) the +2°C ensemble mean (2000–2009 climate plus 2°C of warming); (g) the +2°C ensemble spread; and (h) the ratio of model spread and mean for the +2°C ensemble.
The absolute spread of the 1,600-year ensemble for the expected annual number of fires (Figure 1d) is largest in regions with a high mean number of fires. The regions most susceptible to wildfire occurrence over a long period also show the highest absolute spread in fire occurrence on a year-to-year basis, with extreme years contributing substantially to the higher-than-average rate of wildfire. As the mean and spread of the ensemble distribution are strongly associated spatially, the ratio between them (the relative spread) indicates where the skewed fire year distribution (Supplementary Figure 2) is longer tailed, and where there is a different response in the spread and mean of the distribution to warming. The relative spread (Figure 1e) is highest in the Great Plains, the Warm Deserts, the coast and hills of Mediterranean California, and southern Florida. In contrast, a large region of the eastern United States has a high mean number of expected fire events but low relative spread. The relative spread identifies regions where previously unseen extremes could be substantially above the recent mean, with Mediterranean California and the southern Great Plains being characterised by particularly high mean annual fires and relative spread.
The model predictors can be categorised into static variables (rural population density, shrubland cover, needleleaf cover, cropland cover) and dynamic variables that vary with time, including meteorological (mean daytime VPD, DTR, mean daytime windspeed, snow cover, precipitation in the prior 5-days, and daily precipitation) and vegetation (GPP in the prior year and GPP in the prior 50-days) variables. The four most influential variables in the model (Supplementary Table 1) were annual GPP, VPD, rural population density and 50-day GPP, respectively.
Comparison of the original fire year ensemble and the ensemble with the interannual variability of individual variables fixed showed that the primary driver of interannual fire variability reflects two sets of controls: atmospheric drying (VPD, DTR) and fuel availability (GPP) (Figures 2a, 3a). Fuel availability is the most important control on interannual variability in the eastern Great Plains, Eastern Temperate Forests, Mediterranean California, Temperate Sierras, and the southern North American Deserts. Atmospheric drying is most important in the lower fire-occurrence areas of the Mountain West and northern Pacific West. VPD and annual GPP control fire year variability across most of the United States, but DTR is more important in the Marine West Coast Forest, the northeastern Northern Forest, and a small area west of the Great Lakes. These three regions have the lowest interannual variability in VPD, whilst DTR variability is more homogeneous in the surrounding areas. GPP in the prior 50 days is also an important control in much of the Northwestern Forested Mountains. Interannual variability in VPD is the most important control of variability in severe fire years, as indexed by the top 1% of fire years (Figure 2c), except in the southwestern United States (Figure 3c) where fuel availability is the main control.
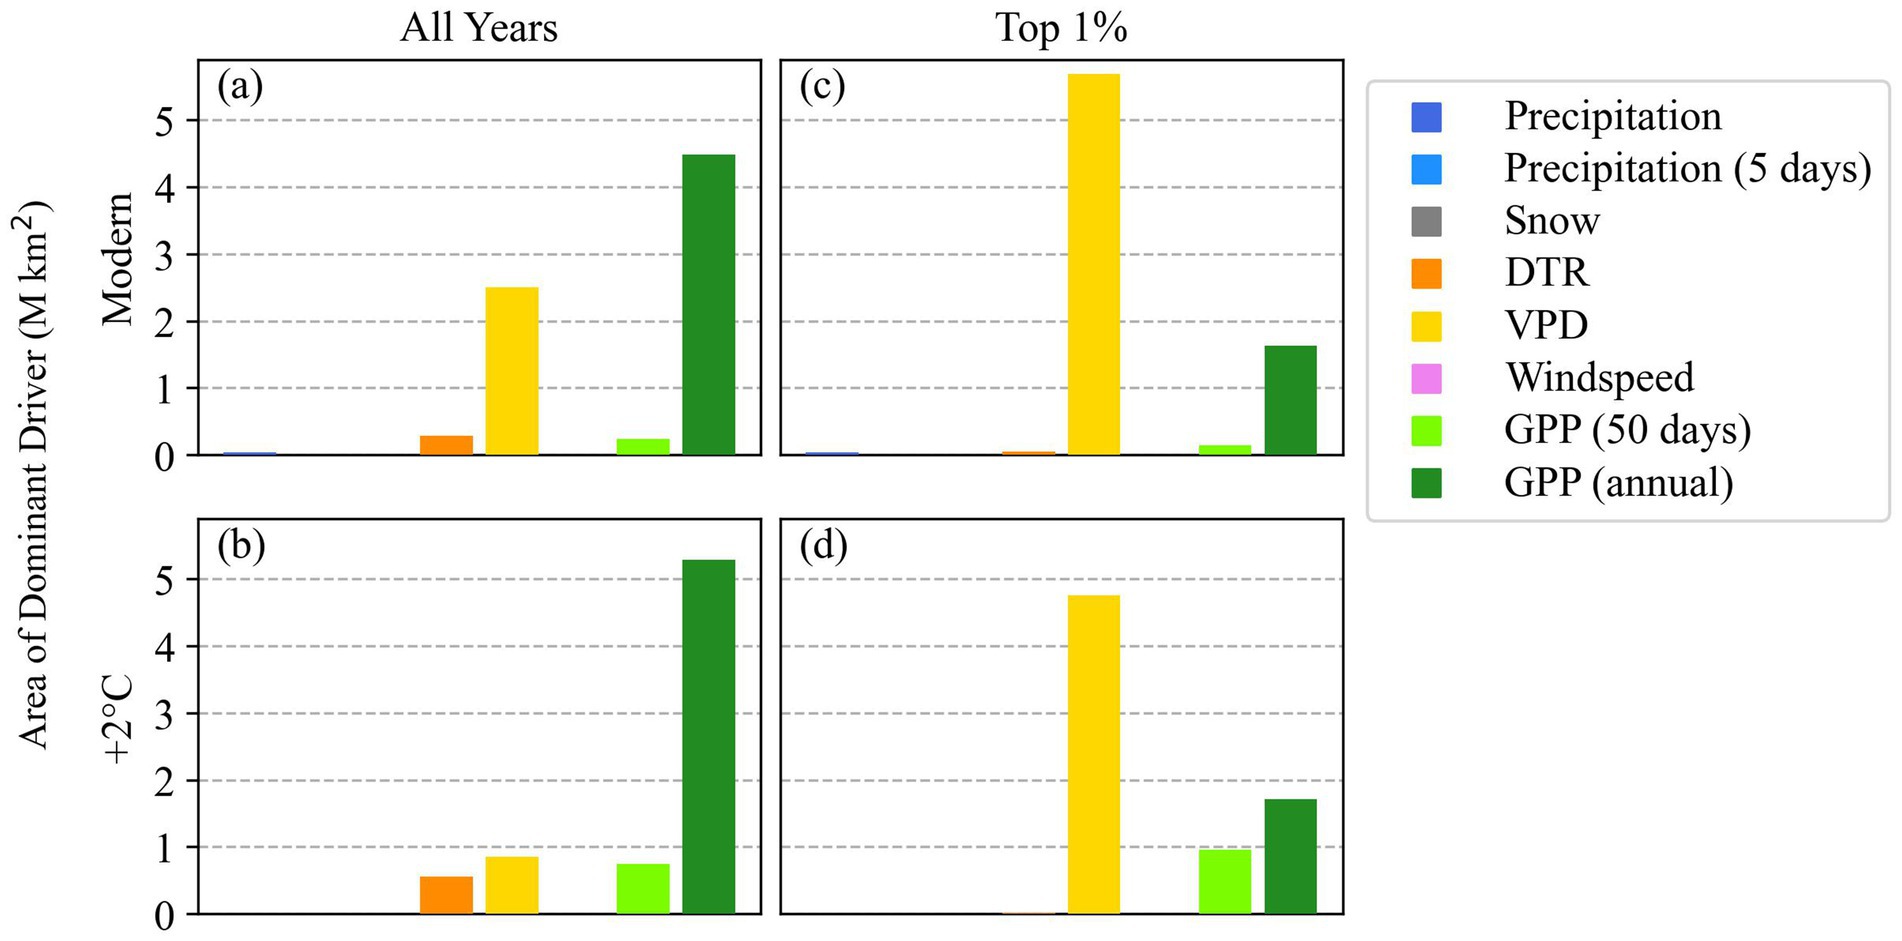
Figure 2. Relative importance (as measured by the area where the variable is the dominant effect) of different drivers for the variability in the modelled number of wildfires per year as shown by the leave-one-out analysis. The top plots show the drivers in the modern (2000–2009) ensemble for (a) all fires and (c) the top 1% of fire years. The bottom plots show the drivers in the +2°C ensemble, for (b) all fires and (d) the top 1% of fire years. DTR is the diurnal temperature range, VPD is vapour pressure deficit, GPP is gross primary production.
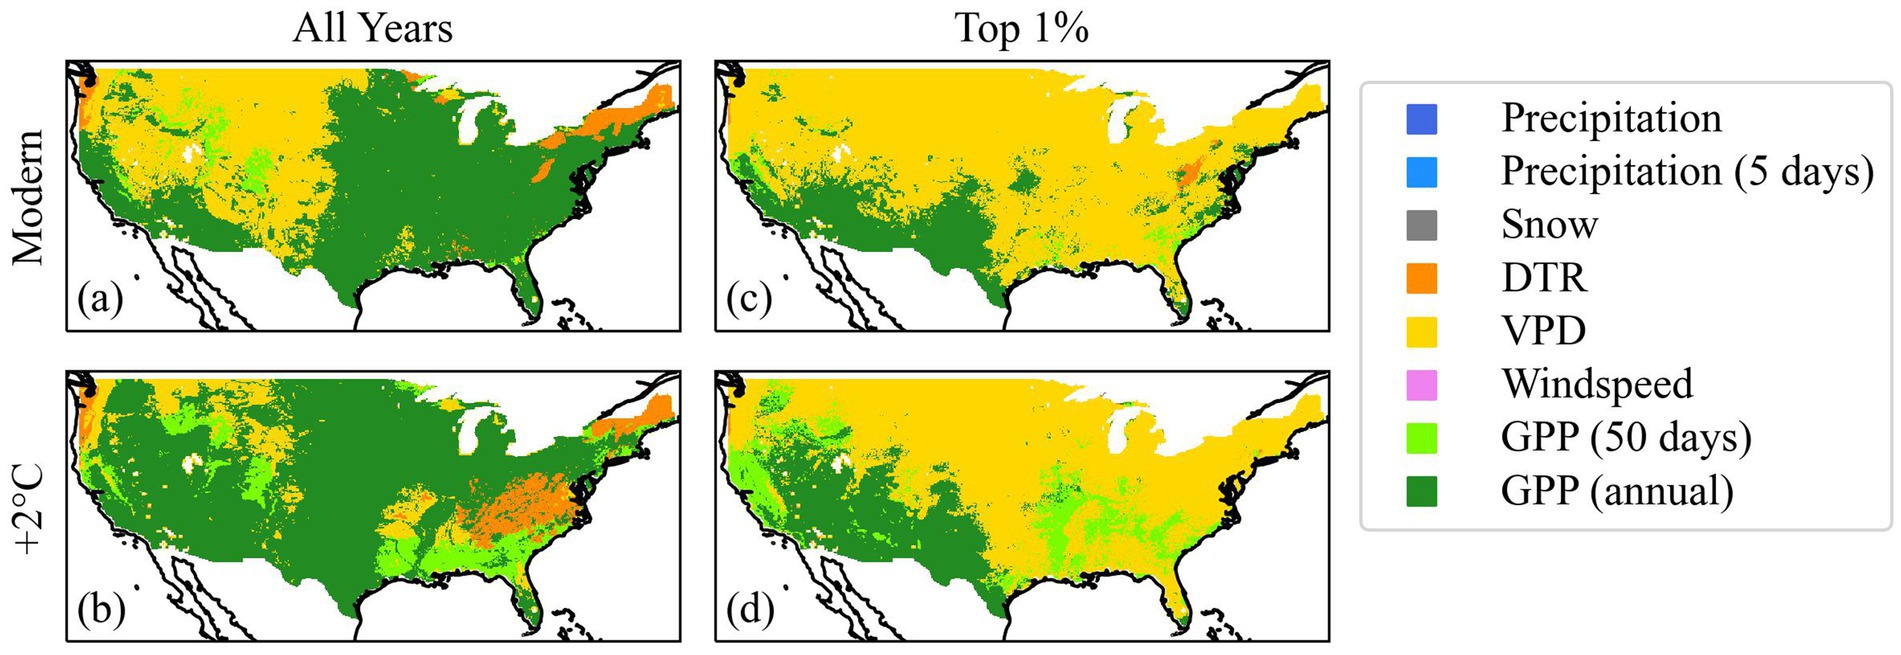
Figure 3. Maps showing the areas where each variable is the dominant driver of interannual variability between fire years. The top plots show the drivers in the modern (2000–2009) ensemble for (a) all fires and (c) the top 1% of fire years. The bottom plots show the drivers in the +2°C ensemble, for (b) all fires and (d) the top 1% of fire years. DTR is the diurnal temperature range, VPD is vapour pressure deficit, GPP is gross primary production.
The mean fire season length is < 30 days over much of the United States (reanalysis-model, Supplementary Figure 4a; modern ensemble, Figure 4a), except for the southwestern North American Deserts where the season can be up to 4 months long. There is considerable variation in the extremes of the distribution in fire season length (Figure 4c) and this can be significantly higher than the maximum registered in the 30-year reanalysis period (Supplementary Figure 4b). The East South Central and southern South Atlantic regions can experience long fire seasons of up to 120 days. However, most of the region with long fire seasons in severe years – often multiple times longer than the mean fire season – lies west of the 100th meridian: the Warm Deserts and southern Mediterranean California see increases from 10–120 to 120–240 days in extreme years. Although these regions are characterised by a long fire season, they are also the most exposed to unseen extremes.
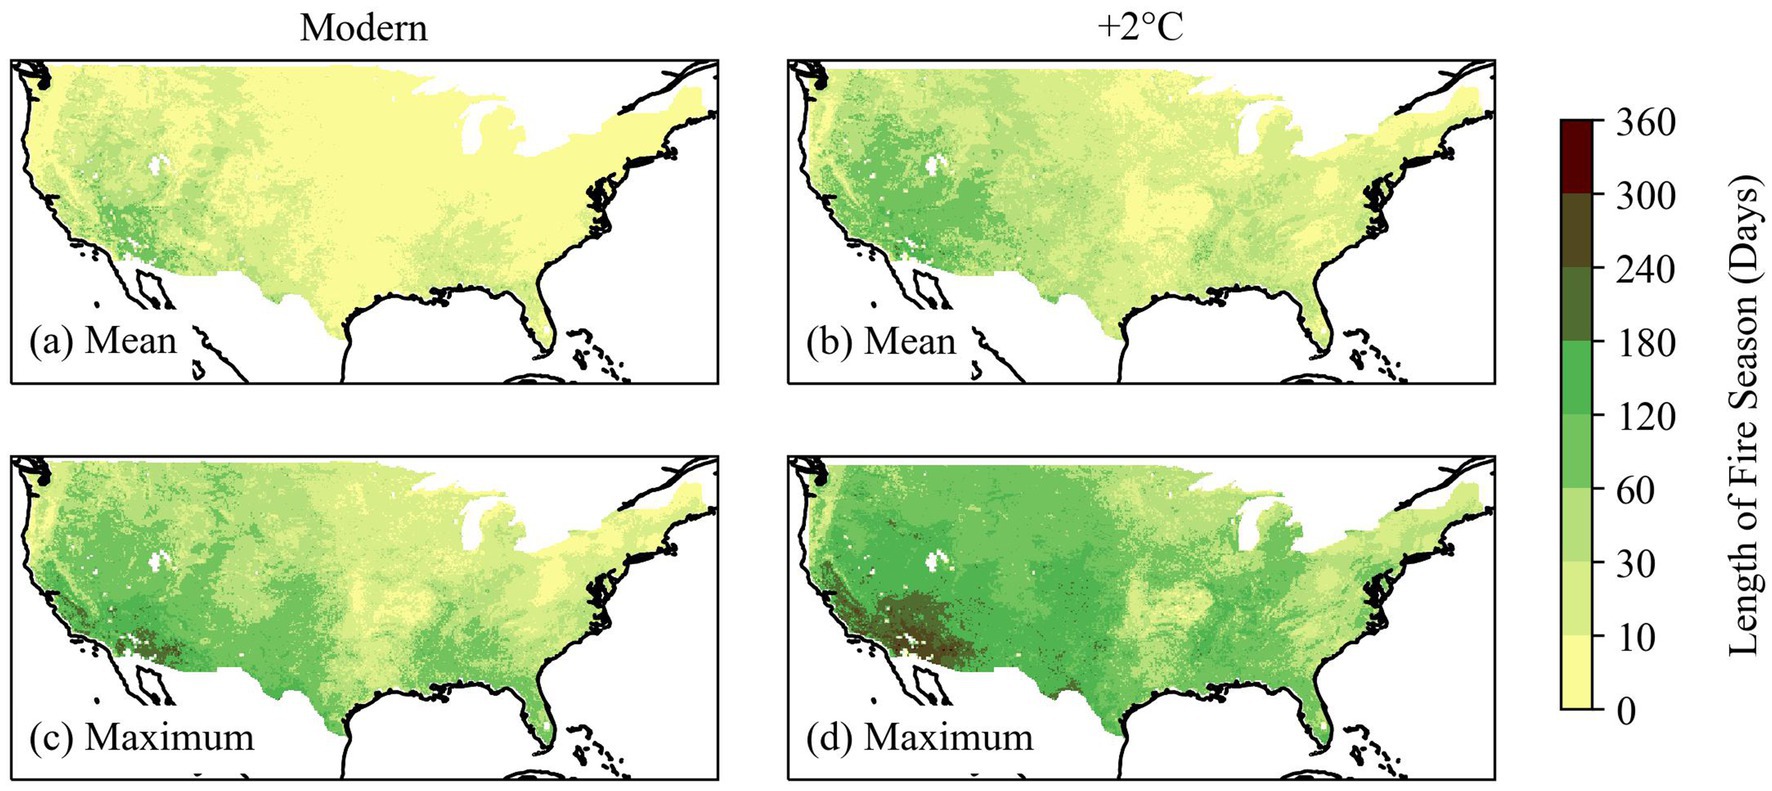
Figure 4. Maps of fire season length. The mean for (a) the modern ensemble and (b) + 2°C ensemble, and the resolvable maximum (99th percentile) for (c) the modern ensemble and (d) + 2°C ensemble number of days exceeding a threshold of 50% of the average of the modern ensemble week with the most fires at each location. This number of locally relatively fire-prone days is considered as the effective fire season length.
There are large differences in the spread of the distribution of the decadal maximum fire year across the 160 ensemble-based simulations (Figure 5), with Mediterranean California, the Temperate Sierras, and the Great Plains showing the largest spread and Marine West Coast Forest, Northwestern Forested Mountains, Northern Forests, and Eastern Temperate Forests showing a relatively confined distribution. The distribution of the decadal maximum fire year in the simulations is congruent with the maximum for each decade in the reanalysis-based model for some ecoregions (Figure 5), most notably in the Great Plains and the Eastern Temperate Forests. However, the tail of the simulated decadal maximum fire year in Mediterranean California, the North American Deserts, and the Temperate Sierras greatly exceeds the maximum in the reanalysis-based model. There is only one region, Northern Forests, where the maximum in the reanalysis-based model lies outside the ensemble-based distribution. The extremes from each of the three reanalysis decades differ (Figure 5), reflecting the observed warming trend since the 1990’s. This highlights the unreliability of estimating extremes from the reanalysis model rather than the ensemble-based model.
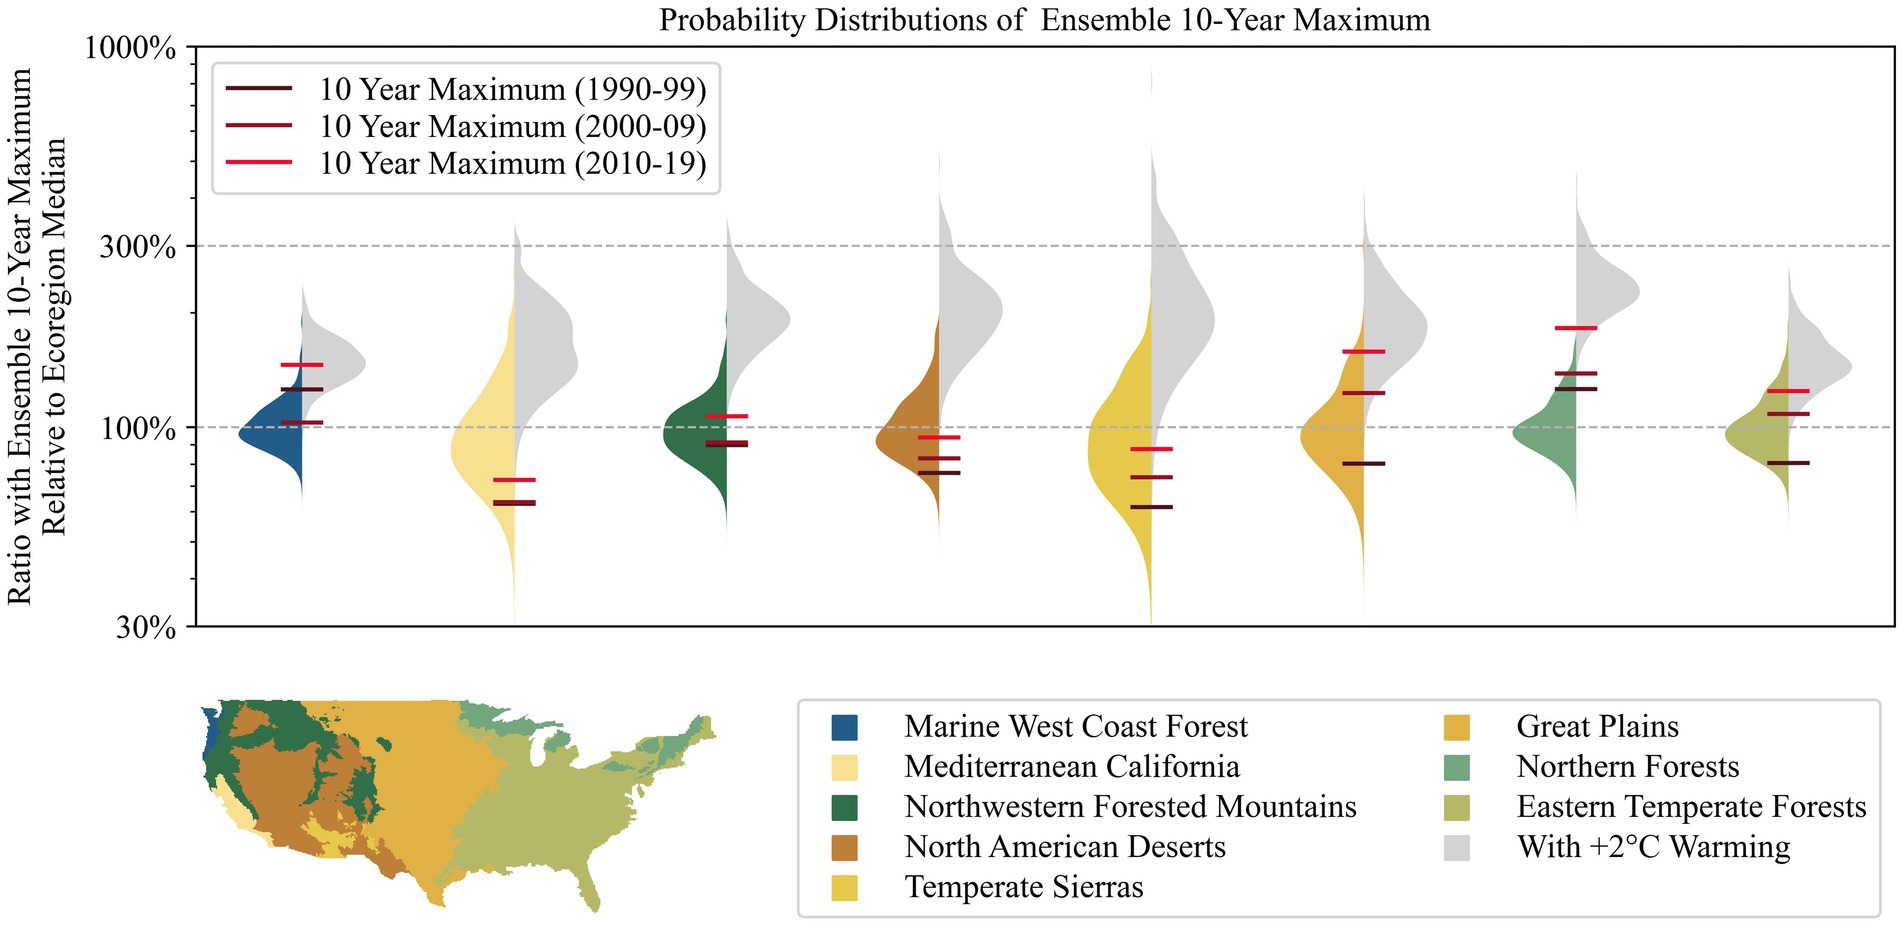
Figure 5. Coloured histograms show the distribution of the maximum number of fires in a year per ensemble member (i.e., one simulated decade) in different ecoregions; the grey histograms show the distribution of the 10-year maximum in the same ecoregion after an additional +2°C warming. The maximum number of fires per decade in the reanalysis-based model are shown by horizontal lines. The map shows the area covered by each ecoregion.
3.2 Future fire
There is an increase in both the mean and spread of total annual wildfires across all regions of the United States in the +2°C ensemble-based simulations (Figure 1, Supplementary Figure 5). The mean annual number of fires is more than double in the Midwest and Northeast. However, the greatest changes are in the West (Supplementary Figure 5) and most pronounced in the higher fuel-load environments of the Northwestern Forested Mountains. The increase in the spread is generally greater than the increase to the mean (Figure 1h): 78% of the contiguous United States shows an increase in spread greater than that of the mean in the +2°C ensemble, and the spread increases by > 1.2 times the mean over 34% of the region (Supplementary Figure 3). Fire years are consistently most variable relative to the mean annual number of fires in the Great Plains, Warm Deserts, and Mediterranean California. There is also a marked increase in relative spread in the southern Great Plains and Warm Deserts. The southeastern United States has the most limited increase in both mean annual number of fires and interannual spread.
GPP and atmospheric drying (VPD and DTR) are the most important drivers of interannual variability in the +2°C ensemble-based simulations (Figure 2). However, GPP is the predominant control on fire year variability over 71% of the contiguous United States in the +2°C ensemble compared to 60% in the modern ensemble. Much of the expansion of the region where GPP is the primary control is in the West. In the +2°C ensemble scenario, the modelled average annual GPP increases across the contiguous United States, with a mean increase of 41% compared to a 49% increase in the average CO2 concentration, and with 99% of the contiguous United States showing an increase in GPP relative to the modern ensemble. The +2°C scenario also shows a GPP response of greater variance between years relative to the modern ensemble scenario across 99% of the contiguous United States, with 66% of the area of the contiguous United States showing an increase in the variability relative to the mean as shown by coefficients of variation of the modern and +2°C ensembles. Variables related to atmospheric drying become more important in the southeastern United States, where interannual variability is almost entirely controlled by GPP in the modern ensemble (Figure 3). DTR emerges as a more significant effect than in the modern ensemble. The area where it is the most important factor doubles. The region where VPD is the primary control decreases to one third of its extent in the modern ensemble. GPP over the prior 50 days becomes a more important driver of interannual variability than annual GPP in much of the South. GPP in the prior 50 days also replaces VPD as the dominant driver for the top 1% of fire years in parts of the same region – indicating an increase in the importance of low-productivity intervals (for example drought) for driving interannual variability.
The length of the fire season is increased in the 2°C ensemble compared to the modern ensemble (Figure 4), with increases to the mean fire season in the West and East South Central regions. There are regions of the southwestern North American Deserts and southern Mediterranean California where the top percentile of the distribution of fire season length is > 300 days. More northerly regions, such as the Northwestern Forested Mountains, are projected to experience fire seasons that would be normally associated with more southerly fire regimes. All ecoregions show a strong increase in the distribution of decadal extreme fire years (Figure 5). The Northern Forests ecoregion shows the greatest change: there is virtually no overlap between the 2000–2009 and the +2°C extreme distributions. A similar but less extreme difference occurs in the Northwestern Forested Mountains.
4 Discussion
The interannual spread of number of fires is greater than the mean expected number in the modern ensemble, meaning that the annual wildfire occurrence distribution can be described as highly variable and sensitive to interannual climate variability. Areas with a higher mean expected number of fires are likely to have a correspondingly higher spread in the distribution of annual number of fires, however there are geospatially distinct patterns in the spread of the distribution relative to the mean. There is an apparent effect of warming on the most extreme fire year per decade (across all eight ecoregions) over the past 30 years. The distribution of modelled decadal maxima in the modern climate consistently exceeds the reanalysis decadal maxima in all ecoregions. Drier ecoregions show higher spread between decadal maxima relative to the median decadal maximum of the ensemble. This effect could arise from the widespread variability in aggregated fire risk that can occur due to widespread drought affecting a large portion of an ecoregion, an established amplifier of wildfire risk in the West (Richardson et al., 2022). Whilst wildfire occurrence is high in the South and in highly populated areas, the southern West and southern Great Plains are the regions where relatively extreme years and extreme fire seasons are most likely under both the modern ensemble and +2°C ensemble scenarios.
The interannual variability in fire is largely controlled by the interannual variability in daily VPD or annual GPP, which correspond to variability in fuel moisture content and fuel availability, respectively. In the modern ensemble, fuel availability is consistently the most important driver in the southwestern United States, even for the top 1% of fire years which are primarily controlled by VPD in other regions. The response of GPP to climate change in the future scenario shows that the generally positive effects of CO2 on average outweigh the negative effect of increasing incidence of soil moisture stress on net primary production. This is consistent with the findings of Cai and Prentice (2020) that in the United States the predominant controls on GPP are plant cover (fAPAR) and CO2, as well as matching recent (Jeong et al., 2024) and projected (Knauer et al., 2023) trends in GPP. GPP becomes more variable in the +2°C ensemble scenario, even relative to the increase in the mean. The overall effect of this is to increase fuel production, increasing fire likelihood given equivalent weather conditions, and to increase the variability in fuel production between years, enhancing the impact of GPP variability in driving variability between fire years. This is seen in the increasing area of the West in the +2°C ensemble scenario for which GPP is the primary control of interannual wildfire variability – consistent with the findings of Abatzoglou et al. (2021) that the fires in the western United States are increasingly constrained by increasing fuel availability with near-term future warming, despite increases in fire likelihood. Fuel limitation is also characteristic of the Great Plains, where annual GPP is the dominant control of interannual variability in fire occurrence in both the modern and the +2°C ensembles. The herbaceous fuels in this region have a shorter lifespan and are more sensitive to aridity (McGranahan and Wonkka, 2024), meaning that years of low productivity associated with lower moisture strongly reduce fire likelihood (Guyette et al., 2015; Knapp, 1998). VPD is a well-established control on the daily likelihood of wildfire (Mueller et al., 2020) but even in fuel-availability controlled regions, the top 1% of fire years in both the modern ensemble and +2°C scenarios are often controlled by VPD. Even though annual GPP is the chief control of interannual variability, the interannual variation in VPD controls whether an extreme fire year occurs, consistent with its influence on extreme burned area in the West (Williams et al., 2019).
We identified DTR as the primary driver of interannual variability in the Northeast in the modern ensemble and in the Northeast and Appalachia (the mountainous inland region that extends parallel to the coast down from the Northeast) in the +2°C ensemble. Seager et al. (2015) showed there is strong interannual variability in summer VPD in all of the United States except for Florida and the Northeast, and that VPD does not exert a strong effect on soil dryness in the Northeast and Appalachia. Physically, DTR and mean daily VPD are strongly linked, with VPD having an exponential response to temperature (through saturation vapour pressure, SVP) modulated by relative humidity; VPD = SVP (1 – RH/100). The exponential response of SVP to temperature means that, physically, DTR corresponds to the daytime increase in SVP whilst VPD corresponds directly to the rate of vegetation drying by diffusive evaporation, separate from thermal or photomolecular vaporisation (Tu et al., 2023). Thus, one explanation for the emergence of DTR as a more important contributor to interannual wildfire variability in regions where VPD is less variable could be related to increased atmospheric instability and increased cloud-free days, which result in greater night-time cooling and daytime warming: both of which are associated with elevated wildfire risk (Haines, 1988; Williams et al., 2018). Increases in the expected area per year of the Northern Hemisphere affected by atmospheric blocking (Nabizadeh et al., 2019) could also contribute to this. Atmospheric blocking is associated with long-term cloud-free conditions (Lupo, 2021), which are in turn associated with periods of higher-than-average DTR (Dai et al., 2001), so an increase in blocking events with climate change could explain greater interannual variation in DTR. The fact that DTR becomes a more widespread control after warming shows that despite VPD being an effective predictor of wildfire risk (Sedano and Randerson, 2014) and widely used in empirical fire models (Haas et al., 2024), other metrics for atmospheric drying are more appropriate regionally.
Cumulated GPP over the 50 prior days is the primary control in the more fire-prone regions of the Northwest Forested Mountains, and it is also important over much of the South in the +2°C ensemble. Extreme fires have been linked to short-term acute drought in the South (Barbero et al., 2014), which may explain why variability in short-term vegetation productivity influences fire year variability in such relatively high productivity regions. The increase in importance of this control in the +2°C ensemble, particularly in the top 1% of fire years for occurrences, may reflect the increasing vulnerability to severe drought in some regions with warmer climates.
It was necessary to ensure that the ensemble climate data was directly comparable to the reanalysis data in order to compare the ensemble and reanalysis wildfire models. We bias-corrected and downscaled the climate ensembles to map the climate ensemble onto the local reanalysis distribution using a relatively simple approach. The analyses show that this reduces but does not eliminate bias in the ensemble. The CI downscaling method used in this study can result in some distortion of the spatial covariance of climate variables, but preserves the temporal dynamics and representation of extremes (Maraun, 2013; Hnilica et al., 2017; Sobie and Murdock, 2017). More complex methods of bias correction (e.g., quantile mapping, Grillakis et al., 2017; or multivariate techniques, François et al., 2020) can produce a more precise correspondence but they impose a greater change on the climate-model distribution. The method used here is intended to be more robust by not making extreme – and thus more likely unphysical – alterations to the underlying distribution of the original climate ensemble (see Karger et al., 2023; Tefera et al., 2024; Mosier et al., 2014).
The moments of the ensemble GPP distribution correlate less well to the reanalysis than for other bias-corrected variables (Supplementary Tables 2a,b), and this may help to explain why the reanalysis decadal maxima is consistently lower than the median in more arid ecosystems such as Mediterranean California, the North American Deserts, and the Temperate Sierras. This effect could be because GPP variability is not well reflected in the ensemble, possibly because the simulated fAPAR is based on an optimal response to environmental conditions during a given year and does not take account of prior disturbances or multi-annual changes in soil moisture. Therefore, whilst the ensemble GPP serves as a best estimate for an undisturbed vegetation regime, environments identified as primarily driven by variability in dryness-related predictors would naturally still be controlled by vegetation abundance or productivity in the case of high levels of disturbance, such as deforestation or prior wildfires.
The stochastic realisation of individual fire year conditions drives differences in potential outcomes from an impacts and management perspective. LE approaches have been adopted by the climate impacts community (e.g., Cloke and Pappenberger, 2009; Bevacqua et al., 2023; Van der Wiel et al., 2020), and bring benefits for wildfire modelling, both in gauging the likelihood of fire extremes and in contextualising the observational record. However, there are two difficulties that may limit the use of LEs for wildfire. Firstly, wildfire is influenced by vegetation properties and human-activities more than many other climate-related hazards. The impact of human activities in particular is difficult to simulate reliably. Secondly, as in the case of the renewable energy community (Craig et al., 2022), there is often a need in wildfire studies to look at spatial resolutions finer than available from accessible climate datasets. Despite these difficulties, there are clear benefits to employing LE methods in wildfire modelling – allowing for the better estimation of resource demand in possible extreme years, and characterisation of the interannual variability inherent to a fire regime.
From a fire management perspective, the LE provides information about potential extremes that are not captured in the relatively short observational record and which might therefore pose a challenge for existing wildfire management resources. The approach can be employed to define regions susceptible to very long fire seasons, of use for planning suppression capacity in extreme years. In the southwestern United States, for example, the existing trend of a lengthening fire-season (Jain et al., 2017) continues with future warming. LEs can also be used to understand emerging issues in vulnerability and exposure to wildfire. The proneness of the southern West and southern Great Plains to extreme fire years corresponds to areas of shrubland and grassland, where the development of the wildland urban interface has been greatest (Radeloff et al., 2023). Given the increasing concern about the increasing costs of changing fire regimes in the United States and the likelihood that these will continue to worsen in coming years (Lee et al., 2015; Melvin et al., 2017; Schoennagel et al., 2017; Murphy et al., 2018; Iglesias et al., 2022), the LE approach provides a more robust management framework for assessing fire occurrence and extremes than currently available.
5 Conclusion
The application of an LE approach to wildfire occurrence modelling provides a more robust characterisation of fire regime properties than provided by the observational record. This makes it possible to estimate the likelihood of extreme fire years – as seen both in the probability of fire occurrence and the length of the fire season. Climate warming extends the area that experiences wildfires. More importantly, climate warming affects the average probability of fire occurrence in fire-prone regions and can cause even larger shifts in extremes in some regions. Interannual variability in fire occurrence is largely controlled by factors affecting fuel availability or fuel drying. The relative importance of these controls varies between regions in the present-day climate. However, fuel availability becomes an even more important control on fire probability under climate warming. Application of an LE approach provides a useful tool for characterising fire regimes and how they might change in the future, and thus a stronger basis for designing mitigation and adaptation management strategies.
Data availability statement
The source datasets used this study can be found in the KNMI-LENTIS repository https://doi.org/10.5281/zenodo.7573137. The datasets generated, and code used to generate and analyse new data for this study can be found in the repository https://doi.org/10.5281/zenodo.15040670.
Author contributions
TK: Conceptualization, Data curation, Formal analysis, Investigation, Methodology, Writing – original draft, Writing – review & editing. BZ: Methodology, Resources, Writing – review & editing. WC: Methodology, Resources, Writing – review & editing. TGS: Conceptualization, Methodology, Supervision, Writing – review & editing. ICP: Conceptualization, Methodology, Supervision, Writing – review & editing. KW: Resources, Writing – review & editing. SPH: Conceptualization, Funding acquisition, Methodology, Supervision, Writing – review & editing.
Funding
The author(s) declare that financial support was received for the research and/or publication of this article. This research received support through Schmidt Sciences, LLC (TRK, SPH, ICP, BZ, and WC) and contributes to the LEMONTREE (Land Ecosystem Models based On New Theory, obseRvations and ExperimEnts) project. TRK acknowledges support from the SCENARIO NERC Doctoral Training Programme (NE/S007261/1).
Acknowledgments
We thank colleagues at the Leverhulme Centre for Wildfires, Environment and Society for discussions of this work. We acknowledge computational resources and support provided by the Imperial College Research Computing Service.
Conflict of interest
The authors declare that the research was conducted in the absence of any commercial or financial relationships that could be construed as a potential conflict of interest.
Generative AI statement
The authors declare that no Gen AI was used in the creation of this manuscript.
Publisher’s note
All claims expressed in this article are solely those of the authors and do not necessarily represent those of their affiliated organizations, or those of the publisher, the editors and the reviewers. Any product that may be evaluated in this article, or claim that may be made by its manufacturer, is not guaranteed or endorsed by the publisher.
Supplementary material
The Supplementary material for this article can be found online at: https://www.frontiersin.org/articles/10.3389/ffgc.2025.1519836/full#supplementary-material
References
Abatzoglou, J. T., Battisti, D. S., Williams, A. P., Hansen, W. D., Harvey, B. J., and Kolden, C. A. (2021). Projected increases in western US forest fire despite growing fuel constraints. Commun. Earth Environ. 2, 1–8. doi: 10.1038/s43247-021-00299-0
Arias, P. A., Bellouin, N., Coppola, E., Jones, R. G., Krinner, G., Marotzke, J., et al. (2021). Climate change 2021 – the physical science basis. Cambridge, UK: Cambridge University Press, 35–144.
Balik, J. A., Coop, J. D., Krawchuk, M. A., Naficy, C. E., Parisien, M. A., Parks, S. A., et al. (2024). Biogeographic patterns of daily wildfire spread and extremes across North America. Front. For. Glob. Change 7:361. doi: 10.3389/ffgc.2024.1355361
Barbero, R., Abatzoglou, J. T., Kolden, C. A., Hegewisch, K. C., Larkinb, N. K., and Podschwitb, H. (2014). Multi-scalar influence of weather and climate on very large-fires in the eastern United States. Int. J. Climatol. 35, 2180–2186. doi: 10.1002/joc.4090
Bevacqua, E., Suarez-Gutierrez, L., Jézéquel, A., Lehner, F., Vrac, M., Yiou, P., et al. (2023). Advancing research on compound weather and climate events via large ensemble model simulations. Nat. Commun. 14:2145. doi: 10.1038/s41467-023-37847-5
Buck, A. L. (1981). New equations for computing vapor pressure and enhancement factor. JAMC, 20:12 1527–1532. doi: 10.1175/1520-0450(1981)020\u0026lt;1527:NEFCVP\u0026gt;2.0.CO;2
Cai, W., and Prentice, I. C. (2020). Recent trends in gross primary production and their drivers: analysis and modelling at flux-site and global scales. Environ. Res. Lett. 15:124050. doi: 10.1088/1748-9326/abc64e
Cai, W., Zhu, Z., Harrison, S. P., Ryu, Y., Wang, H., Zhou, B., et al. (2025). A unifying principle for global greenness patterns and trends. Nature Communication and Environment 6:9. doi: 10.1038/s43247-025-01992-0
Chuvieco, E., Pettinari, M. L., Koutsias, N., Forkel, M., Hantson, S., and Turco, M. (2021). Human and climate drivers of global biomass burning variability. Sci. Total Environ. 779:146361. doi: 10.1016/j.scitotenv.2021.146361
Cloke, H. L., and Pappenberger, F. (2009). Ensemble flood forecasting: a review. J. Hydrol. 375, 613–626. doi: 10.1016/j.jhydrol.2009.06.005
Commission for Environmental Cooperation (Montréal, Québec) and Secretariat (1997). Ecological regions of North America: Toward a common perspective. New York: The Commission.
Craig, M. T., Wohland, J., Stoop, L. P., Kies, A., Pickering, B., Bloomfield, H. C., et al. (2022). Overcoming the disconnect between energy system and climate modeling. Joule 6, 1405–1417. doi: 10.1016/j.joule.2022.05.010
Crossett, C. C., Betts, A. K., Dupigny-Giroux, L. A. L., and Bomblies, A. (2020). Evaluation of daily precipitation from the ERA5 global reanalysis against GHCN observations in the northeastern United States. Climate 8:148. doi: 10.3390/cli8120148
Cunningham, C. X., Williamson, G. J., and Bowman, D. M. J. S. (2024). Increasing frequency and intensity of the most extreme wildfires on earth. Nat. Ecol. Evol 2024:2452. doi: 10.1038/s41559-024-02452-2
Dai, A., Wigley, T. M. L., Boville, B. A., Kiehl, J. T., and Buja, L. E. (2001). Climates of the twentieth and twenty-first centuries simulated by the NCAR climate system model. J. Clim. 14, 485–519. doi: 10.1175/1520-0442(2001)014<0485:COTTAT>2.0.CO;2
Döscher, R., Acosta, M., Alessandri, A., Anthoni, P., Arneth, A., Arsouze, T., et al. (2021). The EC-earth3 earth system model for the climate model intercomparison project 6. Geosci. Model Dev. Discuss. 15, 2973–3020. doi: 10.5194/gmd-15-2973-2022
Dye, A. W., Gao, P., Kim, J. B., Lei, T., Riley, K. L., and Yocom, L. (2023). High-resolution wildfire simulations reveal complexity of climate change impacts on projected burn probability for Southern California. Fire Ecol. 19, 1–19. doi: 10.1186/s42408-023-00179-2
ECMWF. (2025). Changes to the forecasting system. ECMWF, Available at: https://confluence.ecmwf.int/display/FCST/Changes+to+the+forecasting+system.
Ellis, T. M., Bowman, D. M., Jain, P., Flannigan, M. D., and Williamson, G. J. (2022). Global increase in wildfire risk due to climate-driven declines in fuel moisture. Glob. Change Biol. 28, 1544–1559. doi: 10.1111/gcb.16006
EPA. (2024). Technical documentation: Wildfires. United States Environmental Protection Agency. Available online at: https://www.epa.gov/system/files/documents/2024-06/wildfires_documentation.pdf (Accessed 10 Sep 2024).
François, B., Vrac, M., Cannon, A. J., Robin, Y., and Allard, D. (2020). Multivariate bias corrections of climate simulations: which benefits for which losses? Earth Syst. Dynam. 11, 537–562. doi: 10.5194/esd-11-537-2020
Grillakis, M. G., Koutroulis, A. G., Daliakopoulos, I. N., and Tsanis, I. K. (2017). A method to preserve trends in quantile mapping bias correction of climate modeled temperature. Earth Syst. Dynam. 8, 889–900. doi: 10.5194/esd-8-889-2017
Guyette, R. P., Stambaugh, M. C., Marschall, J., and Abadir, E. (2015). An analytic approach to climate dynamics and fire frequency in the Great Plains. GPR 25, 139–150. doi: 10.1353/gpr.2015.0031
Haas, O., Keeping, T., Gomez-Dans, J., Prentice, I. C., and Harrison, S. P. (2024). The global drivers of wildfire. Front. Environ. Sci. 12:1438262. doi: 10.3389/fenvs.2024.1438262
Haines, D. A. (1988). A lower atmosphere severity index for wildlife fires. National Weather Digest 13, 23–27.
Hnilica, J., Hanel, M., and Puš, V. (2017). Multisite bias correction of precipitation data from regional climate models. Int. J. Climatol. 37, 2934–2946. doi: 10.1002/joc.4890
Hunter, R. D., and Meentemeyer, R. K. (2005). Climatologically aided mapping of daily precipitation and temperature. J. Appl. Meteorol. 44, 1501–1510. doi: 10.1175/JAM2295.1
Ibebuchi, C. C., Lee, C. C., Silva, A., and Sheridan, S. C. (2024). Evaluating apparent temperature in the contiguous United States from four reanalysis products using artificial neural networks. JGR 1:2 e2023JH000102. doi: 10.1029/2023JH000102
Iglesias, V., Balch, J. K., and Travis, W. R. (2022). US fires became larger, more frequent, and more widespread in the 2000s. Sci. Adv. 8:11 eabc0020. doi: 10.1126/sciadv.abc0020
Jain, P., Wang, X., and Flannigan, M. D. (2017). Trend analysis of fire season length and extreme fire weather in North America between 1979 and 2015. Int. J. Wildland Fire 26, 1009–1020. doi: 10.1071/WF17008
Jeong, S., Ryu, Y., Gentine, P., Lian, X., Fang, J., Li, X., et al. (2024). Persistent global greening over the last four decades using novel long-term vegetation index data with enhanced temporal consistency. Rem. Sens. Environ. 311:114282. doi: 10.1016/j.rse.2024.114282
Karger, D. N., Nobis, M. P., Normand, S., Graham, C. H., and Zimmermann, N. E. (2023). CHELSA-TraCE21k–high-resolution (1 km) downscaled transient temperature and precipitation data since the last glacial maximum. Clim. Past 19, 439–456. doi: 10.5194/cp-19-439-2023
Keeping, T., Harrison, S. P., and Prentice, I. C. (2024). Modelling the daily probability of wildfire occurrence in the contiguous United States. Environ. Res. Lett. 19:024036. doi: 10.1088/1748-9326/ad21b0
Kelley, D. I., Bistinas, I., Whitley, R., Burton, C., Marthews, T. R., and Dong, N. (2019). How contemporary bioclimatic and human controls change global fire regimes. Nat. Clim. Chang. 9, 690–696. doi: 10.1038/s41558-019-0540-7
Kerr, G. H., DeGaetano, A. T., Stoof, C. R., and Ward, D. (2018). Climate change effects on wildland fire risk in the northeastern and Great Lakes states predicted by a downscaled multi-model ensemble. Theor. Appl. Climatol. 131, 625–639. doi: 10.1007/s00704-016-1994-4
Knapp, P. A. (1998). Spatio-temporal patterns of large grassland fires in the intermountain west, USA. Glob. Ecol. Biogeo. Lett 7, 259–272. doi: 10.2307/2997600
Knauer, J., Cuntz, M., Smith, B., Canadell, J. G., Medlyn, B. E., Bennett, A. C., et al. (2023). Higher global gross primary productivity under future climate with more advanced representations of photosynthesis. Sci. Adv. 9:eadh9444. doi: 10.1126/sciadv.adh9444
Lavers, D. A., Simmons, A., Vamborg, F., and Rodwell, M. J. (2022). An evaluation of ERA5 precipitation for climate monitoring. Q. J. R. Meteorol. Soc. 148:3152. doi: 10.1002/qj.4351
Lee, C., Schlemme, C., Murray, J., and Unsworth, R. (2015). The cost of climate change: ecosystem services and wildland fires. Ecol. Econ. 116, 261–269. doi: 10.1016/j.ecolecon.2015.04.020
Lu, Q., Liu, H., Wei, L., Zhong, Y., and Zhou, Z. (2024). Global prediction of gross primary productivity under future climate change. Sci. Total Environ. 912:169239. doi: 10.1016/j.scitotenv.2023.169239
Lupo, A. R. (2021). Atmospheric blocking events: a review. Ann. N. Y. Acad. Sci. 1504, 5–24. doi: 10.1111/nyas.14557
Maraun, D. (2013). Bias correction, quantile mapping, and downscaling: revisiting the inflation issue. J. Clim. 26, 2137–2143. doi: 10.1175/JCLI-D-12-00821.1
McGranahan, D. A., and Wonkka, C. L. (2024). Pyrogeography of the Western Great Plains: a 40-year history of fire in semi-arid rangelands. Fire 7:32. doi: 10.3390/fire7010032
Mosier, T. M., Hill, D. F., and Sharp, K. V. (2014). 30-Arcsecond monthly climate surfaces with global land coverage. Int. J. Climatol. 34, 2175–2188. doi: 10.1002/joc.3829
Mueller, S. E., Thode, A. E., Margolis, E. Q., Yocom, L. L., Young, J. D., and Iniguez, J. M. (2020). Climate relationships with increasing wildfire in the southwestern US from 1984 to 2015. For. Ecol. Manag. 460:117861. doi: 10.1016/j.foreco.2019.117861
Melvin, A. M., Murray, J., Boehlert, B., Martinich, J. A., Rennels, L., and Rupp, T. S. (2017). Estimating wildfire response costs in Alaska’s changing climate. Clim. Chang. 141, 783–795. doi: 10.1007/s10584-017-1923-2
Muñoz-Sabater, J., Dutra, E., Agustí-Panareda, A., Albergel, C., Arduini, G., Balsamo,, et al. (2021). ERA5-land: a state-of-the-art global reanalysis dataset for land applications. ESSD 13, 4349–4383. doi: 10.5194/essd-13-4349-2021
Murphy, B. P., Yocom, L. L., and Belmont, P. (2018). Beyond the 1984 perspective: narrow focus on modern wildfire trends underestimates future risks to water security. Earth's Future 6, 1492–1497. doi: 10.1029/2018EF001006
Muntjewerf, L., Bintanja, R., Reerink, T., and van der Wiel, K. (2023). The KNMI Large Ensemble Time Slice (KNMI–LENTIS), Geosci. Model Dev. 16 4581–4597. doi: 10.5194/gmd-16-4581-2023
Nabizadeh, E., Hassanzadeh, P., Yang, D., and Barnes, E. A. (2019). Size of the atmospheric blocking events: scaling law and response to climate change. Geophys. Res. Lett. 46, 13488–13499. doi: 10.1029/2019GL084863
Parisien, M. A., and Moritz, M. A. (2009). Environmental controls on the distribution of wildfire at multiple spatial scales. Ecol. Monogr. 79, 127–154. doi: 10.1890/07-1289.1
Radeloff, V. C., Mockrin, M. H., Helmers, D., Carlson, A., Hawbaker, T. J., Martinuzzi,, et al. (2023). Rising wildfire risk to houses in the United States, especially in grasslands and shrublands. Science 382, 702–707. doi: 10.1126/science.ade9223
Richardson, D., Black, A. S., Irving, D., Matear, R. J., Monselesan, D. P., Risbey, J. S., et al. (2022). Global increase in wildfire potential from compound fire weather and drought. NPJ Clim. Atmos. Sci. 5:23. doi: 10.1038/s41612-022-00248-4
Sasai, T., Kawase, H., Kanno, Y., Yamaguchi, J., Sugimoto, S., Yamazaki,, et al. (2019). Future projection of extreme heavy snowfall events with a 5-km large ensemble regional climate simulation. Geophys. Res. Atmos. 124, 13975–13990. doi: 10.1029/2019JD030781
Sayedi, S. S., Abbott, B. W., Vannière, B., Leys, B., Colombaroli, D., Romera,, et al. (2024). Assessing changes in global fire regimes. Fire Ecol. 20, 1–22. doi: 10.1186/s42408-023-00237-9
Schoennagel, T., Balch, J. K., Brenkert-Smith, H., Dennison, P. E., Harvey, B. J., Krawchuk, M. A., et al. (2017). Adapt to more wildfire in western north American forests as climate changes. PNAS 114, 4582–4590. doi: 10.1073/pnas.1617464114
Seager, R., Hooks, A., Williams, A. P., Cook, B., Nakamura, J., and Henderson, N. (2015). Climatology, variability, and trends in the US vapor pressure deficit, an important fire-related meteorological quantity. J. Appl. Math. Comput. 54, 1121–1141. doi: 10.1175/JAMC-D-14-0321.1
Sedano, F., and Randerson, J. (2014). Multi-scale influence of vapor pressure deficit on fire ignition and spread in boreal forest ecosystems. Biogeo 11, 3739–3755. doi: 10.5194/bg-11-3739-2014
Shepherd, T. G. (2019). Storyline approach to the construction of regional climate change information. Proc. Math. Phys. Eng. Sci. 475:20190013. doi: 10.1098/rspa.2019.0013
Short, K. C. (2022). Spatial wildfire occurrence data for the United States, 1992–2020 [FPA_FOD_20221014]. 6th Edn. FS RDA.
Smith, A. J., Jones, M. W., Abatzoglou, J. T., Canadell, J. G., and Betts, R. A. (2020). Climate change increases the risk of wildfires. ScienceBrief, Available online at: https://sciencebrief.org/topics/climate-change-science/wildfires/explorer.
Sobie, S. R., and Murdock, T. Q. (2017). High-resolution statistical downscaling in southwestern British Columbia. J. Appl. Meteorol. Clim. 56, 1625–1641. doi: 10.1175/JAMC-D-16-0287.1
Squire, D. T., Richardson, D., Risbey, J. S., Black, A. S., Kitsios, V., Matear, R. J., et al. (2021). Likelihood of unprecedented drought and fire weather during Australia’s 2019 megafires. NPJ Clim. Atmos. Sci. 4:64. doi: 10.1038/s41612-021-00220-8
Stocker, B. D., Wang, H., Smith, N. G., Harrison, S. P., Keenan, T. F., Sandoval, D., et al. (2020). P-model v1. 0: an optimality-based light use efficiency model for simulating ecosystem gross primary production. GMD 13:1545. doi: 10.5194/gmd-13-1545-2020
Suarez-Gutierrez, L., Müller, W. A., Li, C., and Marotzke, J. (2020). Hotspots of extreme heat under global warming. Clim. Dyn. 55, 429–447. doi: 10.1007/s00382-020-05263-w
Sullivan, A., Baker, E., Kurvits, T., Popescu, A., Paulson, A. K., Cardinal Christianson, A., et al. (2022). Spreading like wildfire: The rising threat of extraordinary landscape fires. Nairobi, Kenya: UNEP.
Tefera, G. W., Ray, R. L., and Wootten, A. M. (2024). Evaluation of statistical downscaling techniques and projection of climate extremes in Central Texas, USA. Weather Clim. Extrem. 43:100637. doi: 10.1016/j.wace.2023.100637
Touma, D., Stevenson, S., Swain, D. L., Singh, D., Kalashnikov, D. A., and Huang, X. (2022). Climate change increases risk of extreme rainfall following wildfire in the western United States. Sci. Adv. 8:eabm0320. doi: 10.1126/sciadv.abm0320
Tu, Y., Zhou, J., Lin, S., Alshrah, M., Zhao, X., and Chen, G. (2023). Plausible photomolecular effect leading to water evaporation exceeding the thermal limit. PNAS 120:e2312751120. doi: 10.1073/pnas.2312751120
Van der Wiel, K., Lenderink, G., and de Vries, H. (2021). Physical storylines of future European drought events like 2018 based on ensemble climate modelling. Weather Clim. Extrem. 33:100350. doi: 10.1016/j.wace.2021.100350
Van der Wiel, K., Wanders, N., Selten, F. M., and Bierkens, M. F. P. (2019). Added value of large ensemble simulations for assessing extreme river discharge in a 2 C warmer world. Geophys. Res. Lett. 46, 2093–2102. doi: 10.1029/2019GL081967
Van der Wiel, K., Selten, F. M., Bintanja, R., Blackport, R., and Screen, J. A. (2020). Ensemble climate-impact modelling: extreme impacts from moderate meteorological conditions. Environ. Res. Lett. 15:034050. doi: 10.1088/1748-9326/ab7668
Wang, H., Prentice, I. C., Keenan, T. F., Davis, T. W., Wright, I. J., Cornwell, W. K., et al. (2017). Towards a universal model for carbon dioxide uptake by plants. Nat. Plants 3, 734–741. doi: 10.1038/s41477-017-0006-8
Williams, A. P., Gentine, P., Moritz, M. A., Roberts, D. A., and Abatzoglou, J. T. (2018). Effect of reduced summer cloud shading on evaporative demand and wildfire in coastal southern California. GRL 45, 5653–5662. doi: 10.1029/2018GL077319
Williams, A. P., Abatzoglou, J. T., Gershunov, A., Guzman-Morales, J., Bishop, D. A., Balch, J. K., et al. (2019). Observed impacts of anthropogenic climate change on wildfire in California. Earth’s Fut. 7, 892–910. doi: 10.1029/2019EF001210
Yue, X., Mickley, L. J., and Logan, J. A. (2014). Projection of wildfire activity in southern California in the mid-twenty-first century. Clim. Dyn. 43, 1973–1991. doi: 10.1007/s00382-013-2022-3
Zhou, B., Cai, W., Zhu, Z., Wang, H., Harrison, S. P., and Prentice, I. C. (2025). A general model for the seasonal to decadal dynamics of leaf area. Global Change Biology e70125. doi: 10.1111/gcb.70125
Zhu, Z., Wang, H., Harrison, S. P., Prentice, I. C., Qiao, S., and Tan, S. (2023). Optimality principles explaining divergent responses of alpine vegetation to environmental change. Glob. Change Biol. 29, 126–142. doi: 10.1111/gcb.16459
Keywords: wildfire, wildfire risk, wildfire occurrence, climate variability, large ensembles, LES, climate impacts, interannual variability
Citation: Keeping TR, Zhou B, Cai W, Shepherd TG, Prentice IC, van der Wiel K and Harrison SP (2025) Present and future interannual variability in wildfire occurrence: a large ensemble application to the United States. Front. For. Glob. Change. 8:1519836. doi: 10.3389/ffgc.2025.1519836
Edited by:
Ana Cristina Russo, University of Lisbon, PortugalReviewed by:
Rita Margarida Cardoso, University of Lisbon, PortugalLuciana Ghermandi, National Scientific and Technical Research Council (CONICET), Argentina
Thomas Adam Coates, Virginia Tech, United States
Copyright © 2025 Keeping, Zhou, Cai, Shepherd, Prentice, van der Wiel and Harrison. This is an open-access article distributed under the terms of the Creative Commons Attribution License (CC BY). The use, distribution or reproduction in other forums is permitted, provided the original author(s) and the copyright owner(s) are credited and that the original publication in this journal is cited, in accordance with accepted academic practice. No use, distribution or reproduction is permitted which does not comply with these terms.
*Correspondence: Theodore R. Keeping, dC5yLmtlZXBpbmdAcGdyLnJlYWRpbmcuYWMudWs=