- 1Oak Ridge Institute for Science and Education (ORISE), Oak Ridge, TN, United States
- 2Pacific Southwest Research Station, Forest Service (USDA), Riverside, CA, United States
- 3Department of Forestry and Environmental Resources, North Carolina State University, Raleigh, NC, United States
- 4California Department of Forestry and Fire Protection, Sacramento, CA, United States
- 5Institute for Natural Resources, Oregon State University, Corvallis, OR, United States
A key issue in landscape management, whether public or private, is the mitigation of disturbance events that impact vegetation, ecosystem health, and thus ecosystem services (ESs). Although many studies have found significant tree mortality due to insect infestations, there is still insufficient understanding of how these infestations alter ESs and their associated economic values. Addressing this research gap can assist forest managers and decision-makers in refining and implementing adaptive management practices and policies, while enhancing the resilience of forests and their ESs. We investigated the impacts of bark beetle outbreaks on three ESs (timber provisioning, water retention, and carbon sequestration) in the Lake Tahoe region of Northern California and Northern Nevada. Using the landscape simulation model LANDIS-II, we examined differences between a business-as-usual management scenario and an enhanced management scenario with respect to the amount of aboveground tree biomass and ESs impacted by beetle outbreaks. Since insect infestation is also influenced by climate, each of the two management scenarios considered three different climate scenarios: a scenario with average historical climate (no climate change); a warmer, wetter scenario from the Model for Interdisciplinary Research on Climate (MIROC); and a hotter, drier scenario from the Centre National de Recherches Météorologiques (CNRM). Results show that a warmer and drier climate results in more severe beetle-induced tree mortality than a wetter and cooler climate, resulting in greater negative impacts to ESs. The estimated loss of ES value is approximately $0.2 to $0.8 million USD per year. Enhanced management is more capable than business-as-usual practices to prevent beetle damages to trees and ESs.
1 Introduction
Climate change has led to an increase in global temperatures, higher variation in precipitation, changes in extreme weather patterns, sea level rise, and melting ice and snow. As a result, it has impacted various aspects of ecosystems including the degradation of habitat quality, adjustments in food chains, and variations in ecological functions (U.S. Global Change Research Program, 2017; IPBES, 2019; IPCC, 2021, 2023; Chen, 2024). Consequently, evidence (Erauskin-Extramiana et al., 2020; Nature Climate Change Editorial, 2020; Aguirre-Liguori et al., 2021; Coelho et al., 2023) has suggested that shifts in the distribution and abundance of species, including plants, fish, mammals, birds, and insects, have occurred across many regions of the world. Insects are the most widespread and diverse group of animal species across the biosphere and are particularly sensitive to climate change. This is due to their relatively rapid reproduction rates, ectothermic nature, disruption of their life cycles (e.g., breeding, reproduction, or hibernation) by temperature changes, and their sensitivity to extreme weather events (e.g., heatwaves, droughts, heavy rainfalls) (Harvey et al., 2020; Skendžić et al., 2021; Harvey et al., 2023). This is also true for bark beetles.
There are many climate-related drivers of bark beetle mortality and population growth rate. For example, studies (Bentz et al., 2010; Fettig et al., 2021; Singh et al., 2024) have noted that global warming (1) enables bark beetles to complete their life cycles more quickly, increasing the possibility for producing more generations within a year; (2) allows bark beetles to expand their habitats to places with higher elevations and latitudes where they previously could not survive; (3) extends the warm period of a year, giving bark beetles more sufficient time to reproduce; (4) makes winter milder and reduces overwintering mortality of bark beetles; and (5) increases drought stress on trees, reducing trees’ ability to defend themselves against bark beetle infestations.
Bark beetles, measuring less than 6.35 millimeters in size, bore through the protective bark of a tree to lay their eggs in the cambial layer (U.S. Forest Service, 2015). Typically, the adult female beetle creates the parent gallery by depositing eggs along its walls. The eggs then hatch, and the larvae develop larval galleries that widen as the larvae grow (Ray et al., 2019). They feed on living tissue, disrupting the tree’s nutrient transport. They can increase dramatically when sufficient food is available. This typically occurs in drought-stressed trees (Raffa et al., 2008). Consequently, during population outbreaks, bark beetles can increase tree mortality in forests, impacting ecosystem services (ESs), which denote the benefits people obtain from ecosystems (Millennium Ecosystem Assessment, 2005).
Forests with bark beetle infestation have experienced alterations in ESs, ultimately resulting in socioeconomic impacts on people living, working, and recreating in or near these areas (Flint et al., 2009; Cottrell et al., 2020). For example, communities near beetle-infested forests have observed changes in property values and water quality, as beetles impacted the aesthetic appeal of landscapes and the concentrations of nutrients and heavy metals in water (Morris et al., 2018). The altered view of landscapes due to beetle-induced tree mortality can also influence visitors’ tourism experiences (Arnberger et al., 2018). Beetle-induced tree mortality also threatens the livelihoods of people who rely on forest products (e.g., timber) for their income (Müller, 2011). Moreover, bark beetle outbreaks have improved the costs for forest management and biodiversity conservation, such as through diminishing the effectiveness of forest restoration (Kortmann et al., 2021).
However, both de Groot et al. (2010) and Chen et al. (2022) have highlighted the research gap in the quantification of how changes in environmental components, including insect species, can influence the economic values of ESs. We also did not find any exiting study measuring how changes in bark beetle population can change ESs’ economic values. Addressing this gap becomes especially challenging when integrating climate factors into the assessments. This is due to the added uncertainties in modeling climate (Stoeckl et al., 2021), predicting future environmental conditions (Balloffet et al., 2012), and attributing environmental impacts to climate change and other potential drivers (Runting et al., 2017).
Despite these challenges, enhancing the understanding of how climate-driven bark beetle outbreaks can impact the quantities and values of ESs is a crucial step toward refining and implementing forest policies and management practices to improve forests’ adaptive capacity, which is the capability to adapt to climate and environmental changes (Engle, 2011; Cottrell et al., 2020). Specifically, ES valuation does not replace other arguments for bark beetle management from other disciplines, such as biology, law, and traditional culture. Instead, it provides an additional perspective of why beetle outbreaks and global warming matter to humans through linking climate-driven beetle outbreaks with the subsequent impacts on human wellbeing and economic values. Previous studies (Turner et al., 2010; Costanza et al., 2017; United Nations SEEA-EA, 2021; Chen et al., 2023) have also suggested that ES valuation is useful for raising awareness of human-nature interdependence, enabling comparisons between environmental and economic benefits using the same unit (e.g., monetary), motivating investment in nature conservation, and assisting in cost–benefit analyses of forest and land use policies.
To address the research gap in the impacts of climate-driven bark beetle outbreaks on the values of ESs, we conducted a case study of the Tahoe Central Sierra Initiative (TCSI) region, USA, utilizing the forest landscape model LANDIS-II. Previous studies have also conducted LANDIS-II to explore future forest responses to different disturbance patterns (Tonini et al., 2018), climate conditions (Maxwell et al., 2022), and management activities (Hof et al., 2017; Holland et al., 2022). By simulating these responses under a wide variety of conditions, we can broaden our knowledge of the diverse impacts of climate change on human wellbeing and raise awareness of the roles bark beetles play in affecting the socioeconomic benefits derived from a landscape. These insights can support land managers and decision makers in fostering the efficient allocation of resources for climate change adaptation, improving ecosystem resilience, and ultimately enhancing nature’s contributions to humans. While this study was conducted in a local region, it can still serve as a reference for researchers in other regions of the world to connect climate-driven changes in insect populations to the changes in ES quantities and values.
2 Materials and methods
The beetles simulated in our model included four major beetle species in California: fir engraver (Scolytus ventralis), Jeffrey pine beetle (Dendroctonus jeffreyi), mountain pine beetle (Dendroctonus ponderosae), and western pine beetle (Dendroctonus brevicomis). The commonalities among these beetles include targeting dense stands of intermediate to large trees and generally reaching epidemic status when trees are stressed by drought. Their primary difference lies in the tree species they target: the Jeffrey pine beetle exclusively targets Jeffrey pine (Smith et al., 2009); the mountain pine beetle prefers lodgepole pine but will also attack ponderosa pine (Gibson et al., 2009); the western pine beetle attacks all pine species (Homicz et al., 2022); the fir engraver targets firs. For more information on how these four species differ from other beetle species not covered in this study, please refer to the U.S. Forest Service (2024).
Our assessments were based on six scenarios (see Section 2.2). In each scenario, we first used LANDIS-II to assess aboveground live tree biomass killed by beetles (see Section 2.3). LANDIS-II conducted five runs for each scenario and averaged the results of these runs as the final results for this study. Biomass generally refers to the organic material derived from living or recently living organisms, such as plants and animals (FAO, 2024; U.S. Energy Information Administration, 2024). However, throughout the rest of this paper, the term “biomass” specifically refers to aboveground live tree biomass, unless stated otherwise. Then we connected biomass loss to the biophysical quantity loss of ESs using multiple ecological equations (see Section 2.4) and converted ESs’ biophysical quantity loss to economic value loss using multiple valuation approaches (see Section 2.5). We also estimated the management costs of each scenario (see Section 2.6).
Moreover, we compared the results across the six scenarios. The differences in outcomes were direct consequences of the model’s design and the underlying assumptions of each scenario, rather than random variability. This enables us to interpret and compare the predicted results without the need for statistical testing. Furthermore, the rule of thumb for statistical tests to achieve reliable large-sample properties typically requires a sample size of at least 30. Using only five observations per scenario for statistical testing could lead to misleading results. Therefore, we reported the differences as simple averages without referencing any statistical tests. The following subsections will introduce our study region and specify the process of our assessment.
2.1 Study region
The TCSI region is designated to restore the health and resilience of 2.4 million acres (∼9,700 km2) of forests and watersheds (U.S. Forest Service, 2023b). This region is in the northeastern part of the state of California and northwest Nevada in the United States, encompassing the adjacent areas around Lake Tahoe. Overall, 84% of this region is covered by forested vegetation, primarily consisting of Sierran mixed conifer, Douglas-fir, white fir, and red fir on the west slope, with a greater prevalence of Jeffrey pine on the east slope (Wilson and Manley, 2021). The forested area is divided into seven management zones. According to Manley et al. (2023) and Wilson and Manley (2021), these include: Private Industrial Zone, privately owned for industrial timber production; Private Non-industrial Zone, privately owned for non-industrial timber production; Public Forests; Roadless Zone, characterized by undisturbed soil, water, and forest vegetation; Wilderness Zone, publicly managed to preserve natural conditions and provide opportunities for solitude or primitive recreation; Defense Zone, located 0.4 km from developed areas; Threat Zone, located 2 km from developed areas. The location of the TCSI region and the boundaries of its management zones are shown in Figure 1.
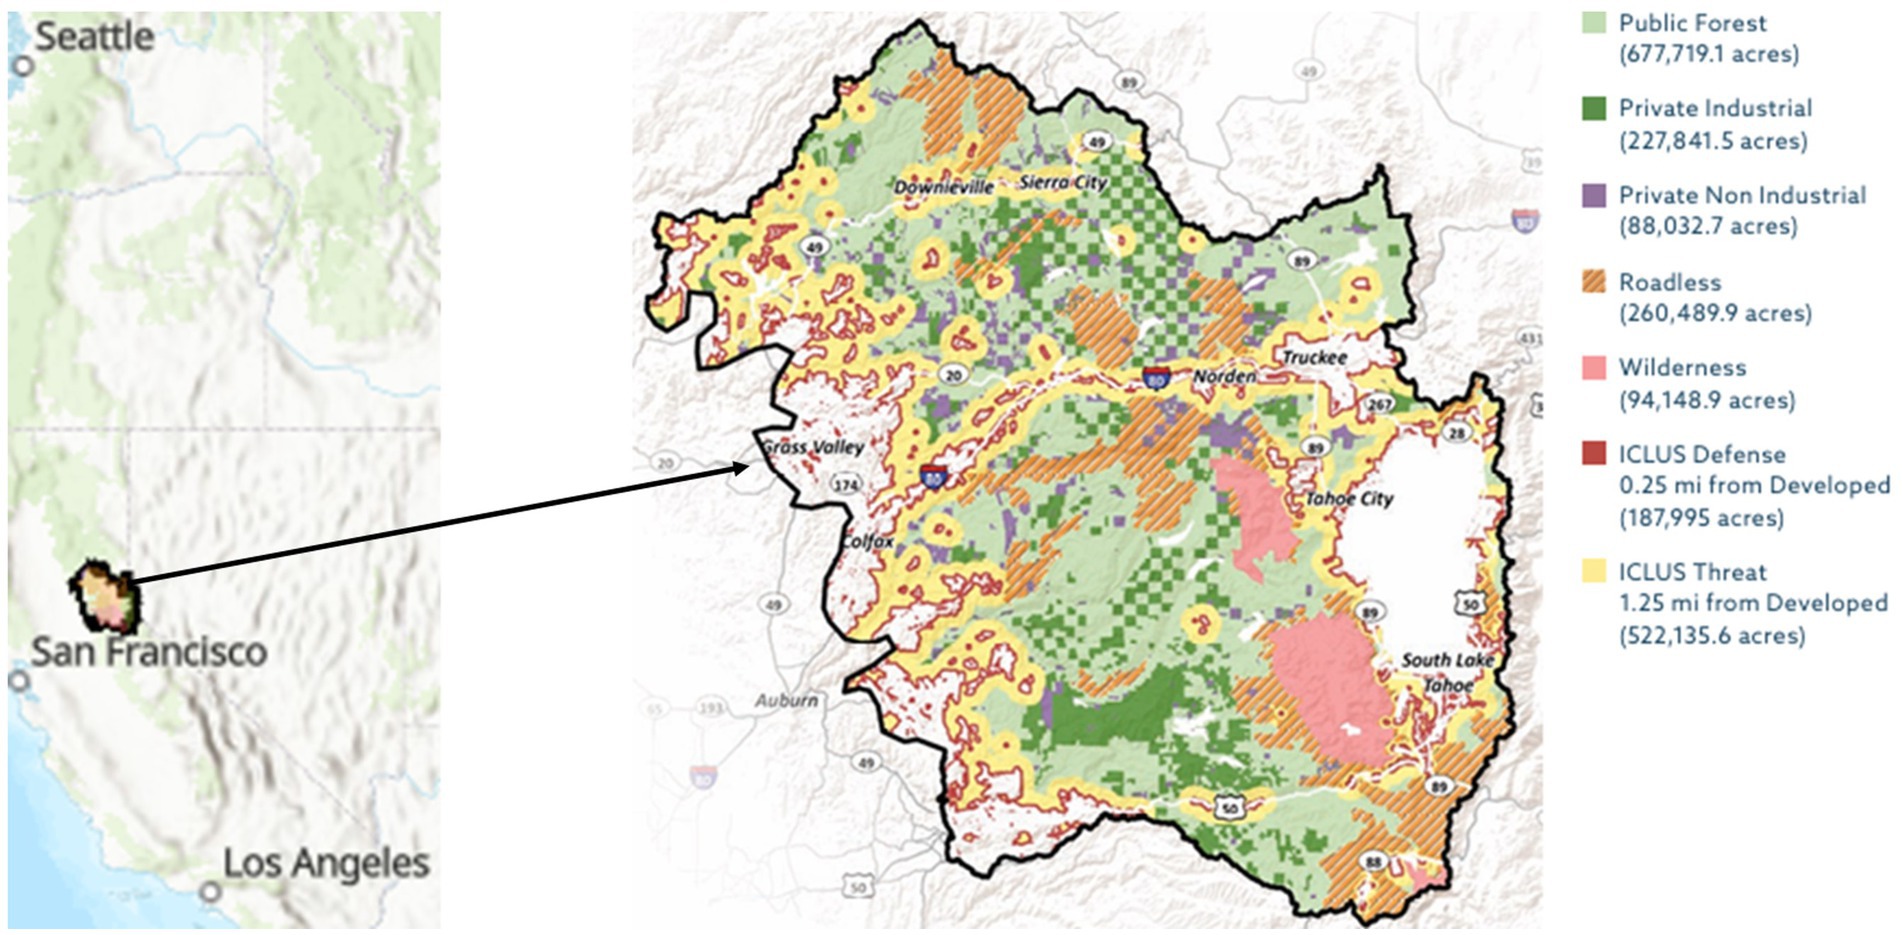
Figure 1. Location (on the left) and management zones (one the right) of the TCSI region adapted from Wilson and Manley (2021) and U.S. Forest Service (2023b).
This region is a recreational destination with its recreation industry valued between $1.35 and $1.84 billion per year (Nyelele et al., 2023). It also provides a diverse set of provisioning and regulating ESs (Chung et al., 2024), including water, timber, and carbon sequestration. Thus, this region is an important area for providing ESs and has received substantial funding for environmental protection. For example, since 1997, the U.S. Environmental Protection Agency (2022) alone has invested 47 million dollars in this region to implement conservation practices, such as water cleaning, forest restoration, and soil conservation. Despite existing conservation efforts, studies (Wayman and Safford, 2021; Tahoe Regional Planning Agency, 2024) still found that bark beetle outbreaks have resulted in an uncharacteristically large mass of dead trees in the TCSI region.
2.2 Design of scenarios
We first designed two different management scenarios: business-as-usual (BAU) management and enhanced management (EM), both implemented in the Private Industrial Zone, Private Non-industrial Zone, Defense Zone, and Threat Zone. More specifically, the BAU scenario modeled removals (including thinning and clear-cutting) of drought-weakened, dead, or dying trees that are more favorable to beetle infestations on roughly 0.37% of the landscape annually. Such biomass removals mirrored the average annual forest treatment by public and private land managers in the study area based on the U.S. Forest Service FACTs database. The EM scenario was set to increased biomass removals to 3.1% of the landscape annually and involve prescribed fire on roughly 1.5% of the landscape annually. The pace of prescribed fire was set to match historic fire return interval (the time between two successive fires) at the TCSI region. The LANDIS-II simulation used for the TCSI Initiative, according to Manley et al. (2023), calculated the historical fire return interval at the scale of 30-m pixels based on the Fire Occurrence Data (1970–2019) of the California Department of Forestry and Fire Protection.
For each of the management scenarios, we assessed biomass loss under three different climate change trajectories: historical climate, CNRM, and MIROC. Historical climate data were taken from the gridMet dataset (Abatzoglou, 2013) and future climate data were from the Multivariate Adaptive Constructed Analogs (MACA) downscaled CMIP5 global circulation models (Abatzoglou and Brown, 2012). Specifically, the historical climate simulated the recorded climate status in the history without integrating future changes. It served as a baseline for comparing the impacts of climate change. For modeling the impacts of climate change, we utilized representative concentration pathway (RCP) 8.5, as RCP 8.5 best represents current and expected near term emissions levels (Schwalm et al, 2020). We used modeled RCP 8.5 scenarios from the Model for Interdisciplinary Research on Climate (MIROC) and the Centre National de Recherches Météorologiques (CNRM), two global circulation models recommended by the California Department of Water Resources (2015). Overall, both CNRM and MIROC projected a warmer climate than historical climate, with MIROC being slightly hotter than CNRM. However, CNRM was set to be wetter than historical climate, while MIROC was set to be drier than historical climate (Pierce et al., 2018; Riordan et al., 2018; Renteria et al., 2021).
With the two management scenarios and three climate change assumptions, we developed six different simulations in total. These include the following: MIROC-BAU (business-as-usual under MIROC), MIROC-EM (enhanced management under MIROC), CNRM-BAU (business-as-usual under CNRM), CNRM-EM (enhanced management under CNRM), Historical-BAU (business-as-usual under Historical Climate), and Historical-EM (enhanced management under Historical Climate). For more details regarding how LANDIS-II was parameterized, see Maxwell et al. (2022).
2.3 Assessment of loss of live biomass
We estimated the annual biomass of trees killed by beetles between 2020 and 2,100. Tree mortality caused by beetle outbreaks was simulated using the Biomass Biological Disturbance Agent (BiomassBDA) extension to LANDIS-II (Sturtevant et al., 2004). LANDIS-II is an open-source forest landscape and disturbance succession model that combines process and phenomenological based modeling to simplify computational complexity to allow scaling across larger landscapes. Here we used the v7.0, with the succession extension NECN v6.6, with the fire extension SCRPPLE v.3.0, along with a climate sensitive version of the Biomass BDA extension v.2.1 to model insect behavior. Additional details regarding the LANDIS-II model can be found in LANDIS-II-Foundation (2019).
In BiomassBDA, beetle outbreaks are driven by climate (winter temperature and climatic water deficit) and constrained by spatial contagion rules, while spread of beetle outbreaks percolates through the landscape using sites that contain suitable host species. Following insect-species-specific parameters developed by Maxwell et al. (2022), such as dispersal distance from initial outbreak location, whether the beetle species responds to pheromone aggregation, and the search radius for other suitable hosts, we parameterized the outbreaks for the four beetle species (those mentioned earlier) to predict the timing and extent of outbreaks and the mortality of trees at two phases (baseline situation and epidemic situation). For outbreak timing, the thresholds for Climatic Water Deficit and weather were calibrated to generate historic patterns of outbreaks found in the US Forest Service Aerial Detection Survey (ADS) data.
To estimate the area affected by each beetle species, we utilized two types of data: the ADS polygons, which illustrate the spatial extent of outbreaks for each beetle species across different years, and the remotely sensed product developed by the Ecosystem Disturbance and Recovery Tracker (eDaRT) (Koltunov et al., 2020), which indicates the spatial extent of forests where insect-induced tree mortality occurred in various years (as reflected by remotely sensed canopy coverage). Specifically, we attributed the change in canopy cover to specific beetle species through overlaying the ADS polygons onto the eDaRT data. However, while the eDaRT data captures the spatial extent of forests with insect-induced tree mortality, it does not account for the intensity of mortality, which means the annual amount of biomass killed within a cell by beetles (e.g., tonnes/acre/yr).
To integrate the intensity of tree mortality, we calibrated the eDaRT mortality data using observations of tree mortality from Fettig et al. (2019) in Stanislaus National Forest, which is located just south of the TCSI region. To simulate tree mortality in Stainslaus National Forest, we spun up a LANDIS-II Biomass Succession model using data from a previous project (Spencer et al., 2008) and climate data from GridMET (Abatzoglou, 2013). Trees differ in susceptibility to beetles based on tree species, tree age, and the severity of an insect outbreak. We adopted the susceptibility parameters (e.g., the likelihood or degree to which a specific tree species is vulnerable to being attacked, infested, or damaged by a specific beetle species) developed by Maxwell et al. (2022). Then the susceptibility was iteratively fine-tuned to replicate tree mortality patterns—biomass killed by tree species—found by Fettig et al. (2019). Additional details regarding the calculation of beetle-driven biomass loss, parameterization, and validation of the model can be found in Maxwell et al. (2022).
2.4 Selecting ESs and measuring beetle impact on biophysical quantity of ESs
In this study, we selected three ESs for assessment, including sawtimber provisioning, water retention, and carbon sequestration provided by forests. As the TCSI region is an important source of these ESs in Northern California (Tahoe Regional Planning Agency, 2024), these ESs are of policy interest. Selection of these ESs was also based on data availability. Although this region also has important cultural values, such as recreation mentioned earlier, we did not assess cultural ESs. This was because we aimed to link biomass loss with changes in ESs, but existing studies (de Groot et al., 2010; Mayer and Woltering, 2018; Chen, 2020) have indicated that the supply of cultural ESs (e.g., landscape beauty) is not necessarily correlated with the amount of biomass but also depends on humans’ varying perceptions of nature. For example, some individuals may find a dead tree beautiful, while others may not.
In this paper, sawtimber provisioning refers to the supply of timber that meets specific size and quality criteria to be sawn into lumber or planks for use in construction, furniture, and other solid wood products (Luppold and Pugh, 2016). Wood products from other parts of trees, such as roots, leaves, and leftovers after sawtimber production were not assessed. Water retention specifically denotes the water stored in aboveground tree biomass. Although ecosystems can also retain water through intercepting water runoff, controlling surface evaporation, and percolating water in soil and bedrocks (Sharp et al., 2015; Ouyang et al., 2016; Chen, 2021), these mechanisms of water retention are too complex to be directly linked to beetle outbreaks (see Supplementary Appendix 1) and were therefore not assessed in this study. Finally, plants absorb carbon dioxide (CO2) and produce oxygen during photosynthesis, but release CO2 and consume oxygen through respiration. The net CO2 removed from the atmosphere is known as carbon sequestration (Nowak et al., 2007).
Many studies (Bennett et al., 2009; Qiao et al., 2019; Stosch et al., 2019) have highlighted the trade-off between provisioning ESs, which often require consumptive use of ecosystems (e.g., cutting trees), and regulating ESs, which do not. This trade-off, in our study, implies that increasing the provision of sawtimber can reduce the forests’ carbon sequestration and water retention. To account for this trade-off in assessing how biomass loss affects the biophysical quantities of ESs, we first grouped the aboveground tree biomass into two categories: harvestable biomass, which could have potentially been harvested if not damaged by beetles; and preserved biomass, which could have kept growing if not damaged. We assessed sawtimber provisioning based on the harvestable biomass, while water retention and carbon sequestration were assessed based on the preserved biomass.
According to the data of the Harvest Value and Statistics (California Department of Tax and Fee Administration, 2023) and the Harvest by County Tool (University of Montana and Service, 2023), an average of roughly 1,019,360 cubic meters of sawtimbers were harvested annually from the TCSI region between 2012 and 2022. These harvested sawtimbers make up approximately 0.46% of the total wood volume of the region according to the U.S. Forest Service TreeMap Dataset (Riley et al., 2022). We also assumed that 0.46% of the biomass killed by beetles would have been harvested if it had not been killed. This assumption simplifies the reality that high-priority timber species are not necessarily the same as those most likely to die in a beetle outbreak, and that areas affected by beetle infestations may not overlap with those designated for timber harvest. However, since the contribution of sawtimber provisioning to the total ES calculations is very small, such assumption is unlikely to affect our results significantly. Based on this assumption, beetle damage on biomass would reduce the biophysical quantity of sawtimber provisioning by 0.46% as shown by Equation (1) in Table 1.
The next step was to measure beetle impacts on the biophysical quantities of water retention and carbon sequestration provided by the preserved biomass, which accounts for 99.54% of total biomass. Preserved biomass, if not damaged, could have kept growing to retain water and sequester carbon. Forests’ capacities of retaining water and sequestering carbon are significantly influenced by the net primary production or the growth rate of biomass (Costanza et al., 2017). While the growth rate varies due to tree species, climate, and age (McPherson et al., 2016), we adopted an average growth rate estimate due to the infeasibility of measuring the growth of each specific tree in our model. Such average growth rate in the TCSI region, according to Powers and Oliver (1990), is 2.6%. Moreover, as a practical approximation, it is widely accepted that water constitutes roughly 50% of the total mass of fresh trees in the United States (Greene et al., 2014; National Geographic, 2023). Thus, the change in water retention is given by Equation (2) in Table 1. More detailed description of water retention assessment method is presented in Supplementary Appendix 1.
To calculate the loss in biophysical quantity of carbon sequestration, we combined two different factors of carbon sequestration. First, if biomass was killed, carbon stored in biomass would be released at a gradual rate of approximately 1% annually on average (U.S. Forest Service, 2023a). Moreover, if biomass was not killed, the trees in this area would grow at an average rate of 2.6% annually. For every tonne of biomass acquired, approximately 0.25 tonne of carbon would be stored (IPCC, 2006; Woodall et al., 2015). Since carbon makes up an estimated 12/44 of CO2, releasing or storing a tonne of carbon in biomass corresponds to emitting or sequestering 3.67 tonnes of CO2. Thus, growing 1 tonne of biomass corresponds to sequestration of 0.9175 (which equals 3.67*0.25) tonne of CO2. The calculation of the biophysical loss in carbon sequestration is given by Equation (3) in Table 1. More detailed description of carbon sequestration assessment method is presented in Supplementary Appendix 1.
2.5 Methods for converting biophysical quantities of ESs into values
To assess the value of each ES, we multiplied the ES’s biophysical quantity by the ES’s unit value (value/tonne), and then discounted the value in a future year to the present year. Such approach is widely accepted (United Nations SEEA-EA, 2021; European Commission, Joint Research Centre et al., 2024; Natural Capital Project, 2023). Table 2 presents the valuation equations converting the losses of biophysical quantities of ESs into the losses of ES values. In this paper, we expressed all monetary values in USD 2022 unless otherwise specified. Supplementary Appendix 2 describes how the valuation equations were developed, why certain proxies of the ESs’ unit values (e.g., market price, social cost) were selected, how the unit values were calculated, how USD in other years was converted into USD 2022.
We primarily adopted a constant discount rate of 2%, which is accepted by both the United Nations SEEA-EA (2021) and the Office of Management and Budget of the White House (2023). While declining rates give more explicit consideration of future generations’ preferences, they come with practical and theoretical challenges (United Nations SEEA-EA, 2021). For example, the assumptions used to determine the rate of decline may involve uncertainties about future preferences, technology, or other aspects that are difficult to forecast (Gollier and Hammitt, 2014). To conduct robustness check, we also assessed results using both 3 and 5% as the discount rates. 3 and 5% are also widely used (TEEB, 2011; Costanza et al., 2021; United States Government, 2021; Natural Capital Project, 2023).
2.6 Cost estimation
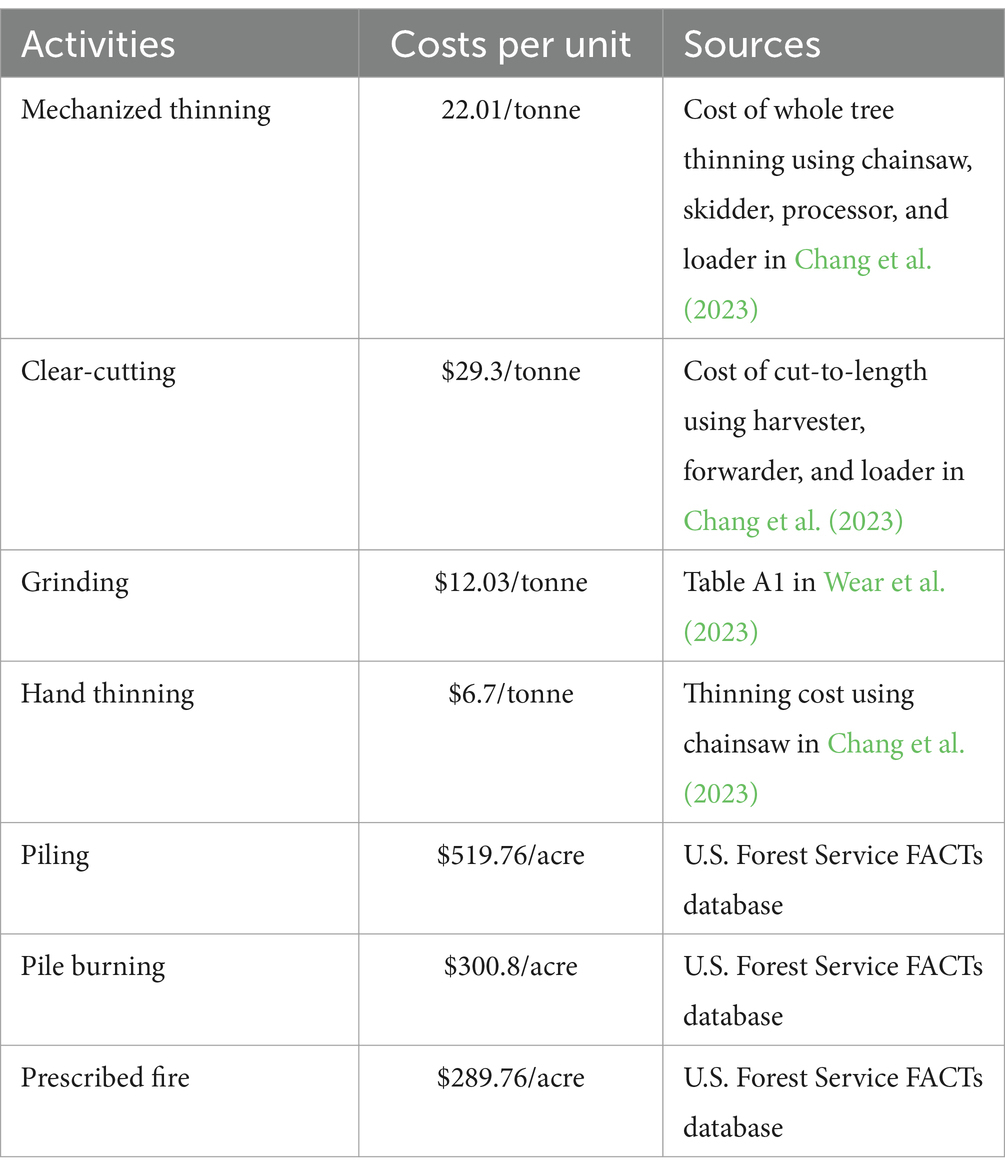
We involved multiple management activities in our simulations, including mechanized thinning, clear-cutting, hand thinning, and prescribed fire. Table 3 summarizes the per-acre or per-tonne unit costs of management activities. We also determined whether the biomass removed from thinning and cutting would be transported to and processed at a mill. If it is not, the biomass would incur additional costs associated with grinding, piling, and pile burning. The LANDIS-II simulation calculated the acres of treatment areas and the quantity of biomass removed by thinning and cutting. We multiplied the unit costs of each management activity by its respective treatment area or quantity to estimate the annual cost. Then we aggregated these activities’ annual costs to estimate the total management cost for each year. Supplementary Appendix 3 provides detailed calculation procedures for each management activity.
3 Results
3.1 The impact of beetles on biomass
The annual amount of biomass killed by beetles varies throughout the study period, because of beetles’ population change driven by climate fluctuations (see Figure 2). In both MIROC-BAU and MIROC-EM, the most substantial biomass losses would occur between 2030 and 2065. CNRM-BAU and CNRM-EM also have consistent periods with the most substantial biomass losses and are expected to experience two distinct peaks in biomass losses: one between 2037 and 2043 and another between 2052 and 2063. However, Historical-BAU will incur the most substantial biomass losses from 2050 to 2060 and from 2070 to 2074, while Historical-EM will incur the most substantial biomass losses from 2025 to 2030 and from 2050 to 2055. Overall, the scenarios with the highest annual biomass losses, in descending order, are MIROC-BAU, CNRM-BAU, MIROC-EM, CNRM-EM, Historical-BAU, and Historical-EM.
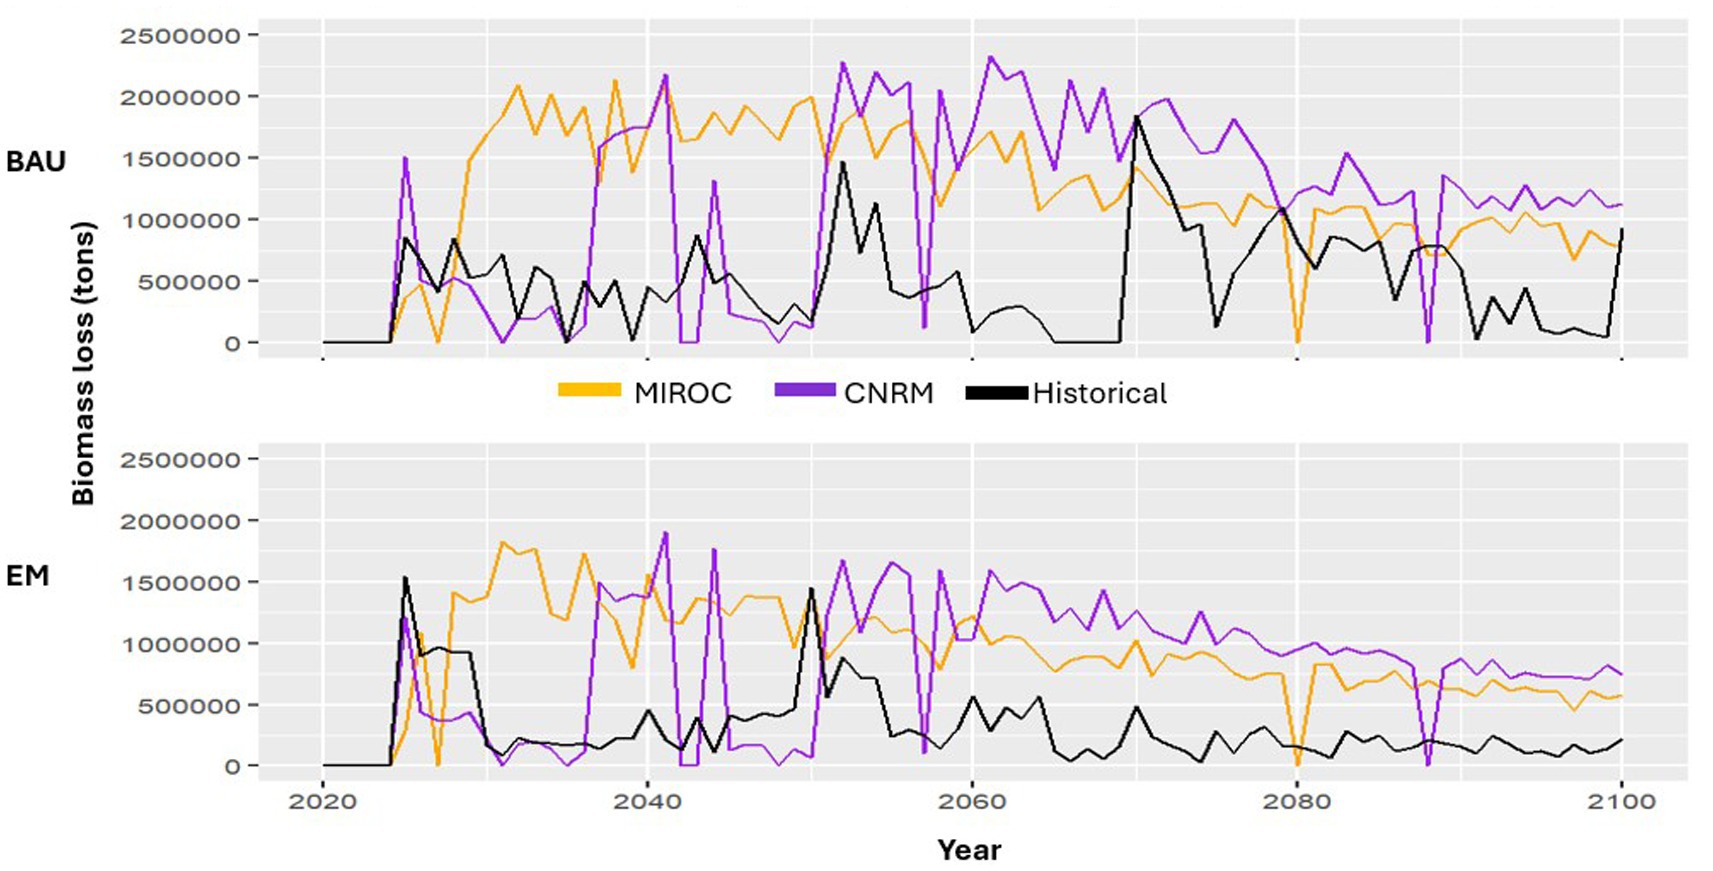
Figure 2. Aboveground live tree biomass killed by beetles in each year. The lower panel is regarding enhanced management (EM); the upper panel is regarding business-as-usual (BAU) management. Each panel depicts three climate projections.
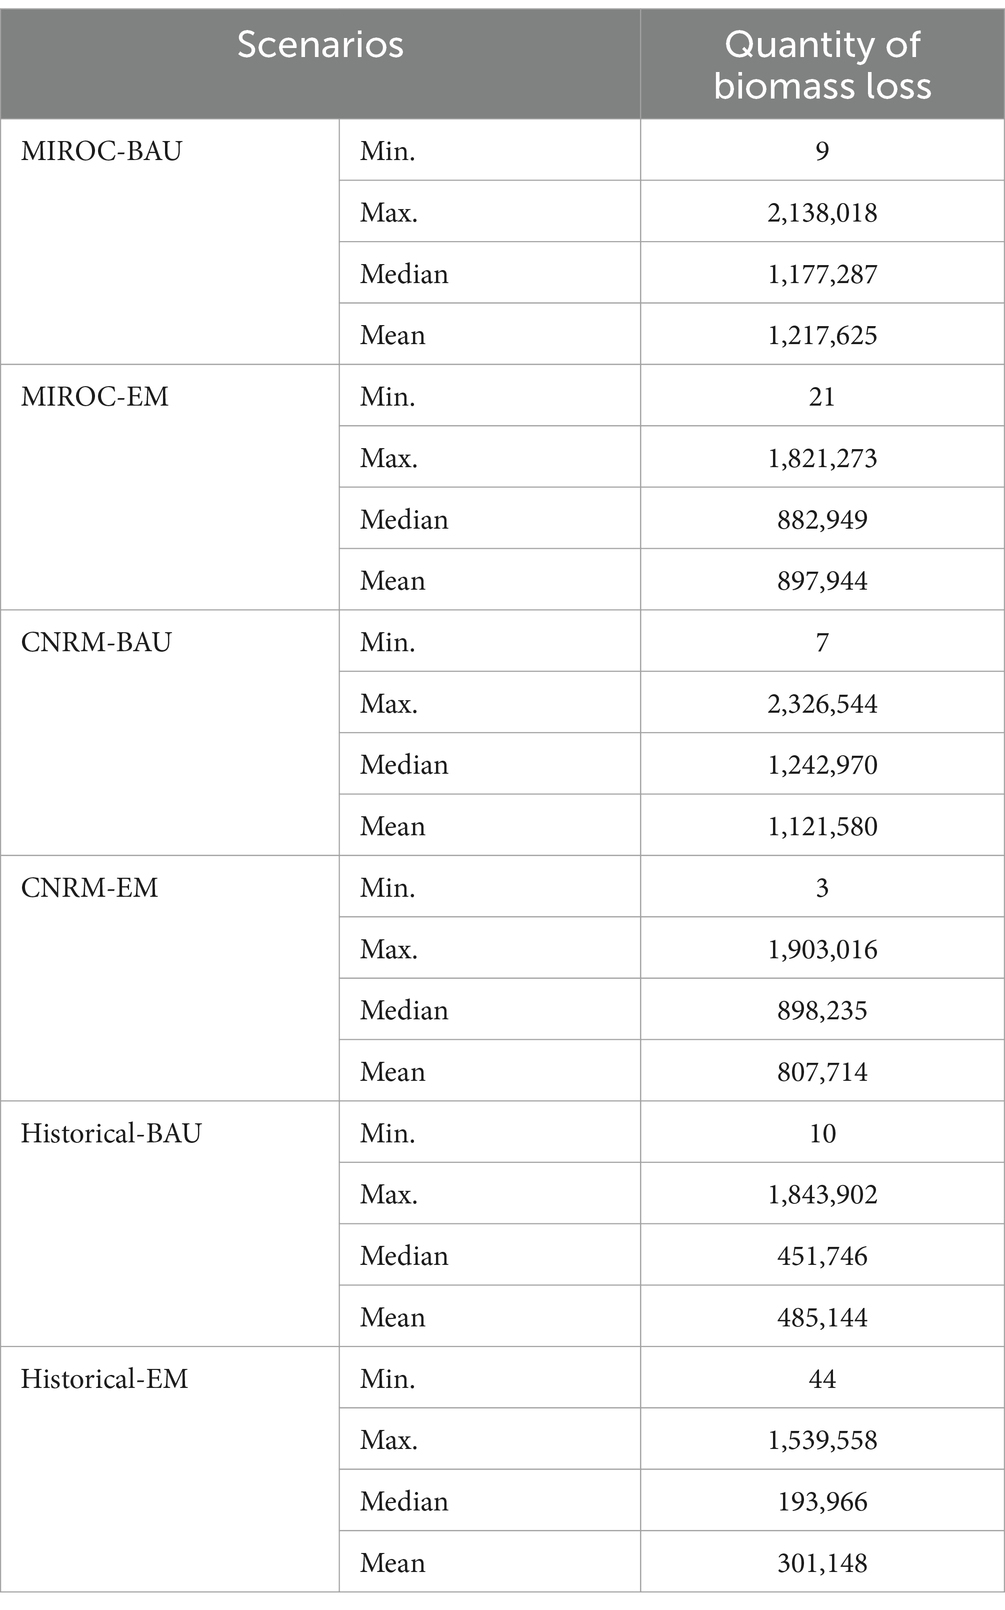
Table 4 summarizes the descriptive statistics of annual biomass loss in each scenario. Specifically, MIROC-BAU and CNRM-BAU experience annual biomass losses that surpass Historical-BAU by an average of 732,481 and 636,436 tonnes; MIROC-EM and CNRM-EM experience annual biomass losses that surpass Historical-EM by an average of 596,796 and 506,566 tonnes. Accordingly, both MIROC and CNRM with higher temperature than Historical Climate in the future will experience more severe biomass losses than Historical Climate, regardless of management types. MIROC, being even warmer and drier than CNRM, provides more favorable conditions for beetle reproduction, resulting in greater biomass damage than CNRM. Moreover, MIROC-BAU shows an average annual biomass loss 319,681 tonnes higher than MIROC-EM, CNRM-BAU shows an average annual biomass loss 313,866 tonnes higher than CNRM-EM, and Historical-BAU shows average annual biomass loss 183,996 tonnes higher than Historical-EM. This divergence highlights the effectiveness of implementing enhanced management over business-as-usual practices in controlling beetle population growth and mitigating biomass damage. Figure 3 also shows the differences in biomass loss between business-as-usual management and enhanced management. When examining all scenarios throughout the whole study period, the annual biomass loss may vary from 3 to 2,326,544 tonnes.
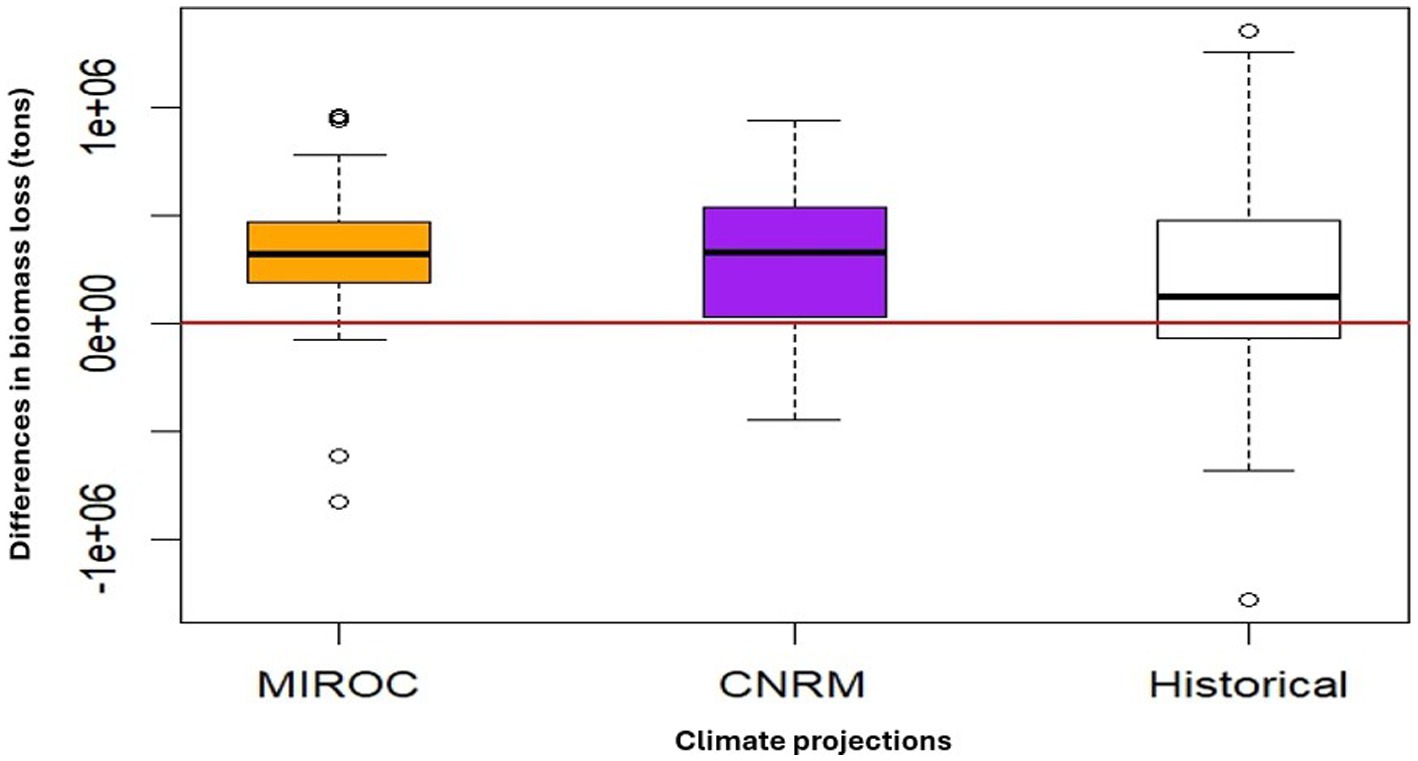
Figure 3. Differences in the aboveground live tree biomass loss between business-as-usual management and enhanced management under three climate projections. For each climate projection, the biomass loss under the business-as-usual management scenario is subtracted from the biomass loss under enhanced management scenario. Therefore, the boxplots show the potential biomass loss avoided through enhanced management.
3.2 Changes in biophysical quantity of ESs
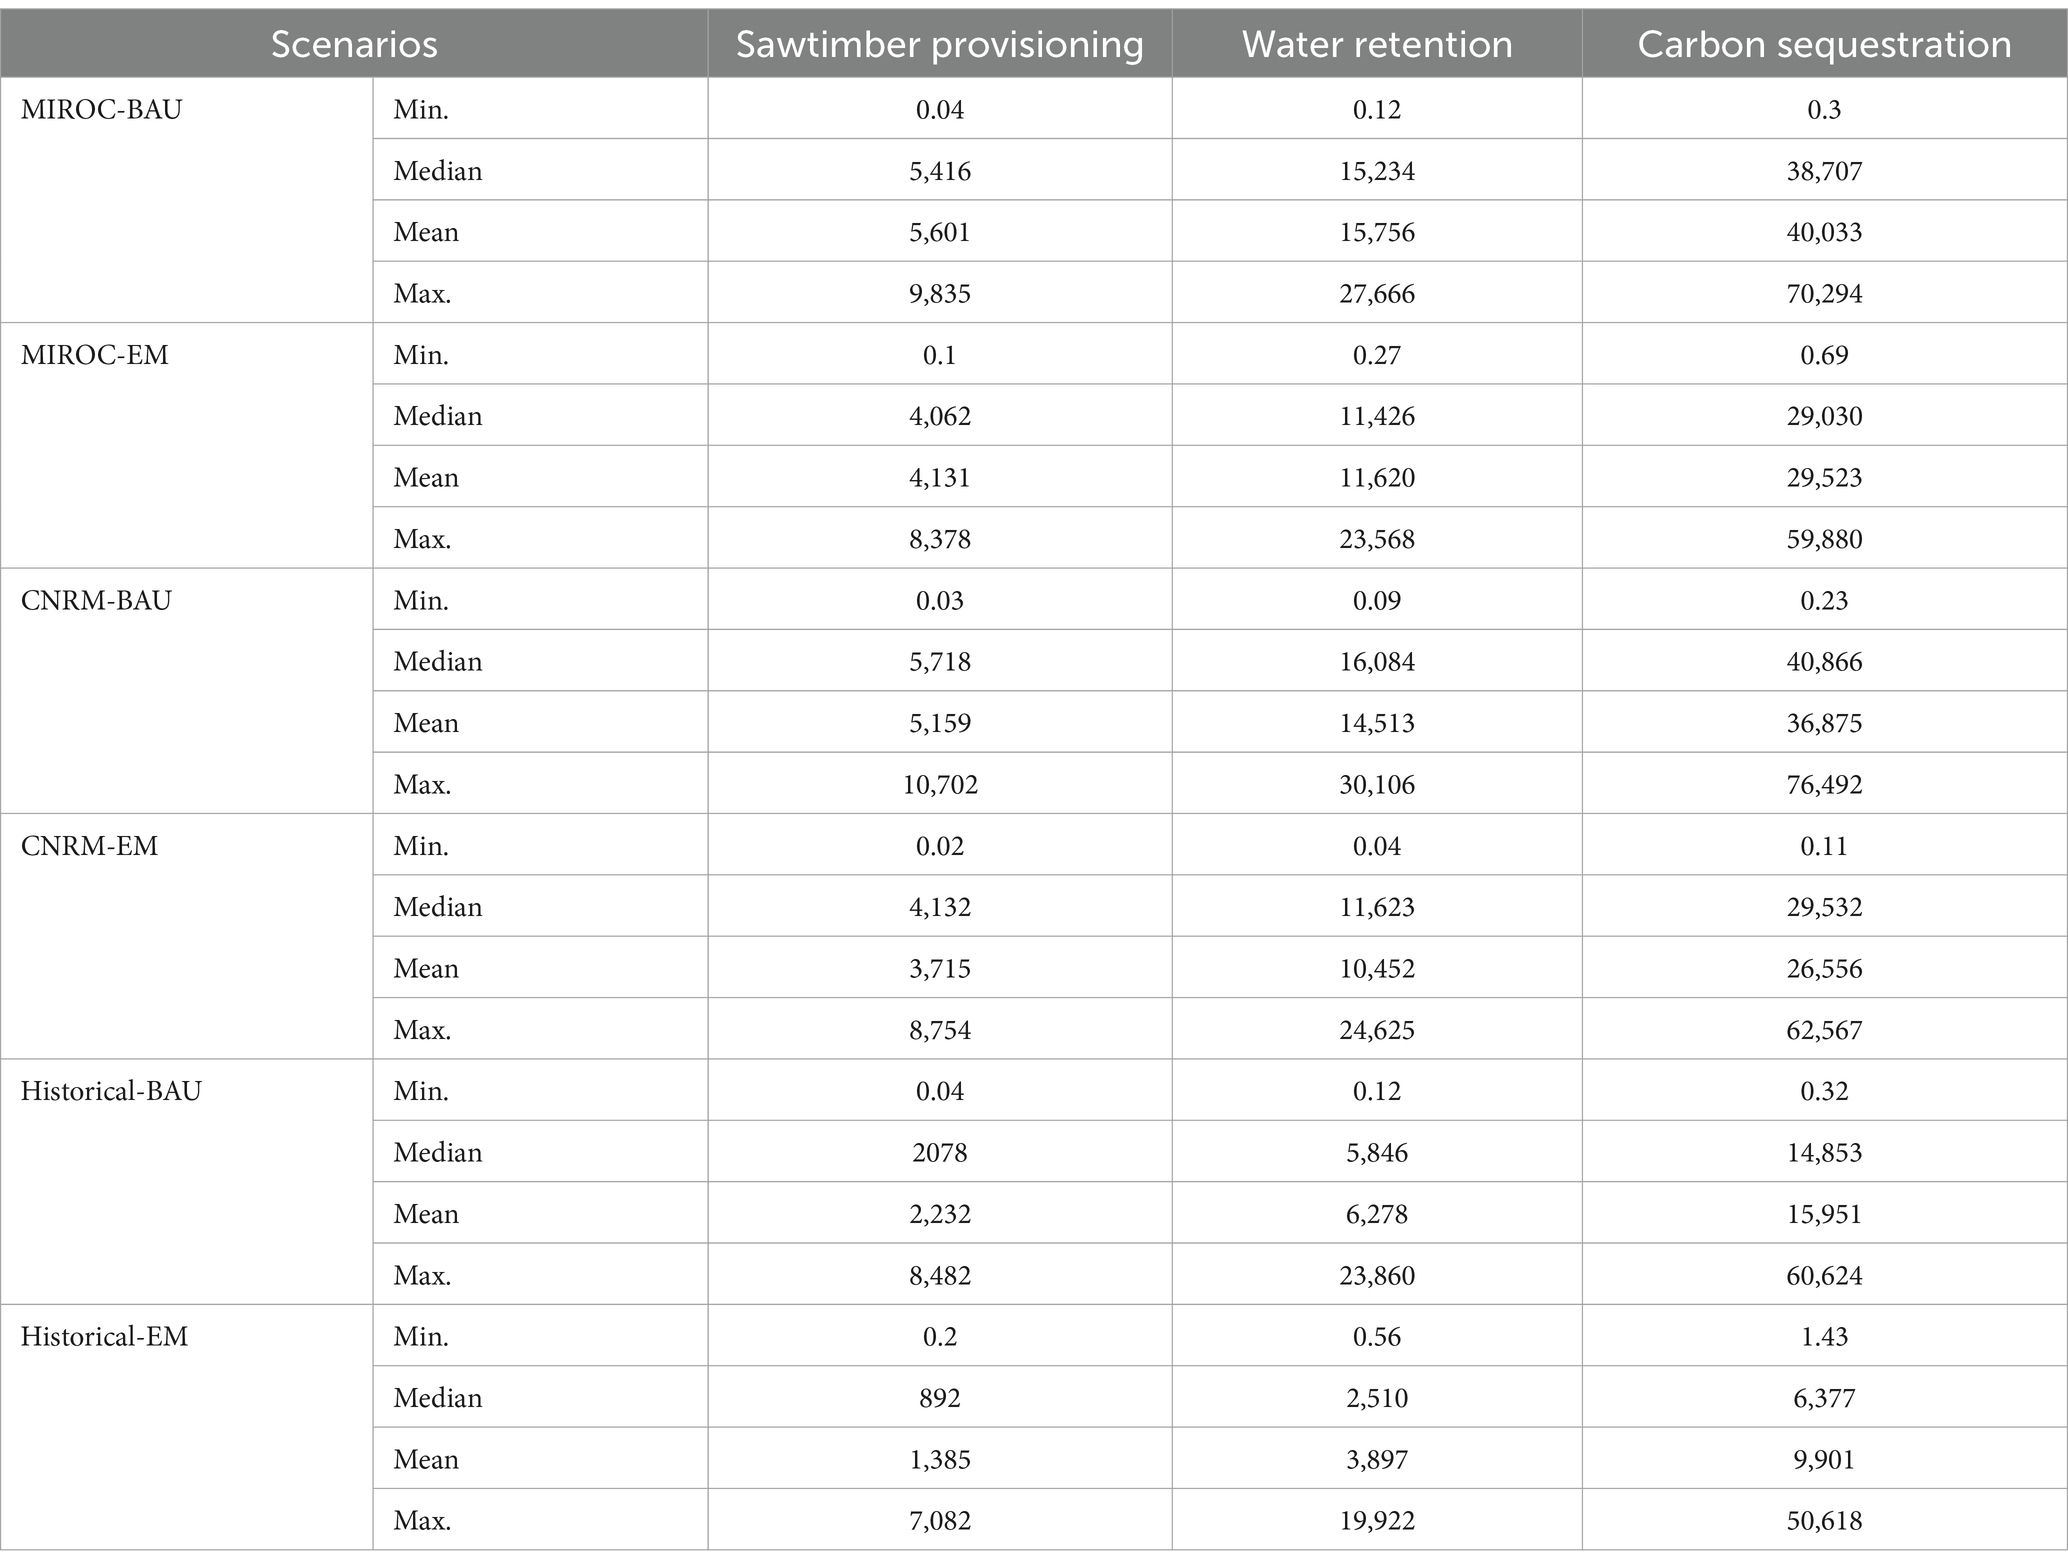
When considering all scenarios across the entire study period, the annual losses of sawtimber provisioning, water retention, and carbon sequestration can be up to 10,702 tonnes, 30,106 tonnes, and 76,492 tonnes, respectively (Table 5). On average, MIROC-BAU exhibits the highest annual loss across all ESs, closely followed by CNRM-BAU. MIROC-EM and CNRM-EM exhibit the third and the fourth largest annual losses of ESs, while Historical-BAU and especially Historical-EM have the least annual losses of ESs. This ranking aligns with the order of average annual biomass loss in the respective scenarios.
Regardless of the climate conditions, enhanced management proves consistently more effective than business-as-usual practices in mitigating beetles’ damage on ESs. Specifically, compared to MIROC-BAU, MIROC-EM can avoid losses of sawtimber provisioning, water retention, and carbon sequestration by 1,470 tonnes, 4,136 tonnes, and 10,510 tonnes, respectively, each year on average. Compared to CNRM-BAU, CNRM-EM can avoid losses of sawtimber provisioning, water retention, and carbon sequestration by 1,444 tonnes, 4,061 tonnes, and10,319 tonnes, respectively, each year on average. Compared to Historical-BAU, Historical-EM can avoid losses of sawtimber provisioning, water retention, and carbon sequestration by 847 tonnes, 2,381 tonnes, and 6,051 tonnes, respectively, each year on average. The differences in the quantity loss of each ES between business-as-usual management and enhanced management are also depicted in Figure 4.
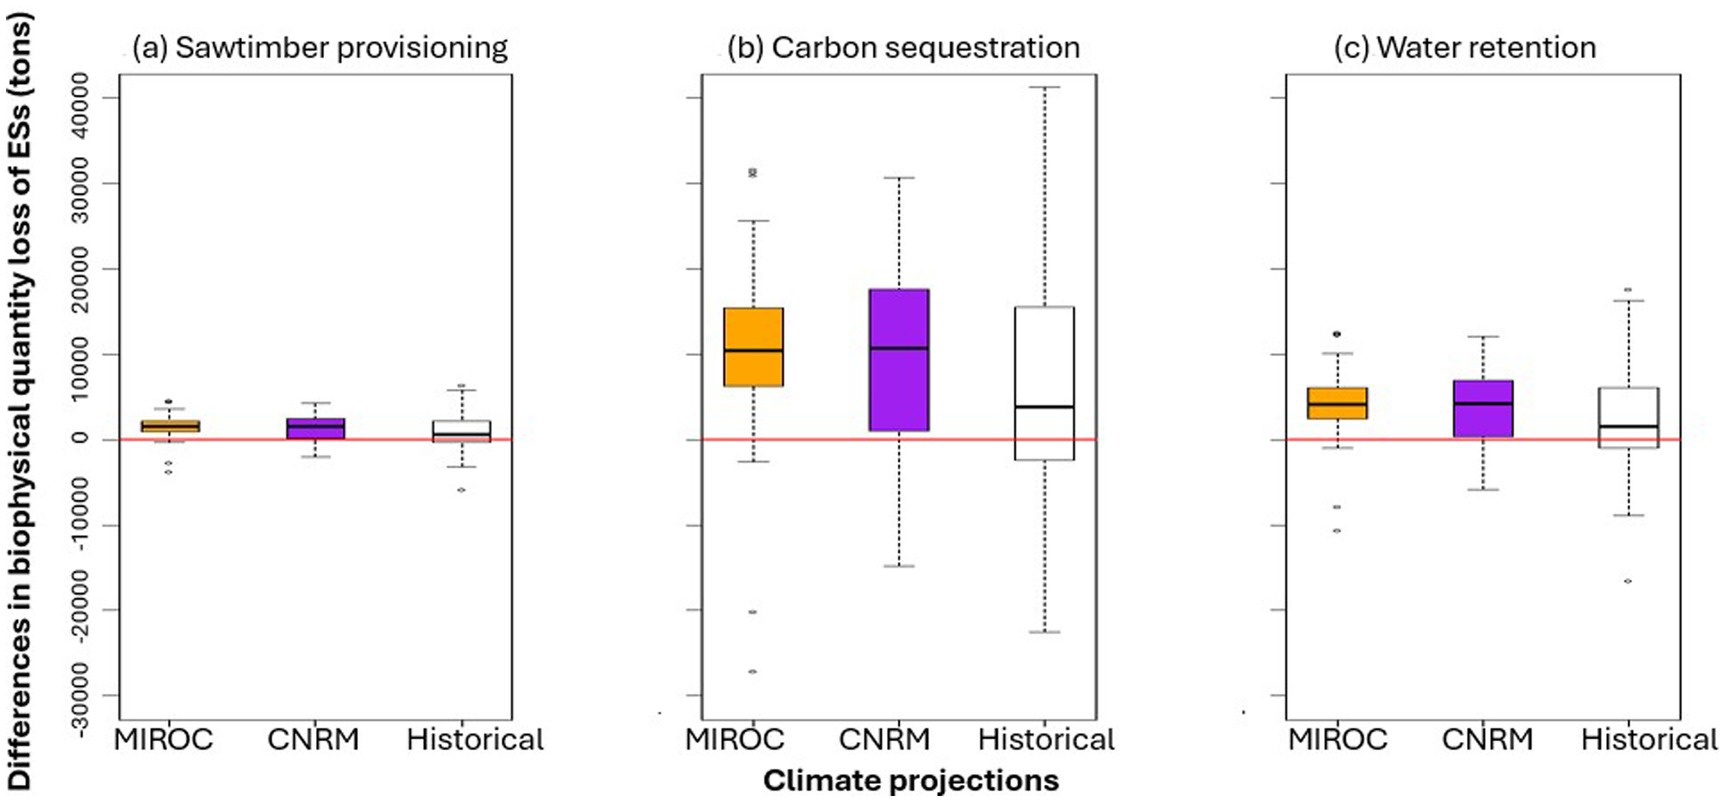
Figure 4. Differences in the biophysical quantity loss of each ecosystem service (ES) between business-as-usual management and enhanced management under three climate projections. For each climate projection, the loss of each service under the business-as-usual management scenario is subtracted from the loss under the enhanced management scenario. Therefore, the boxplots represent the potential biophysical quantity loss of ecosystem services avoided through enhanced management. Parts (a), (b), and (c) are related to sawtimber provisioning, carbon sequestration, and water retention, respectively.
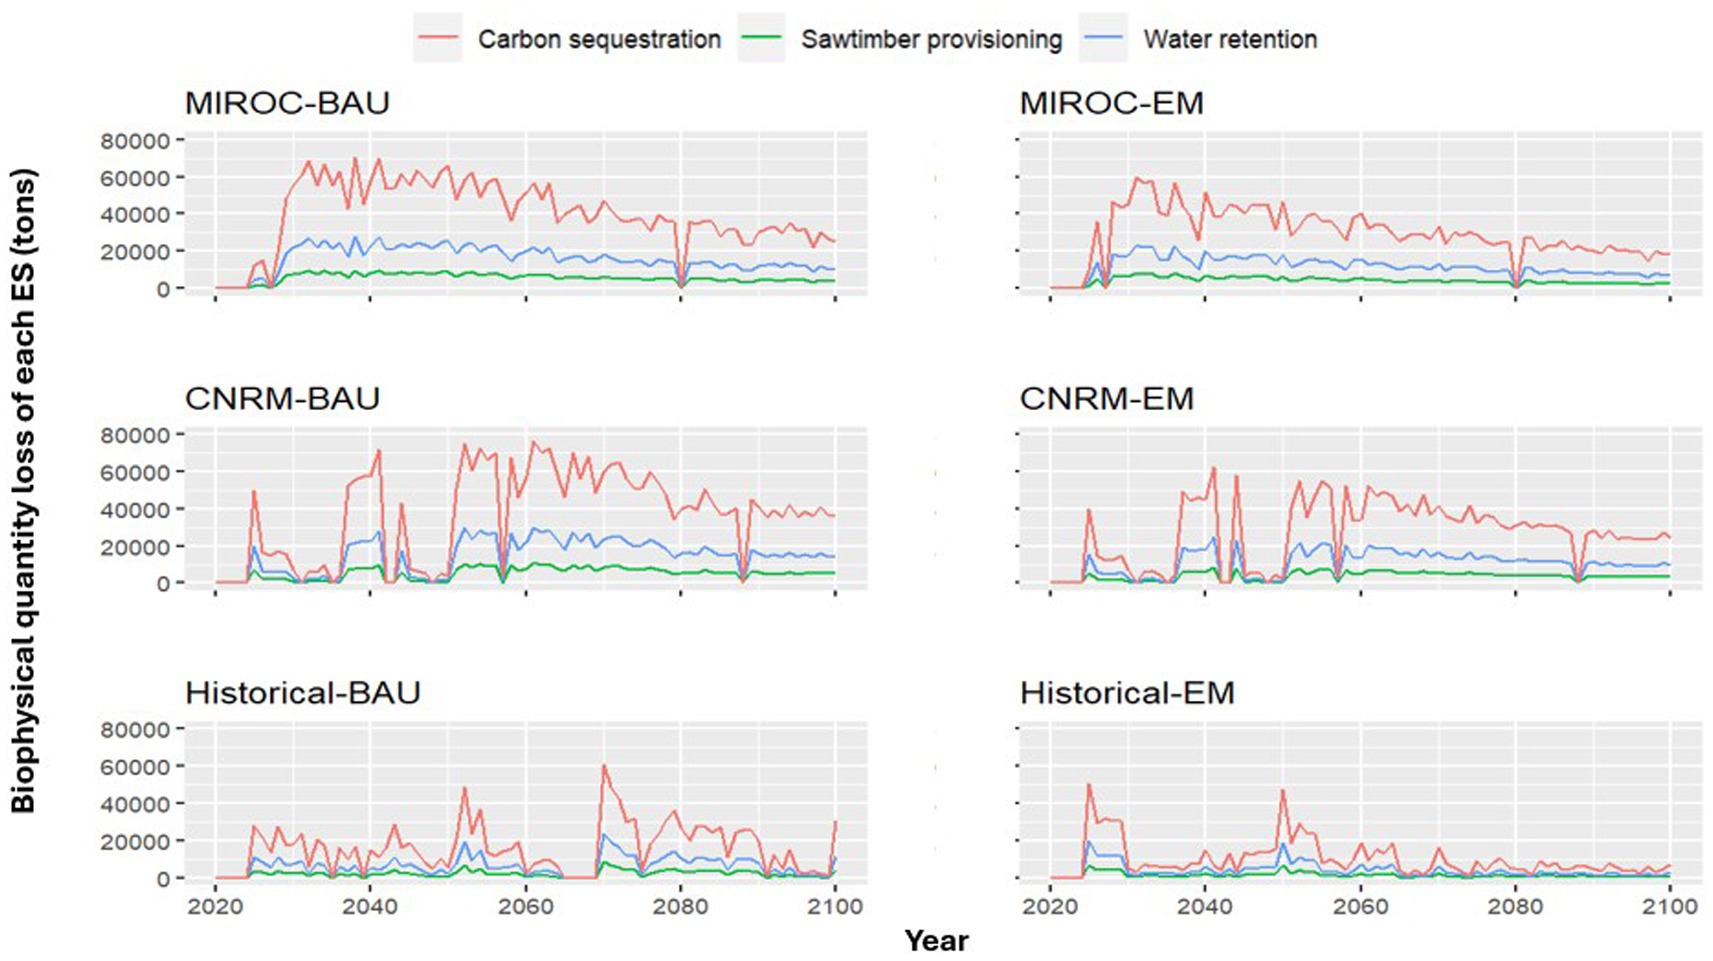
With the same type of management, CNRM and especially MIROC will lose more sawtimber provisioning, water retention, and carbon sequestration than Historical Climate. Figure 5 demonstrates the fluctuating ES quantity losses on an annual basis. Throughout all scenarios during the whole study period, carbon sequestration incurs the most significant quantity losses, followed by water retention. Sawtimber provisioning experiences the smallest impact because harvestable biomass constitutes only 0.46% of the total biomass.
3.3 Changes in ES values
Regardless of the type of ESs, the scenarios with the highest average annual losses of ES values, in descending order, are MIROC-BAU, CNRM-BAU, MIROC-EM, CNRM-EM, Historical-BAU, and Historical-EM. This ranking aligns with the rankings of both the biomass losses and the ESs’ biophysical quantity losses. Such ranking also suggest that future climate change in both CNRM and especially MIROC that is even drier and warmer can lead to greater losses of ES values than Historical Climate, while enhanced management can prevent more ES value losses than business-as-usual practices given the same type of climate. Figure 6 also shows that enhanced management can reduce the loss of the ESs’ aggregate value. These findings align with the estimates based on the 3 and 5% discount rates (see Supplementary Appendix 4).
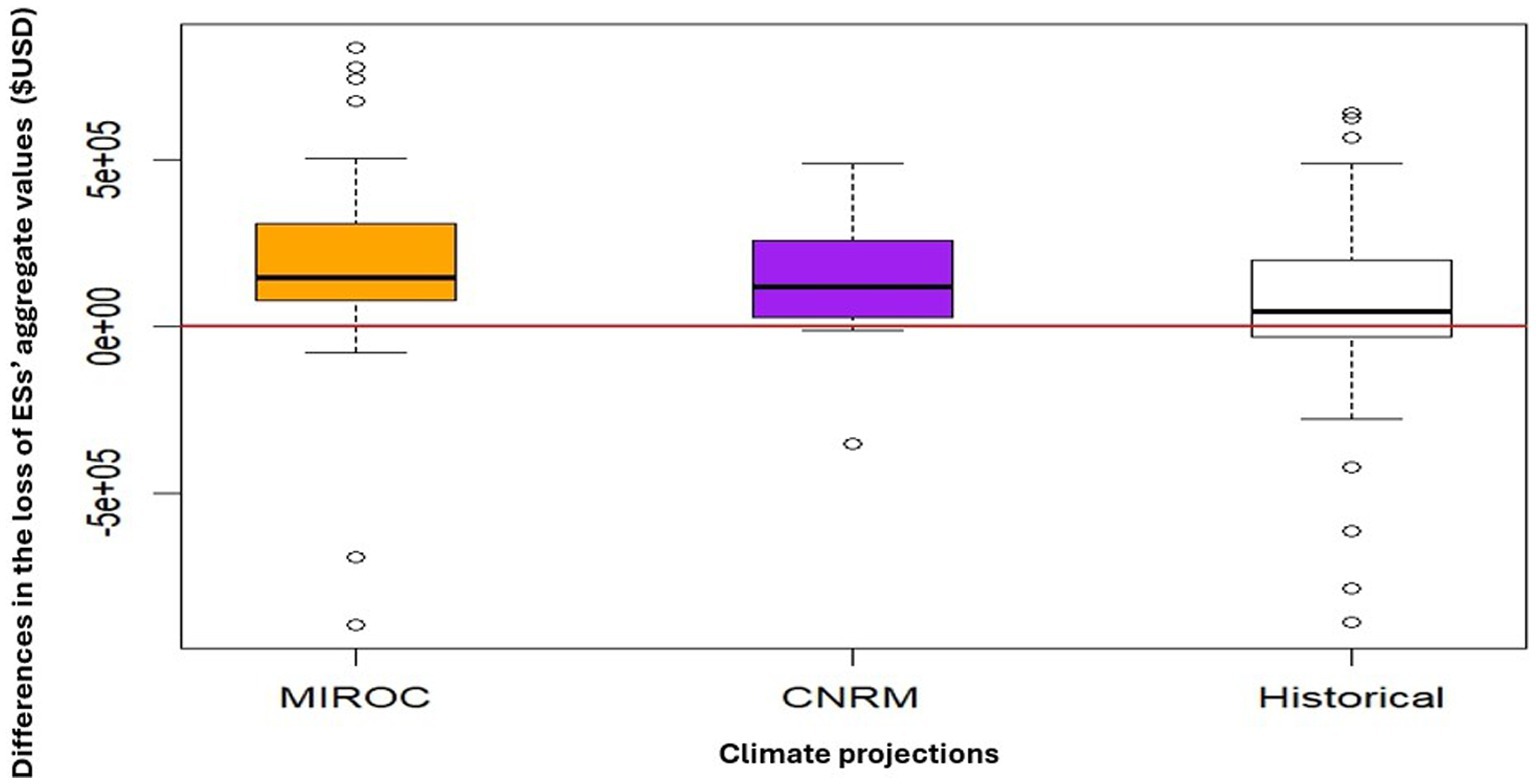
Figure 6. Differences in the loss of aggregate values of all ecosystem services (ESs) between business-as-usual management and enhanced management under three climate projections. For each climate projection, the value loss under business-as-usual management scenario is subtracted from the value loss under enhanced management scenario. Therefore, the boxplots represent the potential value loss avoided through enhanced management.
Table 6 summarizes the estimates of annual losses of ESs’ values. Considering all scenarios through the entire study period with a 2% discount rate, the annual value losses of sawtimber provisioning, water retention, and carbon sequestration can be up to $161,700, $29,500, and $1,887,581, respectively. The annual loss of the aggregated value of these three ESs is up to $2,078,781. Figure 7 shows that carbon sequestration experiences the highest value loss across all scenarios, because it experiences highest biophysical quantity loss and has the highest unit value. Although the average annual biophysical quantity loss of water retention is nearly 3 times that of sawtimber provisioning across all scenarios, the average annual value loss of water retention is lower due to the unit value of sawtimber provisioning being over 15 times that of water retention. In relation to the contribution of each ES to the annual aggregated ES values, carbon sequestration constitutes around at 90.8%, sawtimber provisioning constitutes at 7.8%, and water retention accounts at for 1.4%, on average.
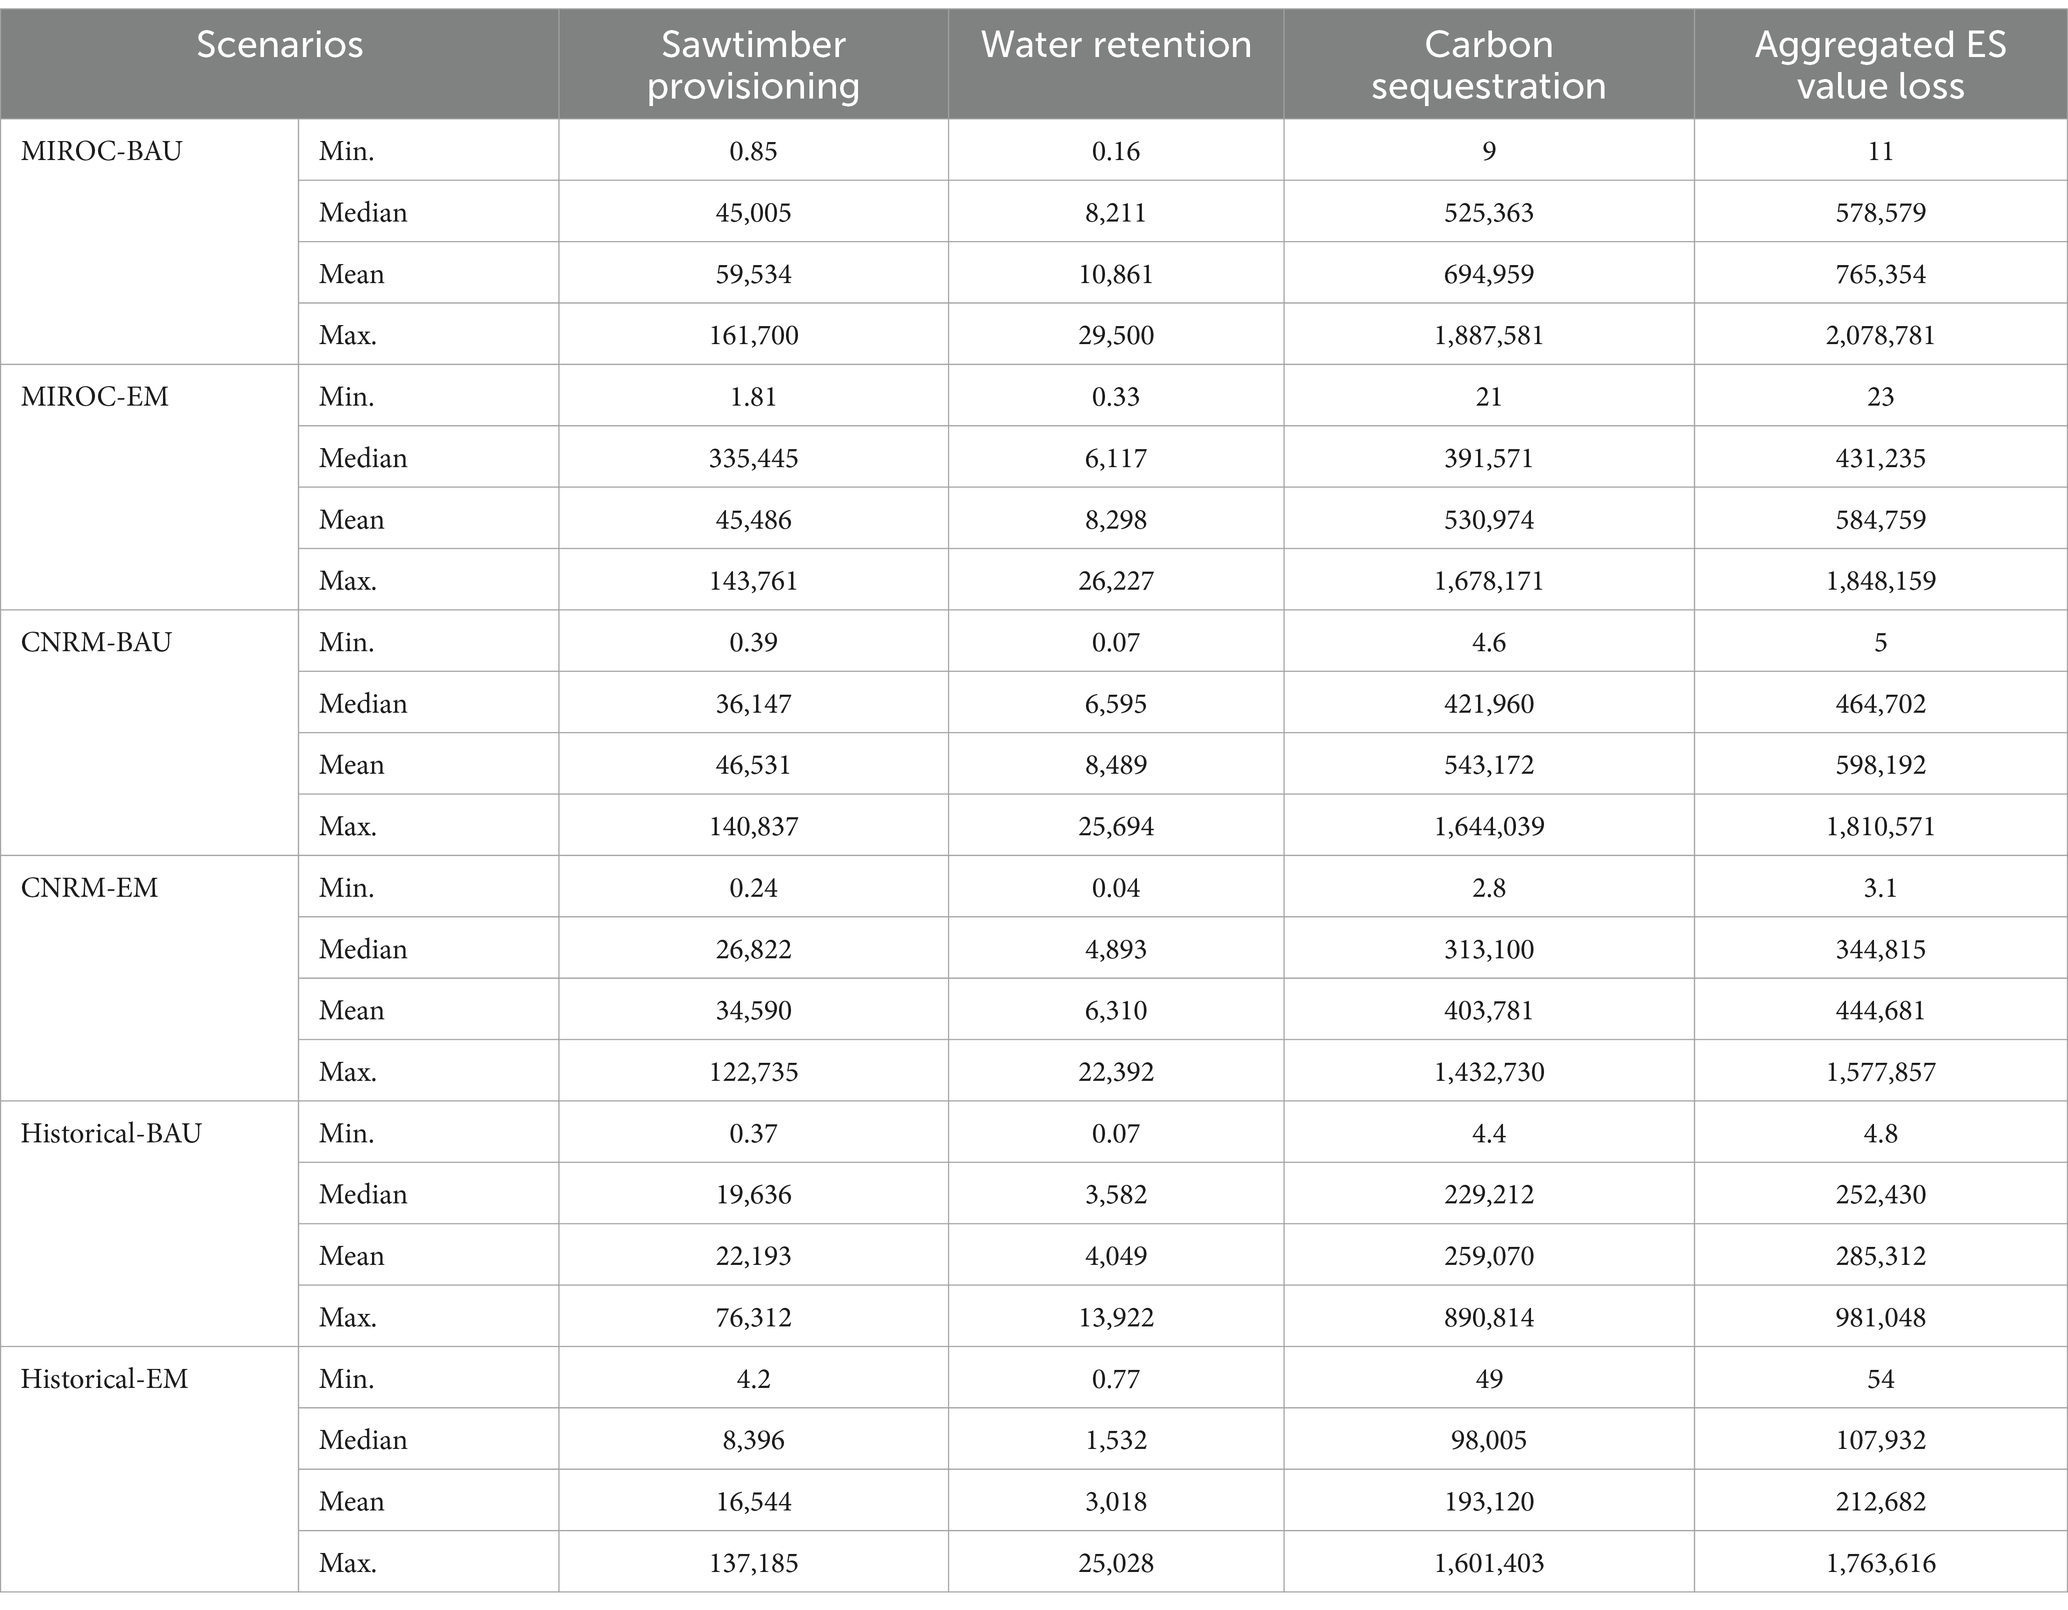
Table 6. Summary of the annual ES value loss ($USD) with a 2% discount rate across the study period.
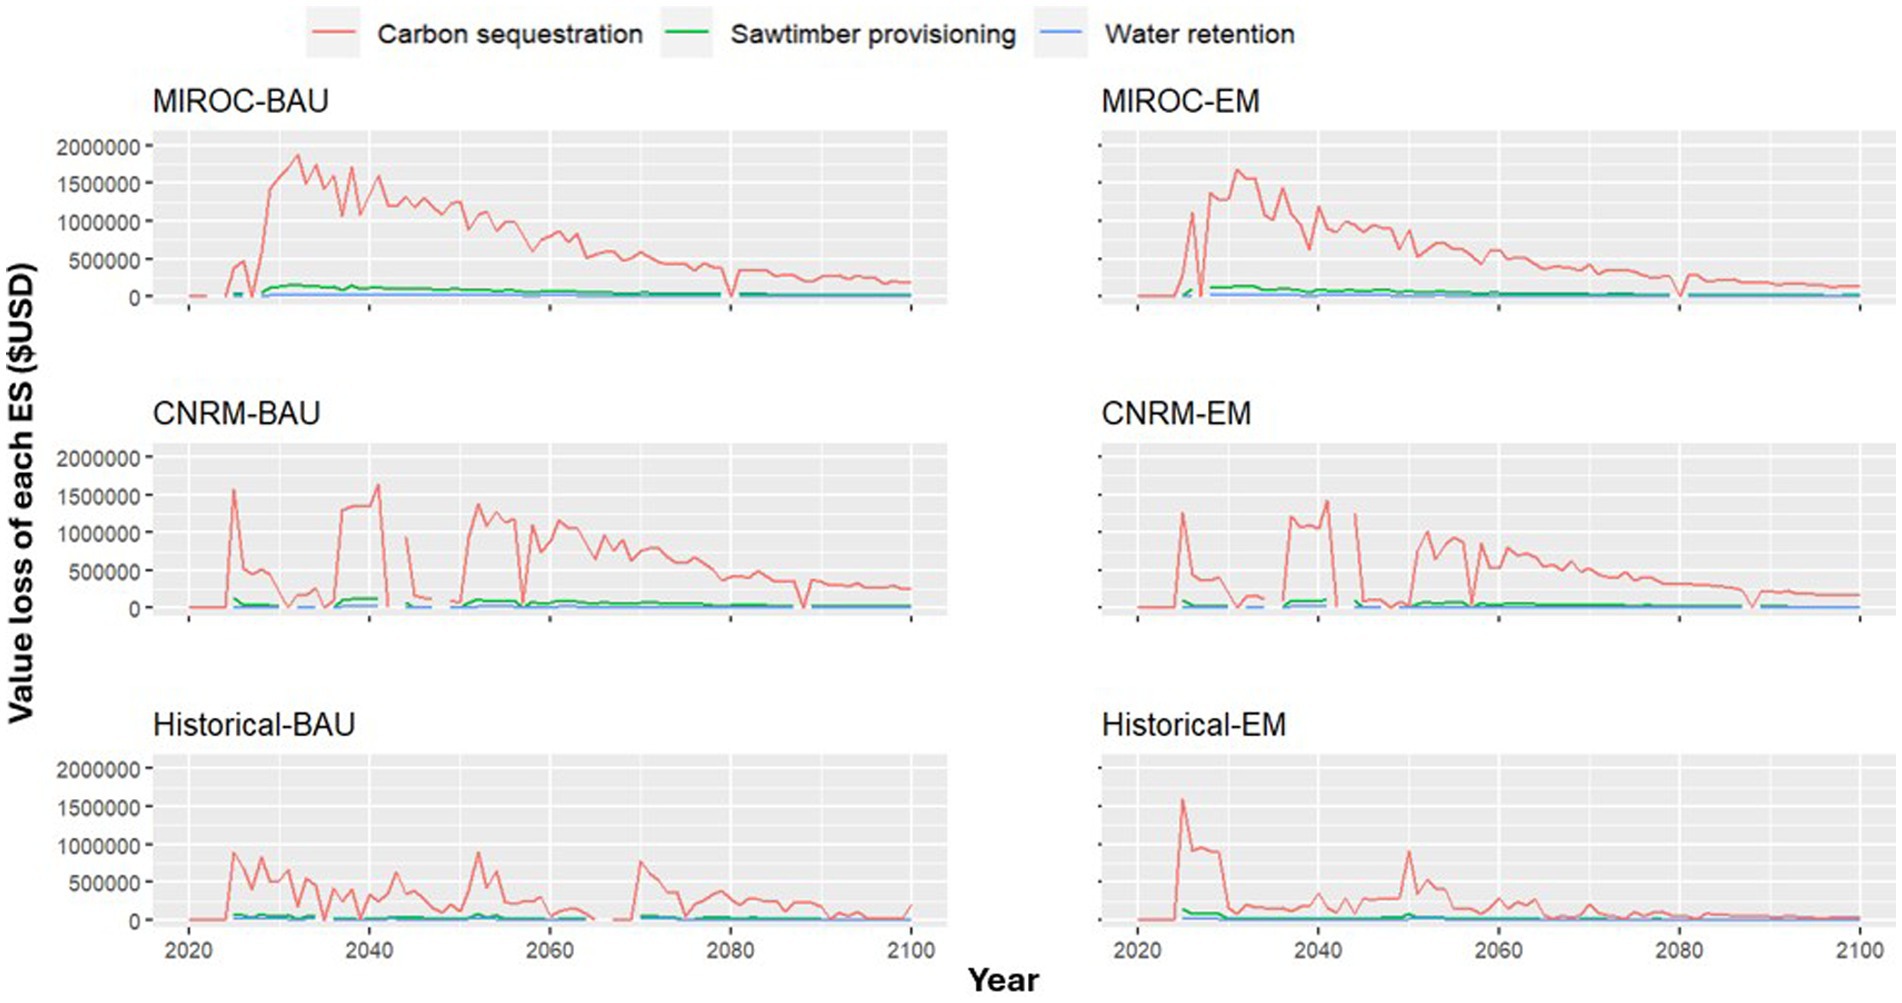
Figure 7. Annual value loss of each ecosystem service (ES) across different years with a 2% discount rate.
3.4 Management costs
As shown in Figure 8, the climate type has little effect on the costs of business-as-usual practices in the TCSI region. With a 2% discount rate, the annual management costs of MIROC-BAU, CNRM-BAU, and Historical-BAU can be up to roughly $37 million with the mean at $4.6 million and median at $2.3 million. The annual management costs of enhanced management are slightly different between the three climate projections: the annual management costs of MIROC-EM roughly range from $15 million to $139 million with the mean at $55 million and median at $45 million; the annual management costs of CNRM-EM roughly range from $15 million to $152 million with the mean at $52 million and median at $40 million; and the annual management costs of Historical-EM roughly range from $23.5 million to $168 million with the mean at $65 million and median at $54 million. On average, the differences between the annual management costs of business-as-usual practices and enhanced management are around $50 million under MIROC, $47 million under CNRM, and $60 million under Historical Climate. Such extra costs required for enhanced management can be offset by avoided damage on ES values by $180,595 under MIROC, by $153,511 under CNRM, and by $72,630 under Historical Climate (see Table 6). Management costs based on the 3 and 5% discount rates are detailed Supplementary Appendix 5.
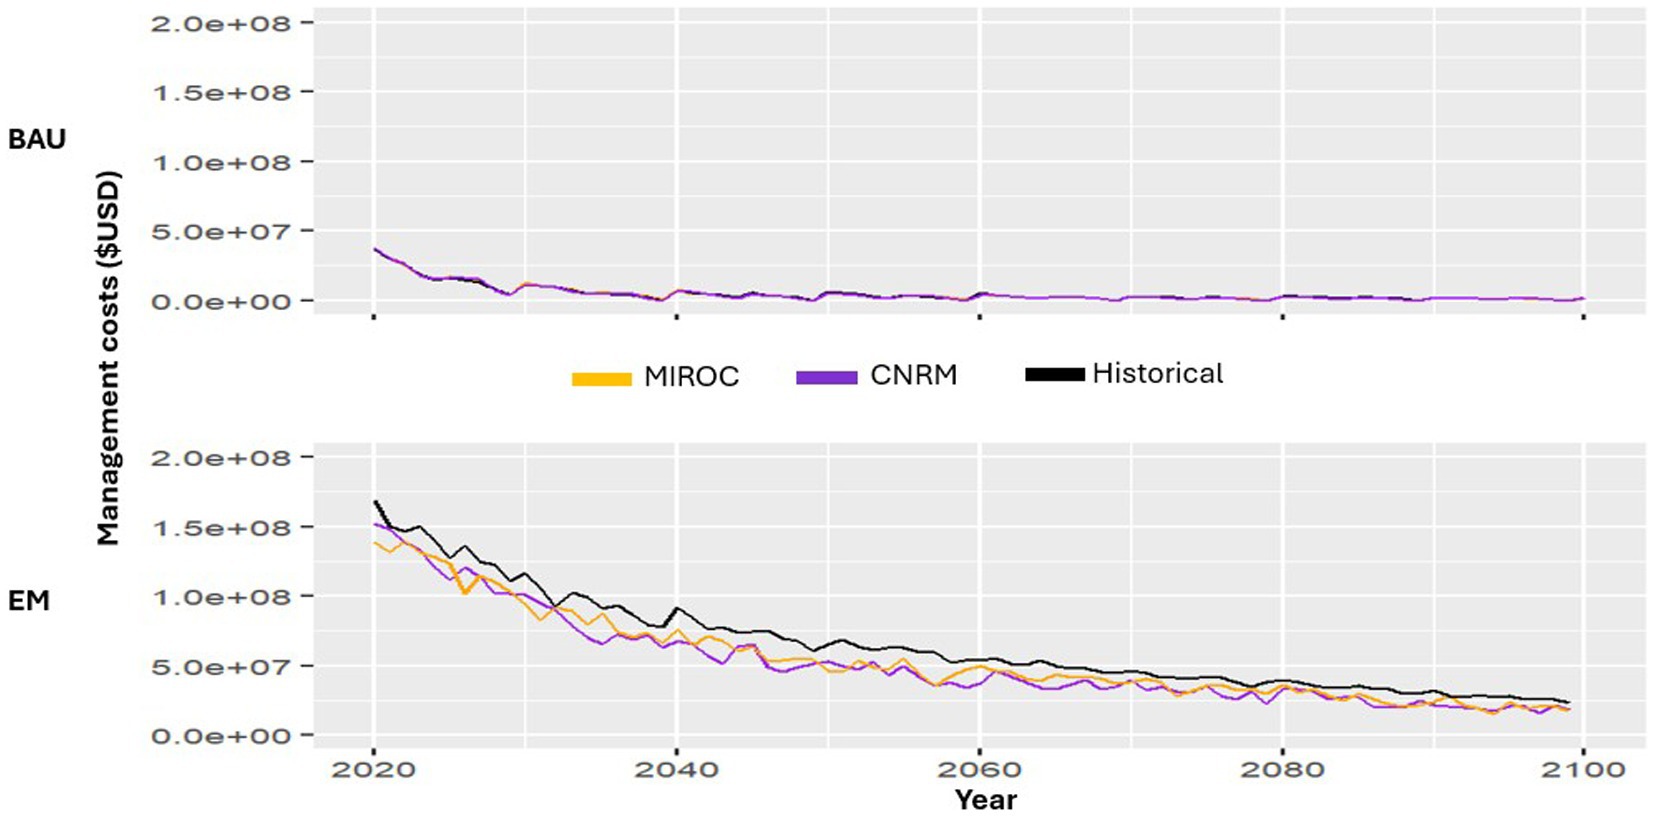
Figure 8. Annual management costs across different years. The lower panel is regarding enhanced management (EM); the upper panel is regarding business-as-usual (BAU) management with the lines nearly overlapping due to costs being almost identical. Each panel depicts three climate projections using three lines.
4 Discussion
4.1 Research significance and policy implications
Environmental impact assessments have traditionally focused on changes in individual environmental components (e.g., soil, water, and specific species), but a growing number of studies (Baker et al., 2013; Karjalainen et al., 2013; Chen, 2020) have recognized the importance of linking changes in environmental components with ESs. This shift is driven by the recognition that changes in environmental components alone, such as biomass killed by beetles, may not explicitly illustrate why environmental change matters to humans and socioeconomic development. We found that beetle outbreaks can reduce forests’ capacities to supply sawtimber, retain water, and sequester carbon through killing biomass. Such negative impact on ESs would be especially sever under warmer climate. Across the whole study period of the six scenarios, the losses of aggregated ES value would range from $212,682 to $765,354 per year. Our research findings associated with beetle impacts on biomass, ES quantities, and ES values also may raise more awareness of beetle outbreaks and inform and motivate the development of policies and strategies related to forest management and beetle control, such as those discussed below.
Past studies have shown that short-term strategies for reducing the risk of beetle infestation include irrigation that improves moisture of trees and avoidance of fertilizer utilization that may burn foliage (DeGomez, 2006). A long-term strategy can be thinning and removing dying and drought-stressed trees, which not only promotes growth of healthy trees but also reduces the most suitable trees for beetles to feed and reproduce (U.S. Forest Service, 2015). This strategy aligns with our results, as we found that the drier and warmer climate leave many tree species and their ESs more vulnerable to beetle than the cooler and wetter climate, demonstrating the need of enhanced management with more removals of dying and drought-stressed trees. Diversifying or mixing tree species, such as increasing the population of climate-resilient tree species, is also a potential long-term strategy. This strategy may make a forest less susceptible to infestation of a certain insect and more resilient to environmental changes, while still providing desirable ESs to society (Dobor et al., 2020). However, increasing the population of drought tolerant tree species, such as Escarpment live oak and Chinquapin oak in California (McPherson and Albers, 2014), potentially alters the tree communities. Whether and how this strategy would impact ecosystem health and ESs in our study regions was not assessed in our study and requires future investigation.
4.2 Is enhanced management cost-effective?
Although the avoided damage on ES value resulting from enhanced management only accounts for a small proportion of the extra costs required for enhanced management, this does not mean enhanced management is not cost-effective. First, the estimates of ES value losses are conservative as discussed in Section 4.1. Second, the enhanced management was not solely focused on mitigating beetle population growth. It was also designed to control wildfire and protect growth and reproduction of healthy species, which might have more significant impacts on conservation and enhancement of ESs. However, we did not assess such impacts. It is also notable that treatments designed to reduce wildland fire intensity do not always result in reduced impacts of bark beetles (Steel et al., 2021). This is because beetles tend to target larger trees and several fire-resistant species (Koontz et al., 2021), the same trees which are often left by fuel-removal treatments and survive prescribed fire.
A more comprehensive assessment of the cost-effectiveness of the enhanced management needs further research into how the enhanced management can enhance ESs through controlling wildfire and improving the overall health of the forests. Our findings provide a foundation for conducting such cost-effectiveness analyses in the future.
4.3 Research limitation
Our assessments were based on several assumptions (see Section 2) that simplified the analysis and made it more tractable. This includes the use of the LANDIS-II model, and the simplifications and abstractions required to run such a model. Because of inherent uncertainties in the model inputs, process representation, and parameterization, we regard the model results as a starting point of furthering our understanding of system dynamics. Our assessments of the quantities and values of ESs were conservative, because we only assessed a subset of ESs but ignored other potential ESs, such as soil fertility retention and provisioning of other raw forest products; we adopted the conservative estimates of ESs’ unit values; and among the ESs we assessed, the quantity of water retention was underestimated, because we only considered water stored in biomass. This underestimation could be particularly significant under projections of a drier and warmer climate in the long term. Additionally, we only assessed how bark beetles can impact ESs through killing trees. In fact, as an integral component of ecological webs, insects, including bark beetles, can also influence ESs through other ways, including being a pray or predator of other species, recycling organic matter, (Schowalter et al., 2018), and influencing pollination and seed dispersal (Noriega et al., 2018).
Moreover, as dead and dying trees may serve as habitats for certain species (e.g., birds that create nests in dead trees) and contribute to nutrient cycling, thinning and removing these trees may impact forest biodiversity and ESs (Lindenmayer and Noss, 2006; Thorn et al., 2018). Prescribed fire can also affect many species and ESs in various ways (e.g., by burning vegetation and generating hazardous chemical products) (Pereira et al., 2021). However, our assessment focused solely on how these management practices influence ESs through controlling beetle populations, overlooking other potential impacts on biodiversity and ESs.
5 Conclusion
A warmer climate leaves trees more vulnerable to beetles. Climate-driven beetle outbreaks have increased tree mortality, which in turn has reduced ES quantities and ES values and ultimately impacted human wellbeing and socioeconomic benefits. In particular, carbon sequestration would experience the most significant loss in both biophysical quantity and economic value compared to water retention and sawtimber provisioning. In six scenarios, the average annual biomass losses range from 301,148 tonnes to 1,217,625 tonnes. This corresponds to the losses of aggregated ES value at $212,682 to $765,354 per year, underscoring the importance of controlling beetle population growth rates.
Since tree species susceptible to drier and warmer climates are favorable to beetle reproduction, increased thinning and removing of dying and drought-stressed trees in enhanced management may be useful for controlling beetle outbreaks and mitigating climate change impacts on ESs. Note that controlling the growth rate of beetle population does not mean eradication of beetles, which are a natural part of the environment. Diversifying tree species, including increasing the presence of drought tolerant species (e.g., Escarpment live oak and Chinquapin oak), may also be a potential strategy to mitigate beetle impacts. However, its potential effects on other aspects of ecosystem health require further investigation. To understand the cost-effectiveness of enhanced management more comprehensively, further research is needed to assess how the enhanced management can affect ESs through controlling wildfire and influencing the overall health of the forests. Future research should also evaluate beetle-induced damages on ESs more comprehensively through assessing other ESs omitted in our study and examining how beetles may influence ESs through mechanisms beyond causing tree mortality.
Data availability statement
The original contributions presented in the study are included in the article/Supplementary material, further inquiries can be directed to the corresponding author/s.
Author contributions
HC: Conceptualization, Data curation, Formal analysis, Investigation, Methodology, Software, Validation, Visualization, Writing – original draft, Writing – review & editing. MS: Data curation, Formal analysis, Funding acquisition, Investigation, Methodology, Project administration, Resources, Supervision, Writing – original draft, Writing – review & editing. SF: Formal analysis, Methodology, Writing – original draft, Writing – review & editing. SE: Formal analysis, Writing – review & editing. CM: Methodology, Writing – review & editing.
Funding
The author(s) declare that financial support was received for the research, authorship, and/or publication of this article. This research was supported in part by an appointment to the U.S. Forest Service Research Participation Program administered by the Oak Ridge Institute for Science and Education through an interagency agreement between the U.S. Department of Energy and the U.S. Department of Agriculture.
Conflict of interest
The authors declare that the research was conducted in the absence of any commercial or financial relationships that could be construed as a potential conflict of interest.
Generative AI statement
The authors declare that no Generative AI was used in the creation of this manuscript.
Publisher’s note
All claims expressed in this article are solely those of the authors and do not necessarily represent those of their affiliated organizations, or those of the publisher, the editors and the reviewers. Any product that may be evaluated in this article, or claim that may be made by its manufacturer, is not guaranteed or endorsed by the publisher.
Supplementary material
The Supplementary material for this article can be found online at: https://www.frontiersin.org/articles/10.3389/ffgc.2024.1513721/full#supplementary-material
References
Abatzoglou, J. T. (2013). Development of gridded surface meteorological data for ecological applications and modelling. Int. J. Climatol. 33, 121–131. doi: 10.1002/joc.3413
Abatzoglou, J. T., and Brown, T. J. (2012). A comparison of statistical downscaling methods suited for wildfire applications. Int. J. Climatol. 32, 772–780. doi: 10.1002/joc.2312
Aguirre-Liguori, J. A., Ramírez-Barahona, S., and Gaut, B. S. (2021). The evolutionary genomics of species’ responses to climate change. Nature Ecol. Evol. 5, 1350–1360. doi: 10.1038/s41559-021-01526-9
Arnberger, A., Ebenberger, M., Schneider, I. E., Cottrell, S., Schlueter, A. C., von Ruschkowski, E., et al. (2018). Visitor preferences for visual changes in bark beetle-impacted forest recreation settings in the United States and Germany. Environ. Manag. 61, 209–223. doi: 10.1007/s00267-017-0975-4
Baker, J., Sheate, W., Phillips, P., and Eales, R. (2013). Ecosystem services in environmental assessment - help or hindrance? Environ. Impact Assess. Rev. 40, 3–13. doi: 10.1016/j.eiar.2012.11.004
Balloffet, N., Deal, R., Hines, S., Larry, B., and Smith, N. (2012). Ecosystem services and climate change. U.S: Department of Agriculture, Forest Service, Climate Change Resource Center.
Bennett, E. M., Peterson, G. D., and Gordon, L. J. (2009). Understanding relationships among multiple ecosystem services. Ecol. Lett. 12, 1394–1404. doi: 10.1111/j.1461-0248.2009.01387.x
Bentz, B. J., Régnière, J., Fettig, C. J., Hansen, E. M., Hayes, J. L., Hicke, J. A., et al. (2010). Climate change and bark beetles of the western United States and Canada: direct and indirect effects. Bioscience 60, 602–613. doi: 10.1525/bio.2010.60.8.6
California Department of Tax and Fee Administration (2023). Harvest Value & Statistics. Available at: https://www.cdtfa.ca.gov/taxes-and-fees/timber-yield-tax/harvest-value-and-statistics.htm (Accessed April 30, 2024).
California Department of Water Resources (2015). ‘Perspectives and Guidance for Climate Change Analysis’. Available at: https://cawaterlibrary.net/document/perspectives-and-guidance-for-climate-change-analysis/ (Accessed April 30, 2024).
Chang, H., Han, H.-S., Anderson, N., Kim, Y.-S., and Han, S.-K. (2023). The cost of Forest thinning operations in the Western United States: a systematic literature review and new thinning cost model. J. For. 121, 193–206. doi: 10.1093/jofore/fvac037
Chen, H. (2020). Complementing conventional environmental impact assessments of tourism with ecosystem service valuation: a case study of the wulingyuan scenic area, China. Ecosyst. Serv. 43:101100. doi: 10.1016/j.ecoser.2020.101100
Chen, H. (2021). The ecosystem service value of maintaining and expanding terrestrial protected areas in China. Sci. Total Environ. 781:146768. doi: 10.1016/j.scitotenv.2021.146768
Chen, H. (2024). Can “climate upheaval” be a more informative term than “climate change”? Environ. Sci. Pol. 154:103716. doi: 10.1016/j.envsci.2024.103716
Chen, H., Costanza, R., and Kubiszewski, I. (2022). Land use trade-offs in China's protected areas from the perspective of accounting values of ecosystem services. J. Environ. Manag. 315:115178. doi: 10.1016/j.jenvman.2022.115178
Chen, H., Zhang, T., Costanza, R., and Kubiszewski, I. (2023). Review of the approaches for assessing protected areas' effectiveness. Environ. Impact Assess. Rev. 98:106929. doi: 10.1016/j.eiar.2022.106929
Chung, M. G., Guo, H., Nyelele, C., Egoh, B. N., Goulden, M. L., Keske, C. M., et al. (2024). Valuation of forest-management and wildfire disturbance on water and carbon fluxes in mountain headwaters. Ecohydrology 17:e2642. doi: 10.1002/eco.2642
Coelho, M. T. P., Barreto, E., Rangel, T. F., Diniz-Filho, J. A. F., Wüest, R. O., Bach, W., et al. (2023). The geography of climate and the global patterns of species diversity. Nature 622, 537–544. doi: 10.1038/s41586-023-06577-5
Costanza, R., de Groot, R., Braat, L., Kubiszewski, I., Fioramonti, L., Sutton, P., et al. (2017). Twenty years of ecosystem services: how far have we come and how far do we still need to go? Ecosyst. Serv. 28, 1–16. doi: 10.1016/j.ecoser.2017.09.008
Costanza, R., Kubiszewski, I., Stoeckl, N., and Kompas, T. (2021). Pluralistic discounting recognizing different capital contributions: an example estimating the net present value of global ecosystem services. Ecol. Econ. 183:106961. doi: 10.1016/j.ecolecon.2021.106961
Cottrell, S., Mattor, K. M., Morris, J. L., Fettig, C. J., McGrady, P., Maguire, D., et al. (2020). Adaptive capacity in social–ecological systems: a framework for addressing bark beetle disturbances in natural resource management. Sustain. Sci. 15, 555–567. doi: 10.1007/s11625-019-00736-2
de Groot, R., Alkemade, R., Braat, L., Hein, L., and Willemen, L. (2010). Challenges in integrating the concept of ecosystem services and values in landscape planning, management and decision making. Ecol. Complex. 7, 260–272. doi: 10.1016/j.ecocom.2009.10.006
DeGomez, T. (2006). Using insecticides to prevent bark beetle attacks on conifers. Tucson, Arizona, USA: The University of Arizona. Available at: https://www.fs.usda.gov/Internet/FSE_DOCUMENTS/stelprdb5351282.pdf.
Dobor, L., Hlásny, T., Rammer, W., Zimová, S., Barka, I., and Seidl, R. (2020). Spatial configuration matters when removing windfelled trees to manage bark beetle disturbances in central European forest landscapes. J. Environ. Manag. 254:109792. doi: 10.1016/j.jenvman.2019.109792
Engle, N. L. (2011). Adaptive capacity and its assessment. Glob. Environ. Chang. 21, 647–656. doi: 10.1016/j.gloenvcha.2011.01.019
Erauskin-Extramiana, M., Arrizabalaga, H., Cabre, A., Coelho, R., Rosa, D., Ibaibarriaga, L., et al. (2020). Are shifts in species distribution triggered by climate change? A swordfish case study’. Deep Sea Res. Part II 175:104666. doi: 10.1016/j.dsr2.2019.104666
European Commission, Joint Research CentreRokicki, B, M’barek, R, Grammatikopoulou, I, La Notte, A, Van Alphen, M, et al., (2024), Gross ecosystem product in macroeconomic modelling, Publications Office of the European Union, Luxembourg.
FAO. (2024). What is sustainable bioenergy? Food and Agriculture Organization of the United Nations. Available at: https://www.fao.org/energy/bioenergy/en/ (Accessed December 3, 2024).
Fettig, CJ, Hood, SM, Runyon, JB, and Stalling, CM (2021). Bark beetle and fire interactions in western coniferous forests: Research findings, U.S. Forest Service, https://www.fs.usda.gov/psw/publications/fettig/psw_2021_fettig006.pdf (Accessed April 30, 2024).
Fettig, C. J., Mortenson, L. A., Bulaon, B. M., and Foulk, P. B. (2019). Tree mortality following drought in the central and southern Sierra Nevada, California, U.S. For. Ecol. Manag. 432, 164–178. doi: 10.1016/j.foreco.2018.09.006
Flint, C. G., McFarlane, B., and Müller, M. (2009). Human dimensions of forest disturbance by insects: an international synthesis. Environ. Manag. 43, 1174–1186. doi: 10.1007/s00267-008-9193-4
Gibson, K., Kegley, S., and Bentz, B. (2009). “Mountain pine beetle” in Forest Insect & Disease Leaflet 2 (revised) (Portland: USDA Forest Service).
Gollier, C., and Hammitt, J. K. (2014). The long-run discount rate controversy. Annu. Rev. Resour. Econ. 6, 273–295. doi: 10.1146/annurev-resource-100913-012516
Greene, W. D., Cutshall, J. B., Dukes, C. C., and Baker, S. A. (2014). Improving woody biomass feedstock logistics by reducing ash and moisture content. Bioenergy Res. 7, 816–823. doi: 10.1007/s12155-013-9404-6
Harvey, J. A., Heinen, R., Gols, R., and Thakur, M. P. (2020). Climate change-mediated temperature extremes and insects: from outbreaks to breakdowns. Glob. Chang. Biol. 26, 6685–6701. doi: 10.1111/gcb.15377
Harvey, J. A., Tougeron, K., Gols, R., Heinen, R., Abarca, M., Abram, P. K., et al. (2023). Scientists' warning on climate change and insects. Ecol. Monogr. 93:e1553. doi: 10.1002/ecm.1553
Hof, A. R., Dymond, C. C., and Mladenoff, D. J. (2017). Climate change mitigation through adaptation: the effectiveness of forest diversification by novel tree planting regimes. Ecosphere 8:e01981. doi: 10.1002/ecs2.1981
Holland, T., Evans, S., Long, J., Maxwell, C., Scheller, R., and Potts, M. (2022). The management costs of alternative forest management strategies in the Lake Tahoe Basin. Ecol. Soc. 27:43. doi: 10.5751/ES-13481-270443
Homicz, CS, Fettig, CJ, Munson, AS, and Cluck, DR. (2022). Western Pine Beetle, USDA Forest Servie. Available at: https://www.fs.usda.gov/foresthealth/docs/fidls/FIDL-01-WesternPineBeetle.pdf (Accessed on April 30, 2024).
IPBES (2019). Global assessment report on biodiversity and ecosystem services of the intergovernmental science-policy platform on biodiversity and ecosystem services. Bonn, Germany: Intergovermental Science-Policy Platform on Biodiversity and Ecosystem Services Secretariat.
IPCC. (2006). IPCC guidelines for national greenhouse gas inventories, International Panel on Climate Change. Institute for Global Environmental Strategies (IGES) for the IPCC. Available at: https://www.ipcc-nggip.iges.or.jp/public/2006gl/index (Accessed on April 30, 2024).
IPCC (2021). ‘Summary for policymakers’, in V Masson-Delmotte, P Zhai, A Pirani, SL Connors, C Péan, and S Berger, et al. Climate change 2021: The physical science basis. Contribution of Working Group I to the Sixth Assessment Report of the Intergovernmental Panel on Climate Change. Available at: https://www.ipcc.ch/report/ar6/wg1/downloads/report/IPCC_AR6_WGI_SPM_final.pdf (Accessed April 30, 2024).
IPCC (2023). AR6 Synthesis Report: Climate Change 2023. 38–115. Available at: https://www.ipcc.ch/report/sixth-assessment-report-cycle/.
Karjalainen, T. P. M. M., Sarkki, S., and Rytkönen, A. M. (2013). Integrating ecosystem services into environmental impact assessment: an analytic–deliberative approach. Environ. Impact Assess. Rev. 40, 54–64. doi: 10.1016/j.eiar.2012.12.001
Koltunov, A., Ramirez, C. M., Ustin, S. L., Slaton, M., and Haunreiter, E. (2020). eDaRT: the ecosystem disturbance and recovery tracker system for monitoring landscape disturbances and their cumulative effects. Remote Sens. Environ. 238:111482. doi: 10.1016/j.rse.2019.111482
Koontz, M. J., Latimer, A. M., Mortenson, L. A., Fettig, C. J., and North, M. P. (2021). Cross-scale interaction of host tree size and climatic water deficit governs bark beetle-induced tree mortality. Nat. Commun. 12:129. doi: 10.1038/s41467-020-20455-y
Kortmann, M., Müller, J. C., Baier, R., Bässler, C., Buse, J., Cholewińska, O., et al. (2021). Ecology versus society: impacts of bark beetle infestations on biodiversity and restorativeness in protected areas of Central Europe. Biol. Conserv. 254:108931. doi: 10.1016/j.biocon.2020.108931
LANDIS-II-Foundation (2019). Project-Tahoe-Central-Sierra-2019. Available at: https://github.com/LANDIS-II-Foundation/Project-Tahoe-Central-Sierra-2019 (Accessed on April 30, 2024).
Lindenmayer, D., and Noss, R. (2006). Salvage logging, ecosystem processes, and biodiversity conservation. Conserv. Biol. 20, 949–958. doi: 10.1111/j.1523-1739.2006.00497.x
Luppold, W., and Pugh, S. (2016). Diversity of the eastern hardwood resource and how this diversity influences timber utilization. For. Prod. J. 66, 58–65. doi: 10.13073/FPJ-D-14-00054
Manley, P. N., Povak, N. A., Wilson, K. N., Fairweather, M. L., Griffey, V., and Long, L. L. (2023). Blueprint for resilience: The Tahoe-central sierra initiative. Forest Service, Pacific Southwest Research Station: US Department of Agriculture.
Maxwell, C. J., Scheller, R. M., Wilson, K. N., and Manley, P. N. (2022). Assessing the effectiveness of landscape-scale forest adaptation actions to improve resilience under projected climate change. Front. Forests Global Change 5, 1–17. doi: 10.3389/ffgc.2022.740869
Mayer, M., and Woltering, M. (2018). Assessing and valuing the recreational ecosystem services of Germany’s national parks using travel cost models. Ecosyst. Serv. 31, 371–386. doi: 10.1016/j.ecoser.2017.12.009
McPherson, E., and Albers, S. (2014). Evaluation of seven drought tolerant tree species for Central California. Western Arborist 40, 10–15.
McPherson, EG, van Doorn, NS, and Peper, PJ (2016). Urban tree database and Allometric equation, U.S. Department of Agriculture, Forest Service, Pacific Southwest Research Station. Available at: https://www.fs.usda.gov/research/treesearch/52933 (Accessed on April 30, 2024).
Millennium Ecosystem Assessment (2005). Ecosystems and human well-being: Current state and trends. Washington, DC: Island Press.
Morris, J. L., Cottrell, S., Fettig, C. J., DeRose, R. J., Mattor, K. M., Carter, V. A., et al. (2018). Bark beetles as agents of change in social–ecological systems. Front. Ecol. Environ. 16, S34–S43. doi: 10.1002/fee.1754
Müller, M. (2011). How natural disturbance triggers political conflict: bark beetles and the meaning of landscape in the Bavarian Forest. Glob. Environ. Chang. 21, 935–946. doi: 10.1016/j.gloenvcha.2011.05.004
National Geographic (2023). Biomass Energy. Available at: https://education.nationalgeographic.org/resource/biomass-energy/ (Accessed on April 30, 2024).
Natural Capital Project (2023). InVEST 3.13.0, Stanford University, University of Minnesota, Chinese Academy of Sciences, the nature conservancy, World Wildlife Fund, Stockholm resilience Centre and the Royal Swedish Academy of Sciences. Available at: https://naturalcapitalproject.stanford.edu/software/invest.
Nature Climate Change Editorial (2020). ‘Shifting habitats’, nature. Climate Change 10:377. doi: 10.1038/s41558-020-0789-x
Noriega, J. A., Hortal, J., Azcárate, F. M., Berg, M. P., Bonada, N., Briones, M. J., et al. (2018). Research trends in ecosystem services provided by insects. Basic Appl. Ecol. 26, 8–23. doi: 10.1016/j.baae.2017.09.006
Nowak, D. J., Hoehn, R., and Crane, D. E. (2007). Oxygen production by urban trees in the United States. Arboricul. Urban Forest. 33, 220–226. doi: 10.48044/jauf.2007.026
Nyelele, C., Keske, C., Chung, M. G., Guo, H., and Egoh, B. N. (2023). Using social media data to estimate recreational travel costs: a case study from California. Ecol. Indic. 154:110638. doi: 10.1016/j.ecolind.2023.110638
Office of Management and Budget of the White House (2023). Appendix D: Discount rates for Benefit-Cost Analysis. Available at: https://www.whitehouse.gov/wp-content/uploads/2023/11/CircularA-94AppendixD.pdf (Accessed on April 30, 2024).
Ouyang, Z., Zheng, H., Xiao, Y., Polasky, S., Liu, J., Xu, W., et al. (2016). Improvements in ecosystem services from investments in natural capital. Science 352, 1455–1459. doi: 10.1126/science.aaf2295
Pereira, P., Bogunovic, I., Zhao, W., and Barcelo, D. (2021). Short-term effect of wildfires and prescribed fires on ecosystem services. Curr. Opinion Environ. Sci. Health 22:100266. doi: 10.1016/j.coesh.2021.100266
Pierce, D. W., Kalansky, J. F., and Cayan, D. R. (2018). Climate, drought, and sea level rise scenarios for California’s fourth climate change assessment. California Energy Commission California Natural Resources Agency.
Powers, RF, and Oliver, WW (1990). Libocedrus decurrens Torr. Incense-Ceda, United States Department of Agriculture Forest Service. Available at: https://www.srs.fs.usda.gov/pubs/misc/ag_654/volume_1/libocedrus/decurrens.htm (Accessed on April 30, 2024).
Qiao, X., Gu, Y., Zou, C., Xu, D., Wang, L., Ye, X., et al. (2019). Temporal variation and spatial scale dependency of the trade-offs and synergies among multiple ecosystem services in the Taihu Lake Basin of China. Sci. Total Environ. 651, 218–229. doi: 10.1016/j.scitotenv.2018.09.135
Raffa, K. F., Aukema, B. H., Bentz, B. J., Carroll, A. L., Hicke, J. A., Turner, M. G., et al. (2008). Cross-scale drivers of natural disturbances prone to anthropogenic amplification: the dynamics of bark beetle eruptions. Bioscience 58, 501–517. doi: 10.1641/B580607
Ray, C., Cluck, D. R., Wilkerson, R. L., Siegel, R. B., White, A. M., Tarbill, G. L., et al. (2019). Patterns of woodboring beetle activity following fires and bark beetle outbreaks in montane forests of California, USA. Fire Ecol. 15, 1–20. doi: 10.1186/s42408-019-0040-1
Renteria, J. L., Darin, G. M. S., and Grosholz, E. D. (2021). Assessing the risk of plant species invasion under different climate change scenarios in California. Invasive Plant Sci. Manag. 14, 172–182. doi: 10.1017/inp.2021.23
Riley, K. L., Grenfell, I. C., Shaw, J. D., and Finney, M. A. (2022). TreeMap 2016 dataset generates CONUS-wide maps of forest characteristics including live basal area, aboveground carbon, and number of trees per acre. J. For. 120, 607–632. doi: 10.1093/jofore/fvac022
Riordan, EC, Montalvo, AM, and Beyers, JL (2018). ‘Using species distribution models with climate change scenarios to aid ecological restoration decisionmaking for southern California shrublands ’.
Runting, R. K., Bryan, B. A., Dee, L. E., Maseyk, F. J., Mandle, L., Hamel, P., et al. (2017). Incorporating climate change into ecosystem service assessments and decisions: a review. Glob. Chang. Biol. 23, 28–41. doi: 10.1111/gcb.13457
Schowalter, T. D., Noriega, J. A., and Tscharntke, T. (2018). Insect effects on ecosystem services—introduction. Elsevier 26, 1–7. doi: 10.1016/j.baae.2017.09.011
Schwalm, C. R., Glendon, S., and Duffy, P. B. (2020). RCP8. 5 tracks cumulative CO2 emissions. Proceed Nation. Academy Sci. 117, 19656–19657. doi: 10.1073/pnas.2007117117
Sharp, R, Tallis, H, Ricketts, T, Guerry, A, Wood, S, Chaplin-Kramer, R, et al. (2015). InVEST 3.2.0 User's guide, The natural capital project, Stanford University, University of Minnesota, The Nature Conservancy, and World Wildlife Fund.
Singh, V. V., Naseer, A., Mogilicherla, K., Trubin, A., Zabihi, K., Roy, A., et al. (2024). Understanding bark beetle outbreaks: exploring the impact of changing temperature regimes, droughts, forest structure, and prospects for future forest pest management. Rev. Environ. Sci. Biotechnol. 23, 257–290. doi: 10.1007/s11157-024-09692-5
Skendžić, S., Zovko, M., Živković, I. P., Lešić, V., and Lemić, D. (2021). The impact of climate change on agricultural insect pests. Insects 12:440. doi: 10.3390/insects12050440
Smith, S. L., Borys, R. R., and Shea, P. J. (2009). Jeffrey pine beetle. Forest Pest Leaflet 11 (revised). Portland: USDA Forest Service.
Spencer, W. D., Rustigian, H. L., Scheller, R. M., Syphard, A., Strittholt, J., and Ward, B. (2008). Baseline evaluation of fisher habitat and population status, and effects of fires and fuels management on fishers in the southern Sierra Nevada. Report prepared for USDA Forest Service, Pacific Southwest Region. 133. Available at: https://consbio.org/reports/baseline-evaluation-of-fisher-habitat-and-population-status-effects-of-fires-and-fuels-management-on-fishers-in-the-southern-sierra-nevada/ (Accessed December 9, 2024)
Steel, Z., Goodwin, M., Meyer, M., Fricker, G. A., Zald, H., Hurteau, M., et al. (2021). Do forest fuel reduction treatments confer resistance to beetle infestation and drought mortality? Ecosphere 12:e03344. doi: 10.1002/ecs2.3344
Stoeckl, N., Condie, S., and Anthony, K. (2021). Assessing changes to ecosystem service values at large geographic scale: a case study for Australia’s great barrier reef. Ecosyst. Serv. 51:101352. doi: 10.1016/j.ecoser.2021.101352
Stosch, K. C., Quilliam, R. S., Bunnefeld, N., and Oliver, D. M. (2019). Quantifying stakeholder understanding of an ecosystem service trade-off. Sci. Total Environ. 651, 2524–2534. doi: 10.1016/j.scitotenv.2018.10.090
Sturtevant, B. R., Gustafson, E. J., Li, W., and He, H. S. (2004). Modeling biological disturbances in LANDIS: a module description and demonstration using spruce budworm. Ecol. Model. 180, 153–174. doi: 10.1016/j.ecolmodel.2004.01.021
Tahoe Regional Planning Agency (2024). Tahoe Central Sierra Initiative. Available at: https://www.tahoecentralsierra.org/ (Accessed December 9, 2024).
TEEB (2011) in The economics of ecosystems and biodiversity: Ecological and economic foundations. ed. P. Kumar. 1st ed. (Abingdon and New York: Routledge).
Thorn, S., Bässler, C., Brandl, R., Burton, P. J., Cahall, R., Campbell, J. L., et al. (2018). Impacts of salvage logging on biodiversity: a meta-analysis. J. Appl. Ecol. 55, 279–289. doi: 10.1111/1365-2664.12945
Tonini, F., Jones, C., Miranda, B. R., Cobb, R. C., Sturtevant, B. R., and Meentemeyer, R. K. (2018). Modeling epidemiological disturbances in LANDIS-II. Ecography 41, 2038–2044. doi: 10.1111/ecog.03539
Turner, R. K., Morse-Jones, S., and Fisher, B. (2010). Ecosystem valuation: a sequential decision support system and quality assessment issues. Ann. N. Y. Acad. Sci. 1185, 79–101. doi: 10.1111/j.1749-6632.2009.05280.x
U.S. Energy Information Administration (2024). Biomass explained. Available at: https://www.eia.gov/energyexplained/biomass/#:~:text=Biomass%20is%20renewable%20organic%20material%20that%20comes%20from,to%20liquid%20and%20gaseous%20fuels%20through%20various%20processes (Accessed December 9, 2024).
U.S. Environmental Protection Agency (2022), 25 Years of Investing in a Clear, Healthy Lake Tahoe. Available at: https://www.epa.gov/system/files/documents/2021-08/tahoe_fact_sheet_aug_2021-08-12.pdf (Accessed April 30, 2024).
U.S. Forest Service (2015). Bark beetles in California conifer. Available at: https://www.fs.usda.gov/Internet/FSE_DOCUMENTS/stelprdb5384837.pdf (Accessed April 30, 2024).
U.S. Forest Service (2023a). Prescribed fire, https://www.fs.usda.gov/detail/eldorado/landmanagement/resourcemanagement?cid=fsbdev7_019112 (Accessed April 30, 2024).
U.S. Forest Service (2023b), Tahoe-central sierra initiative (TCSI). Available at: https://www.fs.usda.gov/research/psw/partnerships/tcsi#overview (Accessed July 18, 2023).
U.S. Forest Service (2024). Forest Insect & Disease Leaflets (FIDLs): Bark Beetles and Wood Borers. Available at: https://www.fs.usda.gov/science-technology/forest-health-protection/publications-reports/forest-insect-disease-leaflets (Accessed December 9, 2024).
U.S. Global Change Research Program (2017). “Executive summary” in Climate science special report: Fourth National Climate Assessment. eds. D. J. Wuebbles, D. W. Fahey, K. A. Hibbard, D. J. Dokken, B. C. Stewart, and T. K. Maycock, vol. I (Washington, DC, USA: U.S. Global Change Research Program), 12–34.
United Nations SEEA-EA (2021). System of Environmental-Economic Accounting—Ecosystem Accounting, White cover publication. Available at: https://seea.un.org/ecosystem-accounting (Accessed April 30, 2024).
United States Government (2021). Technical support document: Social cost of carbon, methane, and nitrous oxide
University of Montana and Service (2023), Harvest by County Tool. Available at: https://www.bber.umt.edu/FIR/H_Harvest.asp (Accessed April 30, 2024).
Wayman, R. B., and Safford, H. D. (2021). Recent bark beetle outbreaks influence wildfire severity in mixed-conifer forests of the Sierra Nevada, California, USA. Ecol. Appl. 31:e02287. doi: 10.1002/eap.2287
Wear, D, Wibbenmeyer, M, and Joiner, E (2023). The Economics of Forest Fuel Removals on Federal Lands. Available at: https://media.rff.org/documents/WP_23-27_v3.pdf (Accessed April 30, 2024).
Wilson, L., and Manley, P. (2021). Assessment of current landscape conditions: Tahoe-central sierra initiative, U.S. Forest Service. Available at: https://research.fs.usda.gov/psw/understory/assessment-current-landscape-conditions-tahoe-central-sierra-initiative.
Keywords: biodiversity, climate impact, cost–benefit analysisecosystem service value, ecosystem service valuation, environmental change, environmental impact assessment
Citation: Chen H, Sloggy MR, Flake SW, Evans S and Maxwell CJ (2025) Impacts of climate-driven insect population change on sawtimber provisioning, carbon sequestration, and water retention: a case study of bark beetle outbreaks in the USA. Front. For. Glob. Change. 7:1513721. doi: 10.3389/ffgc.2024.1513721
Edited by:
Milica Zlatkovic, University of Novi Sad, SerbiaReviewed by:
Jesse L. Morris, Weber State University, United StatesJovan Dobrosavljević, University of Belgrade, Serbia
Adam Felton, Swedish University of Agricultural Sciences, Sweden
Niko Tutland, New Mexico Consortium, United States
Copyright © 2025 Chen, Sloggy, Flake, Evans and Maxwell. This is an open-access article distributed under the terms of the Creative Commons Attribution License (CC BY). The use, distribution or reproduction in other forums is permitted, provided the original author(s) and the copyright owner(s) are credited and that the original publication in this journal is cited, in accordance with accepted academic practice. No use, distribution or reproduction is permitted which does not comply with these terms.
*Correspondence: Haojie Chen, aGFvamllLmNoZW45OTJAZ21haWwuY29t
 Haojie Chen
 Matthew R. Sloggy
 Samuel W. Flake
 Samuel Evans
 Charles J. Maxwell

