 Alessandro Di Fabio1*
 Valentina Buttò2
 Debojyoti Chakraborty3
 Gregory A. O’Neill4
 Silvio Schueler3
 Juergen Kreyling1
- 1Institute of Botany and Landscape Ecology, University of Greifswald, Greifswald, Germany
- 2Forest Research Institute, Université du Québec en Abitibi-Témiscamingue, Rouyn-Noranda, QC, Canada
- 3Austrian Research Centre for Forests BFW, Vienna, Austria
- 4British Columbia Ministry of Forests, Vernon, BC, Canada
Climate change is expected to outpace the rate at which populations of forest trees can migrate. Hence, in forestry there is growing interest in intervention strategies such as assisted migration to mitigate climate change impacts. However, until now the primary focus when evaluating candidates for assisted migration has been mean or maximum performance. We explore phenotypic plasticity as a potentially new avenue to help maintain the viability of species and populations in the face of climate change. Capitalizing on large, multi-site international provenance trials of four economically and ecologically important forest tree species (Fagus sylvatica, Picea abies, Picea engelmannii, Pinus contorta), we quantify growth stability as the width of the response function relating provenance growth performance and trial site climate. We found significant differences in growth stability among species, with P. engelmannii being considerably more stable than the other three species. Additionally, we found no relationship between growth performance and growth stability of provenances, indicating that there are fast-growing provenances with a broad climate optimum. In two of the four species, provenances’ growth stability showed a significant relationship with the climate of the seed source, the direction of which depends on the species. When taken together with data on growth performance in different climate conditions, a measure of growth stability can improve the choice of species and provenances to minimize future risks in forest restoration and reforestation.
1 Introduction
High rates of change in future climate projections (IPCC, 2023) will most likely exceed the capacity of long-lived, sessile species such as forest trees to adapt through natural selection (St Clair and Howe, 2007) or migration (Aitken et al., 2008), even if there is a possibility of adaptation in place for some species (Kramer et al., 2010). Phenotypic plasticity will likely play an important role in ensuring the survival of tree species and populations (Leites and Benito Garzón, 2023), at least in the short term; however, plasticity data for forest trees is relatively scarce, due to amounts of time and resources required for establishing test sites across wide climate ranges. Furthermore, analyses of existing data have been focused on identifying differences in performance in population means. Except for rare examples (Vizcaíno-Palomar et al., 2020), potential differences in plasticity between populations have seldom been studied, despite being important for determining a population’s ability to withstand a changing climate (Valladares et al., 2014).
Phenotypic plasticity can be defined in various ways and at different scales, very often employing different terminologies for similar concepts (Nicotra et al., 2010). While research often focuses on plasticity in functional traits such as morphology, phenology, or physiology, we choose to analyze plasticity in growth performance of trees. Growth is a trait of primary interest in forestry, since it directly determines wood production, but it is also of great ecological importance, since growth is closely correlated with fitness and survival in young trees (Moustakas and Evans, 2015; Jiang et al., 2022). We focus on height growth, since it is one of the most important growth traits for trees, and the one for which most data is available.
In this study, we refer to plasticity in functional traits as “phenotypic plasticity” (Ghalambor et al., 2007), and to the lack of plasticity in growth as “growth stability” across different climate conditions (Santini et al., 2010; Alvarez et al., 2020). In our interpretation, growth stability originates from phenotypic plasticity in functional traits (Wright et al., 2016), and we will focus our attention on the differences in growth stability among species and populations, due to the importance of growth stability for forestry interventions. Identifying species or populations with high growth stability across different climate conditions would allow for wider margins of error in estimating the optimal forest tree seed source according to future climate projections. This strategy would help to offset uncertainty in climate models, which dramatically increases when predicting extreme climate events, and have crucial impact on tree growth and survival.
We expect that more generalist species, which are distributed across wider geographical and environmental ranges, have higher growth stability, both on a theoretical basis (Baker, 1974) and based on experimental evidence (Sultan, 2001). In other words, species and populations characterized by broader ecological niches would show more constant growth performance across wider ranges of climate conditions. However, it is also possible that populations with high growth stability might show stable, but low, growth performance, i.e., a trade-off between plasticity and growth performance (Richards et al., 2006; Hendry, 2016). This trade-off, due to the costs associated with maintaining a more flexible genotype or phenotype, has been shown to be particularly relevant under stressful environmental conditions (Van Buskirk and Steiner, 2009). Identifying populations possessing both high growth stability and high growth performance would be of great interest for forest managers and researchers, as they may help buffer increased climate variability and uncertainty associated with climate change.
It is commonly assumed that phenotypic plasticity is an adaptive trait, which might be subject to natural selection, especially in response to highly variable environmental conditions (Alpert and Simms, 2002; Lázaro-Nogal et al., 2015; Carvajal et al., 2017; Vázquez et al., 2017). Under this hypothesis, more unstable climates would select for higher levels of growth stability. For this reason, we investigated the possibility that growth stability of a population might be positively related with climate variability at the seed source. On the other hand, the evidence for a relationship between growth stability and the level of a climate variable itself (not its variability) is more discordant, with some authors arguing that populations at the climate extremes of a species’ distribution should show lower levels of phenotypic plasticity. This would be due to genetic drift (Arnaud-Haond et al., 2006) and the costs associated with plasticity being more important in unfavorable environments (Mägi et al., 2011).
In forest science, provenance trials (also called common garden experiments) are a commonly used experimental setup (Langlet, 1971). Growing diverse provenances in a common environment allows genetic (G), environmental (E), and GxE interaction effects to be disentangled if the trials are established in disparate environments (Alberto et al., 2013; Kreyling et al., 2019). Often the genetic structure of the populations and sub-populations used in these trials is not known or well-characterized, and for this reason the term “provenance” is used: a provenance is simply defined as a group of trees originating from a single geographical seed source.
We utilized data originating from established networks of provenance trials of four important tree species (Fagus sylvatica, Picea abies, Picea engelmannii, Pinus contorta), allowing us to compare the growth stability of more than 300,000 trees (7–32 years old), originating from numerous seed sources, planted across wide geographic and climate gradients in Europe and North America. By calculating a growth stability index to enable across-species comparisons, we investigated the following hypotheses:
1. There are significant differences in growth stability among different tree species, with species from broader ranges being more stable.
2. There is a negative relationship between provenance growth performance and provenance growth stability.
3. Differences in growth stability among provenances are related to the seed source climate and its inter-annual variability, with provenances from more variable climates having higher growth stability.
2 Materials and methods
2.1 Software
We used R version 4.3.2 (R Core Team, 2023) in RStudio version 2023.09.1 (Posit Team, 2023) for all data preparation, statistical analysis, and figure making.
The “gslnls” (Chau, 2023), “gamlss” (Rigby and Stasinopoulos, 2005), and “emmeans” (Lenth, 2023) packages were used for model fitting and testing. Data manipulation employed functions from the “tidyverse” (Wickham et al., 2019) package collection, and from the “janitor” (Firke, 2023) and “broom” (Robinson et al., 2023) packages. RMSE values were calculated with the function “rmse()” from package “performance” (Lüdecke et al., 2021), while MAE values were obtained with the function “mae()” from package “Metrics” (Hamner and Frasco, 2018). Climate range coverage percentages were calculated using the functions “grDevices::chull()” and the “areapl()” function from the “splancs” package (Rowlingson and Diggle, 2024). PCA was conducted using the package “FactoMineR” (Lê et al., 2008). p-values were formatted using functions “p_format()” and “add_significance()” from package “rstatix” (Kassambara, 2023). Geospatial data was manipulated using the packages “terra” (Hijmans, 2023) and “tidyterra” (Hernangómez, 2023).
2.2 Provenance trials
We used provenance trial growth data of four major temperate and boreal forest tree species of North America and Europe with high economic and ecological importance (Figure 1) and large natural distributions, both geographically and climatically. These provenance trials are noteworthy for the breadth of climate conditions covered, especially with respect to the species’ ranges, and the number of trial sites and provenances tested (Figure 2). As a confirmation, we calculated the percentage of the climate range of each species covered by the seed sources/trial sites, finding relatively high coverage percents (respectively 48% ± 18% for the seed sources and 19% ± 3% for the trial sites). More in detail, we calculated the percentage climate range as the ratio between the areas of the polygons defined by each species’ occurrences and seed sources (or trial sites, respectively) in the MAT × MAP climate space.
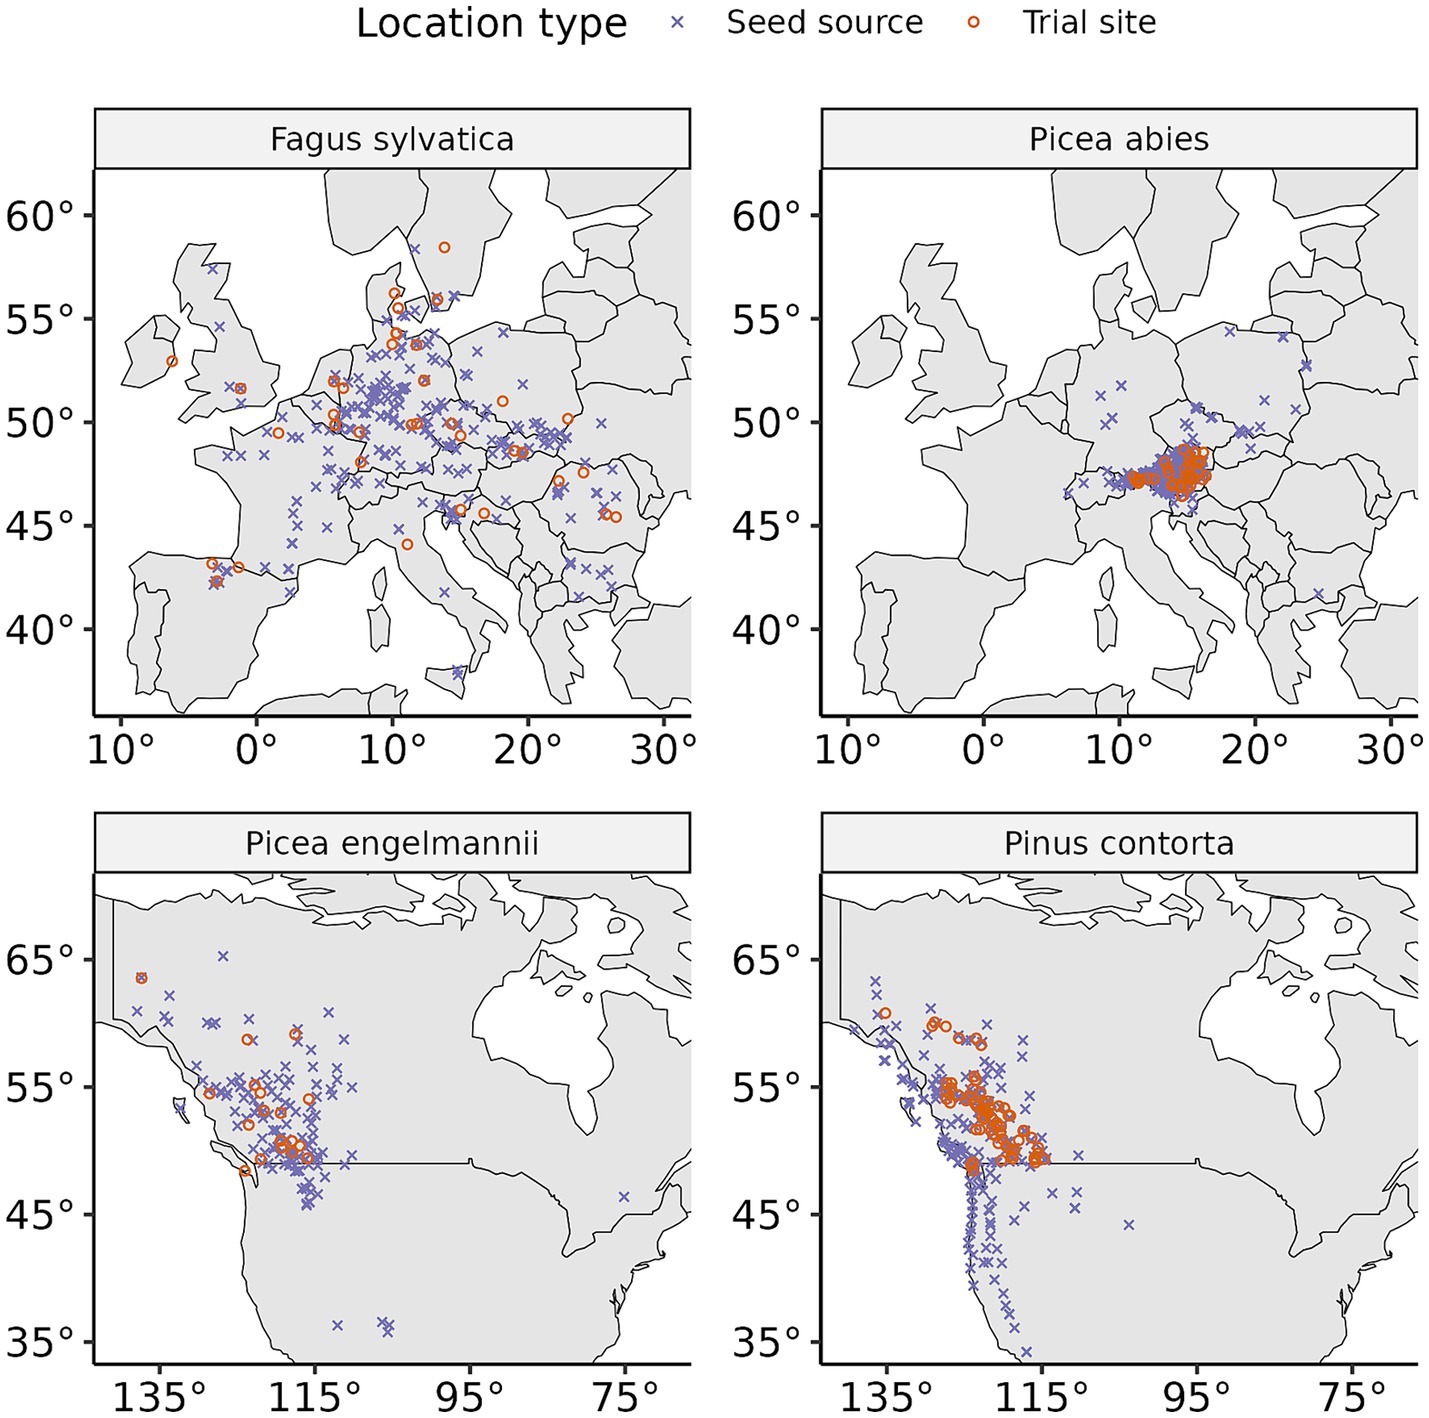
Figure 1. Location of the experimental trial sites and of the seed sources in Europe (top row) and North America (bottom row), for the four tree species examined in this study.
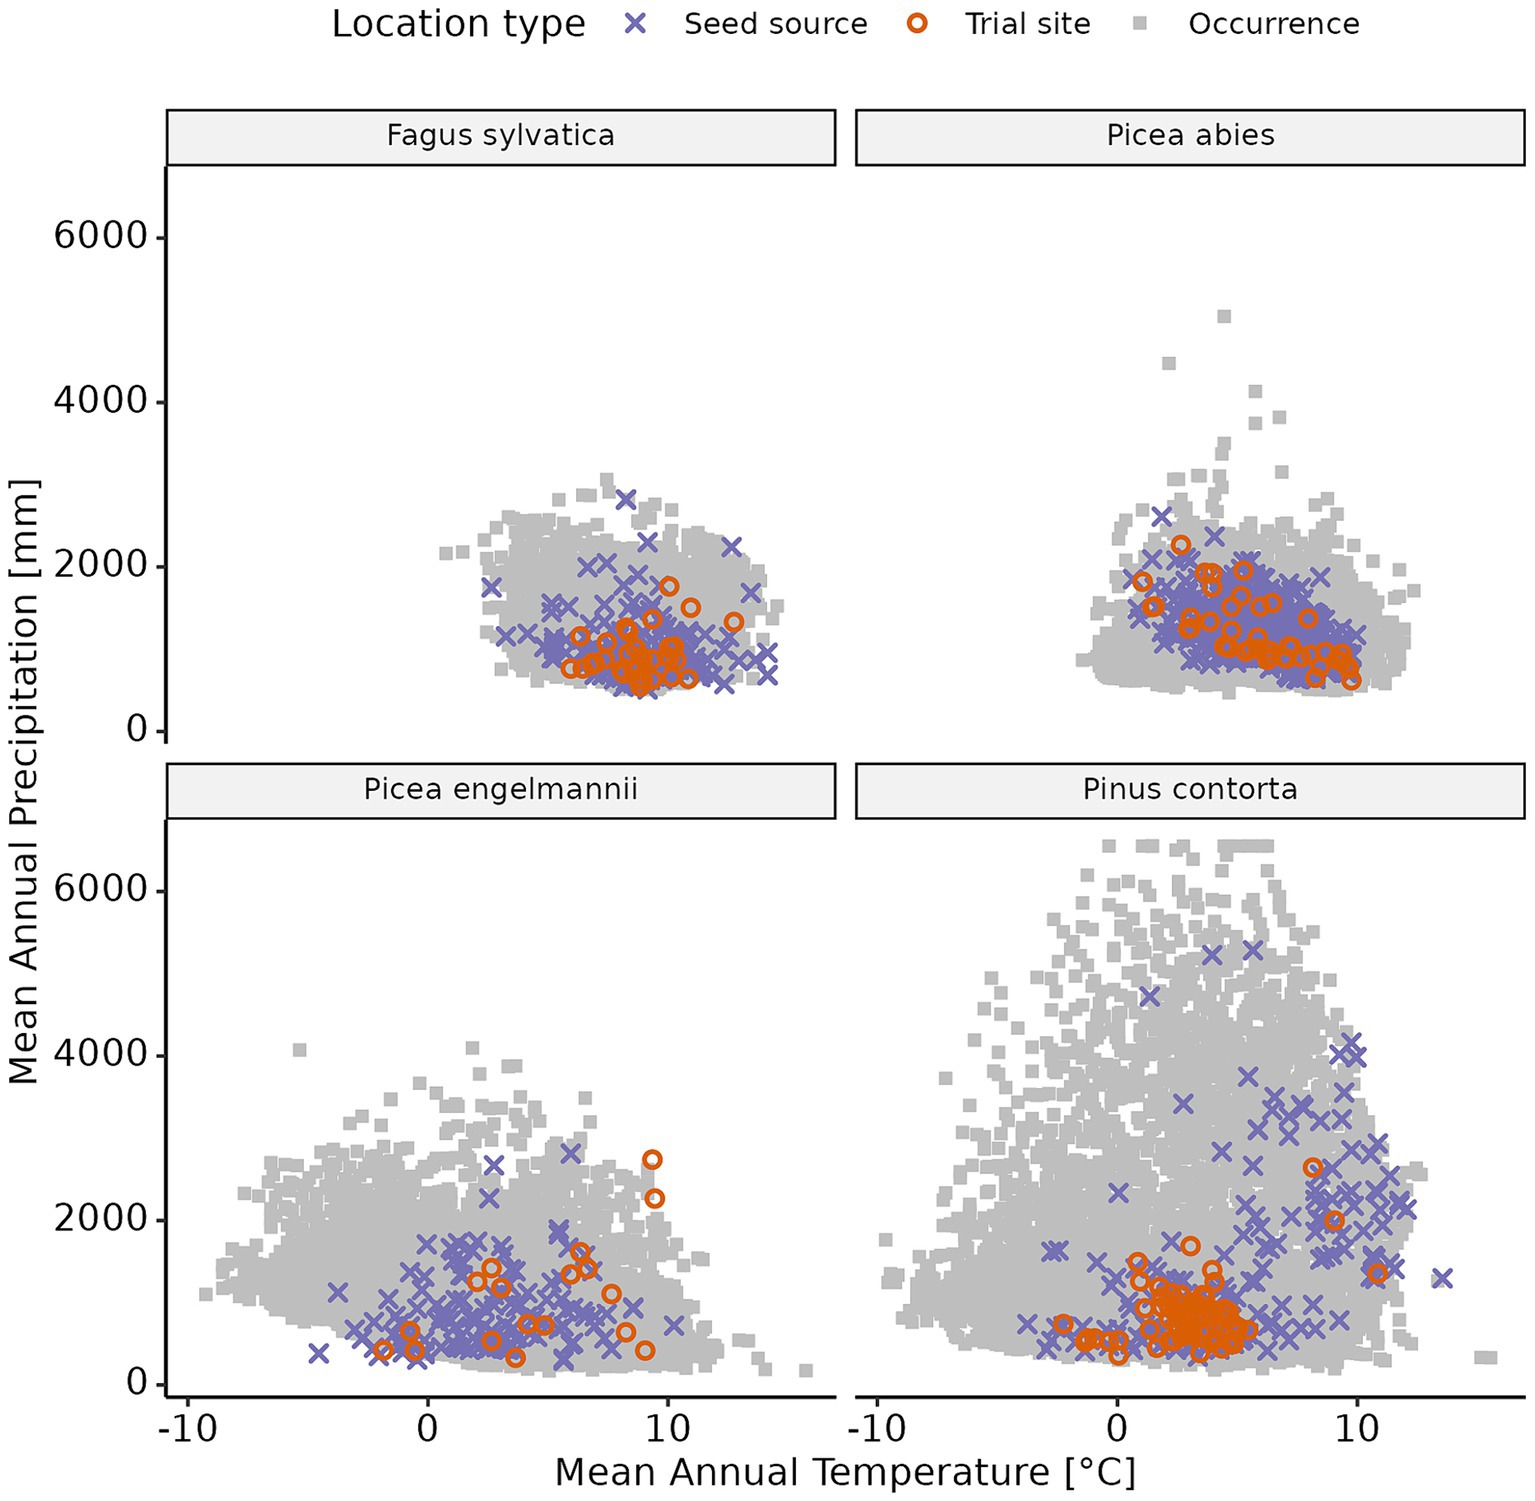
Figure 2. Climate distribution of each of the provenance trial sites, seed sources, and the four tree species examined in this study. Species’ occurrence data was sourced from the EU-Forest database (Mauri et al., 2017) for Fagus sylvatica and Picea abies, and from the databasin.org database (Little, 1971; Comendant et al., 2009) for Picea engelmannii and Pinus contorta.
2.2.1 Fagus sylvatica
Fagus sylvatica L. is a deciduous temperate forest tree. Due to its juvenile shade tolerance and tall growth with a dense canopy, it is the dominant native forest tree in Central Europe (Leuschner and Ellenberg, 2017) found in a wide range of climate and environmental conditions (Fang and Lechowicz, 2006). It is considered highly sensitive to climate change and its persistence and potential role under future climate conditions is debated (Gessler et al., 2006; Saltré et al., 2015; Engel et al., 2023). Population persistence, however, is potentially higher than anticipated due to high phenotypic plasticity in important functional traits such as phenology and leaf morphology (Gárate-Escamilla et al., 2019; Schmeddes et al., 2023).
We utilized data from Robson et al. (2018), which reports on a Europe-wide network of Fagus sylvatica provenance trials, established between 1995 and 1998. This dataset comprised more than 174,000 individuals from 194 provenances and 38 trial sites. However, measurement ages differed among trial sites, with at least some trial sites being measured each year from age 1 to 13.
2.2.2 Picea abies
Picea abies (L.) H. Karst. is a conifer native to northern and eastern Europe. It has been planted for timber production and became the most economically important tree species in central Europe, despite large parts of central Europe being outside its natural range (Leuschner and Ellenberg, 2017). Vast areas of these plantations are currently dying back due to climate-change induced drought and warming in combination with bark beetle attacks (Schuldt et al., 2020), fueling ongoing attempts to diversify monocultural stands and replace the species in the long term (Vacek et al., 2019).
Seedlings from 540 provenances of Picea abies were planted at 44 trial sites across Austria in 1978. While the geographic range covered by these trial sites is relatively small (Figure 1), they span a wide proportion of the species’ climate range (Figure 2). See Nather and Holzer (1979) and Kapeller et al. (2012) for details regarding the materials, sites and design. Height was recorded at ages 7, 8, 9, 10, and 15.
2.2.3 Picea engelmannii
Picea engelmannii and Picea glauca are sympatric in across large portions of British Columbia and in the Rocky Mountains of Alberta where they readily hybridize. (For simplicity, we refer to the two species and their hybrids as P. engelmannii.) Suitable climate ranges of P. engelmannii, the most widely planted species in British Columbia, are expected to shift northward and decline substantially in extent in British Columbia in coming decades due to climate change (MacKenzie and Mahony, 2021).
127 provenances of Picea engelmannii, Picea glauca and their natural hybrids from western North America were planted at 18 (17 extant) trial sites in British Columbia, Alberta, and the Yukon in 2005. See O’Neill et al. (2014) and Grubinger et al. (2023) for details regarding the materials, sites and design. Height was recorded at ages 3, 6, 10 and 16.
2.2.4 Pinus contorta
The most widely distributed and second most widely planted tree species in British Columbia, Pinus contorta was heavily impacted by mountain pine beetle in the last 2 decades. Being one of the most strongly locally adapted of the widely distributed tree species of western North America (Rehfeldt, 1994), its productivity is expected to decline substantially as the climate warms (O’Neill et al., 2008). Its climate niche is expected to shift northward and decline substantially in extent in British Columbia in coming decades due to climate change (MacKenzie and Mahony, 2021).
140 provenances of Pinus contorta from throughout the species’ range in western North America were planted at 60 trial sites in British Columbia and two sites in the Yukon in 1974. See O’Neill et al. (2008) for details regarding the materials, sites and design. Height was recorded at ages 6, 10, 15, 20, and 32.
2.2.5 Data cleaning
The data was cleaned by identifying outlier trial-years (years in which a trial has a more than 5-fold increase or decrease in height compared to the previous and following year), and correcting the units of measurement where obviously wrongly reported (e.g., meters to centimeters), otherwise discarding the measures for the outlier trial-year. Additionally, individual trees that at any point presented a yearly decrease in height of more than 25 centimeters were removed from the dataset. Overall, 18,165 of 1,214,008 individual measures were discarded.
We chose not to remove extremely short individuals from the analysis (e.g., by removing individuals with height < 1 m at age 10). Such growth rates, while very low, are not overly surprising considering the harsh climate conditions at some trial sites, and the very long climate transfer distances experienced by some provenances. In fact, removing such short individuals would discard valuable information on the climate-growth relationships, flattening and distorting the climate response functions.
Following the clean-up steps described above, our final database comprised more than 1 million records, more than 350,000 individual trees, 760 provenances, and 139 trial sites (Table 1).
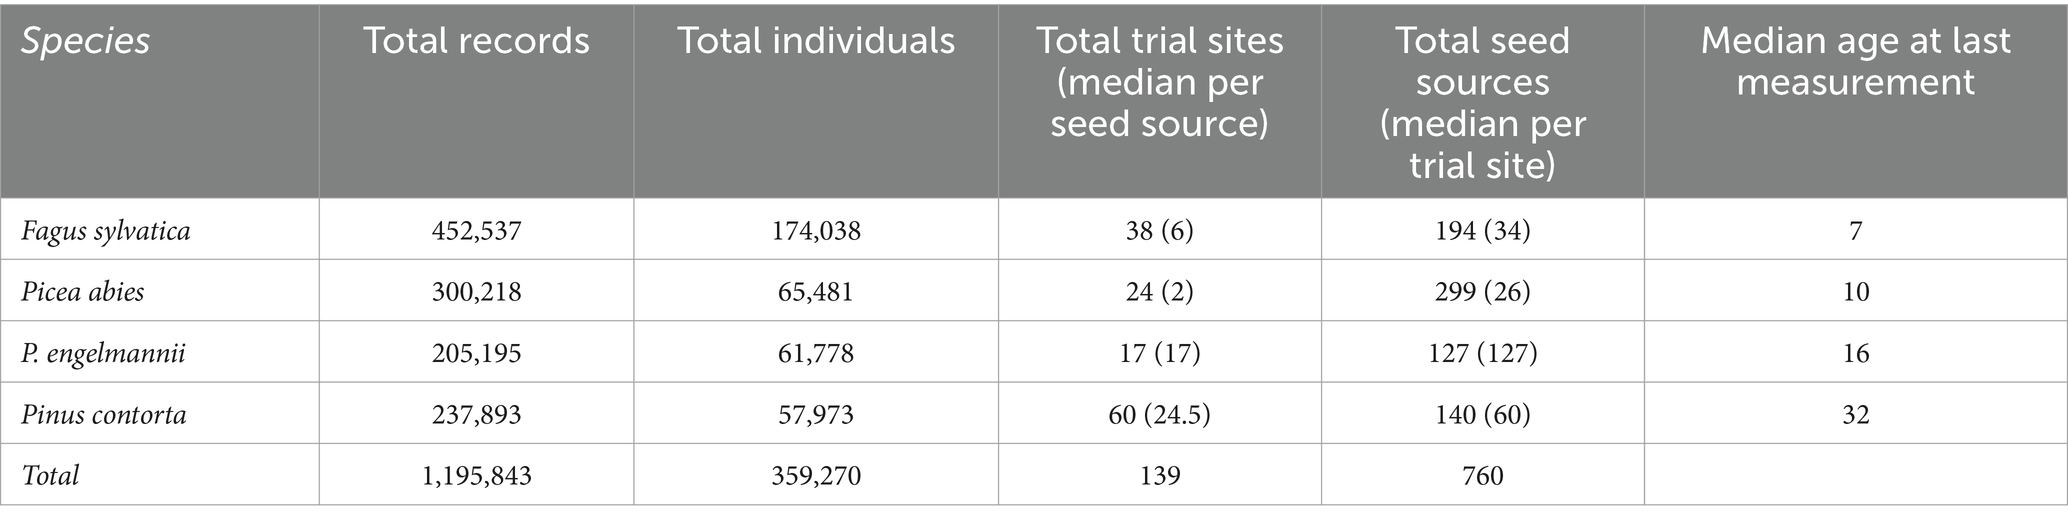
Table 1. Summary of the cleaned-up dataset.
2.3 Growth data harmonization
The trial sites were established at different times, and the ages at which height was recorded differed among species and among sites within species; therefore, it was necessary to identify a common age for height assessment, i.e., to harmonize height ages among sites and species. For each tree we fitted tree height to a logistic regression model using age as the independent variable, and extracted height at age 10 (HT10) from the fitted model. We chose to harmonize at age 10, before canopy closure and inter-plot competition could accentuate and bias population differences, masking the purely genetic and climatic effects.
For each individual, the model has the form:
Where:
is one asymptote of the curve (the other being 0).
is the slope at the midpoint.
is the location of the midpoint (where ).
The models were fitted using the function “gsl_nls()” from package “gslnls.” Compared to most non-linear fitting functions, gsl_nls() has the advantage of being much less sensitive to the choice of starting parameters, and of being able to converge rapidly and reliably in most cases (Hickernell and Yuan, 1997).
We removed unsuccessful model fits, and regressions for which the estimated parameters were outside the following boundaries: . These boundaries were selected to remove unrealistic model fits, such as those predicting negative height, negative growth, or no growth. Additionally, we ensured the quality of the fitted models by calculating the Root Mean Square Error (RMSE) and Mean Absolute Error (MAE) for each individual model, and aggregating them at the species level (Table 2), calculating their mean and standard deviation separately for each species. RMSE and MAE are commonly used measures of error for regression models, and among their advantages is the fact that they are expressed in the same units as the original response variable (Chai and Draxler, 2014). The formulas for the two error measures are as follow:
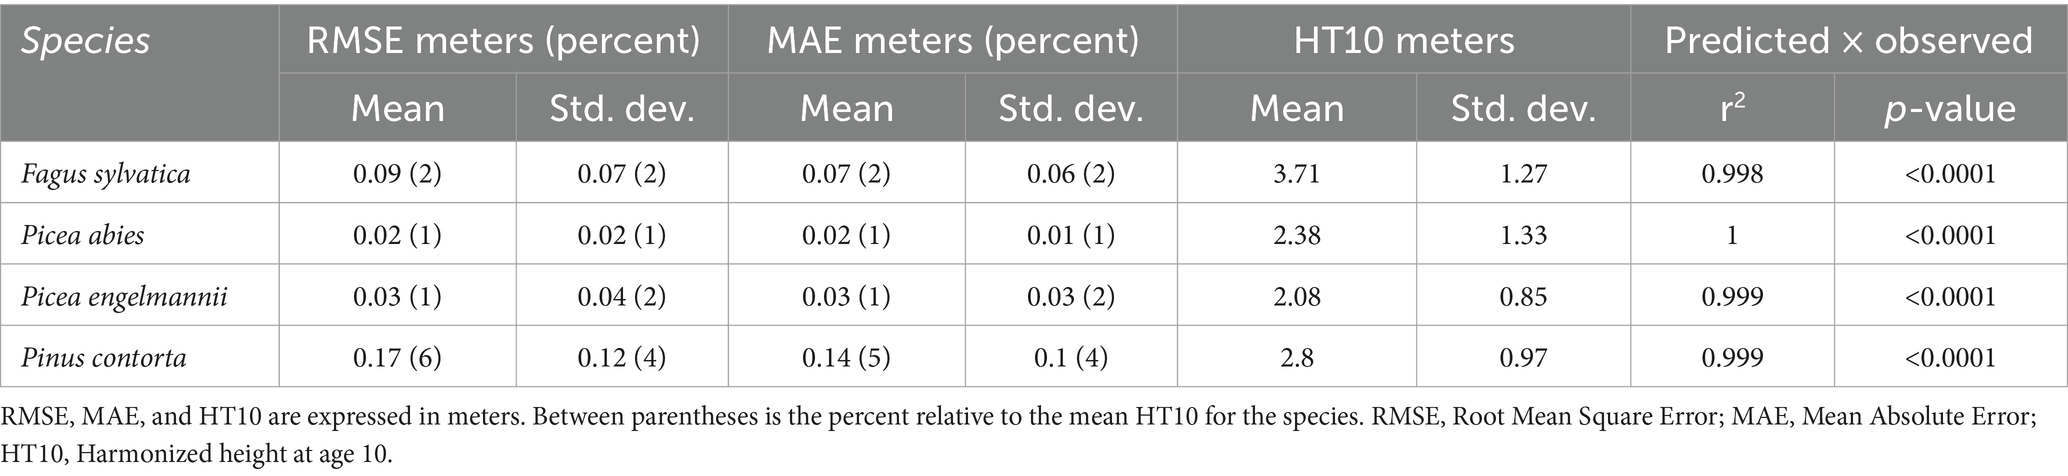
Table 2. Summary of errors and goodness of fit for the growth data harmonization models.
2.4 Climate data
We employed the CHELSA dataset (Karger et al., 2017, 2020) as the source of the climate data for the present study. The CHELSA database contains very high-resolution (30 arc sec, ~1 km) rasters covering the entire land surface of the Earth. It contains interpolated estimates of many climatic and derived bioclimatic variables. For each trial site and seed source, we extracted the average values of all 19 available climate variables for the period 1981–2010, as these years best represent the HT10 growth period of the trial sites.
2.4.1 Inter-annual climate variability
Additionally, to quantify the inter-annual climate variability of the trial sites, we extracted monthly precipitation and mean surface temperatures for each trial site location. We then aggregated the data to calculate Annual Precipitation (AP) and Mean Annual Temperature (MAT) for each year at each trial site, from which we calculated the coefficient of variation for AP (AP CV), and the standard deviation of MAT (MAT SD) over the 30-year interval. We calculated the SD of MAT, instead of the CV, because the CV is not defined for a scale without a natural zero point (Dunn and Clark, 2009).
2.4.2 Principal component analysis
To reduce collinearity and the number of climate variables (19 long-term bioclimatic variables and 2 variables for the inter-annual variability, see Supplementary Table S1), we carried out a Principal component analysis (PCA). PCA is an approach commonly used in environmental science/species distribution modeling to simplify complex datasets of correlated variables into a smaller number of variables, which can be more easily employed in modeling (Lever et al., 2017).
We chose not to calculate separate PCAs on different timeframes for each species, or separately for trials sites and seed sources. In the first place, because the differences across time periods in the climate conditions at each trial site/seed source are expected to be relatively small in the time range covered by the present study. Furthermore, these differences should not be so large as to cause significant shifts in long-term climate patterns across the study locations, and therefore we expect that differentiating timeframes would have a minimal impact on the analysis’ results. In the second place, the PCA methodology requires using an uniform dataset, to ensure comparability of the Principal Components (PCs). Taken together, these two considerations support our choice of running a single PCA on the entire dataset.
We used the function “PCA()” from the “FactoMineR” package to calculate the PCA on the climate data for all species, seed sources, and trial sites. We then selected the first two PCs for subsequent analyses. All climate variables were centered and scaled, to give each variable equal weight in the analysis, and to aid in subsequent model fitting. The first two PCs accounted, respectively, for 38 and 23% of the variance in the climate variables. In broad terms, higher values of PC 1 indicate higher precipitation amounts, more constant (both within the year and across years) mean temperatures, and warmer and wetter winters. It might be interpreted as a measure of continentality, with increasing values of PC1 associated with a more maritime climate. Higher values of PC 2 indicate colder and rainier conditions in general, and particularly in summer (Figure 3; Supplementary Table S1; Supplementary Figure S1).
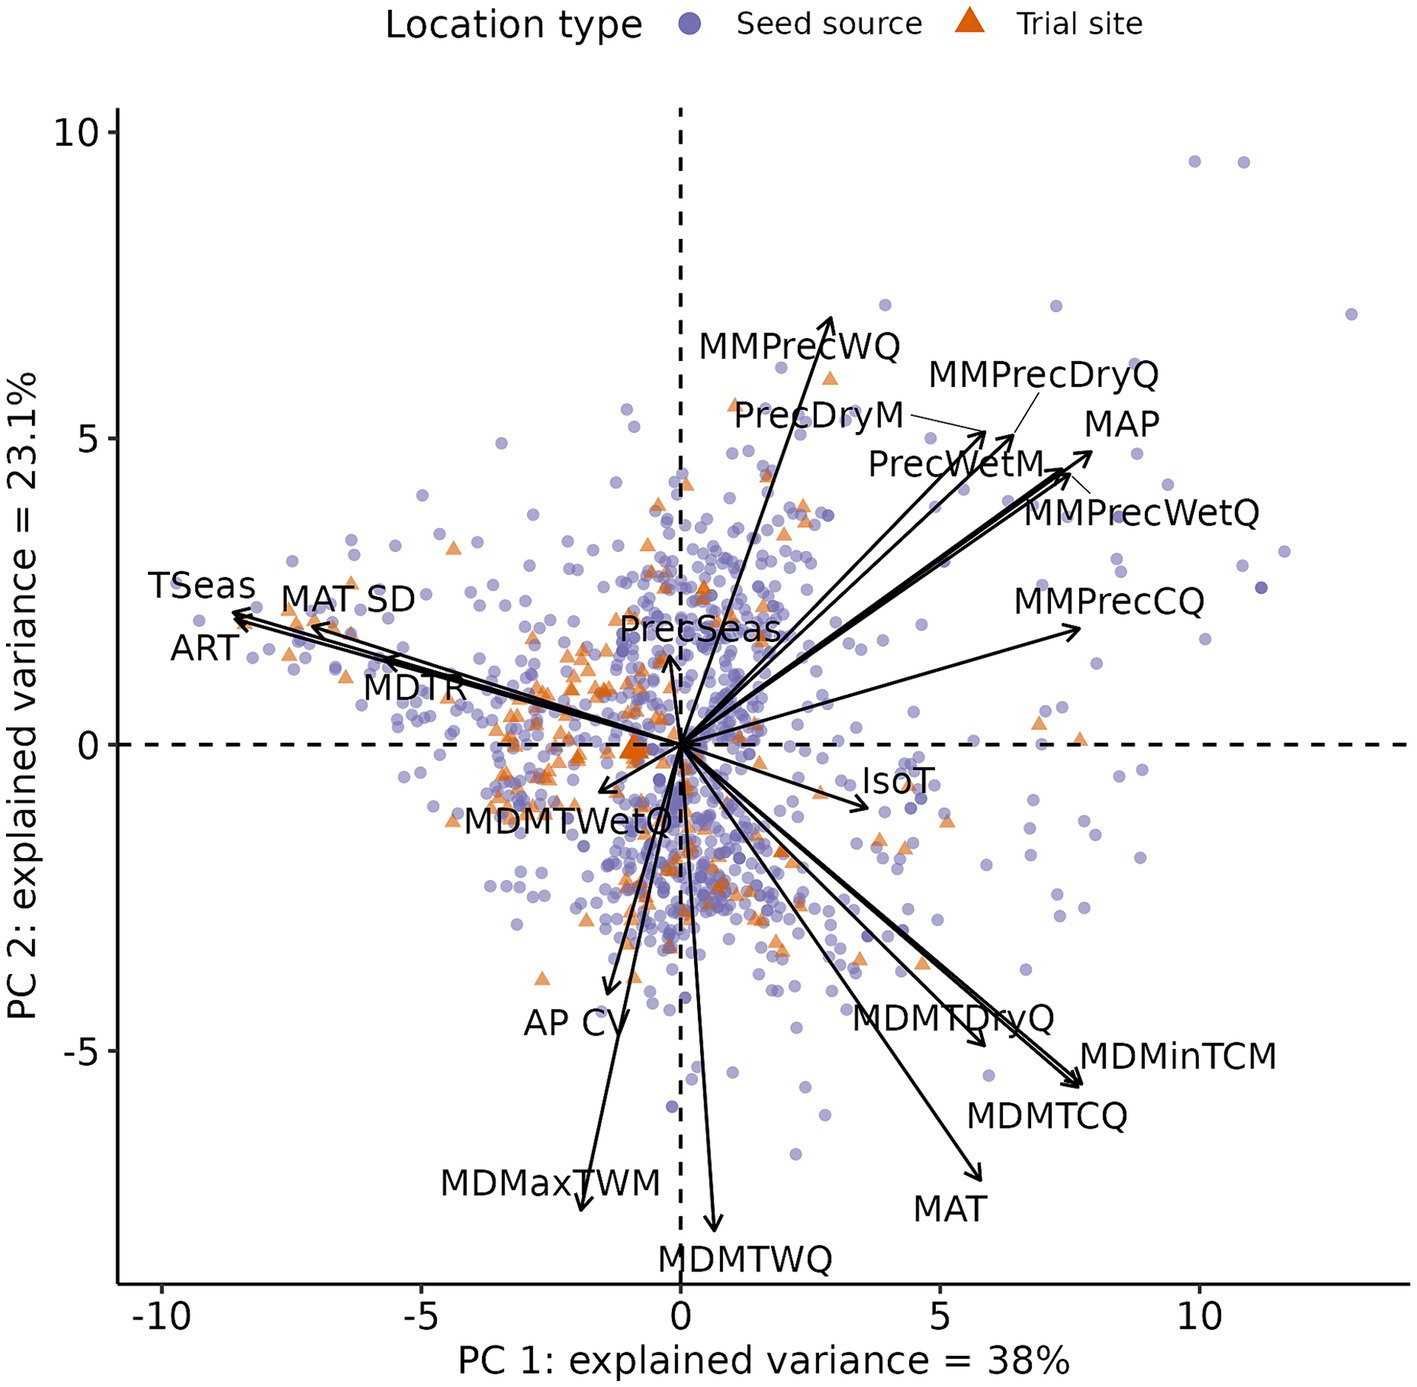
Figure 3. Graphical summary of the principal component analysis. The arrows show the loadings of each climate variable along the first two Principal Component axes. The points represent each seed source and trial site in the PC climate space. Each PC axis is labeled with the respective amount of variance explained in the original dataset. See Supplementary Table S1 for abbreviations.
2.5 Growth stability index
Since the experimental designs were not fully factorial, i.e., not all provenances were grown in all trial sites, it was necessary to calculate an index to enable the comparison of growth stability among species and among provenances. To this end, we utilize the width of the peak of each provenance’s climate response function, referring to it as Growth Stability Index (GSI) in subsequent analyses. Calculating such an index avoids the problem posed by the fact that the provenances were planted in unequal ranges of climate conditions, which would otherwise introduce differences associated with the ranges of growth performance, even in the absence of genetic effects.
We aggregated the individual-tree age-10 data obtained as described in section 2.3, by calculating the median height for each provenance x trial site combination, excluding provenances planted at fewer than four trial sites. We then fit response functions for each provenance, relating provenance HT10 (dependent variable) to trial site climate (independent variable). The Cauchy function, often used in genecology because it is bell-shaped and has parameters with a clear biological interpretation (i.e., width, height and position of the maximum, see Figure 4; Raymond and Lindgren, 1990; Lindgren and Ying, 2000; Thomson et al., 2009), was used to fit the response functions. Importantly, the c parameter represents the width of the fitted function at 80% of the maximum fitted response value. Another useful property of the c parameter is that it is independent of the growth rate, which allows to directly compare it across species and provenances (more precisely, the c parameter is invariant to multiplication of the response values by a constant number). Two response functions were fitted for each provenance – one for each of PC 1 and PC 2.
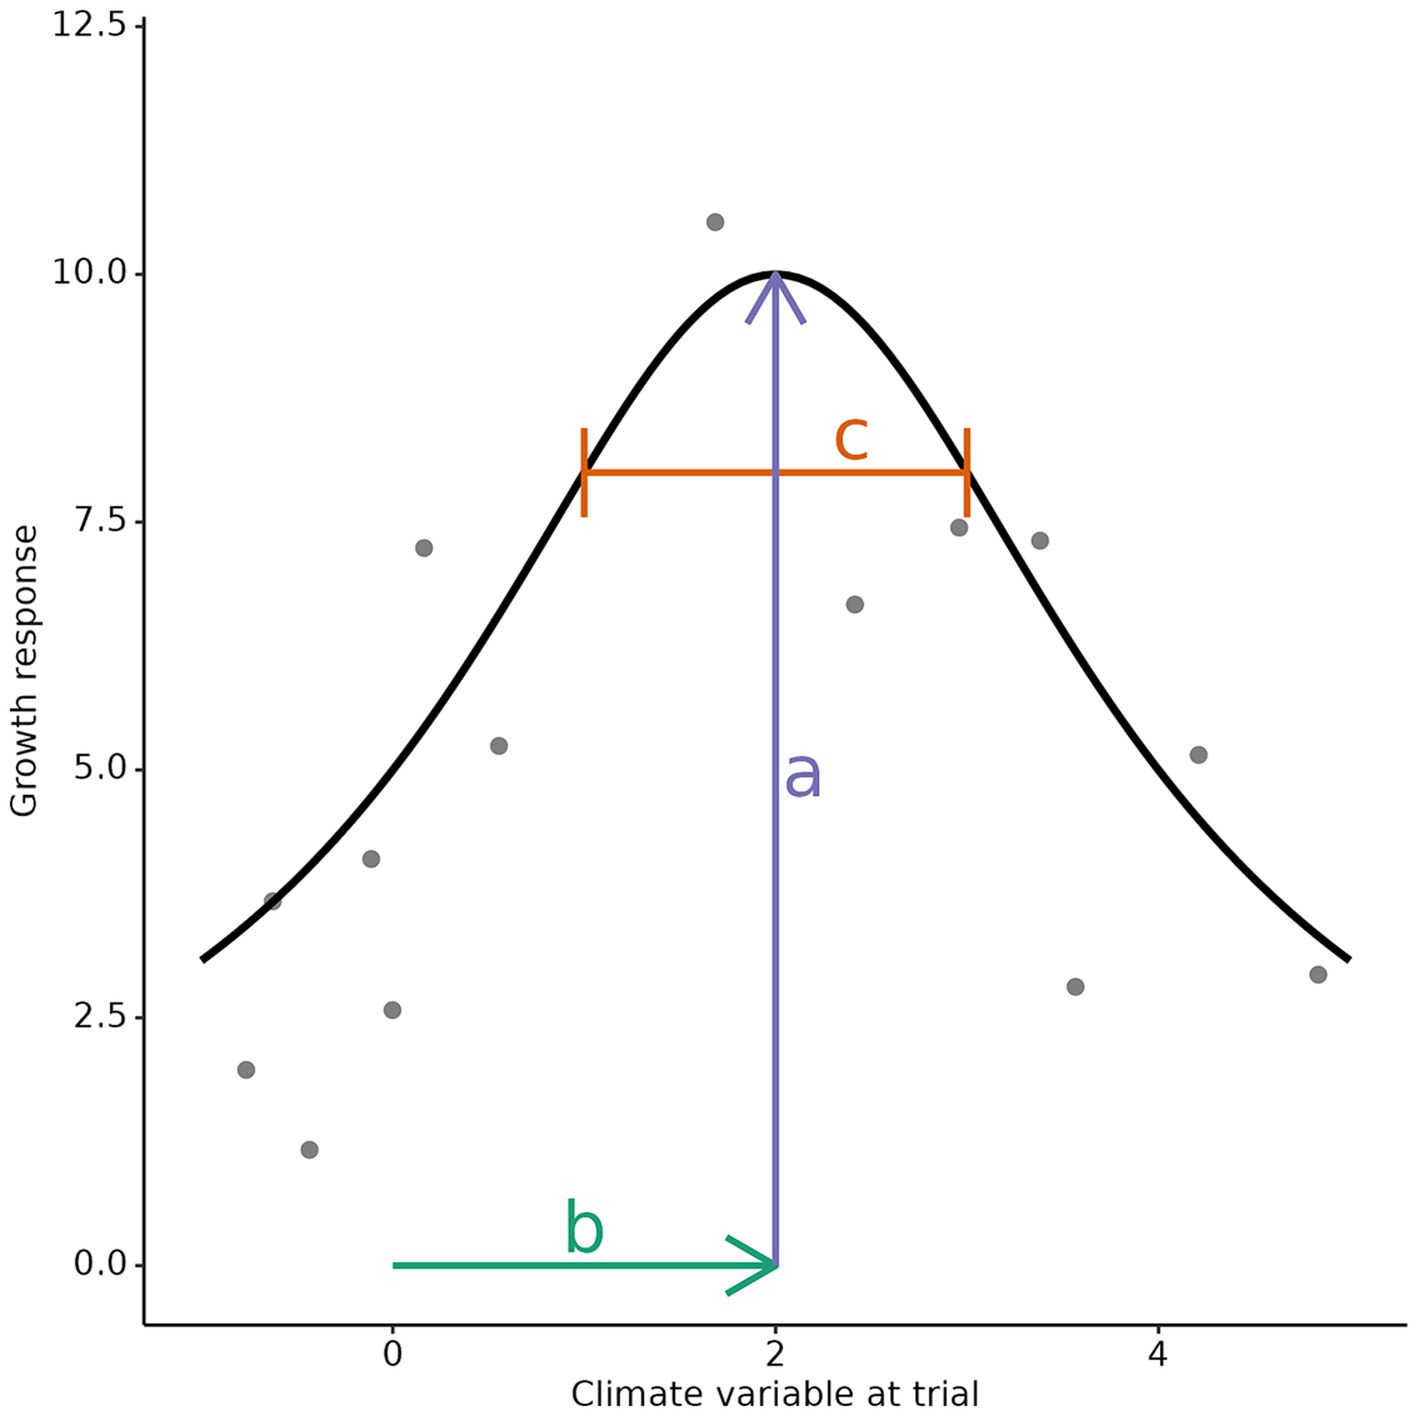
Figure 4. Example of Cauchy response function, fitted on simulated data. The provenance’s growth response is characterized by the three parameters shown: a represents the maximum growth, at optimal site climate; b represents the position of the optimal site climate; c represents the width of the response function’s peak, where growth performance is at least 80% of the maximum.
The response function model had the form:
Where:
is the maximum value of the curve.
is the location of the maximum (where ).
is the range, centered on , where .
The models were fitted using the function “gsl_nls(),” described in section 2.3.
We removed unsuccessful model fits, and regressions for which the estimated parameters were outside the following boundaries: . These boundaries were selected to remove unrealistic model fits, such as those predicting negative or extremely high tree heights, and to remove fits where the maximum was too far outside the range of available data.
In a similar way as described in section 2.3, we ensured the quality of the fitted models by calculating the RMSE and MAE for each provenance’s model, and aggregating them at the species × PC level (Table 3), calculating their mean and standard deviation separately for each combination of species and PC. The mean model error was higher, with a maximum of 36% relative to the mean predicted HT10 for PC 2 in P. engelmannii. Nonetheless, a linear regression between the values predicted by the models and the observed data yielded in most cases high r2 values (only one under 0.9), and highly significant regressions. We observed the presence of some non-linearity in the predicted x observed plots. As explained above in section 2.3, we removed models which had a high proportion of residuals outside a range of 2 standard deviations from the mean residual.
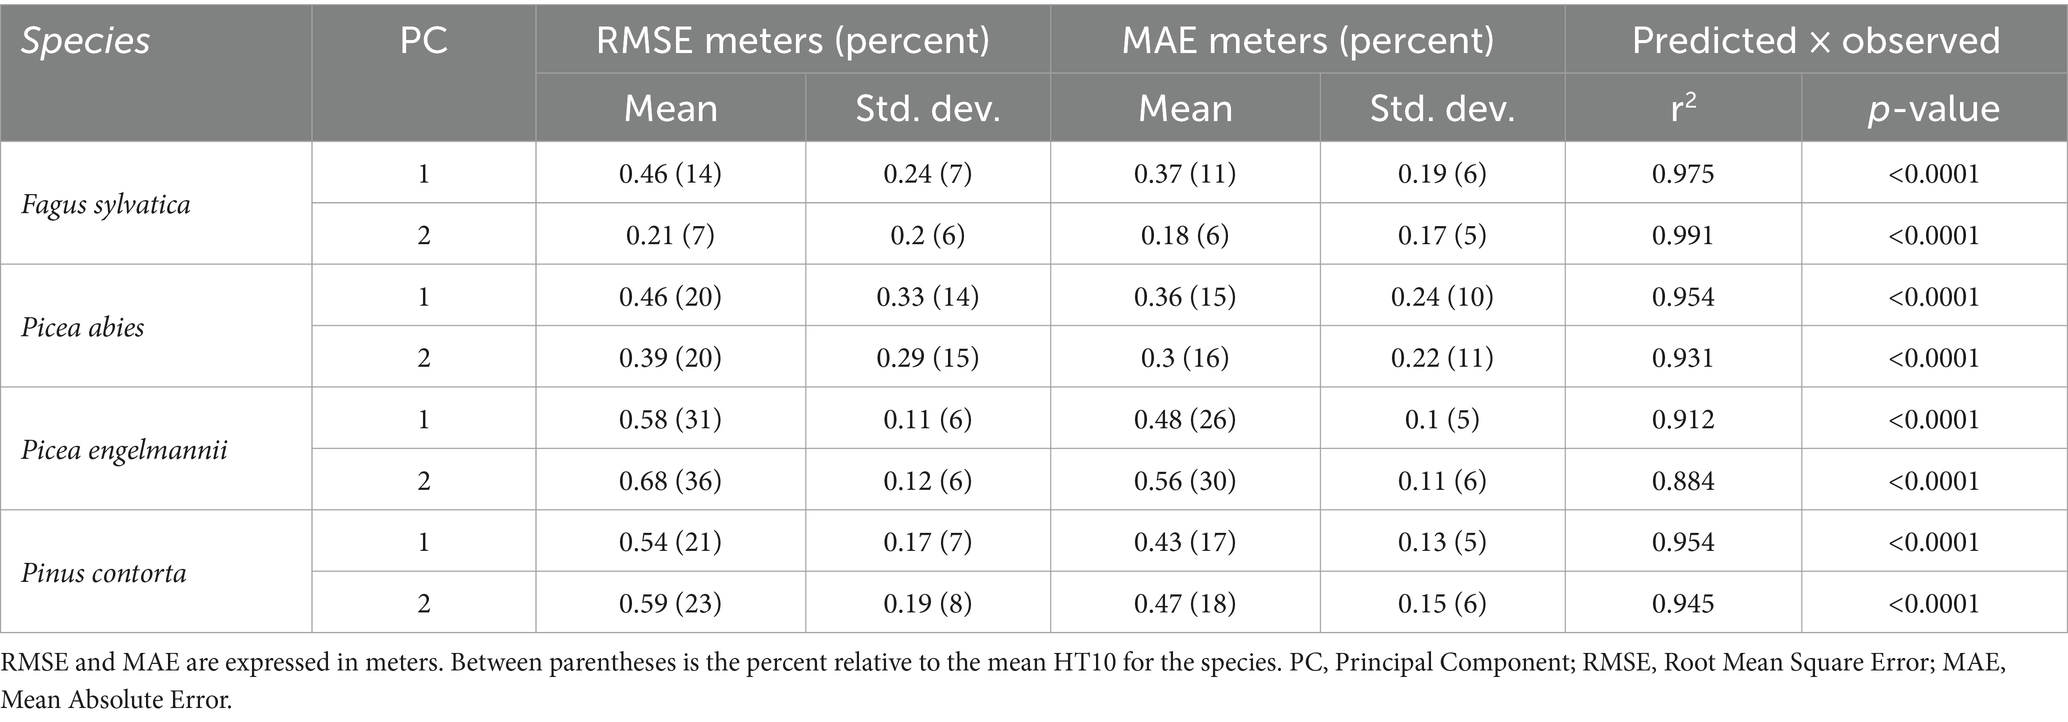
Table 3. Summary of errors and goodness of fit for the Cauchy growth response models.
Since the response functions use the climate at the trial site as the predictor variable, a broader peak implies that there is a wider range of climates where the provenance performs close to the maximum. For this reason, we extracted the c parameter from the fitted functions, to use as a quantifier of the growth stability (hereafter, Growth Stability Index—GSI) of each provenance. As specified above, a separate GSI was calculated for each of the climate variables. When writing about the GSI calculated for a specific climate variable, we refer to it as GSIvariable (e.g., GSIPC 1).
2.5.1 GSI—species relationship
We tested for differences in GSI among species for each of the climate variables by fitting a full linear mixed effects model including: GSI as response variable; species and PC (with an interaction term) as fixed effect predictors; and provenance as random effect predictor. Additionally, the full model included a dependency of the scale, skewness and kurtosis parameters on the species x climate variable combination.
The model was fitted using the function “gamlss()” from the “gamlss” package, using the “BCPEo” (Box-Cox Power Exponential) error family, employing a log-link for the response variable (Rigby and Stasinopoulos, 2004). This is appropriate for the GSI values, since they are strictly positive real numbers, and is useful because it reduces the skewness of the data and reduces the influence of outliers on the subsequent significance test.
We employed a systematic approach to model term selection, aiming to strike a balance between model complexity and goodness of fit. Our strategy involved iterative cycles of submodel creation, ranking based on the Akaike Information Criterion (AIC), and evaluation of model fit. Starting from the full model, we systematically generated submodels by excluding one term at a time. We ranked the submodels (including the starting model) according to AIC, and inspected them for goodness of fit using the “plot.gamlss()” and “wp()” functions from “gamlss” package. We chose the model with lowest AIC that still fitted the available data well without signs of overfitting. We then repeated this procedure, starting from the selected submodel. More details about the discarded submodels can be found in Supplementary Table S4.
After applying the iterative term removal process described above, we settled on a final model (r2 = 0.70) of the form:
where µ is the location parameter, is the scale parameter, is the skewness parameter, and is the kurtosis parameter.
We passed the fitted final model to the functions “emmeans()” and “cld.emmGrid()” from the package “emmeans” to calculate the p-values for the pairwise differences (alpha = 0.05) in mean GSI across different species, correcting the p-values for multiple testing with Tukey’s method.
2.5.2 GSI—growth relationship
We investigated a possible relationship between GSI and HT10 of the provenances with a linear mixed effect model. We used the “gamlss()” function to fit a full model including: HT10 as response variable; species, climate variable, and GSI (with all possible interaction terms) as fixed effect predictors; provenance and trial as random effect predictors.
After applying the iterative term removal process described in section 2.5.1, we settled on a final random intercepts model (r2 = 0.79) of the form:
where µ is the location parameter, is the scale parameter, is the skewness parameter, is the kurtosis parameter, and and are the mean and standard deviation of the random effect distribution.
2.5.3 GSI—seed source climate relationship
We investigated the relationship between climate at the seed source and GSI using a linear mixed effect model. For each PC, we regressed the GSI of each provenance on the PC value of the seed source.
We used the “gamlss()” function to fit a full linear mixed effects model including: GSI as response variable; species, PC, and PC value at seed source (with all possible interaction terms) as fixed effect predictors; provenance as random effect predictor. We once again employed the “BCPEo” error family with a log-link. Additionally, the full model included a dependency of the scale, skewness and kurtosis parameters on the species x climate variable combination.
After applying the iterative term removal process described in section 2.5.1, we settled on a final model (r2 = 0.79) of the form:
where µ is the location parameter, is the scale parameter, is the skewness parameter, and is the kurtosis parameter.
We passed the fitted final model to the functions “emtrends()” and “test()” from the package “emmeans,” to test if the regression slope was significantly different from zero (alpha = 0.05), across each combination of species and PC, and corrected the p-values for multiple tests with Sidak’s method.
3 Results
3.1 Growth stability index
3.1.1 Growth stability differs among species
Growth stability differed markedly among the studied species for all PCs (Figure 5; Supplementary Table S2), but nonetheless, species rankings of GSI values were remarkably consistent across PCs. In particular, P. engelmannii showed a significantly higher mean GSI than the other species for both PCs. This difference was large, as in some cases there was an almost 8-fold difference between the species (e.g., difference between P. engelmannii and P. abies in GSIPC 1). Pinus contorta showed the second-highest growth stability; F. sylvatica and P. abies both showed the smallest GSI.
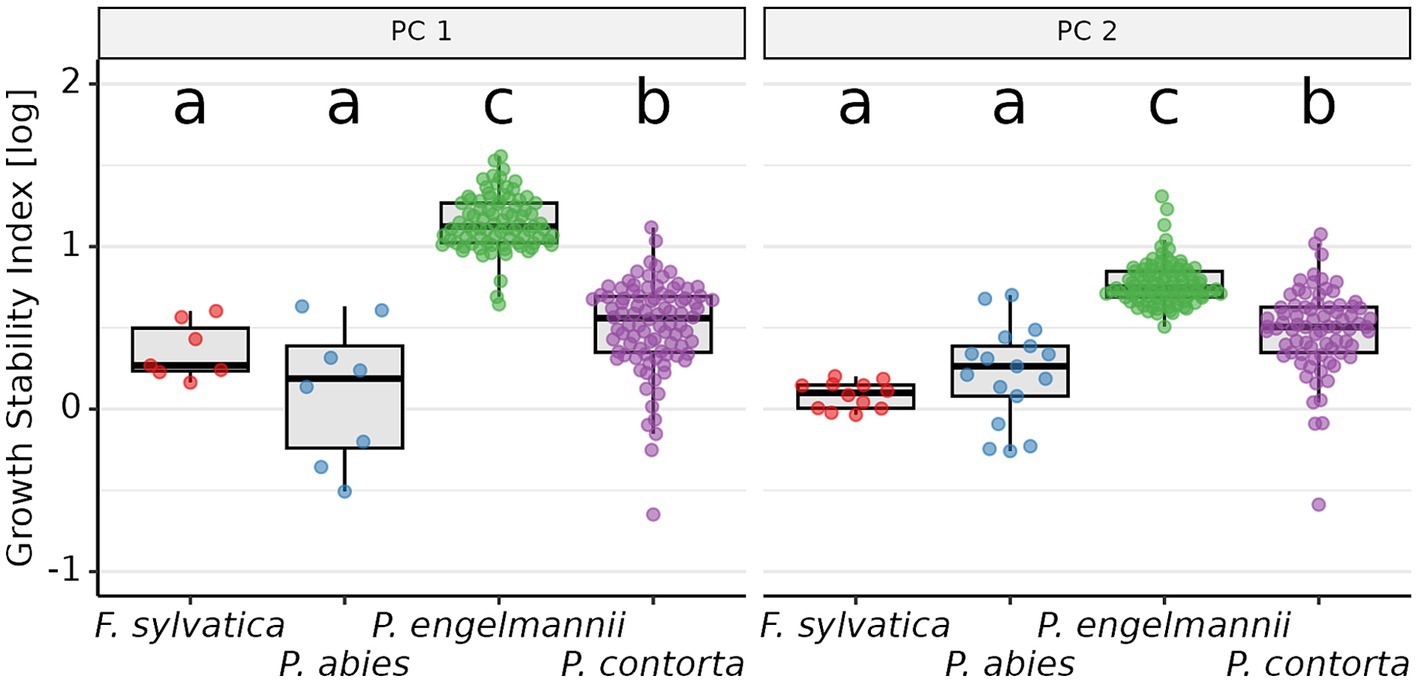
Figure 5. Inter-specific differences in growth stability (GSI). Each point corresponds to the GSI for one provenance, overlaid on the corresponding box-plots for each species (median, first and third quartiles, last point less distant than 1.5 times the inter-quartile-range). The GSI values were log10-transformed. Data-points have been jittered for clarity, using the function “geom_quasirandom()” from package “ggbeeswarm.” Species sharing a lower-case letter do not differ significantly in their mean GSI. PC 1, Principal Component 1; PC 2, Principal Component 2.
3.1.2 Growth stability is not related with growth performance
GSI and growth performance were not significantly related, as indicated by the absence of GSI as an explanatory variable in the final model, which corrected for trial site effects in its mixed effect structure. Likewise, climate at seed source did not affect growth performance consistently across all species and provenances. The final model, which included just the trial random effect, still had a relatively high r2 value (r2 = 0.79). In summary, growth performance depended strongly on the specific conditions of the trial sites, but not on GSI or source climates for the four studied species. In fact, it was possible to observe in the dataset all combination of growth stability and growth performance (Figure 6). For example, P. engelmannii provenance “745” had a stable, but low, growth performance; provenance “693” showed a relatively low growth performance at optimal climate, and a high sensitivity to variations from this optimum; provenance “759” had high growth in optimal conditions, but was also sensitive to changes in climate; while provenance “713” showed good growth performance across a wide range of climate conditions (Figure 7).
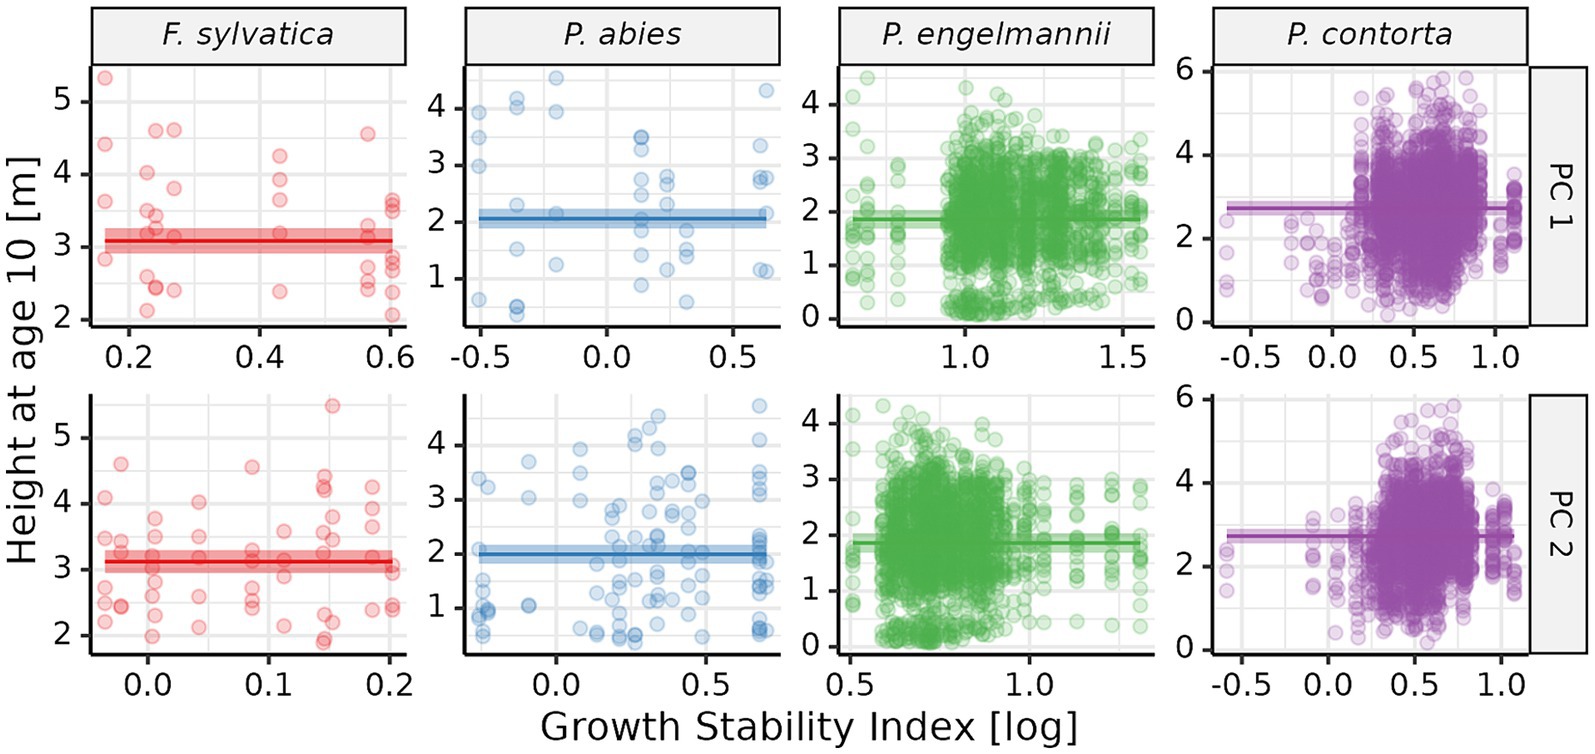
Figure 6. Relationship between height at age 10 (HT10) and growth stability (GSI). Each point corresponds to one provenance × trial site combination. The GSI values were log10-transformed. Lines representing the regression between GSI and the corresponding climate variable are overlaid on the raw data. Only fixed effects are shown (i.e., no trial random effect). The shaded bands correspond to the 95% confidence interval of the regression. PC 1, Principal Component 1; PC 2, Principal Component 2.
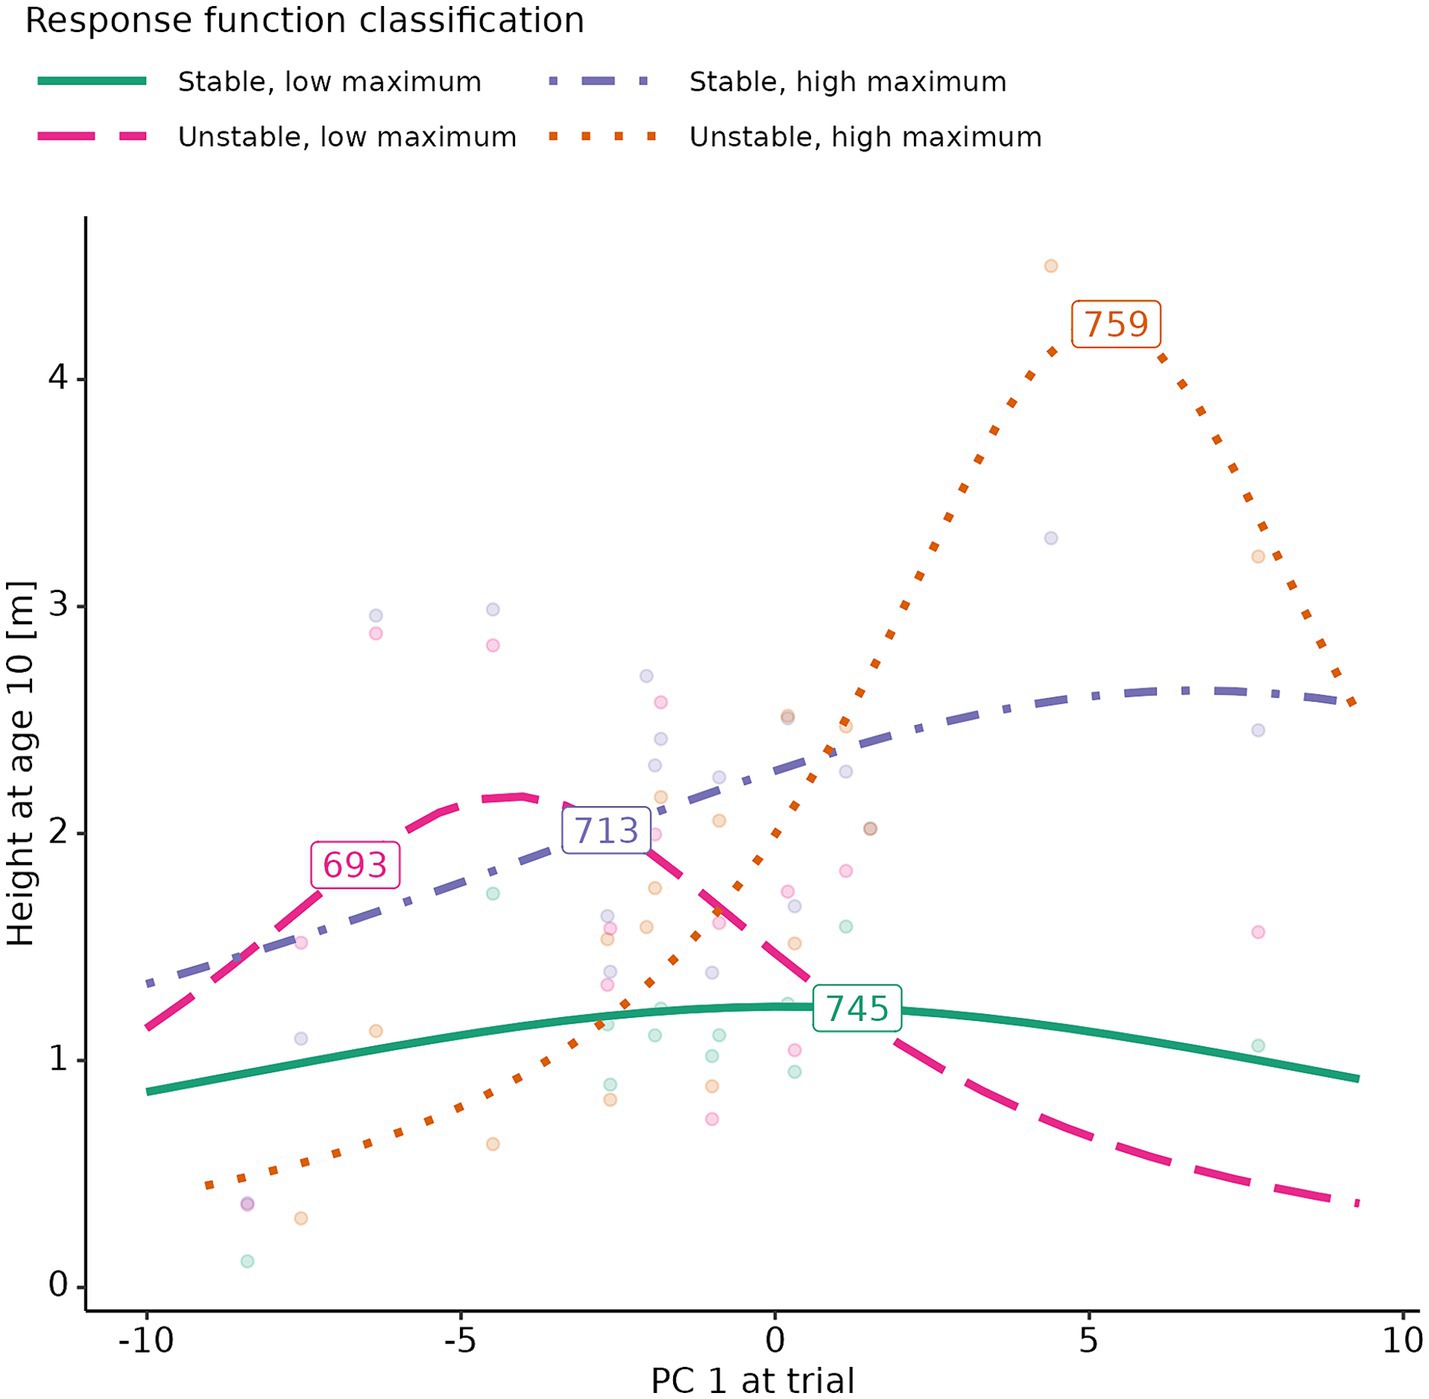
Figure 7. Example growth response functions for four Picea engelmannii provenances. Fitted Cauchy response functions are superimposed on the raw data-points. The functions are labeled with the corresponding provenance identification code. PC 1, Principal Component 1.
3.1.3 Growth stability is linked to source climate
Growth stability was significantly related with climate at the seed source in two of the four studied species (Figure 8; Supplementary Table S3). We observed a highly significant inverse relationship between PC 1 at seed source and GSI in P. engelmannii. This implies that provenances from seed sources which are drier, with colder winters, and with more variable temperatures (both within years and across years) possessed higher growth stability. Missing coordinates for several provenances resulted in fewer data-points for F. sylvatica and P. abies compared to the GSI – species regression (Figure 5). The scarcity of data-points may have contributed to the absence of significant regressions for these two species.
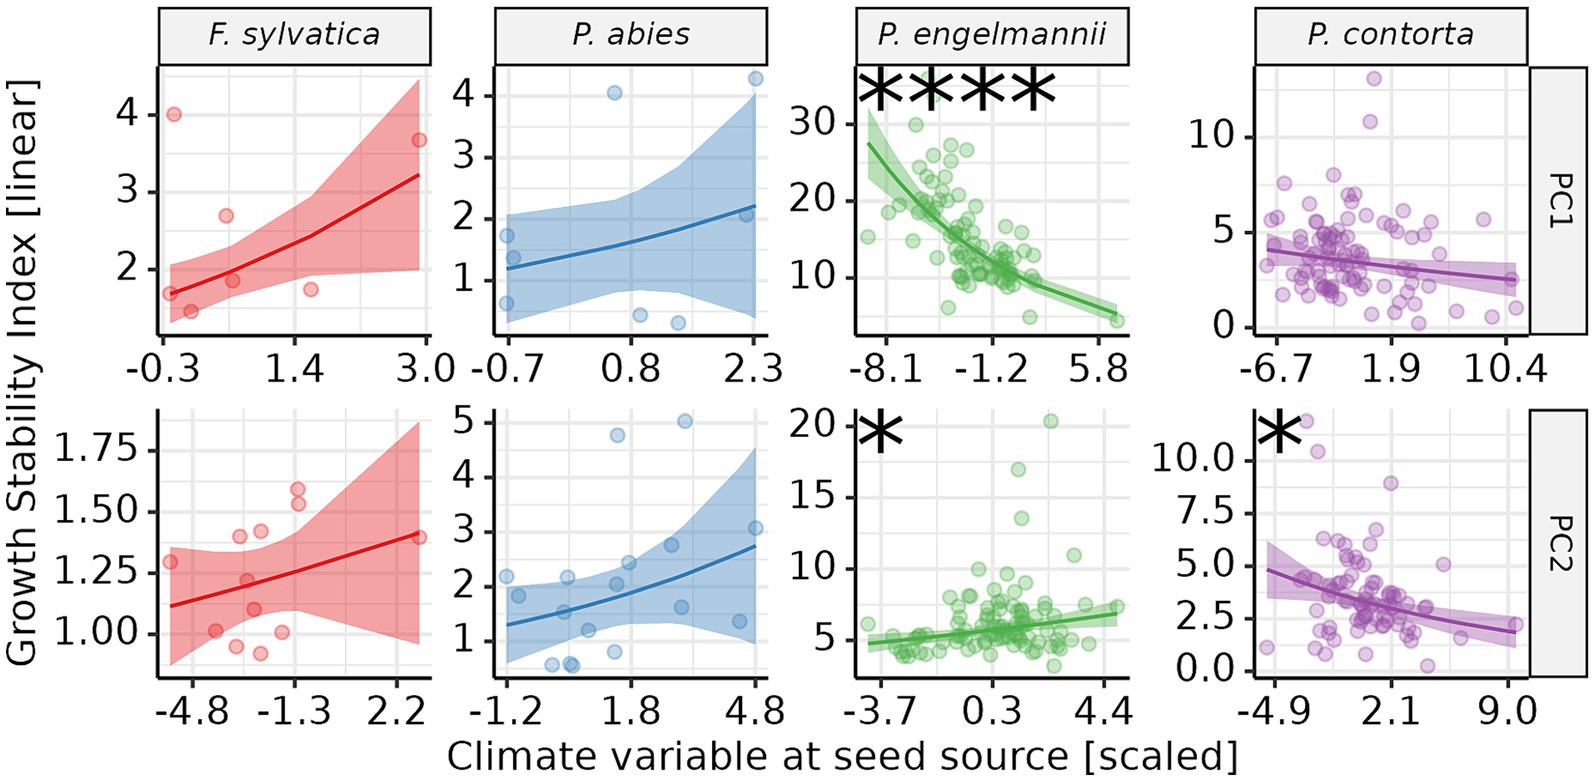
Figure 8. Relationship between growth stability (GSI) and climate at the seed source of the provenances. Each point corresponds to the GSI for one provenance. GSI values are on a linear scale. Lines overlaid on the raw data represent the regression between GSI and the corresponding PC. Shaded bands correspond to the 95% confidence interval of the regression. Asterisks indicate the significance level of the regression: empty = p > 0.05; *p < 0.05; **p < 0.01; ***p < 0.001; ****p < 0.0001. PC 1, Principal Component 1; PC 2, Principal Component 2.
On the other hand, the direction of the relationship between PC 2 and GSI was not consistent across species, as it was positive for P. engelmannii and negative for P. contorta. This indicates that provenances of P. engelmannii originating from colder sources, and with colder and wetter summers have higher growth stability. The situation seems to be the opposite in regards to P. contorta: higher levels of GSI are found in provenances from seed sources which are warmer in general, and in particular drier and warmer in summer.
4 Discussion
Growth stability has been widely studied and applied in the development of crop varieties in agriculture and seed orchard populations in forestry (Li et al., 2017). However, for most species and jurisdictions where reforestation is achieved with natural stand populations, selection of stable provenances has received little discussion, particularly as a climate change adaptation strategy. Prioritizing stable species and provenances for reforestation or afforestation is readily accomplished using existing provenance trial data, and is compatible with other strategies such as assisted migration (Pedlar et al., 2012) and increasing species and seedlot diversity (Hof et al., 2017; Looney et al., 2023). Furthermore, the use of the most stable species and provenances should not impact reforestation costs where a diversity of seed source options exists.
Growth stability differed substantially among the four studied species, corroborating previous reports of species differences in phenotypic plasticity (Gianoli and Valladares, 2012; Stotz et al., 2021), performance stability (Sultan, 2001) and, more generally, niche breadth as quantified for instance by species distribution models (Thomas et al., 2004). Nonetheless, the absolute differences in growth stability among the four species, which all show broad climate niches under which they become dominant, are remarkable. In fact, median GSI values of the four species differed by a factor of as much as eight. The consistency in the ranking of the species across climate variables suggests that the observed differences in growth stability might be due to intrinsic properties of the species, which carry over in a consistent way across different climate variables. In our data, species covering a broader climate range (P. contorta and P. engelmannii, Figure 2) also showed a higher growth stability. This observation can be linked to the basic ecological assumption of narrow niche width in specialist species vs. wide niche in generalist species (Ma and Levin, 2006), where generalists that occupy more heterogeneous environments also show higher adaptive plasticity (Sultan, 2001; Griffith and Sultan, 2012).
Growth stability also varied strongly among provenances within all four studied species. Interestingly, no association between growth stability and growth performance was observed (Figures 6, 7), with the variation in growth performance in the dataset being explained well with just the effect of the trial sites. For basic research, this finding supports the view that there is no consistent pattern between plasticity and performance, i.e., plasticity can be adaptive, maladaptive, or neutral (Nicotra et al., 2010; Kreyling et al., 2019). This multitude of potential links is probably due to evolutionary costs and limits of phenotypic plasticity (Van Kleunen and Fischer, 2005). This finding is even more interesting for forest management, though, as it suggests that there are certain provenances that combine high growth performance with high growth stability, i.e., the ability to perform well under a wider range of climate conditions. Identifying these provenances seems a promising opportunity in the face of continued rapid climate change and uncertainty in local climate projections.
The fit of response functions is commonly weak where climate is the sole predictor variable (O’Neill et al., 2007), as in the present study. Nonetheless, that we observed significant relationships between GSI and several predictor variables (Figure 8) attests to the extent to which climate drives the evolution of plasticity. Even so, accounting for non-climatic trial site factors that influence growth was found to strengthen response functions (Ford et al., 2017; Hill and Ex, 2020) and models of species distribution (Rehfeldt et al., 2015), site productivity (Fiandino et al., 2020) and floral composition (Vennetier et al., 2008) and could potentially strengthen these genecological models. For example, in Norway spruce, soil conditions were found to have a similar effect on growth as climate (Chakraborty et al., 2019).
In general, we did not find a consistent pattern in the relationship between climate at seed source and growth stability across the species. The scarcity of data-points for F. sylvatica and P. abies may be one of the causes for the absence of more significant regressions. Having trial locations covering the full climate range of the species (and even beyond it) would probably result in more successful Cauchy model fits, and also in a better understanding of limits of acclimation. The absence of consistent patterns between climate and growth stability across the species, however, could also be due to the absence of selection for different levels of phenotypic plasticity, for example due to similar climate variability across the seed sources, as was concluded regarding a soil specialist herb (Matesanz et al., 2020). The significant relationships we found for P. engelmannii imply that provenances from the colder, more continental extremes of the species’ climate distribution grow well across a broader range of climate conditions. This may reflect an evolutionary trade-off between plasticity and specialization for milder climates. From the forest planning point of view, this insight might be valuable when looking for provenances to test: more stable provenances are more likely to be found closer to the colder, continental edge of the species’ climate distribution, whereas assisted migration frameworks currently focus on the opposite, targeting warmer source climates based on the presumption that they would be pre-adapted to continuous climate warming (Williams and Dumroese, 2013). On the other hand, the inverse relationship between GSI and PC 2 we found for P. contorta seems to imply that such a strategy would be a good fit for this species: selecting provenances from warmer and drier seed sources would also indirectly select for climate-stable provenances.
We also did not find a strong pattern in the relationship between inter-annual climate variability at seed source and growth stability. Firstly, the locations studied differed relatively little in their precipitation variability, and as a consequence the AP CV climate variable contributed very little to the two PCs in exam. As for the other measure of inter-annual climate variability, MAT SD, it contributed mostly to PC 1, where it was clustered with ART and TSeas, two measures of within-year temperature variability. For this reason, we cannot separate the effects of adaptation to inter-annual temperature variability from an adaptation to seasonal variations in temperature. Nonetheless, in the case of P. engelmannii, the inverse relationship between GSI and PC 1 suggests that provenances from more variable climates are indeed more stable in respect to changes in trial site temperature, in agreement with the expectation that highly variable environments may select for increased phenotypic plasticity (Vázquez et al., 2017).
Overall, it appears that, in our data, differences in long-term climate conditions are more important for predicting differences in growth stability, compared to differences in climate variability. This finding is surprising as several studies suggest that climate variability would select for increased phenotypic plasticity (Alpert and Simms, 2002; Lázaro-Nogal et al., 2015; Carvajal et al., 2017; Vázquez et al., 2017). Meta-analyses differentiating between different aspects of plasticity, however, found a positive link between climate variability and plasticity only for allocation, but not for leaf traits, physiological traits, and, corresponding with our results, growth (Stotz et al., 2021).
In conclusion, we observed among-species and among-provenance differences in their capacity to grow well across a wide climate range, and that these differences in some cases can be explained by the climate conditions at the seed source. The direction of this relationship, however, depends on the species considered. We did not find any relationship between growth performance and growth stability, implying that provenances with both high performance and high growth stability to climate change exist. The results presented here give valuable insights on the growth stability of some important tree species, and point to a new perspective under which to study climate change adaptation in planted forests. They suggest the importance of incorporating insights from the study of growth stability in the selection of species and provenances for forestry interventions, with the objective of increasing forests’ resilience to the uncertainties posed by climate change.
Data availability statement
The raw data supporting the conclusions of this article will be made available by the authors, without undue reservation.
Author contributions
AF: Conceptualization, Formal analysis, Methodology, Software, Validation, Visualization, Writing – original draft, Writing – review & editing. VB: Formal analysis, Methodology, Writing – review & editing. DC: Data curation, Writing – review & editing. GO'N: Data curation, Methodology, Writing – review & editing. SS: Data curation, Writing – review & editing. JK: Conceptualization, Funding acquisition, Methodology, Project administration, Supervision, Writing – review & editing.
Funding
The author(s) declare that financial support was received for the research, authorship, and/or publication of this article. This research was funded by the German Federal Ministry of Food and Agriculture through the Fachagentur für Nachwachsende Rohstoffe within the framework “Waldklimafonds,” project EVA (FKZ 2220WK08C4).
Acknowledgments
The authors gratefully acknowledge Barry Jaquish and Val Ashley, of the British Columbia Ministry of Forests, who were instrumental in the design, establishment, maintenance, and assessment of the interior spruce genecology/climate change trial, and the many British Columbia Ministry of Forests staff who diligently maintained the Illingworth lodgepole pine provenance trial for four decades, in particular, Nicholas Ukrainetz who has managed the trial for the last 14 years.
Conflict of interest
The authors declare that the research was conducted in the absence of any commercial or financial relationships that could be construed as a potential conflict of interest.
Publisher’s note
All claims expressed in this article are solely those of the authors and do not necessarily represent those of their affiliated organizations, or those of the publisher, the editors and the reviewers. Any product that may be evaluated in this article, or claim that may be made by its manufacturer, is not guaranteed or endorsed by the publisher.
Supplementary material
The Supplementary material for this article can be found online at: https://www.frontiersin.org/articles/10.3389/ffgc.2024.1422165/full#supplementary-material
References
Aitken, S. N., Yeaman, S., Holliday, J. A., Wang, T., and Curtis-McLane, S. (2008). Adaptation, migration or extirpation: climate change outcomes for tree populations. Evol. Appl. 1, 95–111. doi: 10.1111/j.1752-4571.2007.00013.x
Alberto, F. J., Aitken, S. N., Alía, R., González-Martínez, S. C., Hänninen, H., Kremer, A., et al. (2013). Potential for evolutionary responses to climate change – evidence from tree populations. Glob. Chang. Biol. 19, 1645–1661. doi: 10.1111/gcb.12181
Alpert, P., and Simms, E. L. (2002). The relative advantages of plasticity and fixity in different environments: when is it good for a plant to adjust? Evol. Ecol. 16, 285–297. doi: 10.1023/A:1019684612767
Alvarez, J. A., Cortizo, S. C., and Gyenge, J. E. (2020). Yield stability and phenotypic plasticity of Populus spp. clones growing in environmental gradients: I-yield stability under field conditions. For. Ecol. Manage. 463:117995. doi: 10.1016/j.foreco.2020.117995
Arnaud-Haond, S., Teixeira, S., Massa, S. I., Billot, C., Saenger, P., Coupland, G., et al. (2006). Genetic structure at range edge: low diversity and high inbreeding in southeast Asian mangrove (Avicennia marina) populations. Mol. Ecol. 15, 3515–3525. doi: 10.1111/j.1365-294X.2006.02997.x
Baker, H. G. (1974). The evolution of weeds. Annu. Rev. Ecol. Syst. 5, 1–24. doi: 10.1146/annurev.es.05.110174.000245
Carvajal, D. E., Loayza, A. P., Rios, R. S., Gianoli, E., and Squeo, F. A. (2017). Population variation in drought-resistance strategies in a desert shrub along an aridity gradient: interplay between phenotypic plasticity and ecotypic differentiation. Perspect Plant Ecol Evol Syst 29, 12–19. doi: 10.1016/j.ppees.2017.10.001
Chai, T., and Draxler, R. R. (2014). Root mean square error (RMSE) or mean absolute error (MAE)? – arguments against avoiding RMSE in the literature. Geosci. Model Dev. 7, 1247–1250. doi: 10.5194/gmd-7-1247-2014
Chakraborty, D., Jandl, R., Kapeller, S., and Schueler, S. (2019). Disentangling the role of climate and soil on tree growth and its interaction with seed origin. Sci. Total Environ. 654, 393–401. doi: 10.1016/j.scitotenv.2018.11.093
Chau, J. (2023). Gslnls: GSL nonlinear least-squares fitting. Available at: https://CRAN.R-project.org/package=gslnls
Comendant, T., Strittholt, J., Frost, P., Ward, B. C., Bachelet, D. M., and Osborne-Gowey, J. (2009). Data Basin: Expanding Access to Conservation Data, Tools, and People. 2009, ED41D-0552. Available at: https://ui.adsabs.harvard.edu/abs/2009AGUFMED41D0552C
Dunn, O. J., and Clark, V. A. (2009). Basic statistics: A primer for the biomedical sciences : Hoboken, New Jersey, USA: John Wiley & Sons, 59.
Engel, M., Mette, T., Falk, W., Poschenrieder, W., Fridman, J., and Skudnik, M. (2023). Modelling dominant tree heights of Fagus sylvatica L. using function-on-scalar regression based on Forest inventory data. Forests 14:304. doi: 10.3390/f14020304
Fang, J., and Lechowicz, M. J. (2006). Climatic limits for the present distribution of beech (Fagus L.) species in the world. J. Biogeogr. 33, 1804–1819. doi: 10.1111/j.1365-2699.2006.01533.x
Fiandino, S., Plevich, J., Tarico, J., Utello, M., Demaestri, M., and Gyenge, J. (2020). Modeling forest site productivity using climate data and topographic imagery in Pinus elliottii plantations of Central Argentina. Ann. For. Sci. 77, 1–9. doi: 10.1007/s13595-020-01006-3
Firke, S. (2023). Janitor: simple tools for examining and cleaning dirty data. Available at: https://CRAN.R-project.org/package=janitor
Ford, K. R., Breckheimer, I. K., Franklin, J. F., Freund, J. A., Kroiss, S. J., Larson, A. J., et al. (2017). Competition alters tree growth responses to climate at individual and stand scales. Can. J. For. Res. 47, 53–62. doi: 10.1139/cjfr-2016-0188
Gárate-Escamilla, H., Hampe, A., Vizcaíno-Palomar, N., Robson, T. M., and Benito Garzón, M. (2019). Range-wide variation in local adaptation and phenotypic plasticity of fitness-related traits in Fagus sylvatica and their implications under climate change. Glob. Ecol. Biogeogr. 28, 1336–1350. doi: 10.1111/geb.12936
Gessler, A., Keitel, C., Kreuzwieser, J., Matyssek, R., Seiler, W., and Rennenberg, H. (2006). Potential risks for European beech (Fagus sylvatica L.) in a changing climate. Trees 21, 1–11. doi: 10.1007/s00468-006-0107-x
Ghalambor, C. K., McKAY, J. K., Carroll, S. P., and Reznick, D. N. (2007). Adaptive versus non-adaptive phenotypic plasticity and the potential for contemporary adaptation in new environments. Funct. Ecol. 21, 394–407. doi: 10.1111/j.1365-2435.2007.01283.x
Gianoli, E., and Valladares, F. (2012). Studying phenotypic plasticity: the advantages of a broad approach. Biol. J. Linn. Soc. 105, 1–7. doi: 10.1111/j.1095-8312.2011.01793.x
Griffith, T., and Sultan, S. E. (2012). Field-based insights to the evolution of specialization: plasticity and fitness across habitats in a specialist/generalist species pair. Ecol. Evol. 2, 778–791. doi: 10.1002/ece3.202
Grubinger, S., Coops, N. C., and O’Neill, G. A. (2023). Picturing local adaptation: spectral and structural traits from drone remote sensing reveal clinal responses to climate transfer in common-garden trials of interior spruce (Picea engelmannii × glauca). Glob. Chang. Biol. 29, 4842–4860. doi: 10.1111/gcb.16855
Hamner, B., and Frasco, M. (2018). Metrics: Evaluation Metrics for Machine Learning. Available at: https://CRAN.R-project.org/package=Metrics
Hendry, A. P. (2016). Key questions on the role of phenotypic plasticity in eco-evolutionary dynamics. J. Hered. 107, 25–41. doi: 10.1093/jhered/esv060
Hernangómez, D. (2023). Using the tidyverse with terra objects: the tidyterra package. Journal of Open Source Software. 8, 5751. doi: 10.21105/joss.05751
Hickernell, F. J., and Yuan, Y. (1997). A simple multistart algorithm for global optimization. OR Transactions 1, 1–11.
Hijmans, R. J. (2023). Terra: spatial data analysis. Available at: https://CRAN.R-project.org/package=terra
Hill, E. M., and Ex, S. (2020). Microsite conditions in a low-elevation Engelmann spruce forest favor ponderosa pine establishment during drought conditions. For. Ecol. Manage. 463:118037. doi: 10.1016/j.foreco.2020.118037
Hof, A. R., Dymond, C. C., and Mladenoff, D. J. (2017). Climate change mitigation through adaptation: the effectiveness of forest diversification by novel tree planting regimes. Ecosphere 8:e01981. doi: 10.1002/ecs2.1981
IPCC . (2023). Climate change 2023: synthesis report. In: Contribution of Working Groups I, II and III to the Sixth Assessment Report of the Intergovernmental Panel on Climate Change.
Jiang, F., Cadotte, M. W., and Jin, G. (2022). Size- and environment-driven seedling survival and growth are mediated by leaf functional traits. Proc. R. Soc. B Biol. Sci. 289:20221400. doi: 10.1098/rspb.2022.1400
Kapeller, S., Lexer, M. J., Geburek, T., Hiebl, J., and Schueler, S. (2012). Intraspecific variation in climate response of Norway spruce in the eastern alpine range: selecting appropriate provenances for future climate. For. Ecol. Manage. 271, 46–57. doi: 10.1016/j.foreco.2012.01.039
Karger, D. N., Conrad, O., Böhner, J., Kawohl, T., Kreft, H., Soria-Auza, R. W., et al. (2017). Climatologies at high resolution for the earth’s land surface areas. Sci Data 4:170122. doi: 10.1038/sdata.2017.122
Karger, D. N., Schmatz, D. R., Dettling, G., and Zimmermann, N. E. (2020). High-resolution monthly precipitation and temperature time series from 2006 to 2100. Sci Data 7:248. doi: 10.1038/s41597-020-00587-y
Kassambara, A. (2023). Rstatix: pipe-friendly framework for basic statistical tests. Available at: https://CRAN.R-project.org/package=rstatix
Kramer, K., Degen, B., Buschbom, J., Hickler, T., Thuiller, W., Sykes, M. T., et al. (2010). Modelling exploration of the future of European beech (Fagus sylvatica L.) under climate change—range, abundance, genetic diversity and adaptive response. For. Ecol. Manage. 259, 2213–2222. doi: 10.1016/j.foreco.2009.12.023
Kreyling, J., Puechmaille, S. J., Malyshev, A. V., and Valladares, F. (2019). Phenotypic plasticity closely linked to climate at origin and resulting in increased mortality under warming and frost stress in a common grass. Ecol. Evol. 9, 1344–1352. doi: 10.1002/ece3.4848
Lázaro-Nogal, A., Matesanz, S., Godoy, A., Pérez-Trautman, F., Gianoli, E., and Valladares, F. (2015). Environmental heterogeneity leads to higher plasticity in dry-edge populations of a semi-arid Chilean shrub: insights into climate change responses. J. Ecol. 103, 338–350. doi: 10.1111/1365-2745.12372
Lê, S., Josse, J., and Husson, F. (2008). FactoMineR: a package for multivariate analysis. J. Stat. Softw. 25, 1–18. doi: 10.18637/jss.v025.i01
Leites, L., and Benito Garzón, M. (2023). Forest tree species adaptation to climate across biomes: building on the legacy of ecological genetics to anticipate responses to climate change. Glob. Chang. Biol. 29, 4711–4730. doi: 10.1111/gcb.16711
Lenth, R. V. (2023). Emmeans: estimated marginal means, aka least-squares means. Available at: https://CRAN.R-project.org/package=emmeans
Leuschner, C., and Ellenberg, H. (2017). Ecology of central European Forests: Vegetation Ecology of Central Europe, Volume I. Cham, Switzerland: Springer International Publishing.
Lever, J., Krzywinski, M., and Altman, N. (2017). Principal component analysis. Nat. Methods 14, 641–642. doi: 10.1038/nmeth.4346
Li, Y., Suontama, M., Burdon, R. D., and Dungey, H. S. (2017). Genotype by environment interactions in forest tree breeding: review of methodology and perspectives on research and application. Tree Genet. Genomes 13:60. doi: 10.1007/s11295-017-1144-x
Lindgren, D., and Ying, C. C. (2000). A model integrating seed source adaptation and seed use. New For. 20, 87–104. doi: 10.1023/A:1006708213824
Little, E. L. (1971). Atlas of United States trees. volume 1, Conifers and important hardwoods. Washington, D.C: U.S. Dept. of Agriculture, Forest Service.
Looney, C. E., Stewart, J. A. E., and Wood, K. E. A. (2023). Mixed-provenance plantings and climatic transfer-distance affect the early growth of knobcone-Monterey hybrid pine, a fire-resilient alternative for reforestation. New For. 55, 543–565. doi: 10.1007/s11056-023-09991-9
Lüdecke, D., Ben-Shachar, M. S., Patil, I., Waggoner, P., and Makowski, D. (2021). Performance: an R package for assessment, comparison and testing of statistical models. J Open Source Softw 6:3139. doi: 10.21105/joss.03139
Ma, J., and Levin, S. A. (2006). The evolution of resource adaptation: how generalist and specialist consumers evolve. Bull. Math. Biol. 68, 1111–1123. doi: 10.1007/s11538-006-9096-6
MacKenzie, W. H., and Mahony, C. R. (2021). An ecological approach to climate change-informed tree species selection for reforestation. For. Ecol. Manage. 481:118705. doi: 10.1016/j.foreco.2020.118705
Mägi, M., Semchenko, M., Kalamees, R., and Zobel, K. (2011). Limited phenotypic plasticity in range-edge populations: a comparison of co-occurring populations of two Agrimonia species with different geographical distributions. Plant Biol. (Stuttg.) 13, 177–184. doi: 10.1111/j.1438-8677.2010.00342.x
Matesanz, S., Ramos-Muñoz, M., Blanco-Sánchez, M., and Escudero, A. (2020). High differentiation in functional traits but similar phenotypic plasticity in populations of a soil specialist along a climatic gradient. Ann. Bot. 125, 969–980. doi: 10.1093/aob/mcaa020
Mauri, A., Strona, G., and San-Miguel-Ayanz, J. (2017). EU-Forest, a high-resolution tree occurrence dataset for Europe. Sci Data 4:160123. doi: 10.1038/sdata.2016.123
Moustakas, A., and Evans, M. R. (2015). Effects of growth rate, size, and light availability on tree survival across life stages: a demographic analysis accounting for missing values and small sample sizes. BMC Ecol. 15:6. doi: 10.1186/s12898-015-0038-8
Nather, J., and Holzer, K. (1979). Uber die Bedeutung und die Anlage von Kontrollflachen zur Prufung von anerkanntem Fichtenpflanzgut. Informationsdienst Forstliche Bundesversuchsanstalt, Vienna, Austria. 181.
Nicotra, A. B., Atkin, O. K., Bonser, S. P., Davidson, A. M., Finnegan, E. J., Mathesius, U., et al. (2010). Plant phenotypic plasticity in a changing climate. Trends Plant Sci. 15, 684–692. doi: 10.1016/j.tplants.2010.09.008
O’Neill, G. A., Hamann, A., and Wang, T. (2008). Accounting for population variation improves estimates of the impact of climate change on species’ growth and distribution. J. Appl. Ecol. 45, 1040–1049. doi: 10.1111/j.1365-2664.2008.01472.x
O’Neill, G. A., Nigh, G., Wang, T., and Ott, P. K. (2007). Growth response functions improved by accounting for nonclimatic site effects. Can. J. For. Res. 37, 2724–2730. doi: 10.1139/X07-100
O’Neill, G. A., Stoehr, M., and Jaquish, B. (2014). Quantifying safe seed transfer distance and impacts of tree breeding on adaptation. For. Ecol. Manage. 328, 122–130. doi: 10.1016/j.foreco.2014.05.039
Pedlar, J. H., McKenney, D. W., Aubin, I., Beardmore, T., Beaulieu, J., Iverson, L., et al. (2012). Placing forestry in the assisted migration debate. Bioscience 62, 835–842. doi: 10.1525/bio.2012.62.9.10
R Core Team . (2023). R: A language and environment for statistical computing. R Foundation for Statistical Computing. Available at: https://www.R-project.org/
Raymond, C. A., and Lindgren, D. (1990). Genetic flexibility—a model for determining the range of suitable environments for a seed source. Silvae Genetica, 39.
Rehfeldt, G. E. (1994). Adaptation of Picea engelmannii populations to the heterogeneous environments of the intermountain west. Can. J. Bot. 72, 1197–1208. doi: 10.1139/b94-146
Rehfeldt, G. E., Worrall, J. J., Marchetti, S. B., and Crookston, N. L. (2015). Adapting forest management to climate change using bioclimate models with topographic drivers. Forestry 88, 528–539. doi: 10.1093/forestry/cpv019
Richards, C. L., Bossdorf, O., Muth, N. Z., Gurevitch, J., and Pigliucci, M. (2006). Jack of all trades, master of some? On the role of phenotypic plasticity in plant invasions. Ecol. Lett. 9, 981–993. doi: 10.1111/j.1461-0248.2006.00950.x
Rigby, R. A., and Stasinopoulos, D. M. (2004). Smooth centile curves for skew and kurtotic data modelled using the box–cox power exponential distribution. Stat. Med. 23, 3053–3076. doi: 10.1002/sim.1861
Rigby, R. A., and Stasinopoulos, D. M. (2005). Generalized additive models for location, scale and shape,(with discussion). Appl. Stat. 54, 507–554. doi: 10.1111/j.1467-9876.2005.00510.x
Robinson, D., Hayes, A., and Couch, S. (2023). Broom: convert statistical objects into tidy Tibbles. Available at: https://CRAN.R-project.org/package=broom
Robson, T. M., and Garzón, M. B.BeechCOSTe52 database consortium (2018). Phenotypic trait variation measured on European genetic trials of Fagus sylvatica L. Sci Data 5:180149. doi: 10.1038/sdata.2018.149
Rowlingson, B., and Diggle, P. (2024). Splancs: spatial and space-time point pattern analysis. Available at: https://CRAN.R-project.org/package=splancs
Saltré, F., Duputié, A., Gaucherel, C., and Chuine, I. (2015). How climate, migration ability and habitat fragmentation affect the projected future distribution of European beech. Glob. Chang. Biol. 21, 897–910. doi: 10.1111/gcb.12771
Santini, A., Pecori, F., Pepori, A. L., Ferrini, F., and Ghelardini, L. (2010). Genotype × environment interaction and growth stability of several elm clones resistant to Dutch elm disease. For. Ecol. Manage. 260, 1017–1025. doi: 10.1016/j.foreco.2010.06.025
Schmeddes, J., Muffler, L., Barbeta, A., Beil, I., Bolte, A., Holm, S., et al. (2023). High phenotypic variation found within the offspring of each mother tree in Fagus sylvatica regardless of the environment or source population. Glob. Ecol. Biogeogr. 33, 470–481. doi: 10.1111/geb.13794
Schuldt, B., Buras, A., Arend, M., Vitasse, Y., Beierkuhnlein, C., Damm, A., et al. (2020). A first assessment of the impact of the extreme 2018 summer drought on central European forests. Basic Appl Ecol 45, 86–103. doi: 10.1016/j.baae.2020.04.003
St Clair, J. B., and Howe, G. T. (2007). Genetic maladaptation of coastal Douglas-fir seedlings to future climates. Glob. Chang. Biol. 13, 1441–1454. doi: 10.1111/j.1365-2486.2007.01385.x
Stotz, G. C., Salgado-Luarte, C., Escobedo, V. M., Valladares, F., and Gianoli, E. (2021). Global trends in phenotypic plasticity of plants. Ecol. Lett. 24, 2267–2281. doi: 10.1111/ele.13827
Sultan, S. E. (2001). Phenotypic plasticity for fitness components in Polygonum species of contrasting ecological breadth. Ecology 82, 328–343. doi: 10.1890/0012-9658(2001)082[0328:PPFFCI]2.0.CO;2
Thomas, C. D., Cameron, A., Green, R. E., Bakkenes, M., Beaumont, L. J., Collingham, Y. C., et al. (2004). Extinction risk from climate change. Nature 427, 145–148. doi: 10.1038/nature02121
Thomson, A. M., Riddell, C. L., and Parker, W. H. (2009). Boreal forest provenance tests used to predict optimal growth and response to climate change: 2. Black spruce. Can. J. For. Res. 39, 143–153. doi: 10.1139/X08-167
Vacek, Z., Vacek, S., Slanař, J., Bílek, L., Bulušek, D., Štefančík, I., et al. (2019). Adaption of Norway spruce and European beech forests under climate change: from resistance to close-to-nature silviculture. Central Eur For J 65, 129–144. doi: 10.2478/forj-2019-0013
Valladares, F., Matesanz, S., Guilhaumon, F., Araújo, M. B., Balaguer, L., Benito-Garzón, M., et al. (2014). The effects of phenotypic plasticity and local adaptation on forecasts of species range shifts under climate change. Ecol. Lett. 17, 1351–1364. doi: 10.1111/ele.12348
Van Buskirk, J., and Steiner, U. K. (2009). The fitness costs of developmental canalization and plasticity. J. Evol. Biol. 22, 852–860. doi: 10.1111/j.1420-9101.2009.01685.x
Van Kleunen, M., and Fischer, M. (2005). Constraints on the evolution of adaptive phenotypic plasticity in plants. New Phytol. 166, 49–60. doi: 10.1111/j.1469-8137.2004.01296.x
Vázquez, D. P., Gianoli, E., Morris, W. F., and Bozinovic, F. (2017). Ecological and evolutionary impacts of changing climatic variability. Biol. Rev. 92, 22–42. doi: 10.1111/brv.12216
Vennetier, M., Ripert, C., Maille, E., Blanc, L., Torre, F., Roche, P., et al. (2008). A new bioclimatic model calibrated with vegetation for Mediterranean forest areas. Ann. For. Sci. 65:711. doi: 10.1051/forest:2008050
Vizcaíno-Palomar, N., Fady, B., Alía, R., Raffin, A., Mutke, S., and Benito Garzón, M. (2020). The legacy of climate variability over the last century on populations’ phenotypic variation in tree height. Sci. Total Environ. 749:141454. doi: 10.1016/j.scitotenv.2020.141454
Wickham, H., Averick, M., Bryan, J., Chang, W., McGowan, L. D., François, R., et al. (2019). Welcome to the tidyverse. J Open Source Softw 4:1686. doi: 10.21105/joss.01686
Williams, M. I., and Dumroese, R. K. (2013). Preparing for climate change: forestry and assisted migration. J. For. 111, 287–297. doi: 10.5849/jof.13-016
Keywords: growth stability, phenotypic plasticity, provenance trial, common garden, Fagus sylvatica (European beech), Picea engelmannii (Engelmann spruce), Pinus contorta (lodgepole pine), Picea abies (Norway spruce)
Citation: Di Fabio A, Buttò V, Chakraborty D, O’Neill GA, Schueler S and Kreyling J (2024) Climatic conditions at provenance origin influence growth stability to changes in climate in two major tree species. Front. For. Glob. Change. 7:1422165. doi: 10.3389/ffgc.2024.1422165
Edited by:
Petras Rupšys, Vytautas Magnus University, LithuaniaReviewed by:
Natalia Vizcaíno-Palomar, Instituto Nacional de Investigación y Tecnología Agroalimentaria (INIA), SpainHenn Korjus, Estonian University of Life Sciences, Estonia
Copyright © 2024 Di Fabio, Buttò, Chakraborty, O’Neill, Schueler and Kreyling. This is an open-access article distributed under the terms of the Creative Commons Attribution License (CC BY). The use, distribution or reproduction in other forums is permitted, provided the original author(s) and the copyright owner(s) are credited and that the original publication in this journal is cited, in accordance with accepted academic practice. No use, distribution or reproduction is permitted which does not comply with these terms.
*Correspondence: Alessandro Di Fabio, YWxlc3NhbmRyby5kaWZhYmlvQHVuaS1ncmVpZnN3YWxkLmRl