 Lina Ke1
 Qin Tan
 Yao Lu
- 1College of Geographical Sciences, Liaoning Normal University, Dalian, China
- 2National Marine Environmental Monitoring Center, Dalian, China
- 3National Key Laboratory of Marine Ecological Environment Remediation and Restoration for Environmental Protection, Dalian, China
Coastal wetlands are important areas with valuable natural resources and diverse biodiversity. Due to the influence of both natural factors and human activities, the landscape of coastal wetlands undergoes significant changes. It is crucial to systematically monitor and analyze the dynamic changes in coastal wetland cover over a long-term time series. In this paper, a long-term time series coastal wetland remote sensing classification process was proposed, which integrated feature selection and sample migration. Utilizing Google Earth Engine (GEE) and Landsat TM/ETM/OLI remote sensing image data, the selected feature set is combined with the sample migration method to generate the training sample set for each target year. The Simple Non-Iterative Clustering-Random Forest (SNIC-RF) model was ultimately employed to accurately map wetland classes in the Liaohe Estuary from 1985 to 2023 and quantitatively evaluate the spatio-temporal pattern change characteristics of wetlands in the study area. The findings indicate that: (1) After feature selection, the accuracy of the model reached 0.88, and the separation of the selected feature set was good. (2) After sample migration, the overall accuracy of sample classification in the target year ranged from 87 to 94%, along with Kappa coefficients of 0.84 to 0.92, thereby ensuring the validity of classification sample migration. (3) SNIC-RF classification results showed better performance of wetland landscape. Compared with RF classification, the overall classification accuracy was increased by 0.69–5.82%, and the Kappa coefficient was increased by 0.0087–0.0751. (4) From 1985 to 2023, there has been a predominant trend of natural wetlands being converted into artificial wetlands. In recent years, this transition has occurred more gently. Finally, this study offers valuable insights into understanding changes and trends in the surface ecological environment of the Liaohe Estuary. The research method can be extended to other types of wetland classification and the comprehensive application of coastal wetland in hydrology, ecology, meteorology, soil, and environment can be further explored on the basis of this research, laying strong groundwork for shaping policies on ecological protection and restoration.
1 Introduction
Coastal wetlands serve as a crucial interface between the sea and land, playing a vital role in climate regulation, water filtration, shoreline protection, carbon sequestration, and biodiversity maintenance. They are an essential natural ecosystem and an integral part of the natural ecological landscape. However, in recent years, coastal wetlands have faced increasing threats, pollution, overfishing, reclamation, invasion of alien species, and infrastructure occupation are the primary factors posing a threat to the ecological status of wetlands. This has raised significant concerns about the ecological environment of wetlands. The Liaohe Estuary wetland is the largest coastal reed wetland swamp area in China’s high latitudes, characterized by a vast expanse of Suaeda, tidal flats, and shallow seas. It forms a typical sea-land intersection wetland landscape dominated by ‘shallow sea—bare beach—estuary—Suaeda community—Suaeda-reed community—reed community’, making it a focal point for coastal wetland research. Therefore, it is highly significant to acquire the spatial distribution information of fine wetland categories in the Liaohe Estuary wetland, as well as to classify and dynamically map the wetland vegetation over a long-term time series. This will deepen our understanding of the changes and patterns in the surface ecological environment in the Liaohe Estuary, and provide a basis for formulating ecological protection and restoration policies, as well as scientific management in the study area.
Coastal wetlands are sensitive to land-sea interactions, and access to wetlands for surveys is challenging in most areas. Remote sensing technology plays an important role in the long-term monitoring of coastal wetlands (Jiang et al., 2015). In the process of long-term monitoring and classification of wetlands, several problems are currently encountered: (1) How to obtain high-quality sample data across years. In view of the inherent geographical particularity of coastal wetlands, traditional artificial field sampling and visual sample selection methods based on high-resolution images are not enough to meet the needs of large-scale areas over a long time span (Dong et al., 2023). (2) How to screen and remove the redundant information of satellite remote sensing data. The information of remote sensing image data in a region for several decades is too large, and the redundancy of satellite remote sensing data will affect the classification accuracy of wetlands, so it is necessary to screen and optimize the remote sensing image information and features. (3) The classification accuracy of coastal wetlands needs to be improved. Classification methods affect classification results. At present, most classification methods for wetlands are single classification methods, and there are few studies on compound classification methods or improved classification algorithms, so the accuracy of classification results needs to be improved. This paper focuses on the above three key issues to optimize the classification process of coastal wetlands.
In the selection of training samples, to achieve the rapid acquisition of reliable samples in a long-term time series, scholars proposed the sample migration method, which utilizes the reliable samples of a certain reference year as the basis, and migrates the unchanged samples to the target year (Yu et al., 2022). The sample migration method based on change detection provides methodological guidance for the acquisition of sample data over the years. It serves to mitigate statistical distribution disparities between the target domain image and its source counterpart by identifying invariant regions within dual-temporal or multi-temporal imagery. Malila introduced Change Vector Analysis (CVA) as a method to discern unaltered sample points through the examination of spatial, spectral, and structural attributes across remote sensing imagery captured at varying time intervals. This analytical approach holds promise for facilitating sample migration endeavors focused on monitoring land cover transformations (Ye et al., 2021). Moreover, researchers have integrated remote sensing-derived feature indicators to enhance the efficacy of CVA-based change detection methodologies (Wang et al., 2022). For example, Rahman and Mesev (2019) incorporated the tasseled cap transformation, alongside NDVI and NDWI, into CVA magnitude and direction computations to bolster the precision of land use change detection. Xu et al. (2019) introduced the RSEI-CVA approach to detect ecological changes in image sequences in Fujian Province at different spatial scales.
The combination of remote sensing features can better distinguish the ground objects in the study area, and improve the accuracy of sample migration to a certain extent. Nonetheless, the utilization of high-dimensional remote sensing features is encumbered by challenges including complexity and difficulty of interpretation, redundancy of feature data, and large computational volume. Therefore, a feature selection method is used to reduce dimension to reduce redundancy while maximizing correlation with the identified targets (Xing et al., 2023). In general, the feature selection method can be divided into three categories: filter method, wrapper method, and embedded method (Effrosynidis and Arampatzis, 2021). The filter method is simple and efficient, suitable for large data sets, but it lacks interaction with the model (Khalid et al., 2014). The other two methods use the performance of the learning algorithm to evaluate a subset of features, and when the number of features is the same, the results are more accurate than the results of the filter method. However, the performance of the embedded model is very sensitive to the parameters, and the parameter setting is more complicated (Shafiee et al., 2021). In contrast, the wrapper method uses a subset of features to train multiple times, which is computationally expensive but guarantees model effectiveness (Ramezan, 2022; Lin et al., 2023; Zhao et al., 2023). Zhou et al. (2021) designed 10 object-based image analysis (OBIA) scenarios to evaluate the contribution of five machine learning algorithms to classification accuracy, and the results showed that the RF model based on the RF-RFE feature selection results of the packaged model performed best in the 10 scenarios. In this study, a typical wrapper method, the RF-RFE feature selection algorithm, was selected to obtain the wetland classification feature set in the study area, which provided help for wetland sample migration and wetland remote sensing classification.
At present, coastal wetland as a special area of land-sea interaction, have always been a difficult area for remote sensing monitoring because of their wide vegetation distribution, complex community composition, and high spectral similarity. Although high-spatial or hyperspectral remote sensing images can achieve better classification results, the data cost is large and the coverage area is small, so it is difficult to apply in long-term and large-scale dynamic monitoring. Therefore, scholars have improved the classification method of wetland remote sensing based on medium-spatial-resolution images of long time series. The traditional wetland vegetation classification methods commonly used are visual interpretation, supervised classification, and unsupervised classification. With the development of automatic remote sensing extraction technology, the pixel-based classification method has been widely used, which has the advantages of high computational efficiency, less data demand, and strong robustness (Peng et al., 2024). However, this method does not take into account the spatial structure and morphological characteristics of the ground objects (Jie and Wang, 2024). Object-oriented remote sensing image analysis methods take a group of pixels as processing primitives, and can effectively eliminate the “salt and pepper phenomenon” based on pixel classification (Eskandari Damaneh et al., 2022). Xing et al. (2023) combined the object-oriented method with optimal feature selection to conduct a detailed classification of coastal wetlands in the Yellow River Delta based on Sentinel-1, Sentinel-2, and NASADEM datasets. The simple non-iterative clustering (SNIC) algorithm is a commonly used object-oriented segmentation. The algorithm is very effective in grouping similar pixels and identifying potential single objects, which can reduce noise (Wang et al., 2024). For example, Cui et al. (2023) proposed a random forest classifier that combines superpixel segmentation and feature selection. Compared with three classical pixel-based machine learning classification methods, the results show that the model improves the classification accuracy of wetlands. Google Earth Engine (GEE) is a cloud-based geospatial data analysis platform that provides multiple object-oriented segmentation methods, including SNIC. In recent years, the combination of SNIC segmentation and random forest (RF) classification has effectively solved large-scale computation problems and has achieved good results in wetland remote sensing classification (Tassi and Vizzari, 2020; Hemati et al., 2021; Zhang et al., 2022). Wang et al. (2023) combined the initial object-based random forest classifier with subsequent hierarchical decision trees of secondary water types to generate the first up-to-date 10-meter resolution map of East Asian wetlands.
In summary, given the above three key issues, this paper will cooperate with geoscience, environmental science, mathematics, and computer science and combine remote sensing technology, GIS mapping technology, and computer technology to realize cross-disciplinary coastal wetland monitoring. With GEE as the main platform, satellite remote sensing image data of the key growth stage of wetland vegetation over a long period was used as the main data source. By combining the sample migration method with the feature selection method, the feature set and long-term reliable sample data that contribute the most to wetland classification are obtained. Finally, SNIC segmentation is combined with the random forest method to get the wetland classification map of the Liaohe Estuary from 1985 to 2023. It provides a reference for the spatial distribution information of wetlands in the study area and provides a basis for the formulation and scientific management of ecological protection and restoration policies in the study area. The specific research objectives of this paper include:
(1) Combining the feature recursive elimination theory and cross-validation, massive remote sensing features of wetland types in the study area were screened to obtain the optimal wetland feature data set. It reduces spatial data redundancy, improves migration sample performance, and improves the efficiency and accuracy of a wetland classification model.
(2) Combining the theory of distance between spectra, the vector change analysis is used to calculate the spectral differences of images, and the first three dominant features obtained after feature selection are carried out in the next feature threshold analysis (FTA). Finally, the reliable sample points of long-term sequences and large areas are transferred to the target year.
(3) Combining the super-pixel segmentation and machine learning theory based on the sample set and feature set obtained by sample migration and feature selection. With GEE as the main platform, the SNIC-RF classification method was adopted to establish an efficient classification process and accurately draw the type map of coastal wetlands in the study area.
2 Materials and methods
2.1 Materials
2.1.1 Study area
The study area of this paper is located in the Liaohe Estuary of Panjin City, Liaoning Province, China. To ensure the comprehensiveness, representativeness, and completeness of the main distribution types of wetlands in the region, the Liaohe Estuary and Daling Estuary areas are selected (Figure 1). It is located at 121°60 ‘W ~ 121°95’W and 40°98 ‘N ~ 40°78’N. As the northernmost estuarine wetland in China, Liaohekou National Nature Reserve is one of the most well-protected wetlands in the world, known as “the world’s largest reed field,” and plays an important role in international wetland research and protection. The wetland of the Liaohe Estuary is low and flat, and the landform type is mainly alluvial and marine plain. The ground elevation is less than 7 m, the ground slope is 0.02%, and the soil is mainly marsh soil, saline soil, and tidal flat soil. The main vegetation communities in the area are reeds and Suaeda salsa. They play an extremely important role in habitat maintenance, wave reduction, flood storage and drought prevention, environmental purification, and blue carbon sequestration, and reflect the basic characteristics of a wetland ecological environment (Wang et al., 2021). At the same time, the “Red Beach “landscape formed by the large area of Suaeda heteroptera in the wetland is a famous tourist attraction at home and abroad. It has extremely high humanistic tourism value and commercial value. This area is an important production base for agricultural products such as oil, sea salt, rice, and reed in China, and it is also the route and habitat of migratory birds in East Asia. However, in recent years, reclamation and unreasonable beach aquaculture in the study area have blocked the hydrological connectivity of the Liaohe Estuary wetland. The exchange of fresh and saline water is blocked, causing the degradation of the estuary habitat, the atrophy of the reed and Suaeda salsa communities, the inhibition of the primary productivity of the plant community, the decrease of the deposition rate of the tidal flat wetland, and the decrease of the continuous accumulation ability of the estuary wetland organic carbon. Therefore, it is a typical area for the study of long-term sequence estuary wetlands. It is of great significance to classify the Liaohe Estuary wetland and analyze the dynamic changes of the wetland.
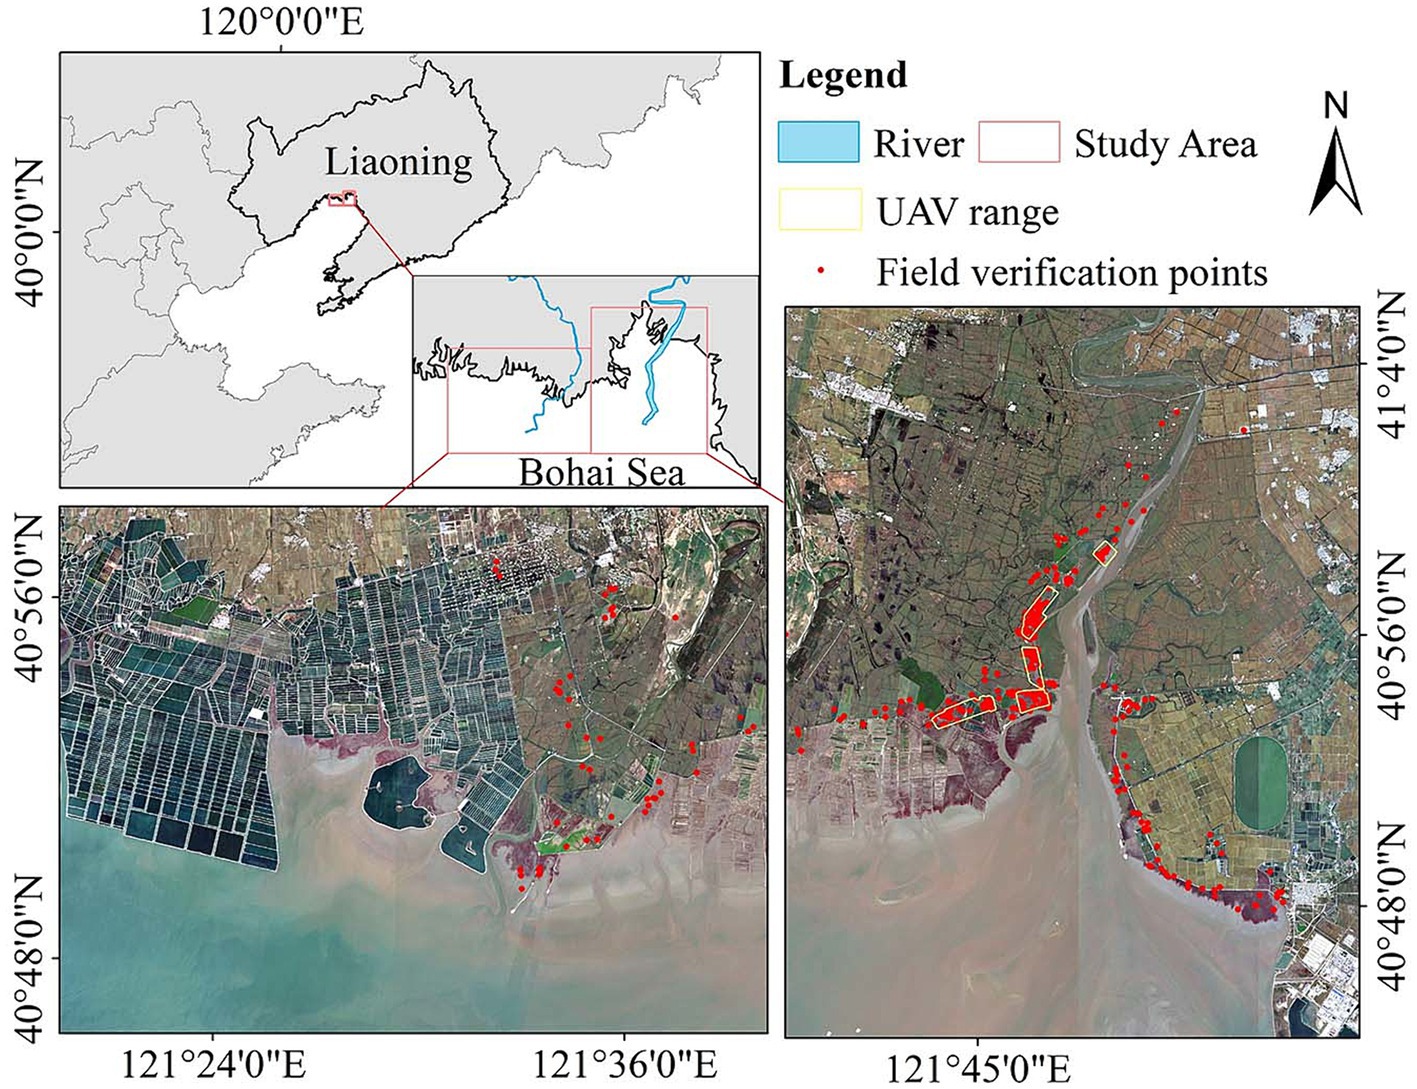
Figure 1. Location map of the study area.
2.1.2 Data source
The remote sensing data used in this study include Landsat 5 TM and Landsat 8 atmospheric correction surface reflectivity image data (SR), which can be obtained by directly calling the official data of the United States Geological Survey (USGS) online on the GEE platform. Data covering the study area in 1985, 1995, 2005, 2015, and 2023 were selected to construct the feature dataset. In GEE, the cloud and cloud shadow are identified by the band of “pixel_qa” in Landsat data, and the CFMask cloud mask is constructed to filter out clouds. In a few summer images, when there is a large cloud and no complete image, images from nearby years or months are used instead. Part of the sample data in this paper also includes multispectral images with a spatial resolution of 4 cm obtained by the DJI Genie 4RTK multispectral version UAV in May 2023 and Sentinel-2 remote sensing image data from the same period. The Sentinel-2 remote sensing images were selected as L2A class data with atmospheric correction, with a total of 12 spectral bands, and the image data with a resolution of 10 meters was selected in this paper.
According to the research purpose and the natural conditions of the study area, and with reference to the current classification standards, the main cover types of the study area were divided into 3 categories: natural wetland (Water, Suaeda, Reed, Naked beach), constructed wetland (Mariculture area, Farmland), and non-wetland (Built-up area, Bare soil), with a total of 8 subcategories. According to the field survey, combined with the visual interpretation results of the high-resolution UAV multi-spectral image and the 10 m Sentinel-2 image, a total of 1844 sample points in the reference year 2023 are determined, of which 400 have been verified in the field. In order to avoid an insufficient number of training samples for migration due to the increase of samples that do not meet the threshold, this paper should generate more reference samples at the initial stage to meet the required number of training samples for sample migration. Specifics about wetland land cover types and site surveys is provided in the Supplementary material.
2.2 Methods
The main research content and technical roadmap of this paper are shown in Figure 2. After data collection and pre-processing, feature selection is carried out based on the RF-RFE model; Sample migration based on CVA and FTA; wetland classification and mapping were carried out by SNIC-RF method based on the GEE platform.
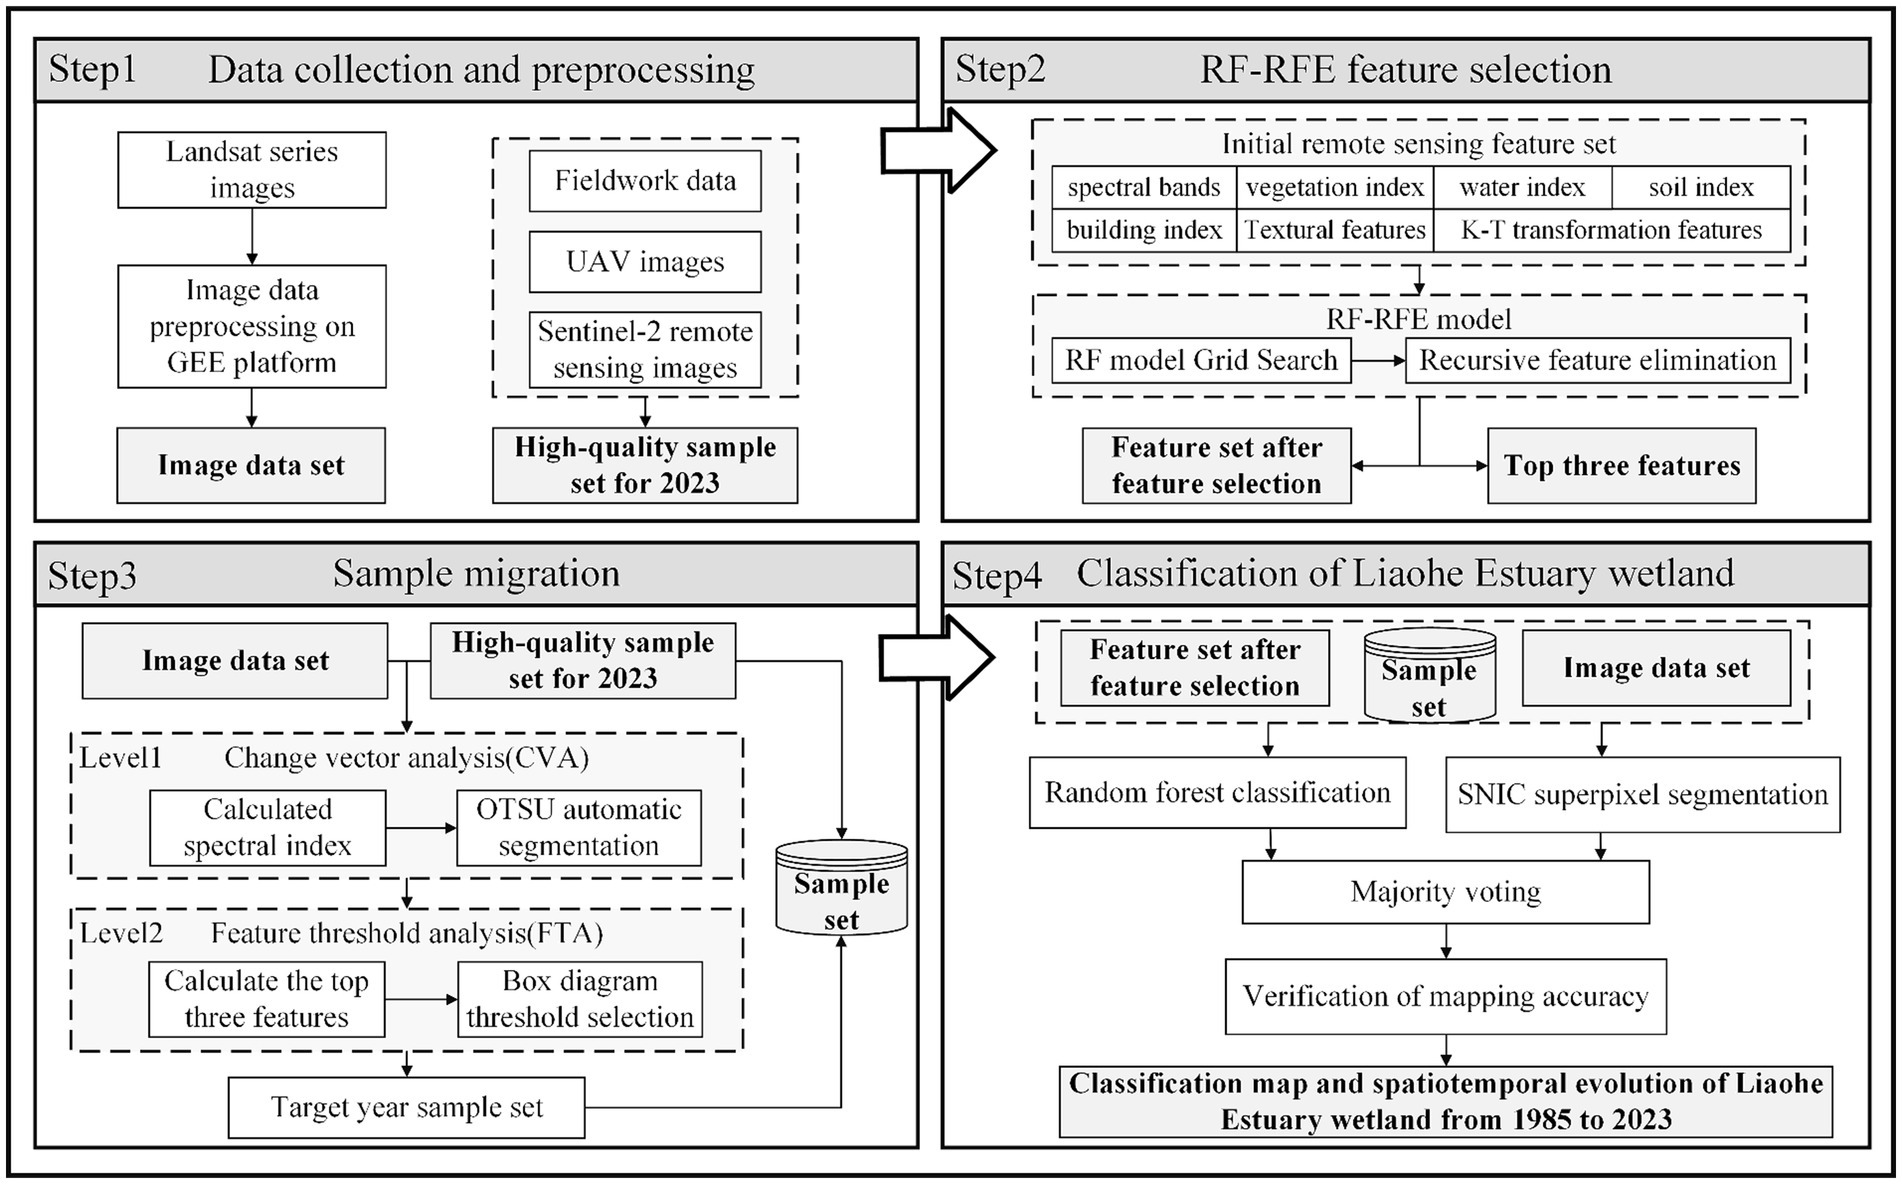
Figure 2. Technology roadmap.
2.2.1 Wetland feature selection
The feature set constructed on the GEE platform includes vegetation index, water index, soil index, building index, Kauth-Thomas transformation features, and texture features (Table 1). According to the growth characteristics of different wetland vegetation types in the study area (Zhang et al., 2021; Chen et al., 2023), the remote sensing images of 4 months from July to October were used to establish an initial remote sensing feature set of 40 * 4 = 160 features, and the spatial sample points were given to all remote sensing feature attribute values. Specifics about the methods of analysis undertaken are presented in the Supplementary material.
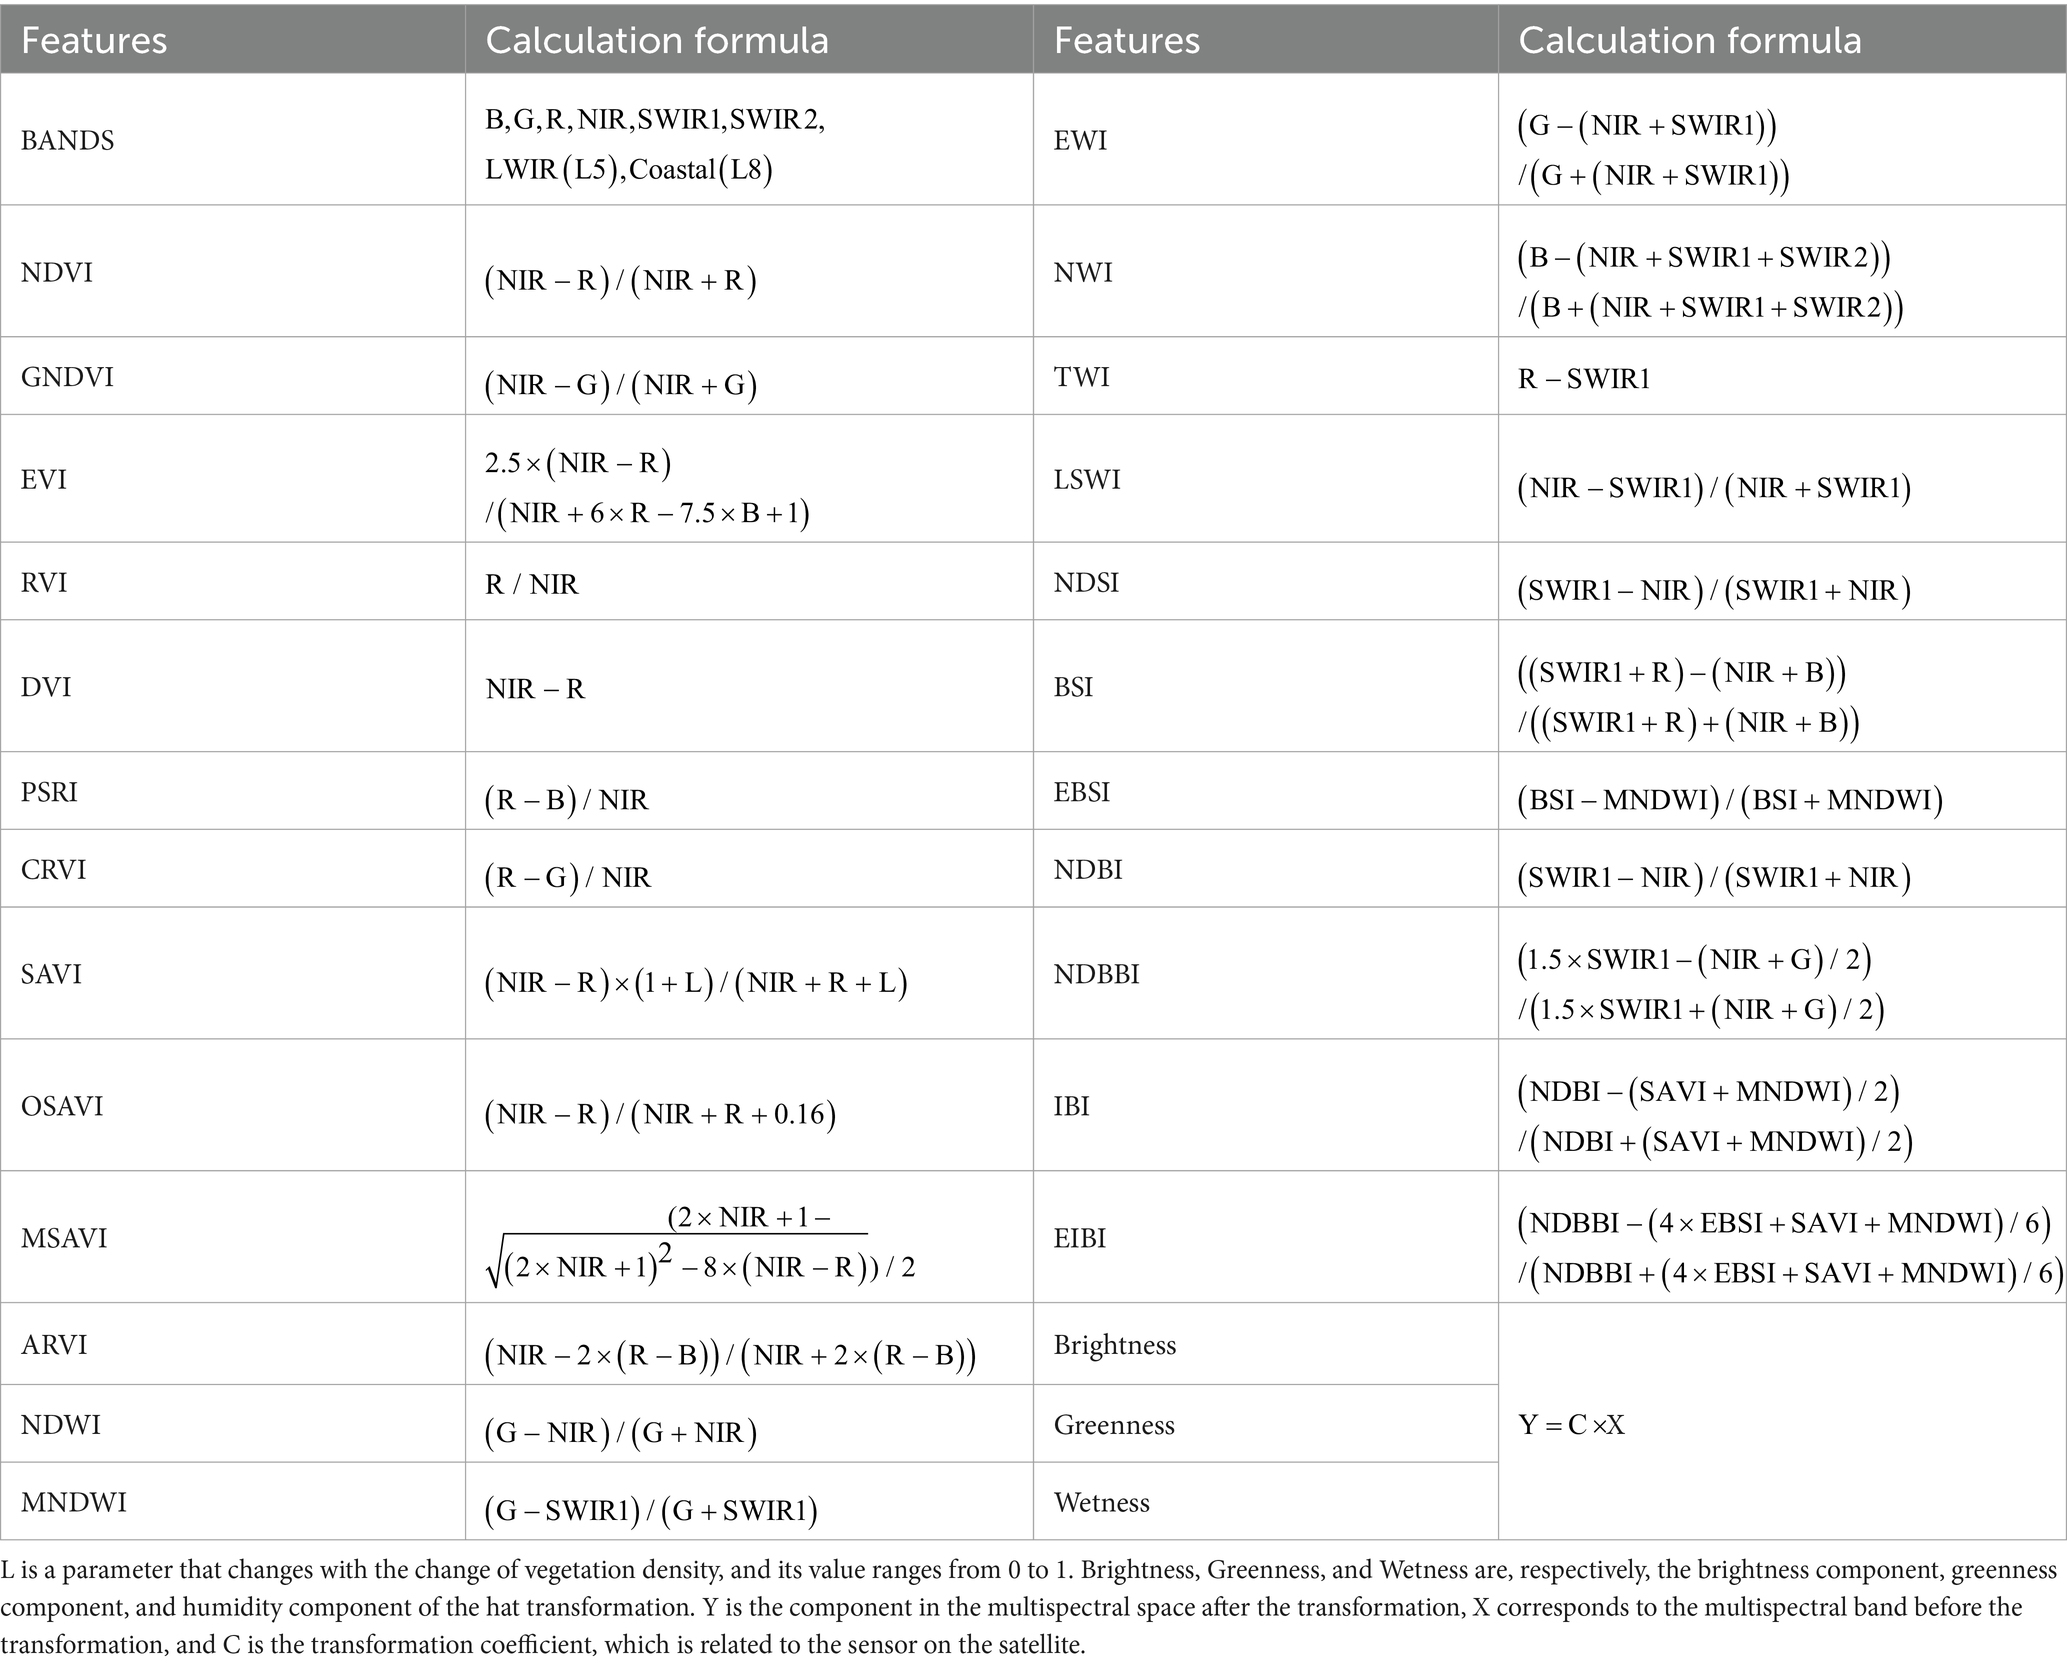
Table 1. Remote sensing features.
In this paper, RF was used as a supervised learning estimator of feature importance and combined with recursive feature elimination (RFE) to construct the RF-RFE feature selection algorithm, which finally determined the feature subset after selection to avoid the influence of human factors. Firstly, before feature elimination, Grid Search CV is selected to grid the variable region, traverse all grid points, and solve and compare the value of the objective function satisfying the constraint function to select the parameters of the optimal point, so as to reduce the complexity of the RF tree model. In the next step, the RF model is used for feature importance ranking, and the stratified KFold cross-validation method is combined to gradually iteratively delete the features with the least feature importance, and a new feature importance ranking is obtained. The steps are repeated, and the optimized feature set is finally obtained (Sung et al., 2022).
After using RF-RFE to output the result of the feature set, Jeffris-Matusita distance (JM distance) was used to conduct the separation analysis of the selected feature set (Equation 1), and the separability of features among major wetland land classes was analyzed (Chowdhury et al., 2017). The first three dominant features of the feature set are used for the feature threshold analysis of sample migration.
represent the JM distance, represents the feature mean values of two different wetland cover types, Class i and Class j respectively, represents the feature variance of two different wetland cover types, Class i and Class j respectively.
2.2.2 Migration of wetland samples
This paper uses Transductive Transfer Learning (TTL), which is a transfer learning method for target domain samples based on the similarity between source tasks and target tasks and a large amount of sample labeling data in the source domain.
The specific process of transfer learning in this study is as follows: at Level 1, vector transform analysis (CVA) is used to calculate the change images of Euclidean distance (ED) and spectral angle distance (SAD) in reference year and target year; The two indexes ED and SAD are defined as the degree of change of a given pixel at time t1 and time t2 through the vector size of the two phases, which is the best amplitude and similarity measure for the detection of two-phase spectral change (Guo et al., 2017; Zhu et al., 2023). ED is expressed as the square root of the sum of squares of the difference along the band (Equation 2), and if the spectrum of a pixel in the two-phase is the same, ED is calculated as 0. SAD refers to the cosine of the Angle between two spectral vectors (Equation 3), and the greater the SAD, the higher the similarity. At the same time, in order to determine the optimal threshold of variable and invariant training samples, the maximum inter-class threshold method (OTSU) is used to automatically segment the threshold and screen the unchanged sample points (Liu et al., 2020).
X and Y are the reference spectrum and the target spectrum, t1 and t2 are the time phase, N is the total band number.
Level 2: Conduct feature threshold analysis (FTA) according to the top three dominant features obtained from RF-RFE feature selection, conduct secondary sample point screening, and further obtain the unchanged sample point set. Taking the migration to 2015 as an example, on the remote sensing images of the study area in 2015 and 2023, the sample points were divided into 8 wetland types, and the remote sensing index eigenvalues of the corresponding sample points were calculated according to the 8 land types. After that, the remote sensing index feature value set of the sample point set of 8 wetland types in 2015 and 2023 was obtained. Based on the threshold interval of the remote sensing index in the reference year 2023, the index outliers of the target year 2015 are removed, and the sample point set of the target year 2015 within the appropriate threshold is finally obtained. Specifics about the methods of analysis undertaken are presented in the Supplementary material.
Finally, the sample set screened at Level 1 and the sample set screened at Level 2 were used to calculate the overall accuracy (OA) and Kappa coefficient (KC) of wetland classification, respectively, to verify the validity of the sample migration process in this paper (Ghorbanian et al., 2020; Fekri et al., 2021). In addition, given the insufficient sample size caused by the large period and the drastic changes in some land types in this study, artificial adjustment was considered to generate new reference samples.
2.2.3 Wetland classification and accuracy assessment
In the pre-experiment, based on the Sentinel 2A data in the study area in 2021, this study compared and invoked the pixel-based classification methods commonly used in GEE, namely random forest (RF) method and support vector machine (SVM) method (Figure 3). The RF classification results were more stable than the SVM classification results. The confusion matrix (Table 2) shows that the overall accuracy of RF classification is 86%, and the Kappa coefficient is 0.8257; the overall accuracy of SVM classification is 74%, and the Kappa coefficient is 0.6742. In terms of user accuracy and producer accuracy, there is little difference between the two algorithms in the four land classes of water, Suaeda, reed, and farmland, all of which are above 80%, but in the naked beach, mariculture area, built-up area and bare soil, SVM classification accuracy is poor, some even less than 50%. Finally, RF classifiers with better performance were selected to participate in the wetland classification process in this experiment (the pre-experimental study area was included in this experimental study area).
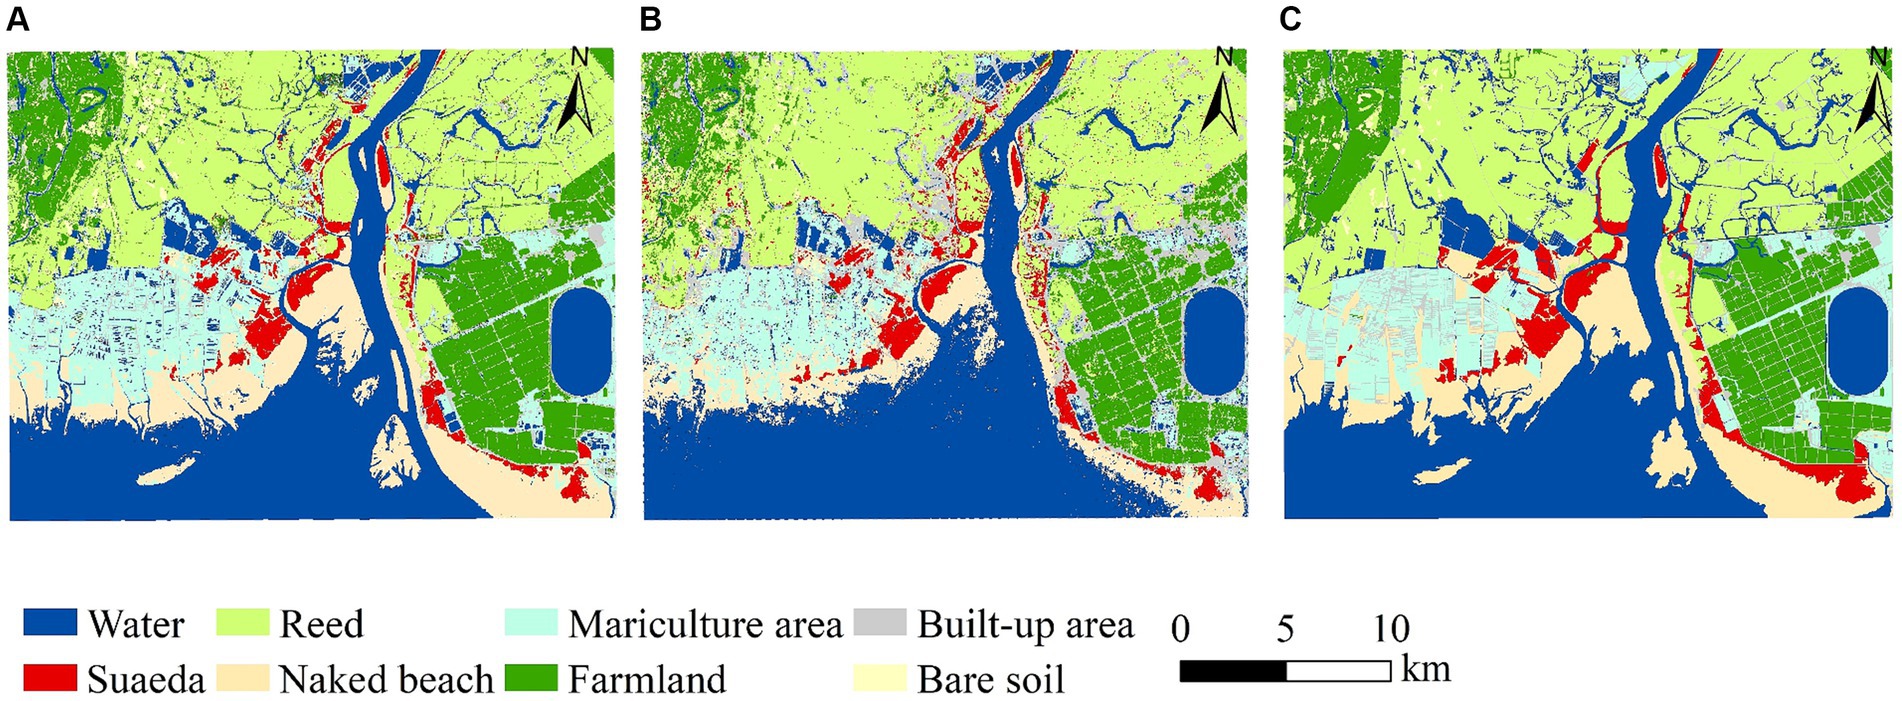
Figure 3. SVM (A) and RF (B) machine learning algorithm classification diagram comparison [(C) represents the manual interpretation].
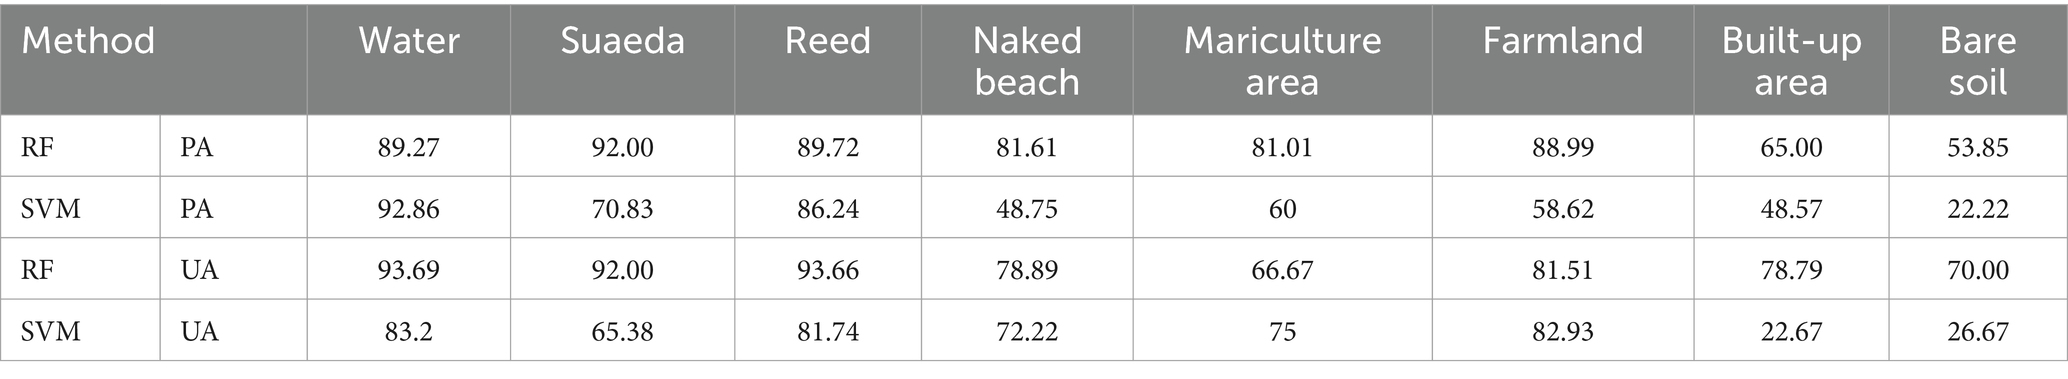
Table 2. Comparison of classification accuracy between SVM and RF machine learning algorithms [Producer accuracy(PA)/User accuracy(UA)].
The RF model has a small error, strong robustness, and a strong anti-noise ability to conduct supervision and classification of coastal wetlands (Rodriguez-Galiano et al., 2012). RF models can use out-of-bag data (OOB) to predict model accuracy or assess feature importance (Belgiu and Drăguţ, 2016). Invoking an RF classifier in GEE usually requires setting two parameters: the number of variables considered at each split (mtry) and the number of tree classifiers (ntrees) (Hu et al., 2020). “mtry” uniformly uses the square root of the feature numbers involved in the classification. “ntree” is adjusted by parameter tuning.
Based on the experience of the preliminary experiment, SNIC superpixel segmentation combined with RF model of GEE platform was adopted in the process of wetland classification, that is, SNIC-RF classification method. The main parameters of SNIC segmentation are “seed size,” “compactness,” “connectivity,” and “neighborhood size.” In this study, red, green, blue, and near-infrared bands are used as the input of image segmentation, and each parameter is adjusted according to the separability of ground objects in different areas of the study area. The majority voting method is used to superimpose pixel-based classification results with object-based classification results, reduce the impact of misclassified pixels in the segmentation patch unit, create object-based classification, and effectively avoid the “pepper and salt phenomenon” with good integrity. In this paper, a confusion matrix was used to evaluate classification accuracy, and evaluation indexes included overall accuracy (OA), Kappa coefficient (KC), producer accuracy (PA), and user accuracy (UA).
3 Results and analysis
3.1 Feature selection results
In this paper, through RF-RFE feature selection, the top 25 features in importance ranking were selected for wetland classification so as to improve the performance of migration samples and the efficiency and accuracy of the wetland classification model, with the model accuracy reaching 0.88, as shown in Figure 4. Among the 25 features, vegetation index and water body index accounted for the highest proportion, with 7 in each, among which DVI and GNDVI, NDWI, TWI, and EWI appeared more frequently, playing a greater role in the classification of wetlands in this study. In addition, there are up to 12 features in October after feature selection, among which the top three features are DVI_10, NWI_10, and greenness_10, respectively, indicating that October is a season with significant spectral differences of wetland vegetation in the study area and a key month for selecting wetland remote sensing data.
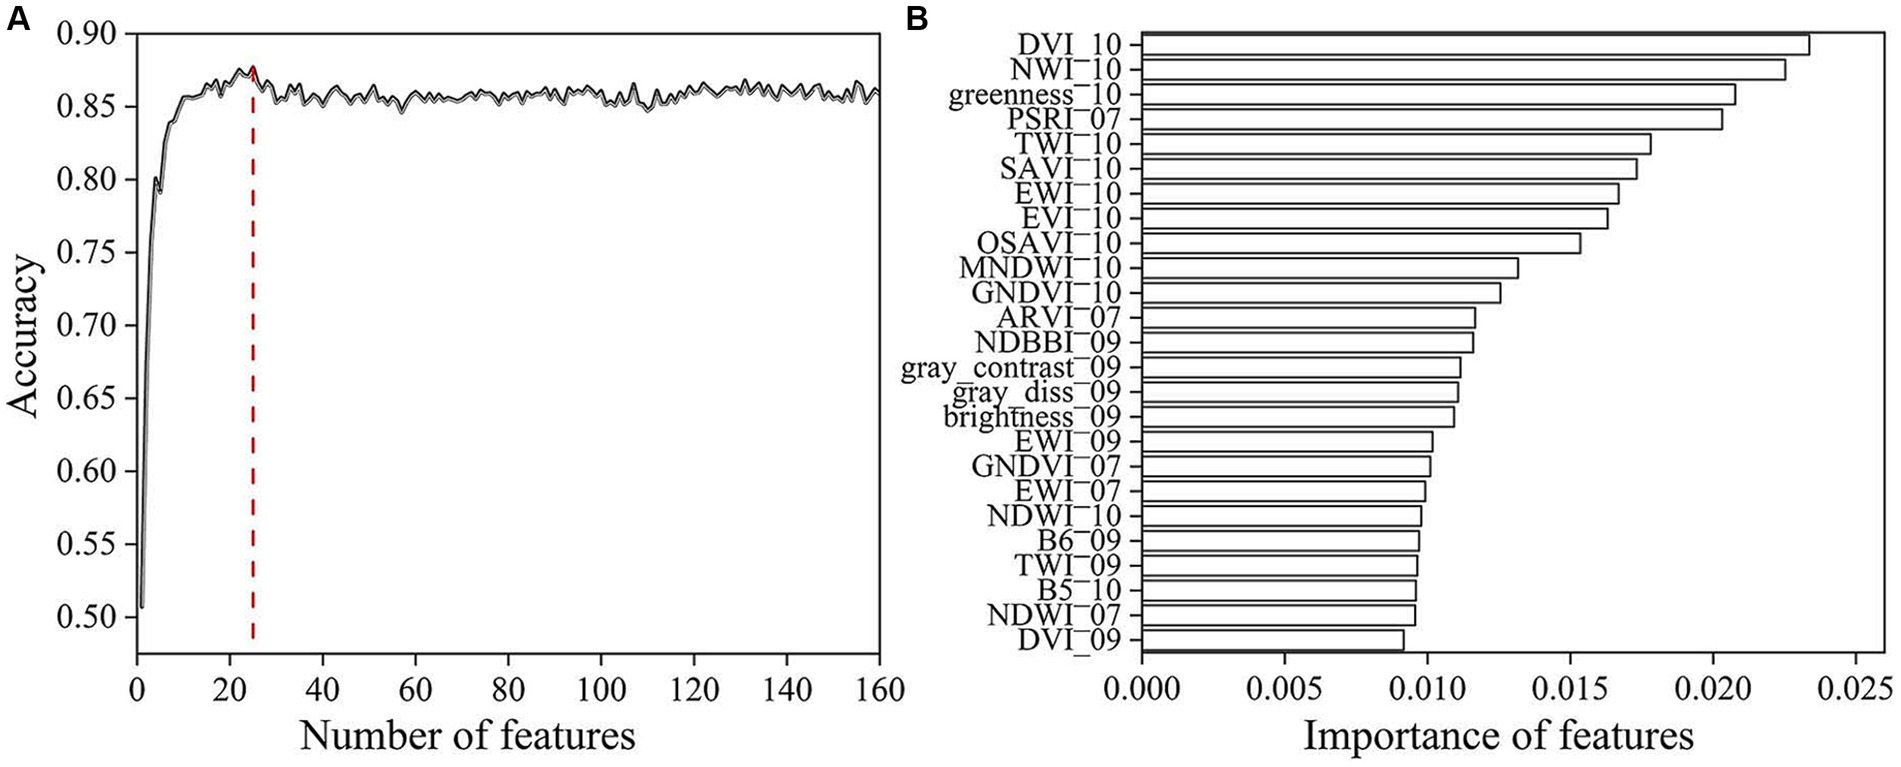
Figure 4. The number of features after selection (A), and importance of feature selection results (B).
In Figure 5, the JM distance is used to analyze the separability of all features in the selected feature set. The JM distances and mean values of the following 7 types of cover are listed for the main types of adjacent cover that are difficult to distinguish in this research area. The JM distance is between 0 and 2, and the closer to 2, the better the separability between the two categories. Among all the 25 features, the ones with the highest degree of separation are DVI_10, NWI_10, greenness_10, PSRI_07, etc., and the average JM distance is more than 1.6. Among the categories listed, D1 (Water/Suaeda), D3 (Suaeda/Reed), and D5 (Reed/Naked beach) are relatively easy to distinguish, and the JM distance of each feature is generally large, up to 1.9, followed by D2 (Water/Mariculture), D4 (Suaeda/Naked beach), and D6 (Reed/Farmland). In the D7 (Built-up area/Bare soil), the separation degree is lower, and the JM distance is about 1.2 to 1.5.
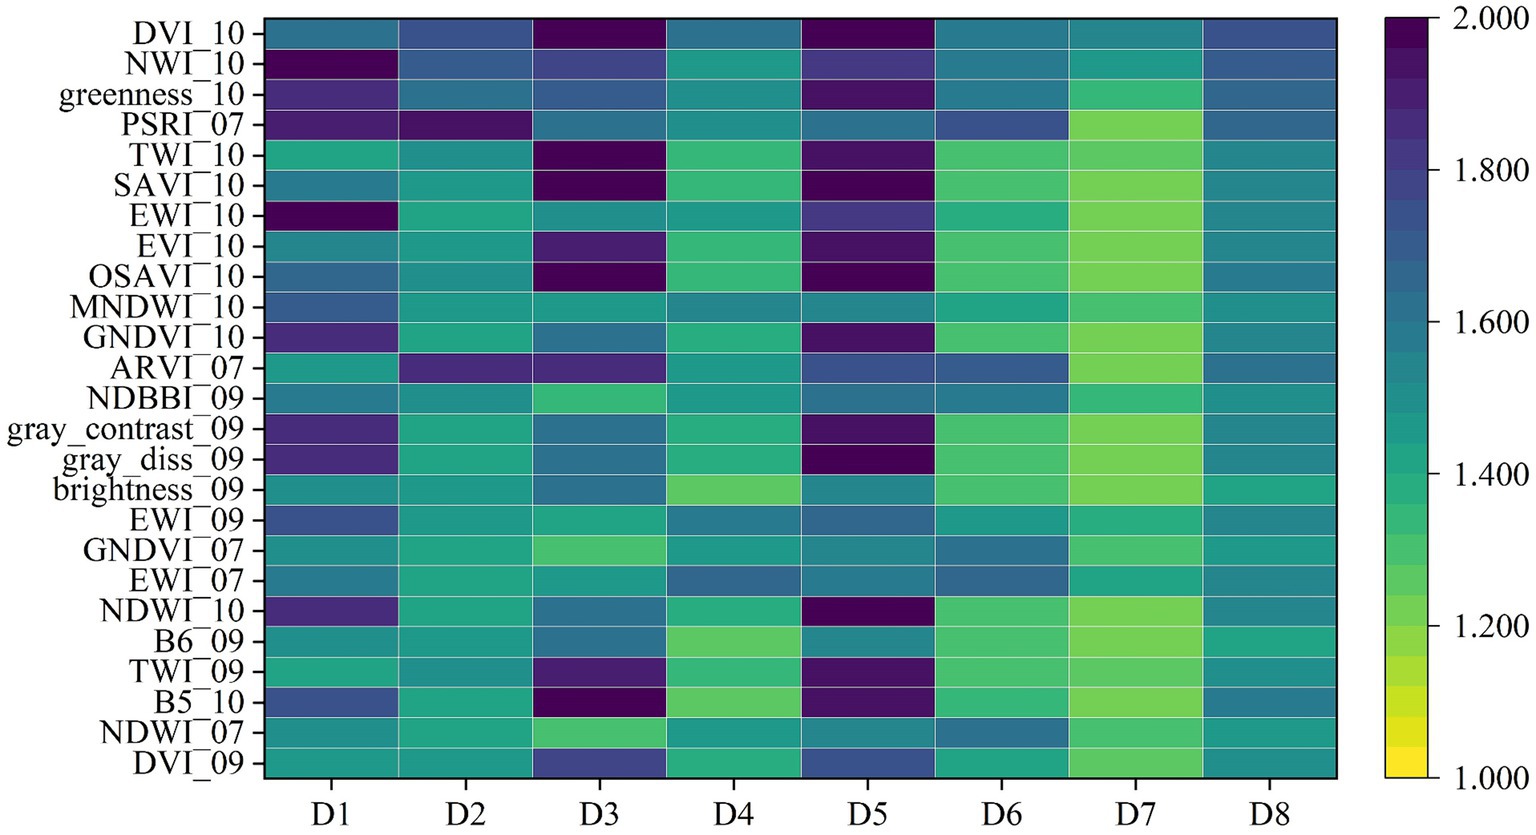
Figure 5. JM distance hotspot map of selected feature set in main wetland cover (D1, Water/ Suaeda; D2, Water/Mariculture area; D3, Suaeda/ Reed; D4, Suaeda/Naked beach; D5, Reed/Naked beach; D6, Reed/Farmland; D7, Built-up area/Bare soil; D8, Mean).
3.2 Sample migration results
3.2.1 Level 1
Before vector change analysis, the mean and standard deviation of images “2015img” and “2023img” need to be calculated (Figure 6), and normalized processing is performed to obtain two time-phase images “2015nor” and “2023nor.” To eliminate radiation inconsistencies. The ED and SAD of the spectral changes between the corresponding pixels of the two images with the same phenological period are calculated. The ED value close to 1 indicates that the spectral similarities between the two images are smaller, while the SAD value is on the contrary. The SAD value closer to 1 indicates that the two images are more similar. As shown in the figure after OTSU binarization segmentation, 0 represents the unchanged region and 1 represents the changed region; that is, the sample points in the changed region can be removed.
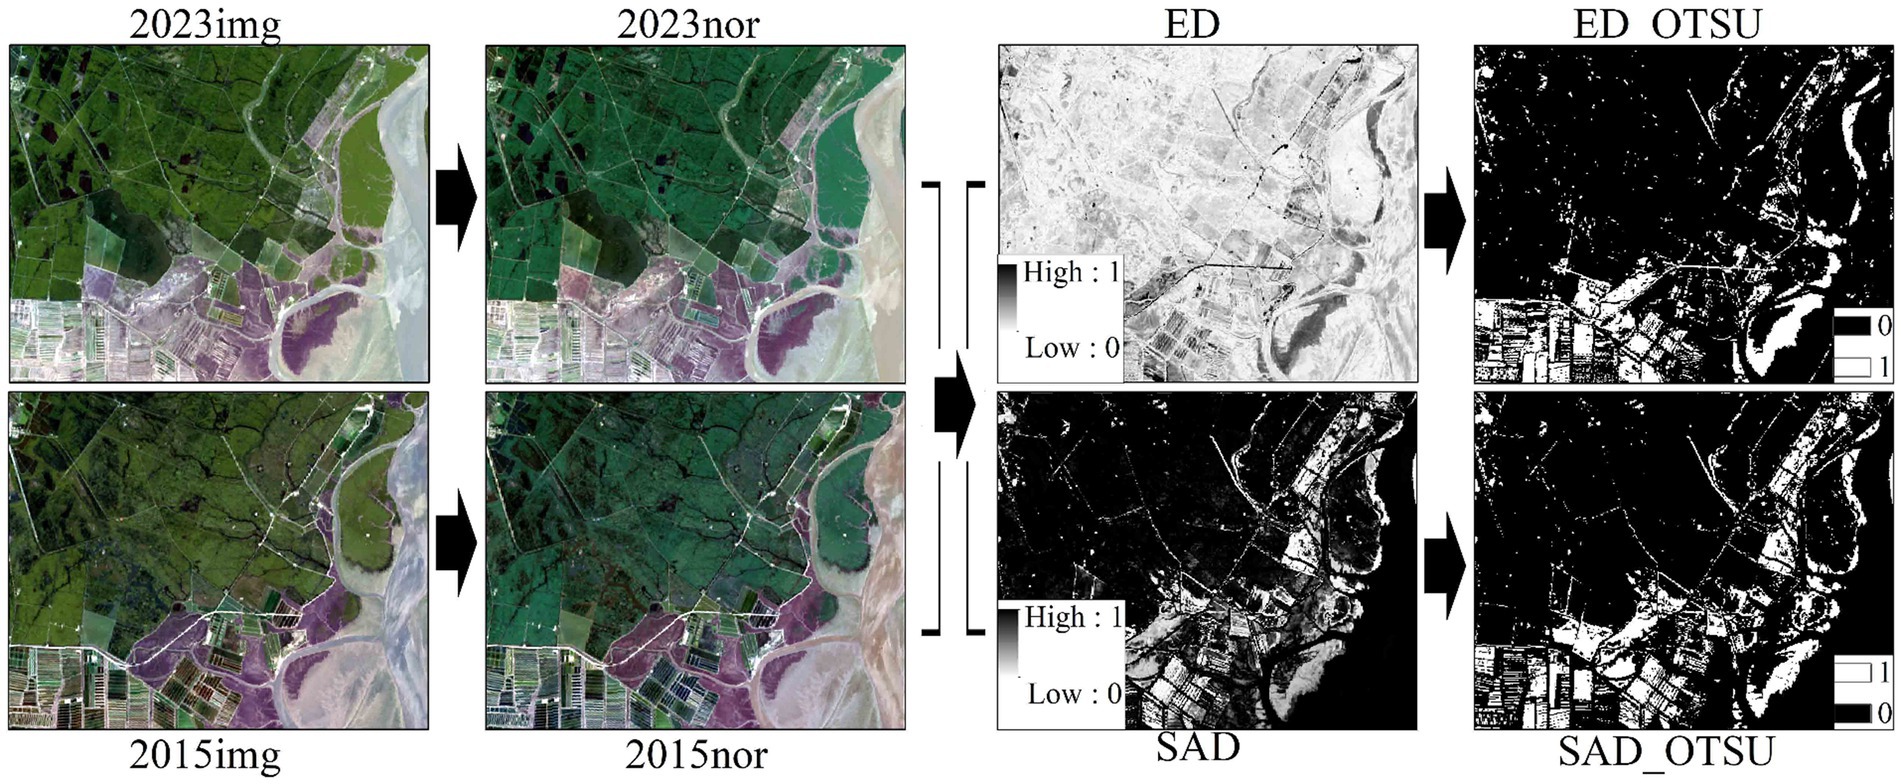
Figure 6. CVA change detection results schematic diagram.
3.2.2 Level 2
The feature threshold analysis is carried out by land class. Figure 7A shows the OA and Kappa coefficients obtained during the classification of the sample set after screening at Level 1, and the OA and Kappa coefficients corresponding to the classification of the sample set after threshold analysis and sample point screening using dominant feature variables at Level 2. OA and Kappa coefficients were slightly increased, and the accuracy of sample migration was improved. This indicates that the first three features selected by the feature selection algorithm, DVI_10, NWI_10, and greenness_10, play a role in the process of feature threshold analysis of sample migration, which further improves the accuracy of sample migration. Figure 7B shows the changes in sample size of various wetland types in 1985, 1995, 2005, 2015, and 2023. As the time span becomes longer, more sample points are removed, and the sample size of some land classes is insufficient. In this paper, new reference samples are manually added to the study to maintain the proportion of samples from different places so that the sample number is sufficient for classification.
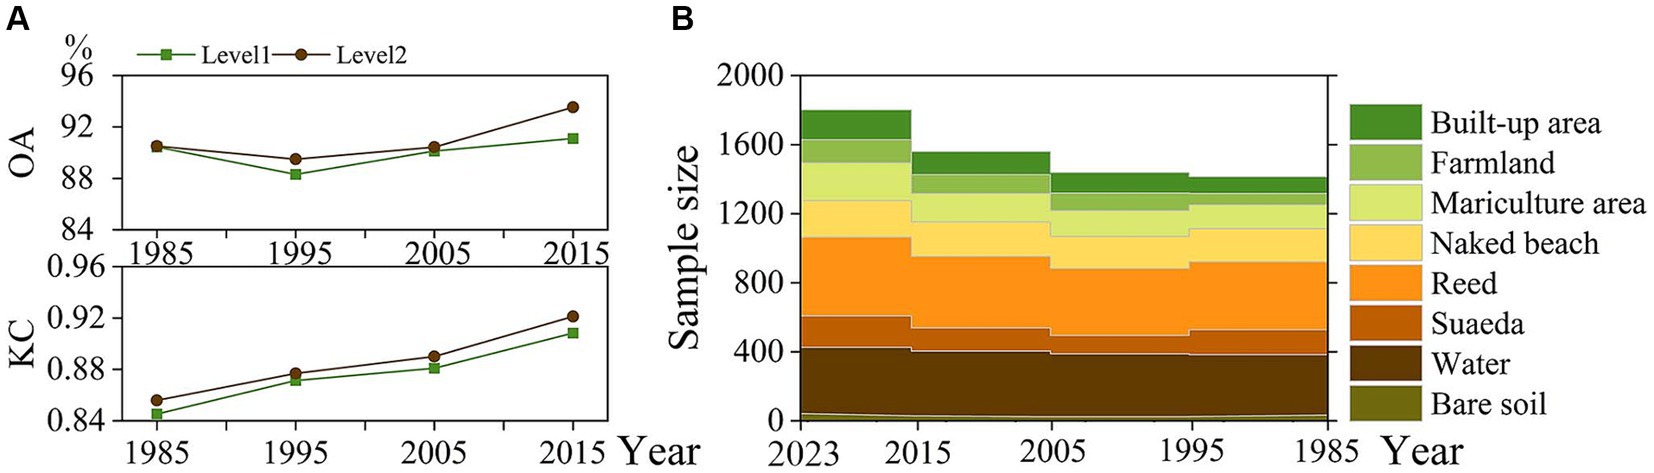
Figure 7. The comparison of OA and KC in Level 1 and Level 2 (A) and the change of sample number of each wetland type after migration (B).
In the process of sample acquisition, a manual traditional field survey can obtain high-quality sample sets, but it lacks historical sample data. Although manual interpretation can supplement the lack of historical sample data, it is more subjective and costs more for large-scale, multi-year sample sets. In this paper, the sample migration method is used to calculate the spectral difference of the same pixel on different simultaneous images and distinguish the changing region from the unchanged region in this period. The sample points of the unchanged area can be migrated to the target year, and then the threshold analysis of the dominant feature index is carried out to remove the sample points with an abnormal index, finally, the sample data sets of each wetland type in 1985, 1995, 2005, 2015, and 2023 are obtained. In addition to improving the efficiency of sample acquisition, the accuracy of sample migration is further improved, and the high quality of samples also has a positive impact on the results of wetland classification.
3.3 Wetland classification and accuracy evaluation results
Firstly, an object-oriented method is used to obtain the best segmented object based on the GEE platform. SNIC parameters are set as follows: “seeds size” =15, “compactness” =0, “connectivity” =4, “neighborhood size” =2* “seeds size.” The process diagram for some areas is shown in Figure 8. A represents SNIC segmentation results. B indicates that the RF classification map is obtained by using the optimized feature set obtained from RF-RFE feature selection. C represents the result of classification by most voting methods. The SNIC-RF classification method reduces the “pepper and salt phenomenon” in the classification effect and maintains the integrity of the wetland landscape. It can be seen from Table 3 that OA is above 90% and KC is above 0.87, which improves the classification accuracy.
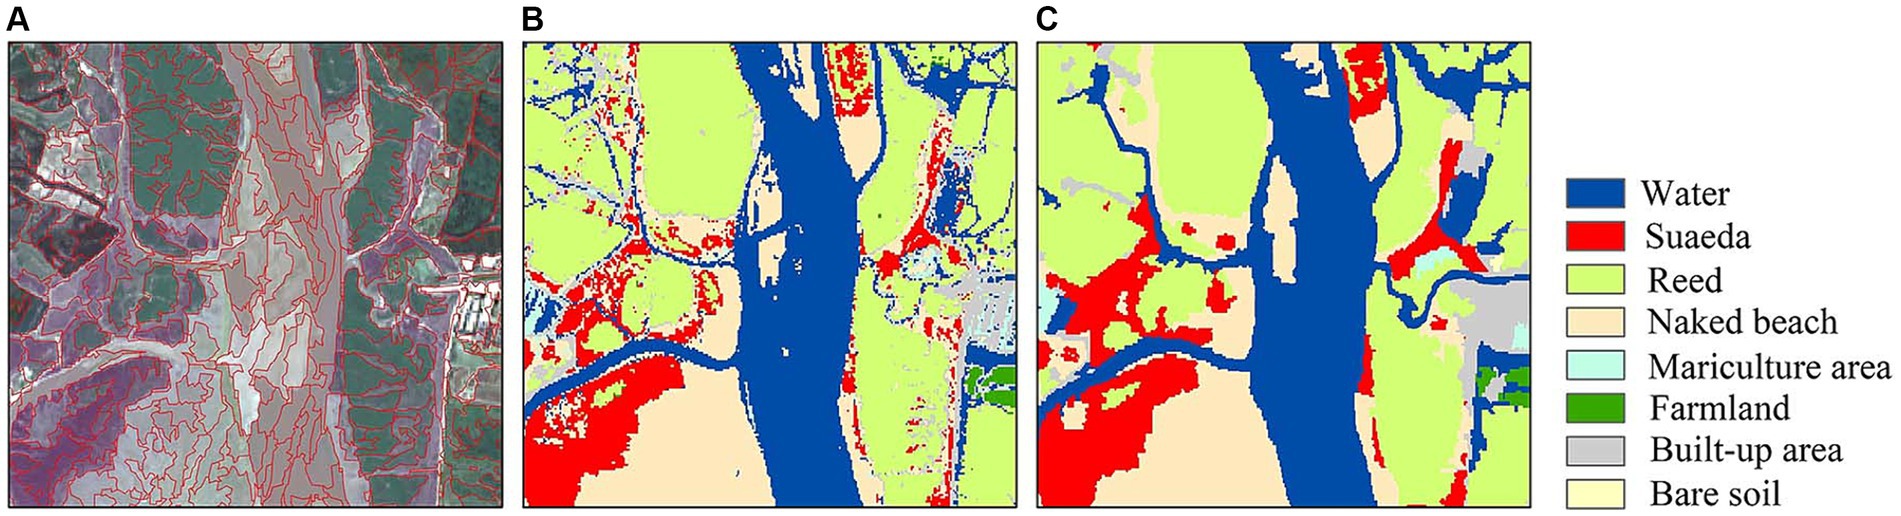
Figure 8. Comparison of two classification effects [(A) represents the SNIC segmentation result, and (B) represents the classification map obtained by RF classification using the selected feature set obtained from the RF-RFE model. (C) Represents the result of SNIC-RF classification by using majority voting method].
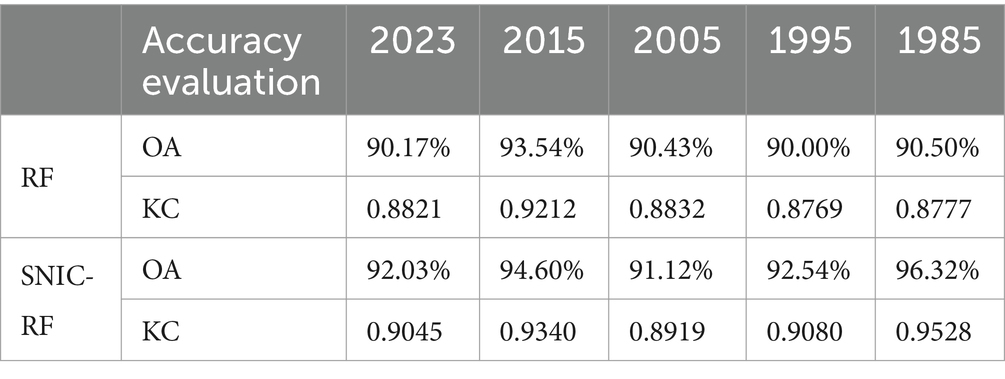
Table 3. Accuracy comparison of different classification methods.
The final classification results and accuracy verification of the study area obtained in this paper are shown in Figures 9, 10. During 1985–2023, the water area and reed area were relatively stable, and the distribution of the Suaeda was in the estuaries of the Daling River and the Liaohe River. The specific growth area changes greatly, and the farmland and mariculture area show a substantial increase. The overall accuracy of the classification is between 90 and 97%, and the Kappa coefficient is between 0.89 and 0.96. The user accuracy and producer accuracy of local objects are mostly higher than 85%, and the classification accuracy of water area and reed is the highest, while the classification accuracy of built-up area and bare soil is low, which is easy to mix with other land classes.
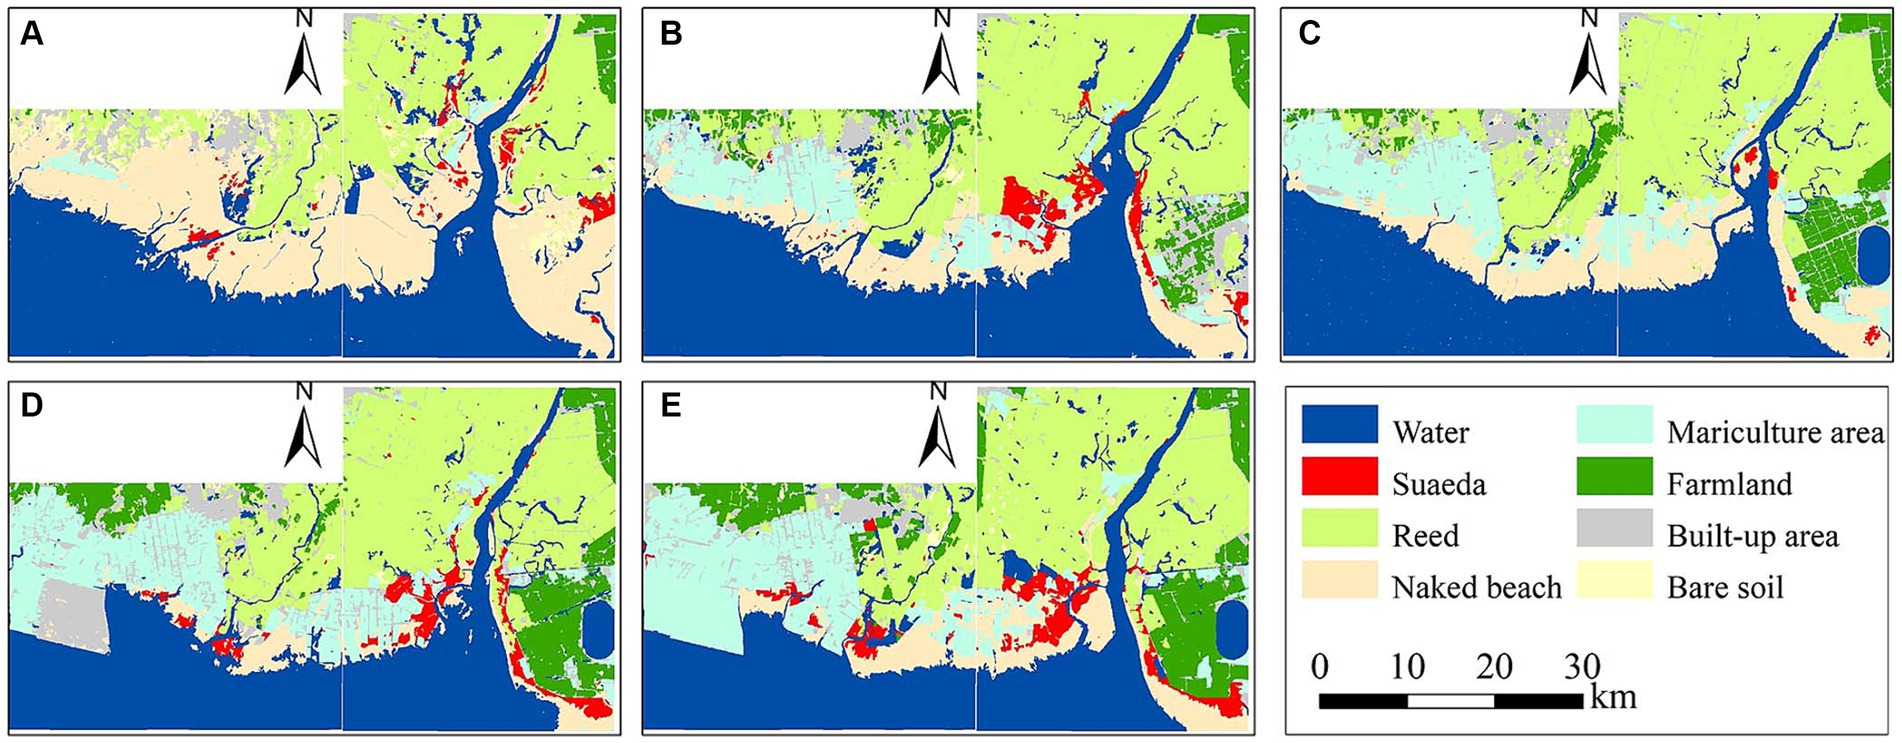
Figure 9. 1985 (A), 1995 (B), 2005 (C), 2015 (D), and 2023 (E) wetland classification map of Liaohe Estuary.
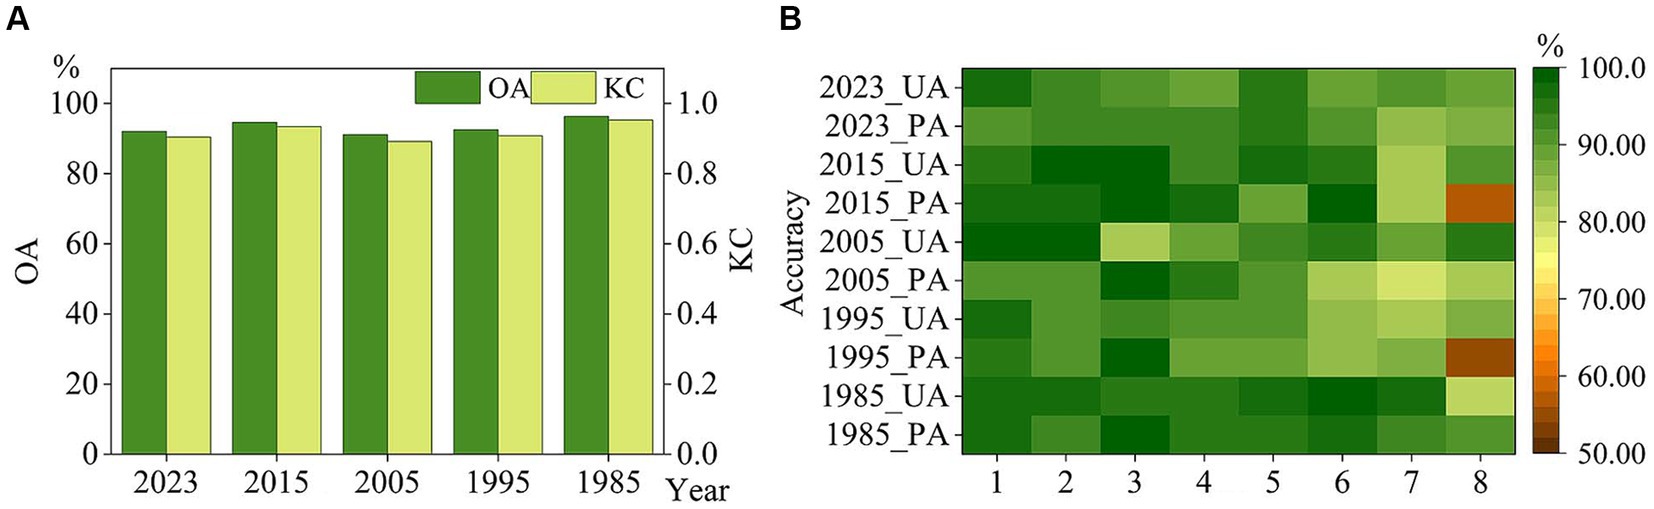
Figure 10. Accuracy and Kappa coefficient (A), PA and UA corresponding to ground objects (B) (1–8 represents, Water, Suaeda, Reed, Naked beach, Mariculture area, Farmland, Built-up area, Bare soil).
3.4 Wetland cover change in the Liaohe Estuary
From Figure 9 and Table 4, it can be seen that from 1985 to 1995, the mariculture area rapidly expanded from 12.16 km2 to 113.38km2, occupying the naked beach and reducing the area of the naked beach from 393.73km2 to 137.98km2. In 1990, the Liaohe Estuary damp-proof levees were built. Tidal flat siltation occurred on the west coast of the damp-resistant levees, and habitat changes resulted in a substantial increase in the community of Suaeda, from 20.62 km2 to 33.03km2, in the reed community, from 314.82km2 to 410.48km2. At the same time, farmland construction began on the east bank of the Liaohe River, and the area of farmland and built-up area increased significantly. The bare soil area is relatively reduced.
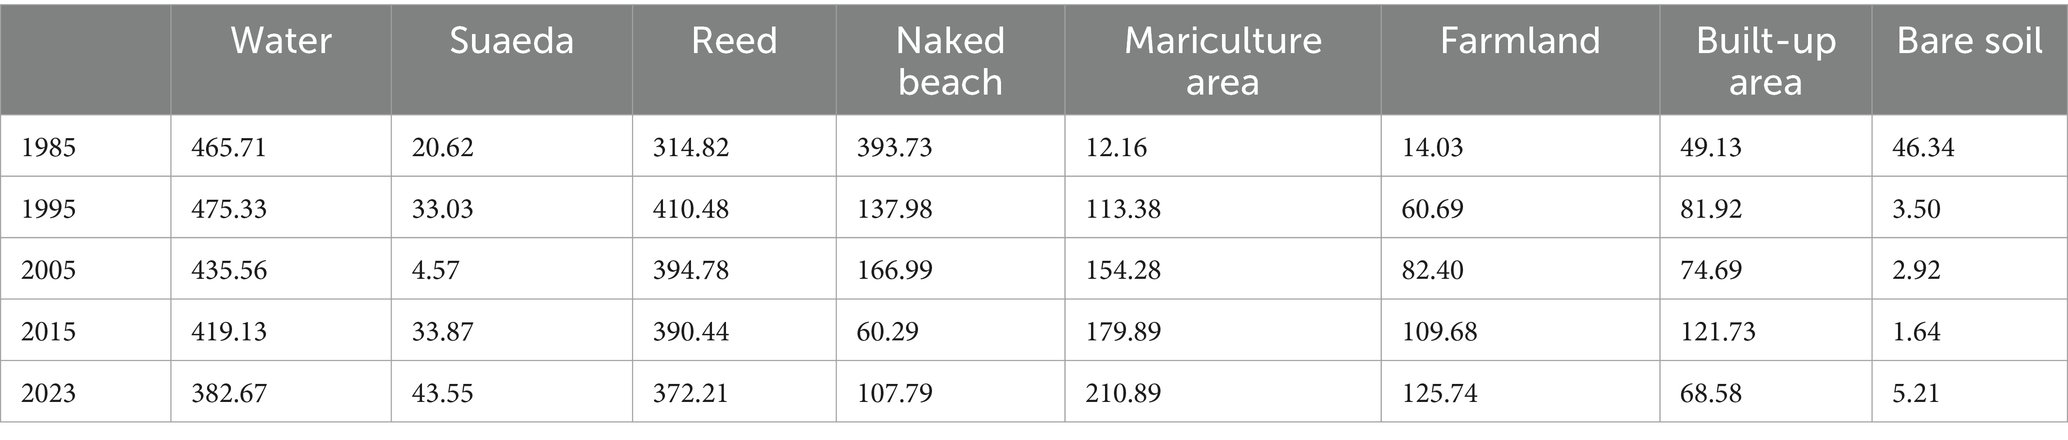
Table 4. The area of each wetland type in Liaohe Estuary wetland from 1985 to 2023 (km2).
From 1995 to 2005, the coastal mariculture area continued to expand to 154.28km2, and when the construction of farmland and a delta reservoir on the east bank of the Liaohe River was completed, the farmland area increased from 60.69km2 to 82.40km2. In addition, under the interaction from runoff of the Liaohe River and tidal current, the sedimentary landform of the estuary developed significantly. The naked beach increased from 137.98km2 to 166.99km2. The dramatic changes in the estuarine environment caused the community of Suaeda to decrease to 4.57km2 and the reed to 394.78km2.
From 2005 to 2015, the mariculture area on the west bank of the Liaohe River further expanded to 179.89km2, and the area of the mariculture area under construction was large, which made the built-up area increase from 74.69km2 to 121.73km2, and the farmland area continued to increase to 109.68km2. The engineering construction changed the hydrodynamic characteristics of the Liaohe Estuary, resulting in accelerated siltation and elevation of the topography, and the emergence of a community of Suaeda on the island. The area of Suaeda increased from 4.57km2 to 33.87km2, and the area of the naked beach decreased from 166.99km2 to 60.29km2.
From 2015 to 2023, the construction of the mariculture area on the west bank of the Daling River was completed, the built-up area was reduced, and the mariculture area increased to 210.89km2. Part of the old mariculture area on the west bank of the Liaohe Estuary stopped mariculture activities, no more water was added, then converted back to the naked beach with the growth of Suaeda, and the area of the naked beach increased from 60.29km2 to 107.79km2. In addition, the farmland area continued to increase to 125.74km2, and the reed area decreased slightly from 390.44km2 to 372.21km2.
According to Figure 11, the main conversion types between 1985 and 2023 are from natural wetlands to constructed wetlands and non-wetland types, which are mainly naked beach to mariculture area, naked beach to farmland and built-up area, and reed to farmland. Part of the mariculture area or farmland under construction will be identified as built-up area, that is, to achieve the transformation of naked beach - built-up area - mariculture area/farmland. In conclusion, under the influence of the expansion of the mariculture area, the construction of a moisture-proof dam, and the reclamation of sea ports, the landscape near the coasts of the Daling River and Liao River has undergone major changes from 1985 to 2023. The water and reed remained stable and changed little, the changes are mainly concentrated in the coastal mariculture area, farmland, and built-up area. The growth area of Suaeda also changed with the construction of engineering and the accumulation of silt in the shoal. The area of constructed wetlands in the study area showed an increasing trend, an increase of 310.44 km2, the area of natural wetlands showed a decreasing trend, a decrease of 288.66 km2, and the area of non-wetlands decreased by 21.68 km2. In recent years, this change has tended to be gentle. This is due to the “retire and return to wet “project carried out in Panjin City in 2018, as well as the protection and development of the estuary and coast by the state and the formulation of stricter policies.
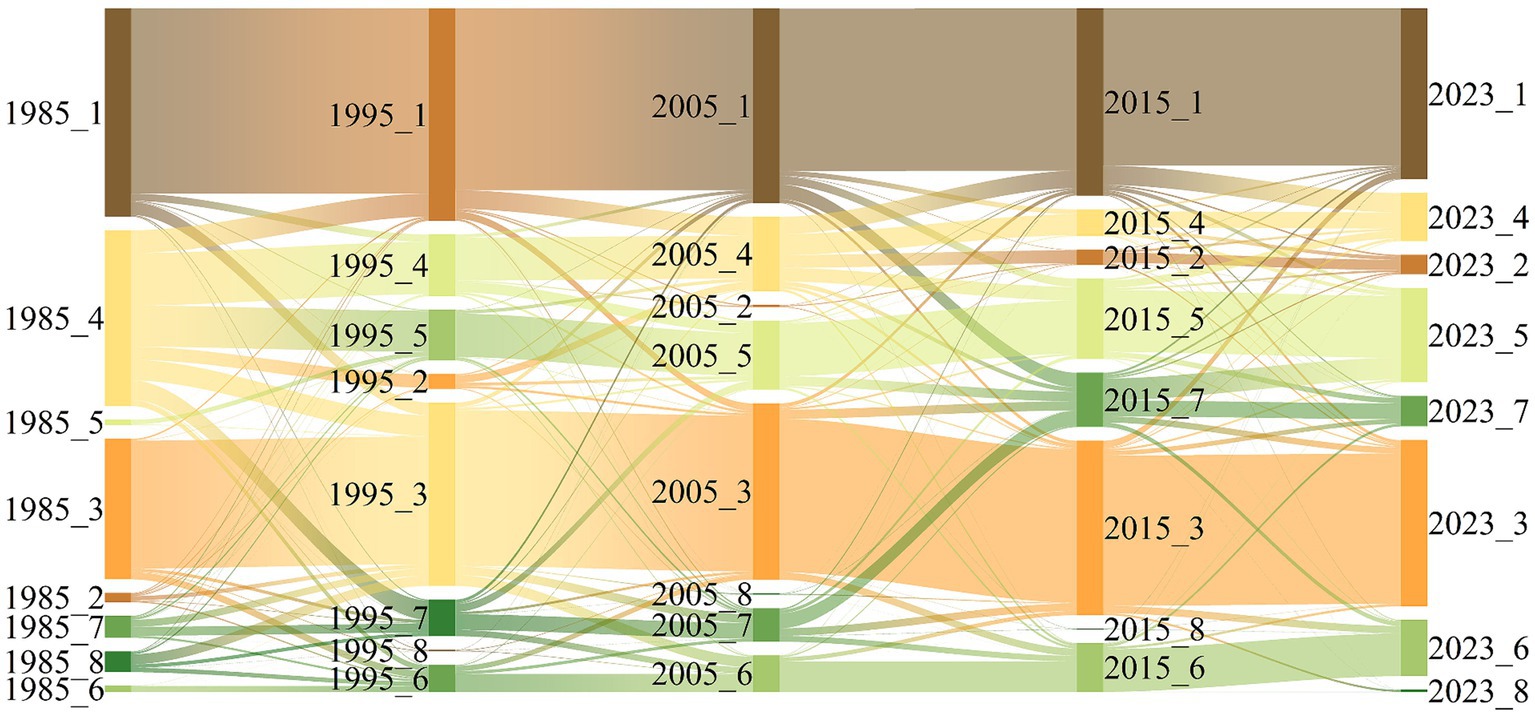
Figure 11. Sangji map of wetland type change in Liaohe Estuary from 1985 to 2023 (1–8 represents, Water, Suaeda, Reed, Naked beach, Mariculture area, Farmland, Built-up area, Bare soil).
4 Discussion
4.1 The coupling of sample migration and feature selection
In order to improve the efficiency and accuracy of long-term wetland mapping, this paper proposes a long-term coastal wetland classification method based on sample migration and feature selection from three aspects: the selection of training samples, the extraction of remote sensing features, and the development and selection of classification algorithms. This algorithm adeptly captures spectral variations among wetland categories by computing Euclidean Distance (ED) and Spectral Angular Distance (SAD). These metrics are integrated within a comprehensive change detection framework to leverage their respective strengths. The automatic threshold segmentation method OTSU was adopted to determine the threshold to reduce the uncertainty of manual intervention. Sample migration greatly improves the efficiency of sample set acquisition and reduces the workload of manual interpretation. At the same time, in the process of rigorous sample set production and migration, combined with feature selection, samples are classified into different types of remote sensing index thresholds for screening, which, to a certain extent, improve the accuracy of sample migration, make the sample acquisition basis, ensure the reliability of sample quality, and further improve the accuracy of wetland classification.
Multi-feature combinations can greatly improve classification accuracy, but high-dimensional features can reduce the efficiency of classification models. For feature selection using the wrapper method RF-RFE model, RF is able to capture nonlinear relationships and interactions between features, which is advantageous when dealing with complex data sets, and RFE helps to identify a compact set of features that collectively contribute the most to predictive performance. RF-RFE can reveal not only the importance of individual features but also how they interact, giving insight into the relationships in the data set. The top three advantage indices, DVI_10, NWI_10, and greenness_10, were concentrated in October, and the time range of sample migration was also selected around October. A total of 25 features were selected. In the last, the vegetation index DVI, GNDVI, and water index NDWI, TWI, and EWI constructed in RGB, near-infrared, and short-wave infrared contributed a lot to wetland classification.
4.2 Coastal wetland classification supported by GEE
GEE has significant advantages in classifying coastal wetlands over long time series, storing and analyzing RS images based on pyramid and tiling concepts such that each image has its own pyramid at different pixel resolutions, and in addition, each tool used in GEE processes images on 256 × 256 tiles. Therefore, the different scales of the pyramid are used for different zoom levels, and can simultaneously process data from multiple sensors, multiple bands, and multiple time points, supporting the visual processing and analysis of a large range of regions and long time series.
The built-in segmentation algorithm and classification algorithm of GEE are widely used in remote sensing image analysis. In the SNIC-RF classification method used in this paper, the superpixels generated by SNIC provide visual interpretable segmentation that adapts to local image features, so that it can effectively deal with spatial variability in data. Using a majority voting method that intersects the results of pixel-based classification with object-based classification can help mitigate the effects of misclassified pixels in the segmentation patch unit. Instead of relying solely on the classification of individual pixels, the majority of categories in each object are considered, resulting in more robust results that allow wetland classification results to provide a more comprehensive representation of the landscape. At the same time, all operations on the GEE platform are automatically executed in batch parallel on the Google CPU and GPU; the complexity of parallel computing is hidden due to the automation in this process; and implementing wetland classification makes the method framework more operable, giving it great potential for practical applications elsewhere.
4.3 Limitation and prospects
In this paper, the production of training samples, the use of transfer methods, and the verification of results are strictly controlled, but there are still some uncertainties. For example, when training samples are obtained through visual interpretation of high-resolution drone images and Sentinel-2 images, certain errors may be introduced; When setting migration rules for sample migration, it is also possible to introduce some errors into the migrated samples. Such errors will directly lead to occasional misclassifications in the final classification result. In the feature selection algorithm, the effectiveness of RF-RFE depends on the features of the data set and the specific classification task, and other feature selection methods and parameters can be considered according to the nature of the data and the modeling goal. And in the process of wetland classification, SNIC hyperpixel segmentation results are sensitive to changes in compactness parameters, and finding the right balance point is crucial for achieving meaningful hyperpixels.
In addition, to fully understand the complex dynamic changes of the wetland under the influence of natural and human factors in the past 38 years, the Landsat data with the longest time series was selected in this study, which also made the data resolution need to be improved. To further enhance the accuracy of wetland mapping, the following studies should consider using hyperspectral (such as MODIS, etc.), high-resolution (such as GF-1, GF-2, etc.) satellite images, or multi-source data fusion and coordination of active and passive images. The improvement of the classification accuracy of wetlands can also correspondingly refine the classification system of wetlands, such as water bodies that can be divided into rivers, sea areas, reservoirs, and other types. Under the refined wetland classification system, more research content on coastal wetlands can be deeply discussed from macro to micro and combined with multi-scale perspectives, such as ecosystem quality and service assessment, biodiversity assessment, coupled hydrological, ecological, meteorological, soil, and environmental models to predict the degradation trend of coastal wetlands, and wetland ecosystem restoration and reconstruction.
5 Conclusion
In this study, the coastal wetland of Liaohe Estuary was taken as the research object, and a wetland classification method combining sample migration method, feature selection algorithm and machine learning was proposed to study the dynamic changes of wetland and promote wetland protection decision-making. The results show that: Combined with the sample migration method of RF-RFE feature selection and CVA change detection, the changes between reference year and target year were captured from the perspective of spectral distance and dominant feature variables. The OA of the sample point set classification in the target year was between 87 and 94%. It can be used as a potential solution to the shortage of training samples for wetland monitoring applications. With the support of the GEE cloud platform, spectral and spatial information can be integrated by combining the majority voting classification results of SNIC and RF models. Compared with the single RF classification result, the classification accuracy of OA increased by 0.69–5.82%. During the period from 1985 to 2023, the wetland landscape of Liaohe Estuary has undergone drastic changes under the influence of reclamation projects, mainly manifested as the transformation from natural wetland to constructed wetland. In recent years, under the protection policy of wetland, the change of wetland has gradually slowed down.
Overall, this study provides technical support for wetland ecological protection and sustainable development management and can also be applied to other types of wetlands, providing a new idea for large-scale wetland mapping in the future. At the same time, based on this study, multiple applications of coastal wetlands can be further explored in the future. For example, excavating the driving factors of wetland dynamic change, assessing wetland ecosystem service functions and ecological risks, carrying out ecological zoning, and building ecological corridors for ecological restoration and protection. These research directions can provide important information for wetland ecosystem management and promote the implementation of sustainable development goals.
Data availability statement
The original contributions presented in the study are included in the article/Supplementary material, further inquiries can be directed to the corresponding author.
Author contributions
LK: Writing – review & editing, Supervision, Resources, Project administration, Investigation, Formal analysis, Data curation, Conceptualization. QT: Writing – original draft, Visualization, Validation, Software, Formal analysis, Data curation, Conceptualization. YL: Writing – review & editing, Supervision. QW: Writing – review & editing, Resources, Project administration, Investigation, Funding acquisition, Formal analysis. GZ: Writing – review & editing, Resources, Project administration, Investigation, Funding acquisition. YZ: Writing – review & editing. LW: Writing – review & editing.
Funding
The authors declare that financial support was received for the research, authorship, and/or publication of this article. This research was funded by the National Natural Science Foundation of China (No. 42076222, No. 42276231, No. 42201070), a Sub-project of the National Key Research and Development Program of China (No. 2022YFC3106101), and the Social Science Federation Project of Liaoning Province (No. 2024lslybkt-038).
Acknowledgments
We would like to express our sincere gratitude to the editor and referees for their insightful and constructive comments.
Conflict of interest
The authors declare that the research was conducted in the absence of any commercial or financial relationships that could be construed as a potential conflict of interest.
Publisher’s note
All claims expressed in this article are solely those of the authors and do not necessarily represent those of their affiliated organizations, or those of the publisher, the editors and the reviewers. Any product that may be evaluated in this article, or claim that may be made by its manufacturer, is not guaranteed or endorsed by the publisher.
Supplementary material
The Supplementary material for this article can be found online at: https://www.frontiersin.org/articles/10.3389/ffgc.2024.1406473/full#supplementary-material
References
Belgiu, M., and Drăguţ, L. (2016). Random forest in remote sensing: a review of applications and future directions. ISPRS J. Photogramm. Remote Sens. 114, 24–31. doi: 10.1016/j.isprsjprs.2016.01.011
Chen, K., Cong, P., Qu, L., Liang, S., Sun, Z., and Han, J. (2023). Biological connectivity and its driving mechanisms in the liaohe delta wetland, China. Ecol. Inform. 76:102028. doi: 10.1016/j.ecoinf.2023.102028
Chowdhury, A. R., Hazra, J., and Dutta, P. (2017). “A hybrid approach for band selection of hyperspectral images” in Hybrid intelligence for image analysis and understanding. eds. S. Bhattacharyya, I. Pan, A. Mukherjee, and P. Dutta (New York, NY: Wiley).
Cui, L., Zhang, J., Wu, Z., Xun, L., Wang, X., and Zhang, S. (2023). Superpixel segmentation integrated feature subset selection for wetland classification over yellow river delta. Environ. Sci. Pollut. Res. Int. 30, 50796–50814. doi: 10.1007/s11356-023-25861-5
Dong, Q., Bai, S., Wang, Z., Zhao, X., Yang, S., and Ren, N. (2023). Virtual sample generation empowers machine learning-based effluent prediction in constructed wetlands. J. Environ. Manag. 346:118961. doi: 10.1016/j.jenvman.2023.118961
Effrosynidis, D., and Arampatzis, A. (2021). An evaluation of feature selection methods for environmental data. Ecol. Inform. 61:101224. doi: 10.1016/j.ecoinf.2021.101224
Eskandari Damaneh, H., Khosravi, H., Habashi, K., Eskandari Damaneh, H., and Tiefenbacher, J. P. (2022). The impact of land use and land cover changes on soil erosion in western Iran. Nat Hazards (Dordr) 110, 2185–2205. doi: 10.1007/s11069-021-05032-w
Fekri, E., Latifi, H., Amani, M., and Zobeidinezhad, A. (2021). A training sample migration method for wetland mapping and monitoring using sentinel data in google earth engine. Remote Sens. 13:4169. doi: 10.3390/rs13204169
Ghorbanian, A., Kakooei, M., Amani, M., Mahdavi, S., Mohammadzadeh, A., and Hasanlou, M. (2020). Improved land cover map of Iran using sentinel imagery within google earth engine and a novel automatic workflow for land cover classification using migrated training samples. ISPRS J. Photogramm. Remote Sens. 167, 276–288. doi: 10.1016/j.isprsjprs.2020.07.013
Guo, M., Li, J., Sheng, C., Xu, J., and Wu, L. (2017). A review of wetland remote sensing. Sensors (Basel) 17:777. doi: 10.3390/s17040777
Hemati, M. A., Hasanlou, M., Mahdianpari, M., and Mohammadimanesh, F. (2021). Wetland mapping of northern provinces of Iran using sentinel-1 and sentinel-2 in google earth engine. IGARSS 2021 - 2021 IEEE International Geoscience and Remote Sensing.
Hu, Y., Xu, X., Wu, F., Sun, Z., Xia, H., and Meng, Q. (2020). Estimating forest stock volume in Hunan province, China, by integrating in situ plot data, sentinel-2 images, and linear and machine learning regression models. Remote Sens. 12:186. doi: 10.3390/rs12010186
Jiang, T., Pan, J., Pu, X., Wang, B., and Pan, J. (2015). Current status of coastal wetlands in China: degradation, restoration, and future management. Estuar. Coast. Shelf Sci. 164, 265–275. doi: 10.1016/j.ecss.2015.07.046
Jie, L., and Wang, J. (2024). Research on the extraction method of coastal wetlands based on sentinel-2 data. Mar. Environ. Res. 198:106429. doi: 10.1016/j.marenvres.2024.106429
Khalid, S., Khalil, T., and Nasreen, S. (2014). A survey of feature selection and feature extraction techniques in machine learning. 2014 Science and Information Conference.
Lin, N., Zhang, D., Feng, S., Ding, K., Tan, L., and Wang, B. (2023). Rapid landslide extraction from high-resolution remote sensing images using shap-opt-xgboost. Remote Sens. 15:3901. doi: 10.3390/rs15153901
Liu, D., Chen, N., Zhang, X., Wang, C., and Du, W. (2020). Annual large-scale urban land mapping based on landsat time series in google earth engine and openstreetmap data: a case study in the middle yangtze river basin. ISPRS J. Photogramm. Remote Sens. 159, 337–351. doi: 10.1016/j.isprsjprs.2019.11.021
Peng, K., Jiang, W., Hou, P., Wu, Z., and Cui, T. (2024). Detailed wetland-type classification using landsat-8 time-series images: a pixel-and object-based algorithm with knowledge (pok). Gisci Remote Sens. 61:2293525. doi: 10.1080/15481603.2023.2293525
Rahman, S., and Mesev, V. (2019). Change vector analysis, tasseled cap, and ndvi-ndmi for measuring land use/cover changes caused by a sudden short-term severe drought: 2011 Texas event. Remote Sens. 11:2217. doi: 10.3390/rs11192217
Ramezan, C. A. (2022). Transferability of recursive feature elimination (rfe)-derived feature sets for support vector machine land cover classification. Remote Sens. 14:6218. doi: 10.3390/rs14246218
Rodriguez-Galiano, V. F., Ghimire, B., Rogan, J., Chica-Olmo, M., and Rigol-Sanchez, J. P. (2012). An assessment of the effectiveness of a random forest classifier for land-cover classification. ISPRS J. Photogramm. Remote Sens. 67, 93–104. doi: 10.1016/j.isprsjprs.2011.11.002
Shafiee, S., Lied, L. M., Burud, I., Dieseth, J. A., Alsheikh, M., and Lillemo, M. (2021). Sequential forward selection and support vector regression in comparison to lasso regression for spring wheat yield prediction based on uav imagery. Comput. Electron. Agric. 183:106036. doi: 10.1016/j.compag.2021.106036
Sung, J., Han, S., Park, H., Hwang, S., Lee, S. J., and Park, J. W. (2022). Classification of stroke severity using clinically relevant symmetric gait features based on recursive feature elimination with cross-validation. Ieee Access 10, 119437–119447. doi: 10.1109/ACCESS.2022.3218118
Tassi, A., and Vizzari, M. (2020). Object-oriented lulc classification in google earth engine combining snic, glcm, and machine learning algorithms. Remote Sens. 12:3776. doi: 10.3390/rs12223776
Wang, M., Mao, D., Wang, Y., Song, K., Yan, H., and Jia, M. (2022). Annual wetland mapping in metropolis by temporal sample migration and random forest classification with time series landsat data and google earth engine. Remote Sens. 14:3191. doi: 10.3390/rs14133191
Wang, M., Mao, D., Wang, Y., Xiao, X., Xiang, H., and Feng, K. (2023). Wetland mapping in east asia by two-stage object-based random forest and hierarchical decision tree algorithms on sentinel-1/2 images. Remote Sens. Environ. 297:113793. doi: 10.1016/j.rse.2023.113793
Wang, G., Meng, D., Chen, R., Yang, G., Wang, L., and Jin, H. (2024). Automatic rice early-season mapping based on simple non-iterative clustering and multi-source remote sensing images. Remote Sens. 16:277. doi: 10.3390/rs16020277
Wang, F., Tang, J., Ye, S., and Liu, J. (2021). Blue carbon sink function of chinese coastal wetlands and carbon neutrality strategy. Bull. Chin. Acad. Sci. 36, 241–251. doi: 10.16418/j.issn.1000-3045.20210215101
Xing, H., Niu, J., Feng, Y., Hou, D., Wang, Y., and Wang, Z. (2023). A coastal wetlands mapping approach of yellow river delta with a hierarchical classification and optimal feature selection framework. Catena (Amst) 223:106897. doi: 10.1016/j.catena.2022.106897
Xu, H., Wang, Y., Guan, H., Shi, T., and Hu, X. (2019). Detecting ecological changes with a remote sensing based ecological index (rsei) produced time series and change vector analysis. Remote Sens. 11:2345. doi: 10.3390/rs11202345
Ye, S., Rogan, J., Zhu, Z., and Eastman, J. R. (2021). A near-real-time approach for monitoring forest disturbance using landsat time series: stochastic continuous change detection. Remote Sens. Environ. 252:112167. doi: 10.1016/j.rse.2020.112167
Yu, L., Du, Z., Dong, R., Zheng, J., Tu, Y., and Chen, X. (2022). From-glc plus: toward near real-time and multi-resolution land cover mapping. Gisci Remote Sens. 59, 1026–1047. doi: 10.1080/15481603.2022.2096184
Zhang, S., Tang, D., Li, N., Jia, X., and Jia, S. (2022). Superpixel-guided variable gabor phase coding fusion for hyperspectral image classification. IEEE Trans. Geosci. Remote Sens. 60, 1–16. doi: 10.1109/TGRS.2022.3151875
Zhang, Y., Yu, W., Ji, R., Zhao, Y., Feng, R., and Jia, Q. (2021). Dynamic response of phragmites australis and suaeda salsa to climate change in the liaohe delta wetland. J. Meteorol. Res. 35, 157–171. doi: 10.1007/s13351-021-0016-3
Zhao, G., Wang, L., Zheng, J., Tuerxun, N., Han, W., and Liu, L. (2023). Optimized extraction method of fruit planting distribution based on spectral and radar data fusion of key time phase. Remote Sens. 15:4140. doi: 10.3390/rs15174140
Zhou, R., Yang, C., Li, E., Cai, X., Yang, J., and Xia, Y. (2021). Object-based wetland vegetation classification using multi-feature selection of unoccupied aerial vehicle rgb imagery. Remote Sens. 13:4910. doi: 10.3390/rs13234910
Keywords: Liaohe Estuary, coastal wetland classification, sample migration, feature selection, Google Earth Engine, simple non-iterative clustering
Citation: Ke L, Tan Q, Lu Y, Wang Q, Zhang G, Zhao Y and Wang L (2024) Classification and spatio-temporal evolution analysis of coastal wetlands in the Liaohe Estuary from 1985 to 2023: based on feature selection and sample migration methods. Front. For. Glob. Change. 7:1406473. doi: 10.3389/ffgc.2024.1406473
Edited by:
Mingming Jia, Chinese Academy of Sciences (CAS), ChinaCopyright © 2024 Ke, Tan, Lu, Wang, Zhang, Zhao and Wang. This is an open-access article distributed under the terms of the Creative Commons Attribution License (CC BY). The use, distribution or reproduction in other forums is permitted, provided the original author(s) and the copyright owner(s) are credited and that the original publication in this journal is cited, in accordance with accepted academic practice. No use, distribution or reproduction is permitted which does not comply with these terms.
*Correspondence: Quanming Wang, cW13YW5nQG5tZW1jLm9yZy5jbg==