 Horia Gabriel Olariu
 Bradford P. Wilcox
 Sorin C. Popescu
94% of researchers rate our articles as excellent or good
Learn more about the work of our research integrity team to safeguard the quality of each article we publish.
Find out more
ORIGINAL RESEARCH article
Front. For. Glob. Change, 21 June 2024
Sec. Forest Growth
Volume 7 - 2024 | https://doi.org/10.3389/ffgc.2024.1396999
This article is part of the Research TopicMonitoring Long-Term Forest Growth and Dynamics at Various Spatial Scales Using Remote Sensing ApproachesView all 3 articles
Savanna ecosystems across the globe have experienced substantial changes in their vegetation composition. These changes can be attributed to three main processes: (1) encroachment, which refers to the expansion of woody plants into open areas, (2) thicketization, which is characterized by the growth of sub-canopy woody plants, and (3) disturbance, defined here as the removal of woodland cover due to both natural forces and human activities. In this study, we utilized Landsat surface reflectance data and Sentinel-1 SAR data to track the progression of these process from 1996 to 2022 in the significantly modified Post Oak Savannah ecoregion of Central Texas. Our methodology employs an ensemble classification algorithm, which combines the results of multiple models, to develop a more precise predictive model, along with the spectral–temporal segmentation algorithm LandTrendr in Google Engine (GEE). Our ensemble classification algorithms demonstrated high overall accuracies of 94.3 and 96.5% for 1996 and 2022, respectively, while our LandTrendr vegetation map exhibited an overall accuracy of 80.4%. The findings of our study reveal that 9.7% of the overall area experienced encroachment of woody plants into open area, while an additional 6.8% of the overall area has transitioned into a thicketized state due to the growth of sub-canopy woody plants. Furthermore, 5.7% of the overall area encountered woodland disturbance leading to open areas. Our findings suggest that these processes advanced unevenly throughout the region, resulting in the coexistence of three prominent plant communities that appear to have long-term stability: a dense deciduous shrubland in the southern region, as well as a thicketized oak woodland and open area mosaic in the central and northern regions. The successional divergence observed in these plant communities attests to the substantial influence of human modification on the landscape. This study demonstrates the potential of integrating passive optical multispectral data and active SAR data to accurately map large-scale ecological processes.
Savanna ecosystems hold significant value, as they encompass ~20% of the Earth's land surface and contribute to 30% of terrestrial net primary production (NPP) (Grace et al., 2006). Savanna ecosystems are home to ~20% of the global population and support a significant portion of the world's ranching livestock (Scholes and Archer, 1997). However, the conservation of these ecosystems is often overlooked because accurately defining and characterizing them is challenging. Savannas exhibit remarkable diversity in that they may be dominated by either woody or herbaceous plant species; typically, those having low percentages of woody cover are classified as grasslands, and those having high percentages of woody cover are classified as closed-canopy woodlands (Fowler and Beckage, 2019). This results in conservation efforts that aim to either afforest or deforest natural savannas to better align with their classification.
Savannas are predominantly found in tropical regions, and most of the research on savannas has been conducted in Africa, South America, and Australia (Lehmann et al., 2014). The diverse collections of open-canopy savannas in subtropical and temperate regions have received comparatively little attention, despite the fact that these ecosystems exhibit more distinct characteristics than their tropical counterparts. It is estimated that across North America, there exist thirteen distinct types of savannas—six which are found in the state of Texas (Fowler and Beckage, 2019). Many of the open-canopy savanna ecosystems in Texas have undergone a process of woody plant encroachment (WPE), resulting in their transformation to shrublands or woodlands. This WPE can be attributed to various factors including the expansion of human settlements over the past 150 years, intensive grazing practices, and the suppression of natural fire regimes (Van Auken, 2009; Sala and Maestre, 2014; Pyne, 2016; Stevens et al., 2016). Furthermore, WPE can be categorized into two distinct forms, encroachment and thicketization. Encroachment is characterized by the spread of woody vegetation into open areas primarily occupied by herbaceous species (Van Auken, 2009), while thicketization refers to the increase of understory woody evergreen species within deciduous woodlands (Leite et al., 2020) (Figure 1). Lastly, certain regions have experienced an opposing phenomenon known as disturbance, which refers to the loss of woodland coverage as a result of natural and/or human activities (Frolking et al., 2009) (Figure 1).
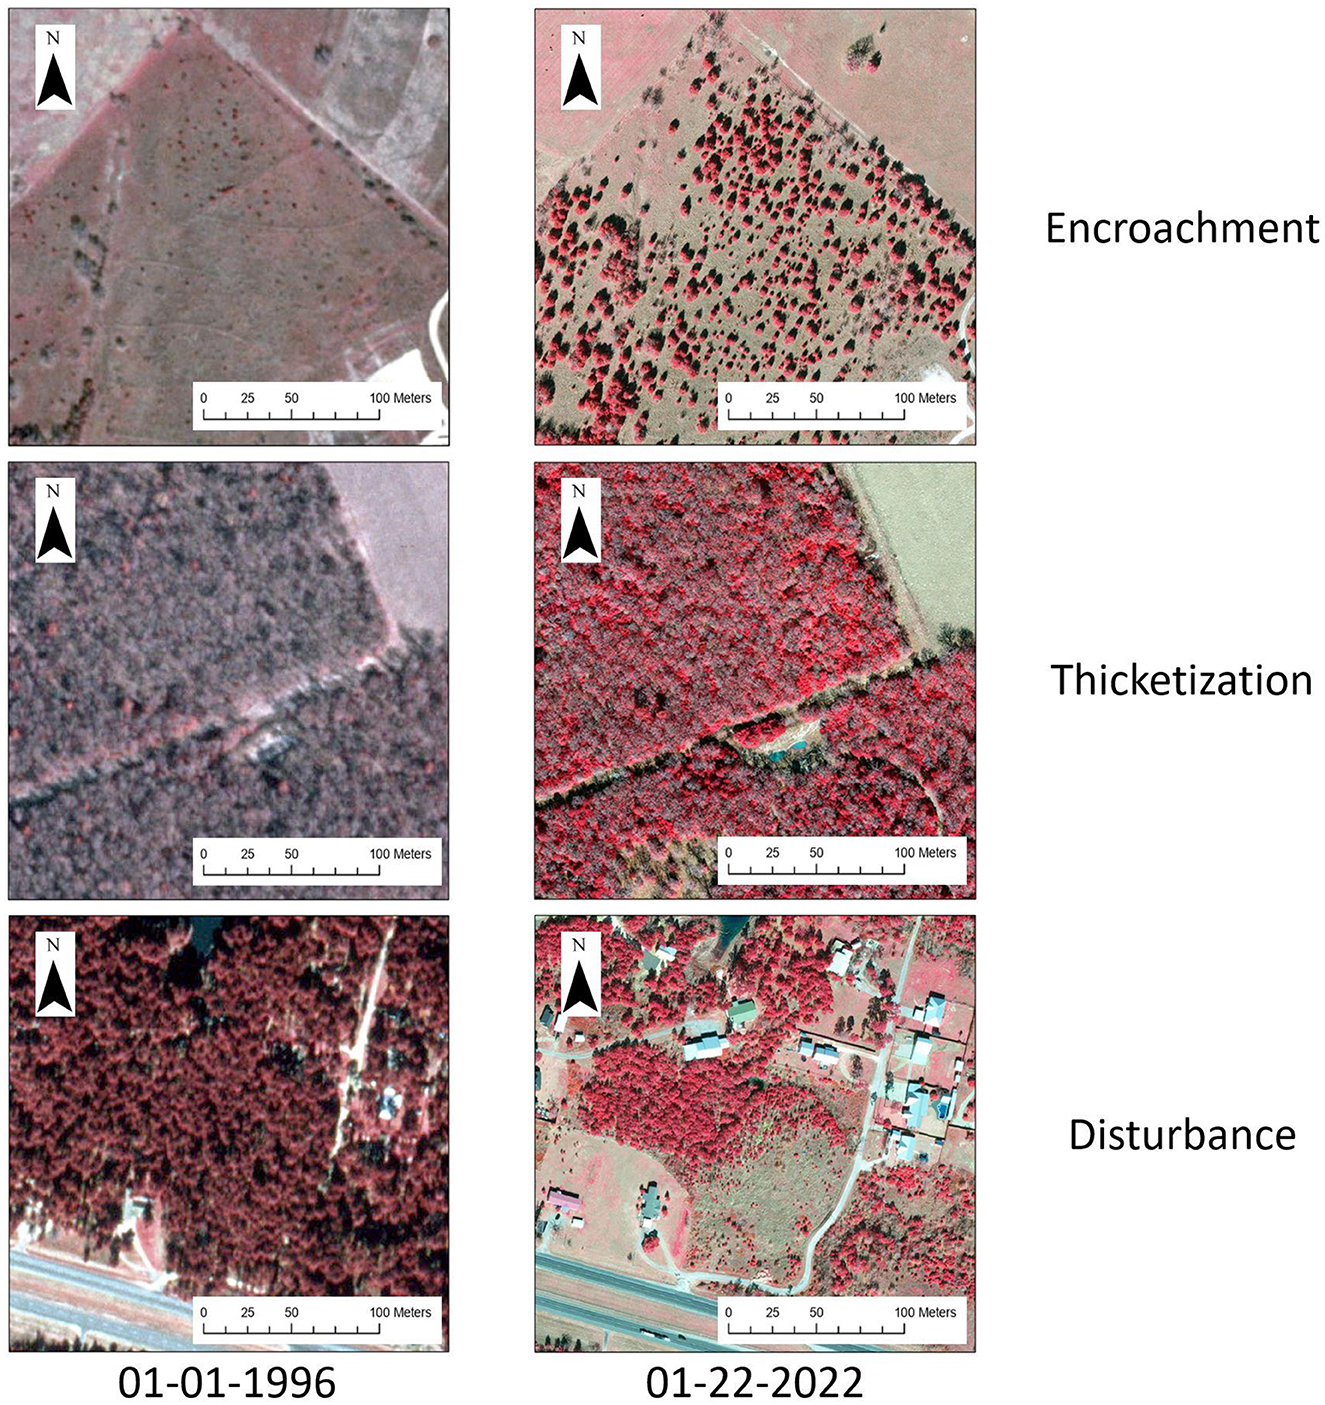
Figure 1. The 1996 images are presented in [Red(R): Near-Infrared (NIR), Green (G): Red, Blue (B): Green] and were captured by the Texas Orthoimagery Program (TOP) on January 1st, 1996, with a spatial resolution of 1 m. The images captured in 2022, displaying (R: NIR, G: Red, B: Green), were acquired by the Capital Area Council of Governments (CAPCOG) on January 22, 2022, with a spatial resolution of 30 cm. The encroachment instance at coordinates 96.2341011°W, 30.8000698°N exemplifies the proliferation of woody vegetation into open area. The example of thicketization (96.9604040°W, 30.3720750°N) demonstrates the growth of subcanopy woody plants (bright red trees) in a woodland that was previously dominated by deciduous oak trees (gray trees). The example of the Disturbance (97.2251174°W, 30.0711242°N) demonstrates the clearance of a previous evergreen/mixed woodland area.
Woody plant encroachment in the ecologically and climatically diverse savannas of Texas is a substantial, yet poorly understood component of the North American carbon budget (Barger et al., 2011). There is a significant transition from predominantly belowground biomass in open canopy savannas to aboveground biomass in thicketized closed canopy woodlands. However, a synthesis conducted by Zhou et al. (2023) has indicated that afforestation in savannas has minimal impact on soil organic carbon, thereby adding complexity to the dynamics of the carbon budget. Woody plant encroachment significantly influences the hydrological cycle by altering various components of the water budget equation, including precipitation, runoff, groundwater recharge, and evapotranspiration (Bonan, 2008; Eldridge et al., 2011, 2015; Wine et al., 2012; Leite et al., 2020; Zhou et al., 2023). Additionally, the frequency of fires has a significant impact on the ecological diversity of open-canopy savannas undergoing WPE (Brewer, 2023). During the initial phase of encroachment, there is a rapid decline in grassland dependent herbaceous species (Fuhlendorf et al., 2002; Lautenbach et al., 2016), although certain species may tolerate up to 15% coverage of woody plants (Archer, 2009).
To gain a comprehensive understanding of the ecological consequences of WPE in open canopy savannas, researchers necessitate precise and reliable land use and land cover (LULC) data from which the rate of conversion of open areas to closed-canopy woodlands can be calculated. LULC data is predominantly obtained via satellite imagery, the science of which is commonly referred to as satellite remote sensing. This method is widely recognized as the nexus between identifying distinguishable patterns on the Earth's surface and quantifying ecological impacts on a large scale (Zhu et al., 2022). Over the past decade, there have been significant technological advancements in sensor quality and big data retrieval algorithms. “Remote sensing satellites provide imagery that covers a wide range of wavelengths, including visible light, infrared radiation, and microwave radiation (Thies and Bendix, 2011). They have advanced to the point where they can estimate bio-geophysical parameters; according to Wu et al. (2019), remote sensing techniques are capable of quantifying 81 of the 142 parameters related to the atmosphere, oceans, and land surfaces as defined by the Global Climate Observing System (GCOS), including parameters such as evapotranspiration (Tang et al., 2015), soil moisture (Al-Yaari et al., 2019), and leaf area index (Xu et al., 2018).”
Previous research has indicated that the integration of synthetic aperture radar (SAR) with visible light imagery is highly advantageous in distinguishing between areas of vegetation dominated by trees and adjacent open areas (Huang et al., 2012; Wang et al., 2018, 2021; Shi et al., 2020; Yang et al., 2021; Lewis et al., 2022). From 2015 to 2017, Yang et al. (2021) employed the Phased Arrayed L-band Synthetic Aperture Radar-2 (PALSAR-2) instrument on board the Advanced Land Observing Satellite-2 (ALOS-2) in conjunction with Landsat 7/8 (surface reflectance) imagery to generate the first forest map (with a minimum tree height of 2 meters) for the Southern Great Plains region, at a 30-meter resolution, achieving accuracies as high as 99.2%. In a comparable investigation, Wang et al. (2018) employed PALSAR-2 and Landsat 5/7/8 (surface reflectance) imagery to delineate the intrusion of juniper woodlands into Oklahoma grasslands between the years 1984 and 2010, achieving accuracies between 89.1 and 96.0%. And Lewis et al. (2022), in their study conducted in the Brazilian Cerrado, employed a combination of Sentinel-1 SAR and Sentinel-2 (surface reflectance) imagery to map both native and non-native savanna vegetation. The overall classification accuracies achieved in their study ranged between 88.6 and 92.6%.
Other studies have demonstrated the effectiveness of machine learning (ML) algorithms in accurately classifying remotely sensed data for quantifying woodland cover over spatially extensive regions (Pal, 2005; Rogan et al., 2008; Camargo et al., 2019; Talukdar et al., 2020; Alshari et al., 2023). There has been a recent increase in interest in the utilization of sophisticated machine learning (ML) algorithms, including support vector machines (SVM), random forest (RF), and ensemble stacking algorithms. These algorithms demonstrate high efficacy when applied to tasks that involve structured and labeled data. Moreover, artificial neural networks (ANNs), which emulate the functioning of the human brain, are attracting interest due to their capacity to analyze unstructured data. In a semiarid Texas savanna, Olariu et al. (2022) employed RF, SVM, and a convolutional neural network (CNN) to map tree species encroachment using resampled UAV imagery, achieving overall accuracies exceeding 96% when compared to ground reference data. In a separate investigation carried out by Long et al. (2021) an ensemble stacking algorithm was utilized to analyze Sentinel-2 imagery to delineate eight distinct land cover classes within the Dongting Lake wetland in central China, achieving accuracies exceeding 94% when compared to high resolution imagery and the Copernicus Global Land Cover Layers- Collection 2 (Buchhorn et al., 2020). Finally, Ge et al. (2019) used an ANN to analyze Sentinel-1 SAR data for the purpose of mapping different land cover types in a Mediterranean savanna ecosystem. The study reported an overall accuracy rate of 90% when compared to randomly selected testing data collected using high resolution imagery.
This research is conducted within the Post Oak Savannah ecoregion located in Central Texas. This ecoregion, which extends across a vast area (over 55,000 km2, stretching from the southern to the eastern parts of the state), has undergone significant transformations since the arrival of European settlers in the early 19th century (Griffith et al., 2007). As a consequence, these ecosystems have become mere remnants of their former bounty, both in extent and ecological function. Most of the Post Oak Savannah ecoregion is located within the Carrizo–Wilcox (CW) aquifer recharge zone, which extends from the southern region of Texas to the northeastern parts of Louisiana and Arkansas. The aquifer underlying this zone serves as a water source for more than 66 counties, making it the third most important aquifer in Texas (Hutchison, 2009; Huang et al., 2012). However, the growing human population and consequent increase in water demands have led to a decline in the CW aquifer's water levels, and WPE has been identified as a contributing factor (Moore et al., 2012). A study conducted by Basant et al. (2023) in the CW aquifer determined recharge of groundwater is minimal under thicketized oak woodland stands, whereas recharge rates of 3–18 cm/year was found for open areas. The study also found a higher probability of water infiltration into the soil surface in open areas, with instances of sub-surface saturation observed exclusively in open areas and never in woodlands.
Based on qualitative anecdotal evidence (Campbell, 1925; Tharp, 1926; McBride, 1933; Parmalee, 1955; Garza and Blackburn, 1985; Midwood et al., 1998; Singhurst et al., 2004; Griffith et al., 2007; Stambaugh et al., 2011), the Post Oak Savannah ecoregion has experienced a substantial transformation in land cover over the past century. Nevertheless, the absence of a quantitative evaluation has not yet provided support for these assertions, thus indicating a gap in research. Hence, considering the documented alteration in land patterns during the precious decades, along with WPE, the Post Oak Savannah ecoregion has established favorable circumstances for the utilization of modern remote sensing techniques to quantitatively evaluate the extent of change in land cover.
The objective of our study is to comprehensively analyze the temporal changes in land cover within the Post Oak Savannah from 1996 to 2022, employing a range of remote sensing methodologies. Specifically, we aim to characterize the three primary processes of change— namely, encroachment, thicketization, and disturbance—as illustrated in Figure 1. Our research methodologies consists of five fundamental steps: (1) Integration of data from multiple sources, including surface reflectance, SAR, geophysical data, and the Landsat derivative product known as RAP. (2) Processing of the data, using the Google Earth Engine (GEE) platform. This involves an ensemble stacking algorithm that utilizes multiple base-learning ML classifications, to facilitate identification of land cover types for both the years 1996 and 2022. (3) Change detection analysis, to obtain data on land cover change between 1996 and 2022. (4) Implementation of the LandTrendr algorithm, to generate a map illustrating the changes in vegetation cover over time. (5) Overlay analysis, utilizing the LandTrendr map to extract temporal information from our change detection analysis, with the purpose of elucidating the timing of the land cover change. This study aims to expand upon previous research on the mapping of WPE in open-canopy savanna ecosystems. Its findings will provide valuable insights on how and why land cover has changed over the past few decades within the ecologically diverse and historically significant Post Oak Savannah ecoregion.
The Post Oak Savannah ecoregion in east central Texas encompasses a total of 31 counties and spans an area of over 55,000 km2– including, along its western boundary, much of the important Carrizo–Wilcox aquifer (Figure 2). Historically, the Post Oak Savannah was characterized as an open canopy savanna with a high density of various grasses and forbs, interspersed with patches of post oak (Quercus stellata) and blackjack oak (Quercus marilandica) (Wasowski and Wasowski, 1988). This particular ecoregion is recognized as a transitional zone between the East Texas Piney Woods ecoregion renowned for its dense evergreen forests and the Central Texas Blackland Prairie ecoregion characterized by its black, calcareous, alkaline, and heavy clay soils (Diggs et al., 1999; Schmidly, 2002).
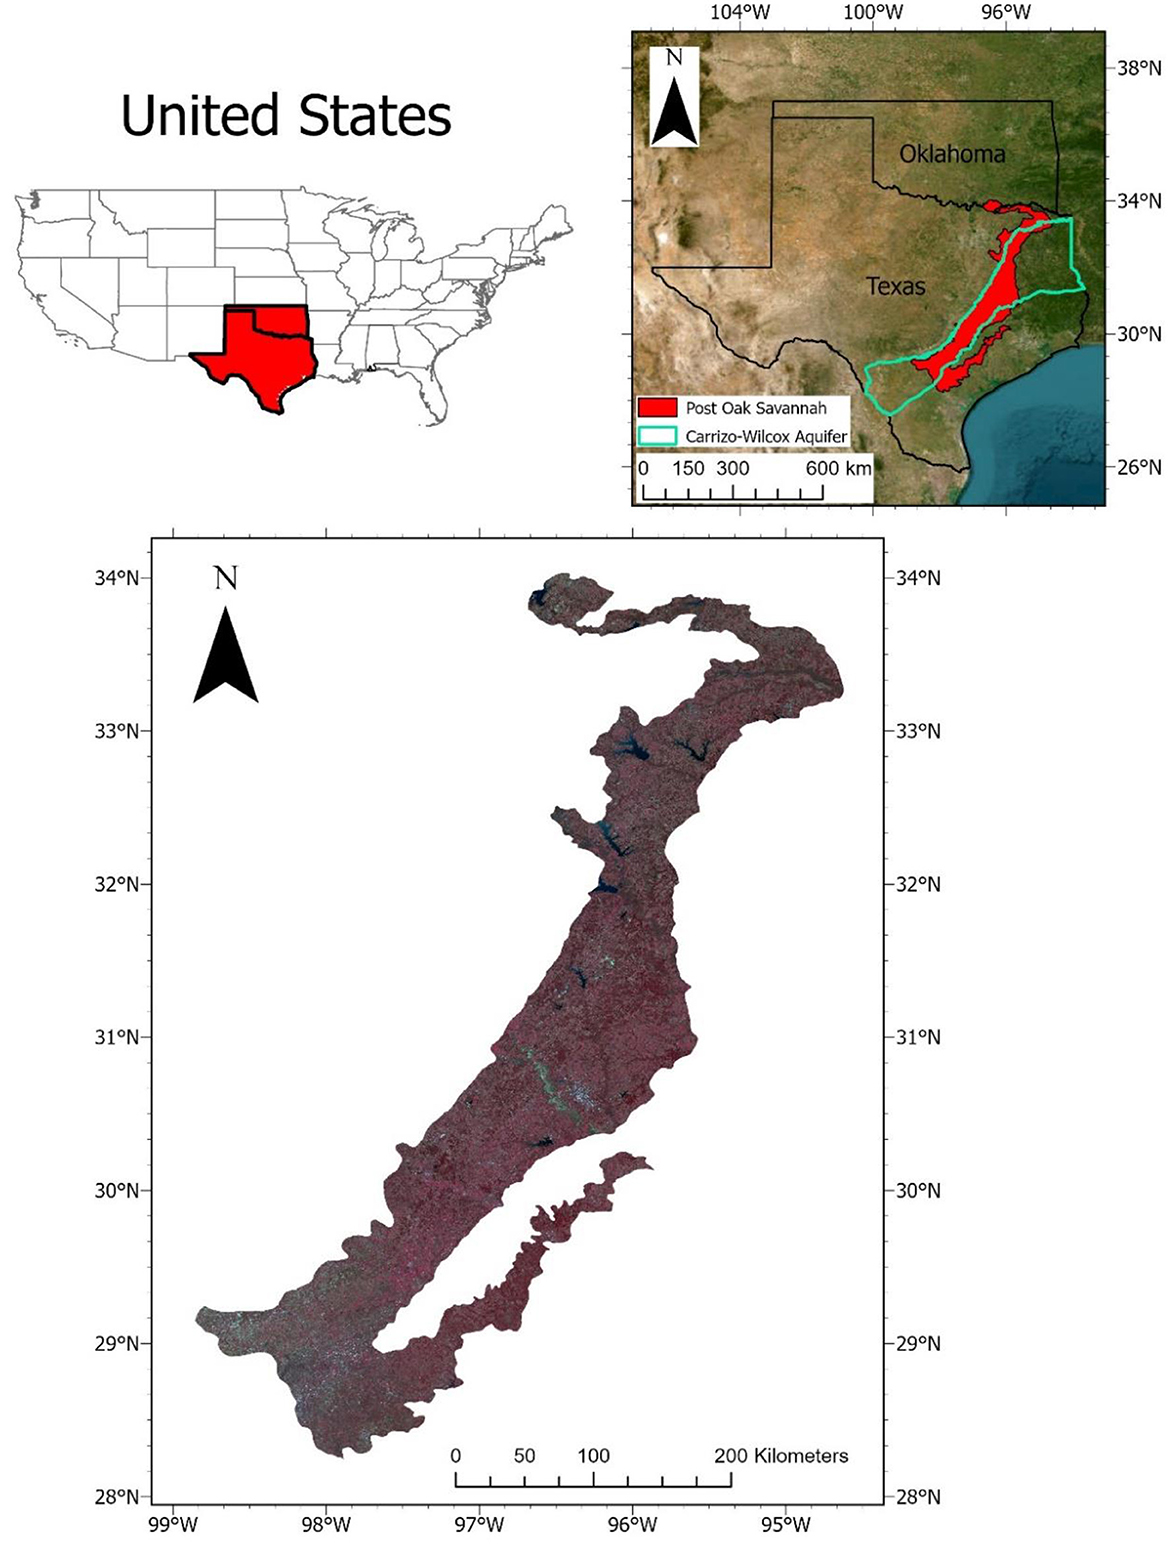
Figure 2. The Post Oak Savannah ecoregion is situated in east central Texas, as depicted in a Landsat composite image captured between January 01, 2022, and March 31, 2022. The image is presented as a false color composite, with the color scheme assigned as follows: Red (R) representing Near-Infrared (NIR), Green (G) representing Red, and Blue (B) representing Green. The boundaries of the US states were derived from the Census Bureau's MAF/TIGER GIS database (U.S. Census Bureau), while the boundary of the Post Oak Savannah ecoregion was sourced from the U.S. EPA (U.S. EPA). The boundary of the Carrizo-Wilcox Aquifer was obtained from the Texas Water Development Board (TWDB).
The average precipitation within this ecoregion increases gradually from ~900 mm in the southwestern portion to over 1,150 mm in the northeastern portion (Griffith et al., 2007). Along this gradient, the topography ranges from predominantly flat terrain at about 90 meters above sea level to gently rolling hills at about 250 meters above sea level (Griffith et al., 2007). Soils within the Post Oak Savannah are influenced by elevation—those in the high elevation areas characterized by the presence of sand and sandy loam pockets, and those in the lower elevation areas composed predominantly of clay and clay loams (Packard and Mutel, 1997). Annual average temperatures in the region vary between 18 and 21°C, with peak summer temperatures reaching ~40°C (Griffith et al., 2007).
In Pre-European settlement times, the plant communities of the Post Oak Savannah were sustained through the regular (every 2–5 years) occurrence of fires. These fires effectively prevented the encroachment of woody species and promoted the growth of prairie grasses and forbs (Rideout, 1994; Packard and Mutel, 1997). Large indigenous ungulates, particularly the American bison (Bos bison bison), played a crucial role in the dispersal of seeds onto disrupted soil. Bison notably exerted low grazing pressure, as herds of up to 1,000 individuals freely roamed the extensive territories, thereby providing ample time for the plant community to regenerate (Rideout, 1994).
Although early European settlers practiced horse and cattle grazing, by the late 19th century cotton farming had emerged as the predominant land use (Packard and Mutel, 1997). The suppression of the natural fire regime in this region for the past 150 years has resulted in the encroachment of dense stands of Quercus stellata. Currently, the Quercus stellata stands have experienced additional thicketization, caused by the growth of sub-canopy evergreen woody plants, primarily yaupon holly (Ilex vomitoria) and eastern red cedar (Juniperus virginiana). Over the past few decades, human activities—particularly the escalation of land conversion for agriculture and urbanization—have resulted in the significant reduction of native open-canopy savannas and grasslands. Today, a significant portion of remaining open areas have undergone conversion to improved pastureland. These areas are predominantly covered by perennial warm-season grasses such as Cynodon dactylon and Paspalum notatum.
The remote sensing data used for this study is composed of various datasets with different spatial resolutions; they include Landsat TM/ETM+/OLI (30-m), Sentinel-1 SAR GRD (10-m), National Agriculture Imagery Program (NAIP) (0.6- to 2-m), 1996 Texas Orthoimagery Program (TOP) (1-m), 2022 Capital Area Orthoimagery Project (CAPCOG) (30-cm), and 2022 StratMap (15-cm). The Landsat datasets consists of Landsat 5 TM imagery captured between 1996 and 2012, Landsat 7 ETM+ imagery captured between 1999 and 2021, and Landsat 8 OLI imagery captured between 2013 and 2021. The Sentinel-1 SAR GRD data utilized in this study was acquired during two distinct seasons: spring, with the mean pixel value calculated between March 1st, 2022, and April 20th, 2022; and summer, with the mean pixel value calculated between June 11th, 2022, and August 31st, 2022. In addition, we used three ancillary datasets: NASA's Shuttle Radar Topography Mission Digital Elevation Model DEM (SRTM DEM, 30-m), the RAP (30-m), and the National Land Cover Database for 1992 and 2021 (30-m). The datasets were obtained from GEE (https://developers.google.com/earth-engine/datasets) (Gorelick et al., 2017). The boundary vector data were acquired from the United States Environmental Protection Agency (EPA) (https://www.epa.gov/eco-research/ecoregion-download-files-state-region-6) (U.S. Environmental Protection Agency, 2023).
Our analysis of the distribution and dynamic mapping of land cover within the Post Oak Savannah was carried out in four main stages, as shown in Figure 3: (1) Implementation of an ensemble-stacking algorithm (integrating multiple GEE-based ML algorithms) that analyzes a diverse range of satellite images and ancillary data—including Landsat 5 TM, Landsat 8 OLI, Sentinel-1, a Digital Elevation Model (DEM), and RAP—to accurately classify different land cover types. Additionally, vegetation indices for the years 1996 and 2022, obtained during leaf-on and leaf-off periods and their differences, were taken into account. (2) A comprehensive post classification change detection analysis, to ascertain the specific locations where transitions between different classes have occurred. (3) Annual computation of the Normalized Burn Ratio (NBR) and consolidation of the results into an image stack, for use with the LandTrendr algorithm to analyze annual distributions of vegetation change. This process draws on all available Landsat data on GEE from 1996 to 2022. (4) An overlay analysis, to determine annual class transitions.
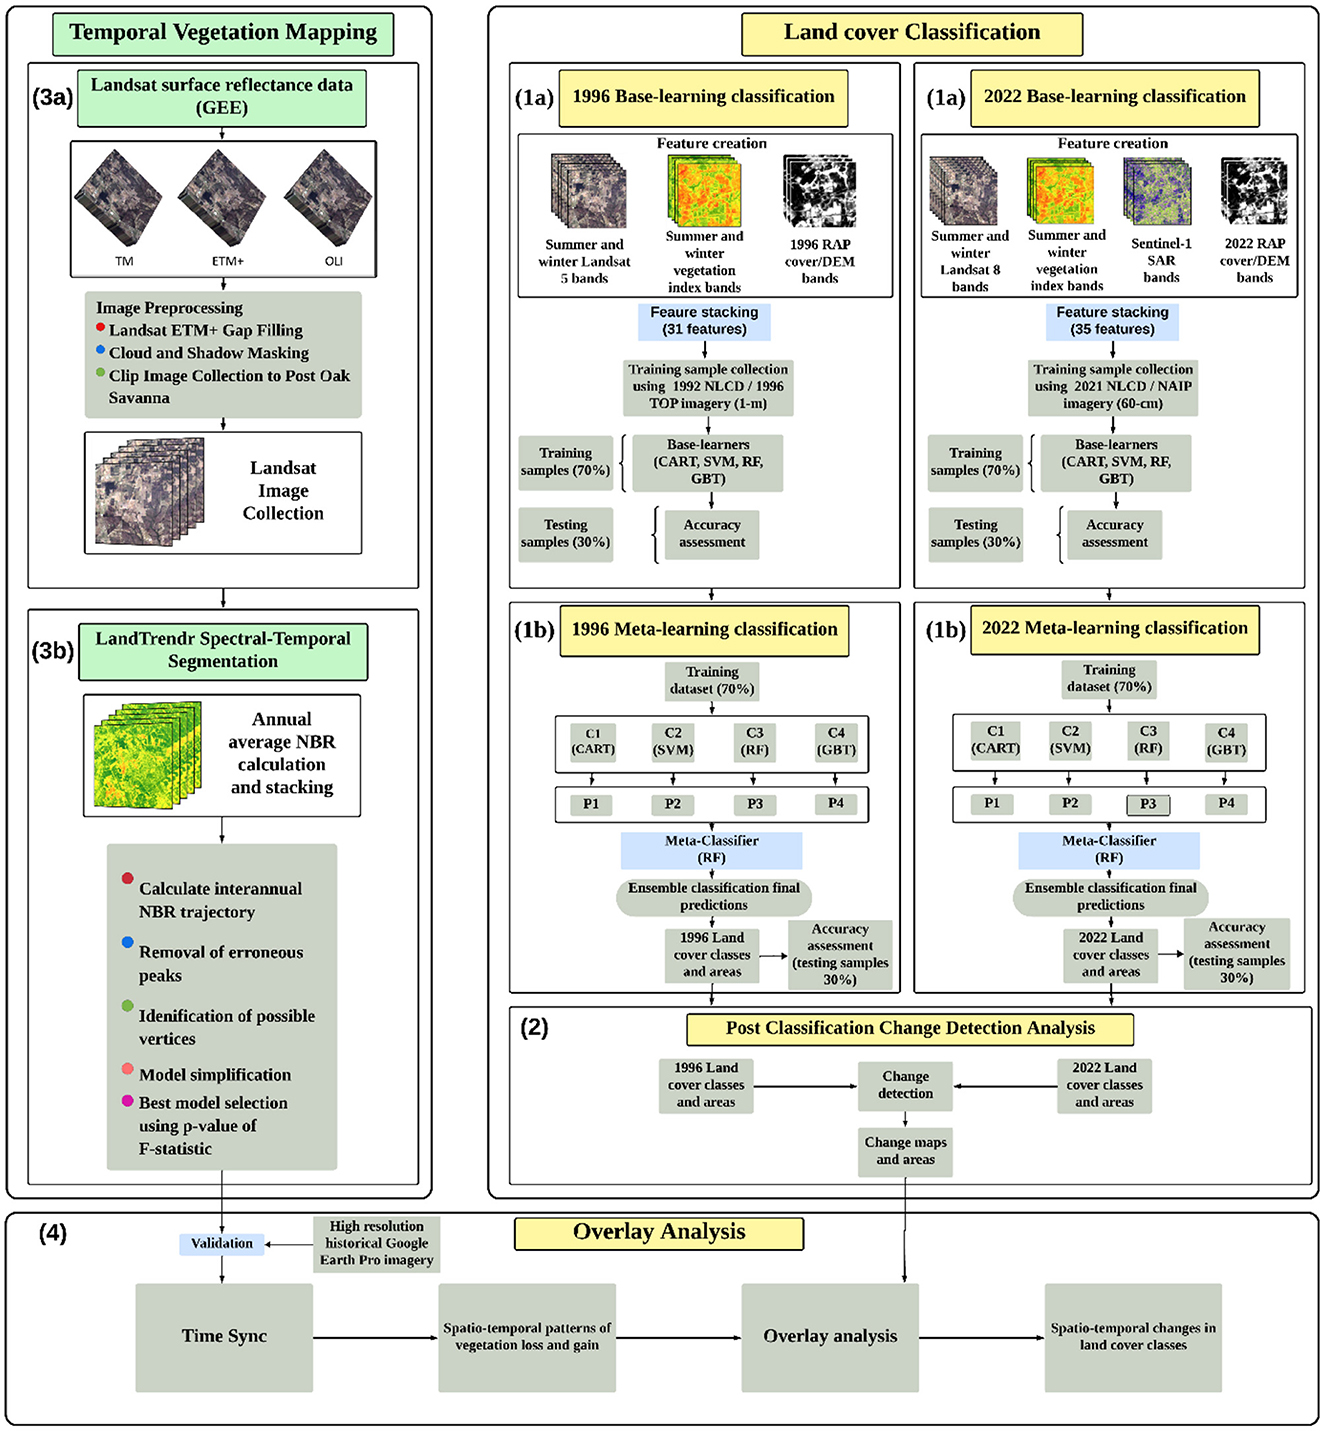
Figure 3. Flowchart illustrating the four main stages of our research, aimed at examining the distribution of vegetation types and mapping changes in land cover within the Post Oak Savannah from 1996 to 2022. (1a) Creation of data features for the years 1996 and 2022, followed by the training of base-learning models such as Classification and Regression Tree (CART), Support Vector Machines (SVM), Random Forest (RF), and Gradient Boosted Trees (GBT). (1b) The stacking and training of the base-learning model outputs by a meta-learning algorithm (RF) to generate final classification maps for the years 1996 and 2022. (2) Post-classification change detection analysis was then conducted to identify and quantify unique areas of change, indicating the presence of three fundamental processes: encroachment (change from open area to woodland), thicketization (change from deciduous woodland to evergreen and mixed woodland), and disturbance (change from woodland to open area). (3a) Landsat 5, 7, and 8 data were gathered, and preprocessing steps including gap filling, cloud and shadow masking, and clipping to the study boundary were performed to create an image stack spanning the years 1996 and 2022. (3b) Calculation of the Normalized Burn Index (NBR) was conducted for the entire image stack. The Landtrendr algorithm was employed to calculate interannual trajectories, eliminate peaks, identify change vertices, simplify the models, and select the best model based on the p-value of F-statistic. (4) An overlay analysis was performed to superimpose the Landtrendr vegetation map onto the change detection map to extract the years class changes occurred.
The land cover classification stage was partitioned into six classes: (1) open area, (2) deciduous woodland, (3) evergreen woodland, (4) mixed woodland, (5) urban, and (6) water. These classes were established on the basis of data from the United States Geological Survey 1992 and 2021 National Land Cover Database (NLCD), 2022 NAIP imagery, 1996 TOP imagery, 2022 CAPCOG imagery, and 2022 StratMap imagery.
The open area class is defined as non-urban surfaces characterized by minimal or no tree coverage, such as grazing land, pastures, and grasslands (NLCD). The three woodland classes are defined as areas containing woody vegetation of all sizes visible at a spatial resolution of 15 cm to 1 m, with the woodland type (deciduous, evergreen, and mixed) being determined via high-resolution leaf-off imagery—including 2022 NAIP imagery (60 cm), 1996 TOP imagery (1-m), 2021 CAPCOG imagery (30-cm), and 2022 StratMap imagery (15-cm) (NLCD). The urban class encompasses all discernible human-made constructions, along with open spaces used for purposes such as recreational activities and quarrying (NLCD). The water class is defined as encompassing all semi-permanent and permanent bodies of water, irrespective of sedimentation levels, that can be identified through high-resolution imagery (NLCD).
A total of 3,500 stratified random sample points were generated (by means of ArcGIS Pro 3.1). For the year 1996, these sample points were based on the 1992 NLCD classes, and for the year 2022 they were based on the 2021 NLCD classes (Table 1). As shown in Table 2, we integrated NLCD classes to align with our classification scheme. A minimum separation distance of 100 meters was implemented in order to ensure a distance of at least three pixels between each sample point. The land cover type of each sample point was determined via high-resolution imagery. If a land cover class could not be determined for a particular sample point, a neighboring sample point of the same class type, identified through visual interpretation of high-resolution imagery, was manually chosen and used as a substitute. For our dataset, we used a split of 70% for training and 30% for testing, following the methodology outlined by Stone (1974).
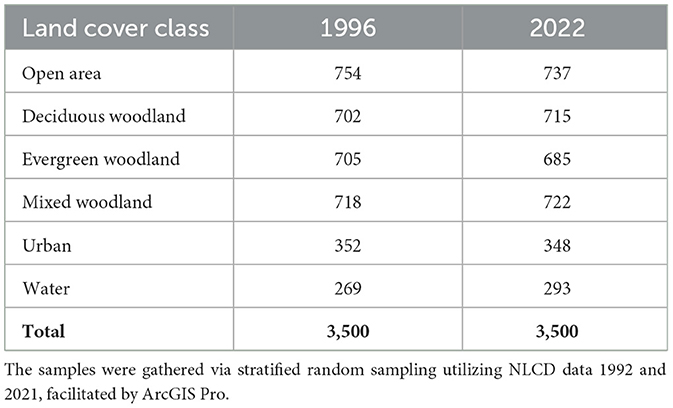
Table 1. Number of sample points generated for each of the six land cover classes, for the 1996 and 2022 datasets.
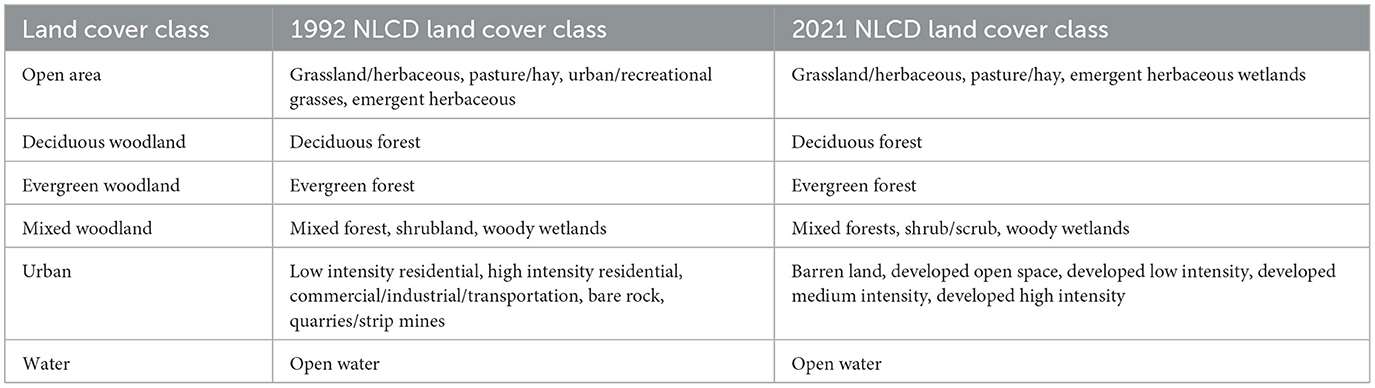
Table 2. Characteristics of each of the six land cover categories, based on the land cover classes defined by the 1996 and 2021 National Land Cover Databases.
Compositing low to mid-resolution satellite imagery enables the identification of the most optimal observations from a set of samples to guarantee the accurate depiction of the region of interest without any interference from cloud cover, cloud shadows, snow/ice, and intra-annual variation within a specific time frame at the same geographical location (Qiu et al., 2023). Additionally, the combination of leaf-on and leaf-off seasonal images has been noted to improve classification accuracies by capturing the phenological differences of different cover types in different seasons (Xie et al., 2019). For the 1996 classification, the collection of Landsat 5 TM imagery was by season: the winter months (January–March), when the leaves are off, and the summer months (June–August), when the leaves are on. These filtered images were then compiled into separate stacks for further analysis. For the Post Oak Savannah ecoregion, the leaf-off stack comprised 79 images, while the leaf on stack consisted of 121 images. A cloud and shadow-free composite for the winter and summer of 1996 was generated by means of the ee.Algorithms.Landsat.simpleComposite function from the GEE library. The parameterization of this function included the following features: a percentile score of 50 to calculate the average value of the entire composite for each band; a cloudScoreRange score of 0 to ensure a composite without clouds and shadows; and the maxDepth parameter was set to the total number of images per stack enabling the maximum number of scenes to be used in computing each pixel (79 for winter and 121 for summer). Additionally, the asFloat parameter was set to True, to ensure floating point values for each pixel in the composite.
For the 2022 classification, the collection of Landsat 8 OLI imagery was filtered by season: the winter months (January–March), when the leaves are off, and the summer months (June–August) when the leaves are on. The leaf off stack comprised of 93 images, while the summer stack consisted 103 images. A cloud and shadow-free composite for the winter and summer of 2022 was generated by means of ee.Algorithms.Landsat.simpleComposite function from the GEE library. The parameterization features of this function were configured to match those of the 1996 classification, with the exception of the maxDepth parameter, which was adjusted to reflect the total number of images available for 2022 (93 for winter and 103 for summer).
The selected bands for the two classifications comprised a combination of spectral bands from Landsat 5/8 and difference indices derived from Landsat 5/8, which are essential for classifying vegetation cover. Furthermore, elevation and slope data derived from the DEM were integrated into the analysis, given the predominance of woodlands in the Post Oak Savannah that are typically located in low-lying bottomland areas. The data pertaining to tree, shrub, perennial grass, annual grass, and bare ground cover from RAP were utilized because of the extensive vegetation measurements conducted on the ground (over 31,000 data points). Moreover, the VV backscatter coefficient data from Sentinel-1 (limited to the year 2022) was included due to its capacity to differentiate seasonal phenological changes in deciduous and evergreen woodlands, which are affected by canopy structures (Ling et al., 2022). The spectral bands consisted of six surface reflectance bands from Landsat 5 and 8, as follows: for Landsat 5—B1: Blue, B2: Green, B3: Red, B4: NIR, B5: SWIR1, and B7: SWIR2; and for Landsat 8—B2: Blue, B3: Green, B4: Red, B5: NIR, B6: SWIR1, and B7: SWIR2. To ensure consistency in resolutions, the Sentinel-1 data underwent resampling to 30-m using the resample () function in GEE and a bicubic resampling method, one of the most commonly used interpolation based methods (Keys, 1981).
To improve the distinguishability of different types of woodlands, which often appear similar at a 30-m resolution, we used the surface reflectance bands from Landsat 5/8 to create difference indices, which exploit the seasonal phenological variations between deciduous and evergreen species in different woodland types (Yang et al., 2012, 2021; Wang et al., 2018). The expression() function in GEE was utilized to compute the leaf-off and leaf-on values for various indices, including the normalized difference vegetation index (NDVI), normalized difference water index (NDWI), soil-adjusted vegetation index (SAVI), normalized difference build-up index (NDBI), and enhanced vegetation index (EVI). These indices have demonstrated the capability to differentiate between different land cover classes, including wooded and non-wooded areas (Chen et al., 2006; Cai et al., 2020; Dai et al., 2020). We then calculated the simple difference between the peak annual and minimum annual values for NDVI and EVI. This calculation aids in discriminating between evergreen woodlands, characterized by a minor disparity, and deciduous and mixed woodlands, which exhibit a more substantial difference (Wang et al., 2018, 2021; Basualdo et al., 2019). The calculation of the difference in SAVI was omitted as it is closely linked to NDVI, utilizing both the red and NIR bands. Similarly, the difference in NDBI was not computed as it is designed to highlight constructed urban areas that remain constant throughout the seasons. Additionally, the difference in NDWI was not determined as its primary purpose is to track variations in water content of water bodies, which is not the focal point of our research inquiry.
Elevation data were extracted directly from the SRTM DEM, the slope was calculated from the SRTM data via the ee.Algorithms.Terrain() function in GEE. Ascending and descending VV backscatter coefficients were computed from the C-band Sentinel SAR data, which operates in VV/VH polarization mode (Belenguer-Plomer et al., 2019; Udali et al., 2021) during the spring and summer seasons. From the RAP data, three distinct feature bands were generated: the RAP woody (the sum of the RAP tree percent cover band and the RAP shrub percent cover band), the RAP grass (the sum of the RAP annual grasses and forbs percent cover band and the RAP perennial grasses and forbs percent cover band), and the RAP bare ground percent cover band. The RAP derivative features created were visually juxtaposed with the NLCD datasets from 1992 and 2021, 2022 NAIP imagery, 1996 TOP imagery, 2021 CAPCOG imagery, and 2022 StratMap imagery utilized in formulating our land cover classification scheme to ascertain their consistency.
The Landsat reflectance bands, derived indices, elevation and slope data, Sentinel-1 backscatter coefficient, and RAP data were combined by means of the addBands() function in GEE. Finally, the newly merged images underwent resampling to achieve a resolution of 30-m. The 1996 classification encompassed a total of 31 features (excluding any SAR features), and the 2022 classification incorporated 35 features (Supplementary Table S1).
Feature importance, also known as the “Gini importance” or “mean decrease impurity,” is a measure that quantifies the absolute decrease in node impurity. This measure is weighted by the probability of reaching that node and is averaged over the total number of trees in a given classification (Breiman et al., 2017). For our study, we determined a relative importance by individually calculating the importance value of each feature and subsequently dividing it by the sum of the importance values of all features. This calculation was performed twice for the RF base-classifier (with 31 features for the year 1996 and 35 features for the year 2022). For the meta-learner, the outputs of four models—RF, GBT, SVM, and CART—served as features to obtain the importance values of the models.
This study employed a stacking ensemble algorithm methodology, which integrates the outcomes of multiple models to create a more accurate predictive model. This stacking methodology is carried out in two steps: (1) the first-level classifiers, also known as base-classifiers, are utilized as a training set for the second-level classifier, called the meta-learner; and (2) the meta-learner is constructed on the basis of predictions generated by the first-level classifiers (Healey et al., 2018; Long et al., 2021; Xu and Zhang, 2022). The utilization of a stacking ensemble algorithm in classification offers the advantage of leveraging the strengths of multiple high-performing models to generate predictions that outperform any individual model within the ensemble (Healey et al., 2018). To enhance the accuracy of subsequent classification, a diverse ensemble of four base-classifiers was employed, comprising the following: classification and regression tree (CART), support vector machines (SVM), random forest (RF), and gradient-boosted decision trees (GBT). Previous studies have highlighted the effectiveness of these four machine learning classifiers in classifying land cover on the GEE platform (Bui et al., 2021; Oo et al., 2022; Zhao et al., 2024).
The CART model was configured with the following parameters: maxNodes: unlimited, minLeafPopulation: 1. The SVM model was configured with the following parameters: all default settings were used, except for the kernel type being set to Radial Basis Function, which is the most commonly used non-linear kernel function (Zafari et al., 2019). The RF model was configured with the following parameters: numberOfTrees = 1,000, variablesPerSplit = square root of the number of variables, minLeafPopulation = 1, bagFraction = 0.5, maxNodes = unlimited, and seed = 0. The GBT model was configured with the following parameters: numberOfTrees = 1,000, shrinkage = 0.005, samplingRate = 0.7, maxNodes = unlimited, loss = LeastAbsoluteDeviation, seed = 0.
Once the initial classifications had been completed, the accuracy of each was assessed. Only base-classifications that achieved an overall accuracy of 85% or higher were selected as training data for the meta-learner. Random Forest was selected as the meta-classifier to combine the outcomes produced by the base-classifiers, because prior research had demonstrated its strong capability in handling large datasets—particularly for mapping extensive and/or diverse regions and for aggregating the outcomes of base-classifiers (Cai et al., 2020; Adugna et al., 2022).
The accuracy of the training/validation points chosen was verified via high-resolution color infrared (CIR) winter imagery from 1996 and 2022. The utilization of winter imagery was aimed to facilitate the identification of different woodland types. This is because evergreen and mixed woodlands retain most of their foliage during the winter season, unlike deciduous woodlands. For the 1996 classification, a total of 27 digital orthophotos from the TOP dataset were used (TNRIS). This imagery was acquired during the period of December 1995–January 1996 and was processed to eliminate displacement caused by sensor orientation and terrain relief. All of the processed TOP images consisted of three bands: NIR, red, and green; have a spatial resolution of 1-m; and encompass a quarter-quadrangle measuring 3.75 min of latitude by 3.75 min of longitude.
For the classification of 2022, accuracy was verified by means of digital orthophotos (a total of 32) from the NAIP dataset (TNRIS). This imagery was acquired during the period November 2021–December 2022 and was processed to eliminate displacement caused by sensor orientation and terrain relief. All processed NAIP images consisted of three bands: NIR, red, and green; have a spatial resolution of 60-cm; and encompass a quarter-quadrangle, measuring 3.75-min of latitude by 3.75-min of longitude, in terms of size. The disparities in resolution between the 1996 TOP images (1-m) and the 2022 NAIP images (60-cm) did not hinder the validation process during the comparison of selected samples. This is because the 1-m CIR resolution is sufficiently high to distinguish juvenile trees and their phenology (e.g., evergreen vs. deciduous).
An error matrix was constructed for evaluation of the accuracy metrics, namely overall accuracy (OA) (Equation 1) and Kappa coefficient (KC) (Equation 2). These metrics were computed via the following formulas:
where TC = total number of correctly labeled pixels, N = total number of testing pixels, r = number of rows and columns in the confusion matrix, xii= observation in row i and column i, xi+ = marginal total of row i, and x + I = marginal total of column i The metrics OA and KC are widely accepted in the field for evaluating classification accuracy. OA provides a measure of the overall accuracy of the classification model, while KC takes into consideration the probability of chance agreements.
User Accuracy (UA) (Equation 3) and Producer Accuracy (PA) (Equation 4) were incorporated in order to ensure that evaluation of the classification outcomes was comprehensive. The UA quantifies the likelihood that a classified pixel accurately represents the ground conditions. The PA assesses the accuracy of ground feature representation on a classified map. The formulas were computed as follows:
where X = the number of pixels correctly identified in each map class, Y = the total number of pixels claimed by the map to be in that class, and Z = total number of pixels in the reference class.
We conducted a post-classification change detection analysis to quantify the differences in land cover classes within the Post Oak Savannah between 1996 and 2022. Using GEE, we were able to derive specific class transitions from one class to another and subsequently calculate their corresponding areas in square kilometers (km2). A total of 30 different types of class changes were identified, with specific focus placed on the shift between open areas and the three different types of woodland.
The NBR is a vegetation index derived from remote sensing data that serves as an indicator of both healthy green vegetation and vegetation disturbances (Key and Benson, 2006). Previous research has used inter-annual changes in NBR to monitor alterations in LULC, particularly vegetation cover (Bright et al., 2019; Zhu et al., 2019; Pasquarella et al., 2022; Zhou et al., 2023). Additionally, NBR has been recognized for its superior performance in identifying forest disturbances through the LandTrendr algorithm compared to other spectral bands and indices such as NDVI, the NIR Landsat band, and NDMI, as indicated by previous studies (Cohen et al., 2018, 2020). We used a total of 5,785 scenes acquired from the Landsat 5, 7, and 8 satellites annually during the growing season (June to August), spanning the period 1996–2022. Masking of clouds, snow, and shadows plays a crucial role in the classification of satellite remote sensing images, enabling the interpreter, as well as the computer, to effectively analyze the prevailing ground conditions. For this reason, we preprocessed each scene using an internal cloud identification algorithm within GEE to identify those with a cloud cover percentage of < 10%. This CFMask algorithm was then utilized to mask out any remaining pixels that contained clouds and/or shadows.
For each Landsat scene, we used near-infrared (NIR) and short-wave infrared-2 (SWIR-2) reflectance values in the computation of NBR, as shown in Equation (5).
where ρNIR, t is equal to the surface reflectance value of the NIR band at time t in a specific year, and ρSWIR2, t is the surface reflectance value of the SWIR2 bands at the same time and for the same year.
The mean NBR value per pixel was computed over a one-year period, and the results were then arranged in chronological order to generate a stack of images representing the mean annual NBR (Equation 6):
where NBRmean, Y is equal to the annual average NBR value, Y is a specific year between 1996 and 2022, with S representing the NBR image of the starting year (1996), and E representing the NBR image of the ending year (2022).
LandTrendr is a time-segmentation algorithm implemented in GEE that utilizes line segments to detect changes in land cover states for individual pixels across a sequence of images captured over time (Kennedy et al., 2010, 2018). The characterization of these state changes is limited, as the algorithm is unable to detect specific minute changes that occur over time. However, it can still provide historical context for every pixel in an image time series. In other words, the LandTrendr algorithm is designed to condense and analyze the history of a pixel's on an annual basis, effectively filtering out noise and identifying significant vegetation change events.
We used the LandTrendr algorithm to generate a comprehensive map illustrating the dynamics of vegetation change, including vegetation gain, vegetation loss, and no change in vegetation, during the period 1996–2022 (Long et al., 2021). Such a map is critical for comprehending the nature of the changes that have taken place between the land cover classifications of 1996 and 2022; it elucidates the temporal dynamics of vegetation cover—whether it has remained stable, experienced rapid decline as a result of disturbances such as fire and urbanization, or exhibited gradual increase through primary and secondary succession.
To strike a balance between capturing spatial detail and minimizing the impact of outlier values, we computed the mean NBR value using a 3 by 3 window kernel for the NBR time series. We effectively eliminated spikes in line segments (caused by residual image artifacts) through the adjustment of the spikeThreshold parameter; this parameter eliminates outlier vertices that would cause NBR values to return to pre-spike values within a period of 1–2 years— a necessary adjustment because genuine land cover changes typically require several years to recover to pre-spike values.
We identified the vertices of the line segments by calculating a least-squares, first-order regression of the NBR index for all points in the time series (only the first and last year as vertices for one line segment) (Kennedy et al., 2018). The vertex that exhibited the greatest deviation from the regression line was then designated as the next point, resulting in the formation of two line segments (Kennedy et al., 2018). New regressions were subsequently calculated for each of the two generated line segments, and the line segment exhibiting the higher mean square error (MSE) was selected for the next vertex split (Kennedy et al., 2018). This process was continued until the number of segments reached the specified value for the maxSegments parameter— at which point each iterative, smallest-MSE segment was connected from vertex to vertex.
Once the maximum complexity segmentation model was established, a series of trajectory models were generated with varying numbers of segments, ranging from one segment to the maximum number of segments. Needless segmentations were eliminated by removing the vertex with the lowest strength. The identification of the weakest vertex was based on the recovery_threshold, which involves the deletion of a line segment if its recovery slope spans the entire date range. The exceptionally rapid recovery observed can be attributed to the presence of a defective cloud- and shadow masking mechanism. The best model for each pixel was selected based on the smallest p-value of the F-statistic (p-of-f ). In this study, the LandTrendr parameterization included setting maxSegments to 6, spikeThreshold to 0.9, preventOneYearRecovery to True, while the remaining parameters were left at their default values.
LandTrendr generates 5-band images which include the following information: the year of vertex, magnitude of change, duration of change, initial value, and the change rate. The analysis involved retrieving the change magnitude, starting value, change duration, and vertex year. The term “change magnitude” pertains to the maximum disparity observed between two vertices. The starting value refers to the index value assigned to the first year. The concept of change duration refers to the length of time over which a change has occurred, measured in years. It is observed that vegetation gain exhibits the slowest rate of change, while vegetation loss experiences the fastest rate of change. The term “vertex year” refers to the initial year of a vegetation change event. The LandTrendr images were subsequently organized based on the slowest gain, which signifies the natural growth of vegetation, and the fastest loss, which indicates disturbance events. Given that pixels may have undergone both gains and losses over the 26-year period, the latest vertex year was selected to represent the transition of the 1996 land cover class to the 2022 land cover class.
We validated the accuracy of our vegetation change map using TimeSync, a LandTrendr companion image interpretation software tool designed for visualizing image time-series and collecting data. TimeSync presents the shifts in trends for each sampled point by utilizing a yearly spectral trajectory plot along with the corresponding Landsat image for every year. This feature enables users to utilize the Landsat image stack to confirm the occurrence of vegetation change during the vertex year indicated on the spectral trajectory plot. Furthermore, within the TimeSync environment, users have the capability to access high-resolution Google Earth imagery to corroborate vegetation changes that may not be discernible solely from the Landsat images. A total of 150 sample points were generated using ArcGIS Pro 3.1, for each of three categories of vegetation change: vegetation gain, vegetation loss, and no change. Using TimeSync, Landsat, and high-resolution Google Earth imagery, we examined all 450 data points to validate the presence of vegetation loss, gain, or no change at the vertex years. A 1-year buffer was incorporated into the validation process of the vertex year, to accommodate uncertainties associated with the detection of small woody plants in open areas, as well as the lack of access to high-resolution imagery in previous years. For instance, if the first year of change was determined to be 2001, we used high-resolution imagery from the period 2000–2002 to validate the alteration in vegetation.
The map illustrating changes in vegetation, produced with LandTrendr, was superimposed on the map generated through post-classification change detection. An overlay analysis was conducted to determine the latest vertex year for each pixel that experienced a change in class, thereby indicating the specific year of the class transition. This process involved the conversion of each unique transition type (e.g., open area to deciduous woodland—class one, open area to evergreen—class two, etc.) into multi-part polygons and extracting the vertex year from the vegetation change map produced by LandTrendr. This procedure was conducted using ArcGIS Pro version 3.1. The years were subsequently segmented into five 4-year intervals and one 6-year interval (1997–2000, 2001–2004, 2005–2008, 2009–2012, 2013–2016, and 2017– 2022).
For the base-learning classifier, the feature importance calculations for the years 1996 and 2022 exhibited comparable trends, as depicted in Figure 4. For both years, least significant variables were the RAP bareground and slope features; and summertime features were less significant than wintertime features— in particular the summer red and SAVI features for 1996 and the summer EVI, NDBI, NIR, SAVI, and SWIR2 features for 2022 (Figure 4). The lower significance for summer features can be atrributed to the spectral resemblances observed among different types of woodlands during the leaf-on season, particularly at a resolution of 30 meters. Nine of the ten most significant features in the base-learning classifications from 1996 to 2022 were related to wintertime conditions, and seven of those were vegetation indices (Figure 4). The winter NDWI and the winter NDVI were identified as the most significant features for 1996 and 2022, respectively (Figure 4). The SAR features, which were exclusively incorporated into the 2022 classification, exhibited a moderate level of significance (Figure 4).
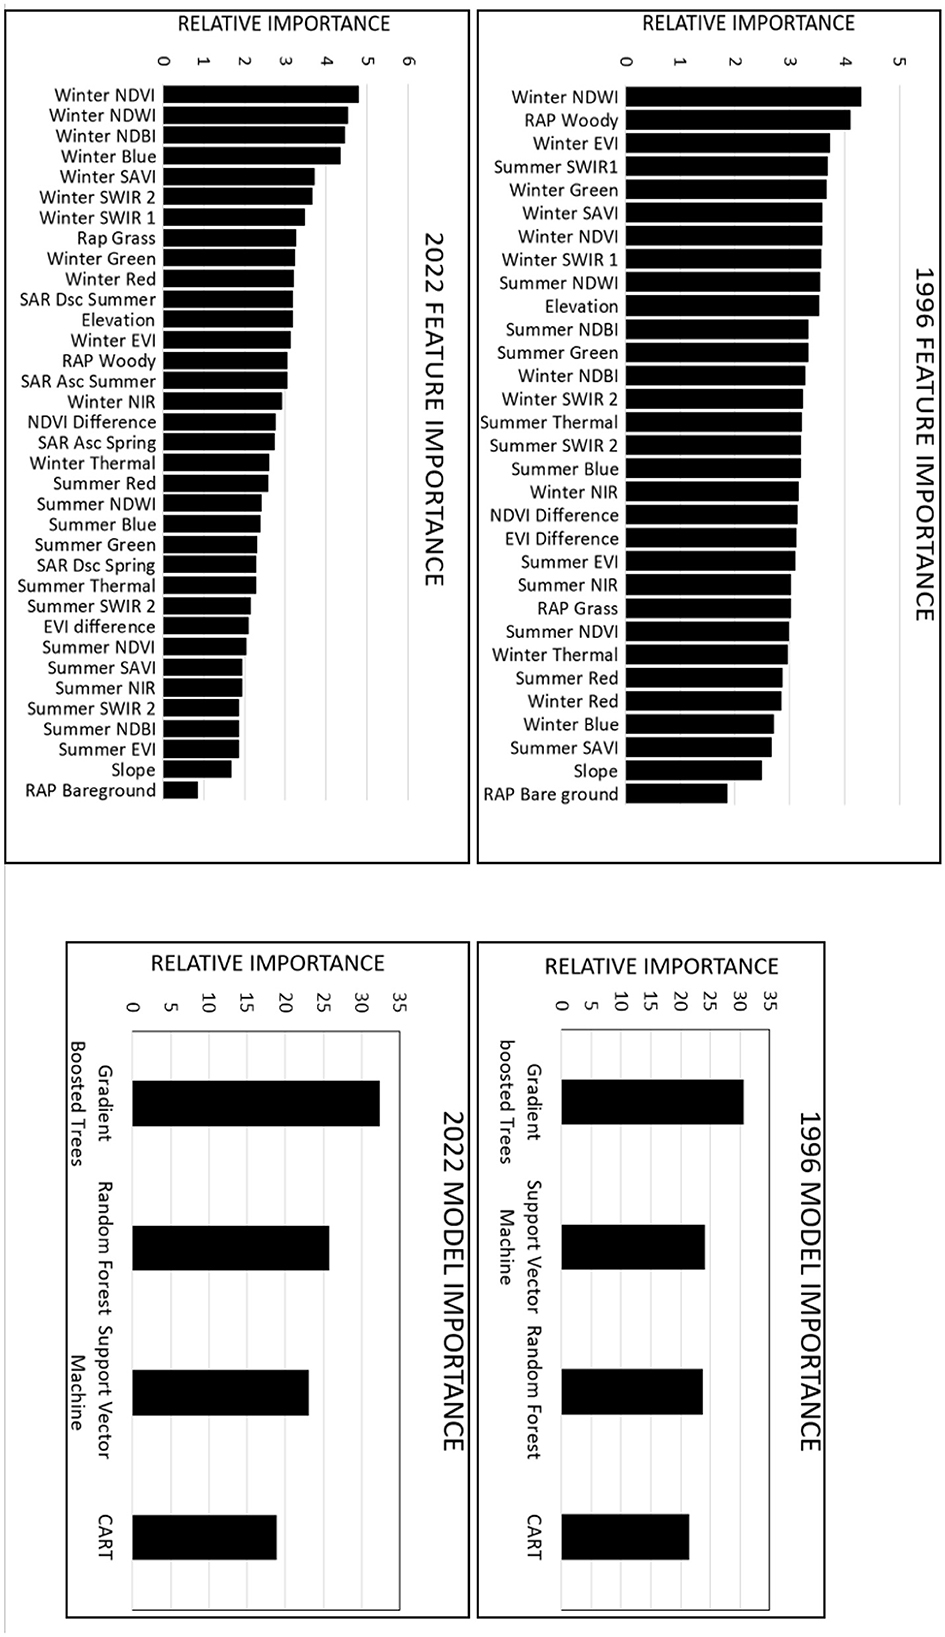
Figure 4. The relative importance of features (base-learning RF classifier) and models (meta-learning classifier) for the years 1996 and 2022 is presented in descending order from most to least significant. Abbreviations such as the Normalized Difference Vegetation Index (NDVI), Normalized Difference Water Index (NDWI), Normalized Built-Up Index (NDBI), Soil Adjusted Vegetation Index (SAVI), Enhanced Vegetation Index (EVI), Synthetic Aperture Radar Descending (SAR Dsc), and Synthetic Aperture Radar Ascending (SAR Asc) are commonly used in remote sensing studies.
For the meta-learning classifier, the feature importance calculation for 1996 and 2022 also yielded comparable trends (Figure 4). For both years, the CART model was found to be the least useful, while the GBT model was determined to be the most useful in generating final ensemble land cover classifications (Figure 4). The SVM and RF models experienced a minor shift in importance, with the second and third places being swapped between 1996 and 2022 (Figure 4).
For 1996, the base-learning classifiers demonstrated overall accuracies (OAs) of 88.4, 91.0, 93.2, and 93.4% for the CART, SVM, RF, and GBT models respectively (Table 3; Figure 5). The implementation of the ensemble stacking algorithm led to a notable improvement in the OA, to 94.3% (Table 3). The land cover classes of open area, urban, and water exhibited the highest levels of accuracy, with a significant number of values exceeding 95%. Of the three woodland classes, deciduous and evergreen woodlands showed quite high accuracies, ranging from the mid 80s to 90%; the mixed woodland scored the lowest (77–90%).
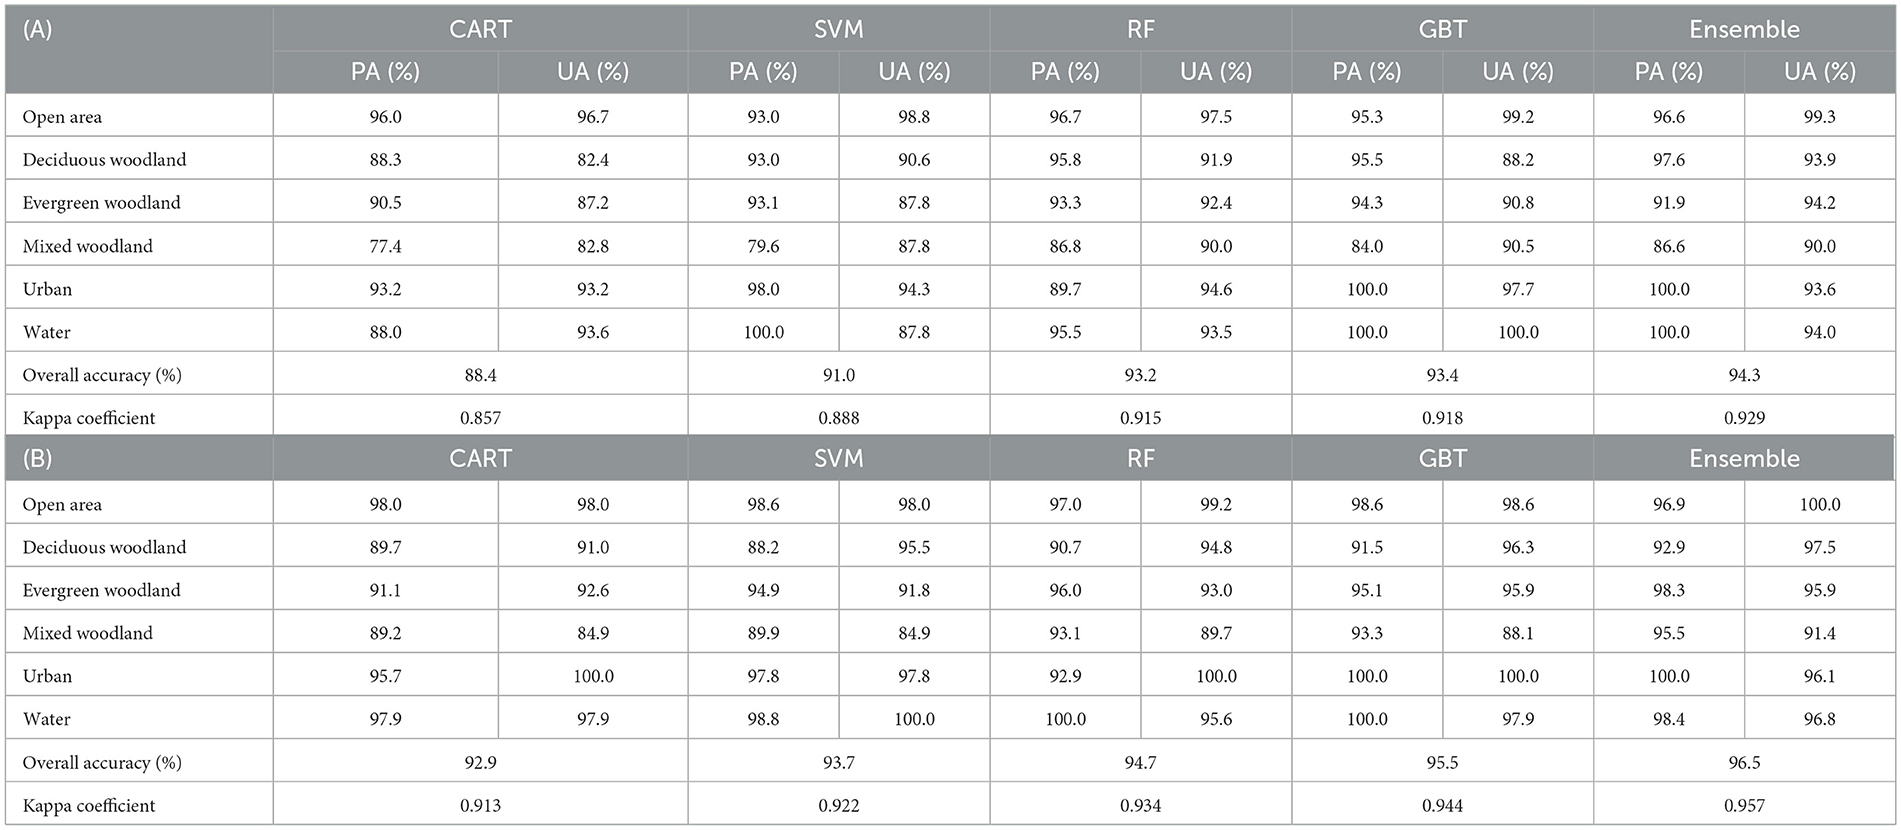
Table 3. Accuracies of the four base-learning classifiers [Classification and Regression trees (CART), Support Vector Machines (SVM), Random Forest (RF), and Gradient Boosted Trees (GBT)] and of the ensemble-stacking algorithm for (A) 1996 and (B) 2022.
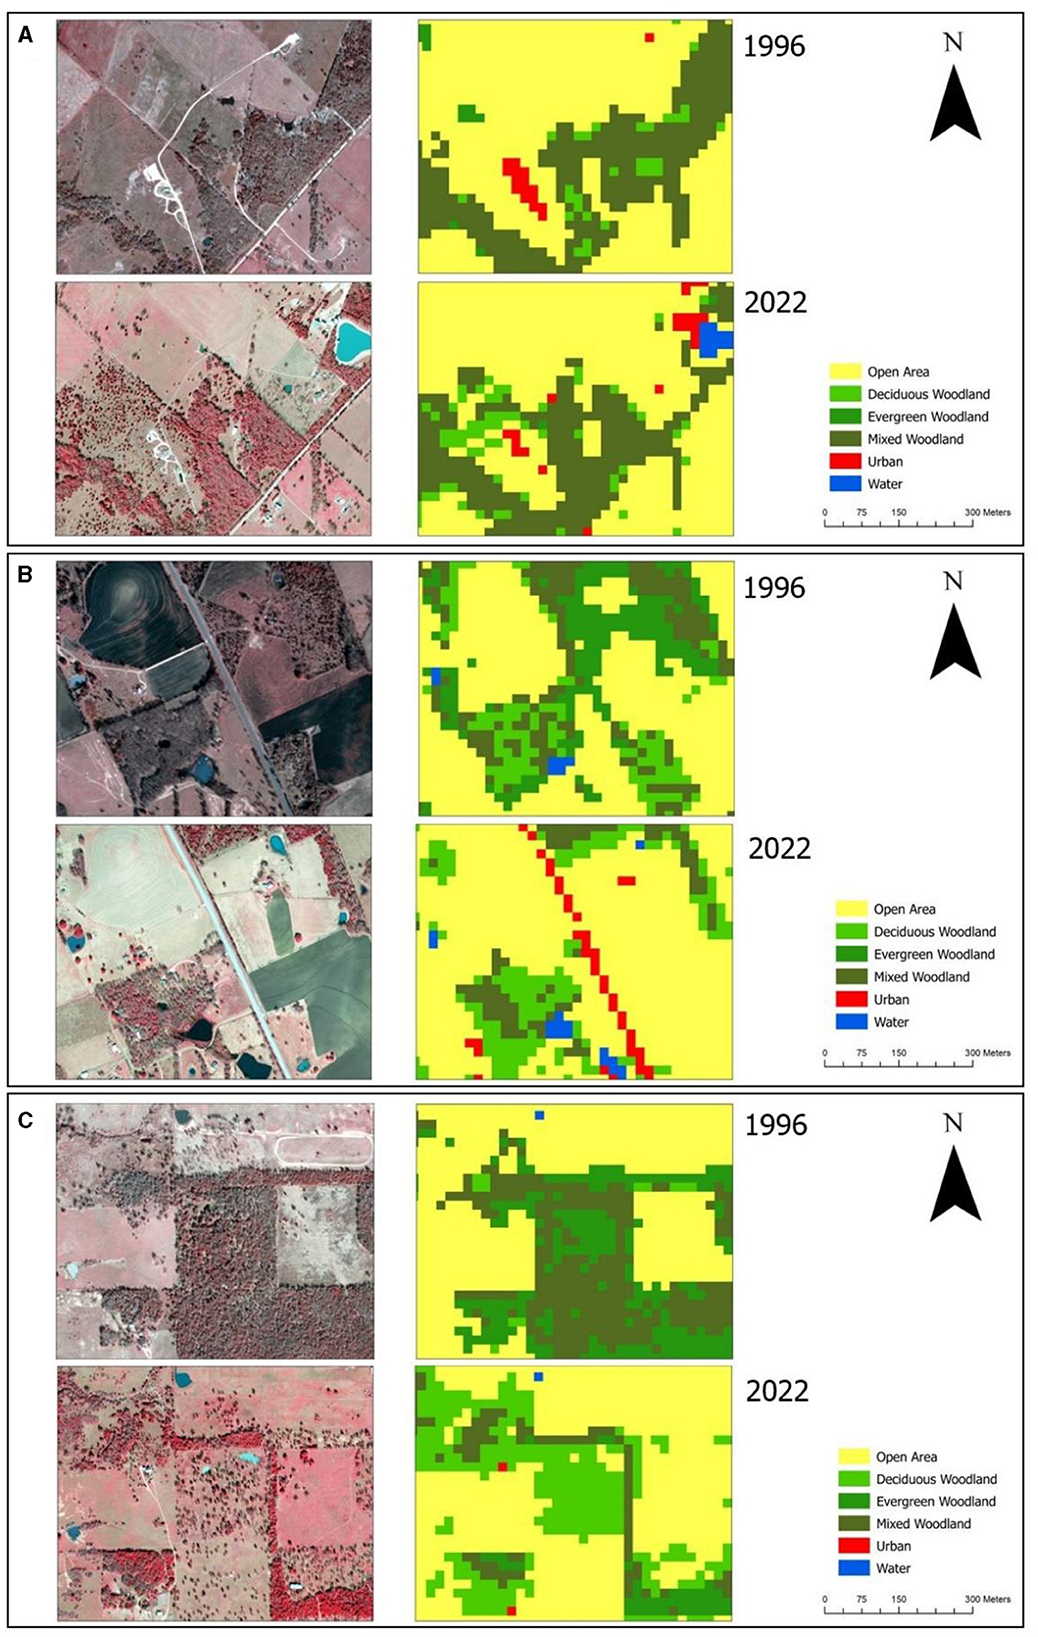
Figure 5. Comparison of high-resolution, leaf-off aerial imagery, specifically TOP (1-m) imagery from 1996 and CAPCOG (30-cm) imagery from 2022. The color scheme employed was as follows: Red (R) representing Near-Infrared (NIR), Green (G) representing Red, and Blue (B) representing Green. Classifications were produced using the ensemble stacking algorithm. The coordinates for the locations are as follows: (A) 96.2302091°W, 30.7963780°N, (B) 96.9598470°W, 30.3175249°N, (C) 97.5384985°W, 29.7256995°N.
As For 2022, the base-learning classifier exhibited higher OAs than for 1996: the CART, SVM, RF, and GBT OAs were recorded as 92.9, 93.7, 94.7, and 95.5%, respectively (Table 3). The implementation of the ensemble-stacking algorithm improved the OA— to a score of 96.5% (Table 3). The accuracy trends observed for 1996 remained consistent for 2022, with the land cover classes of open area, urban, and water exhibiting the highest levels of accuracy (values ranging from 93 to 100%) (Table 3). All three of the woodland class demonstrated significant improvement, with evergreen woodlands exhibiting the highest accuracies (surpassing 90%), deciduous from 88 to 97%, and mixed woodlands ranging from 84 to 95% (Table 3).
The distribution of land cover underwent significant changes between 1996 and 2022, suggesting a dynamic transformation within the Post Oak Savannah region (Figure 6). The open area class, encompassing natural grassland/herbaceous cover, open rangeland, crop agriculture, and herbaceous dominated wetlands, suffered a cumulative loss of 2,525 km2 (Table 4). Despite this loss, the class still maintained its status as the most extensive, covering a total area of 27,449 km2 (Table 4). The most significant growth was seen for the deciduous woodland class, which expanded by 2,851 km2 over the course of 26 years—surpassing the growth of the mixed woodlands, and making it the largest woodland class, with a total of 12,807 km2 (Table 4). The only class of woodland that experienced a loss between 1996 and 2022 was the evergreens, which decreased markedly in land area (from 3,365 to 1,802 km2–a loss of 1,563 km2) (Table 4). The urban class saw a significant increase in size, nearly doubling from (491 to 905 km2), reflecting the substantial population growth within the region (Table 4). And finally, the open water class exhibited a relatively stable trend, with a marginal increase of 99 km2 (Table 4).
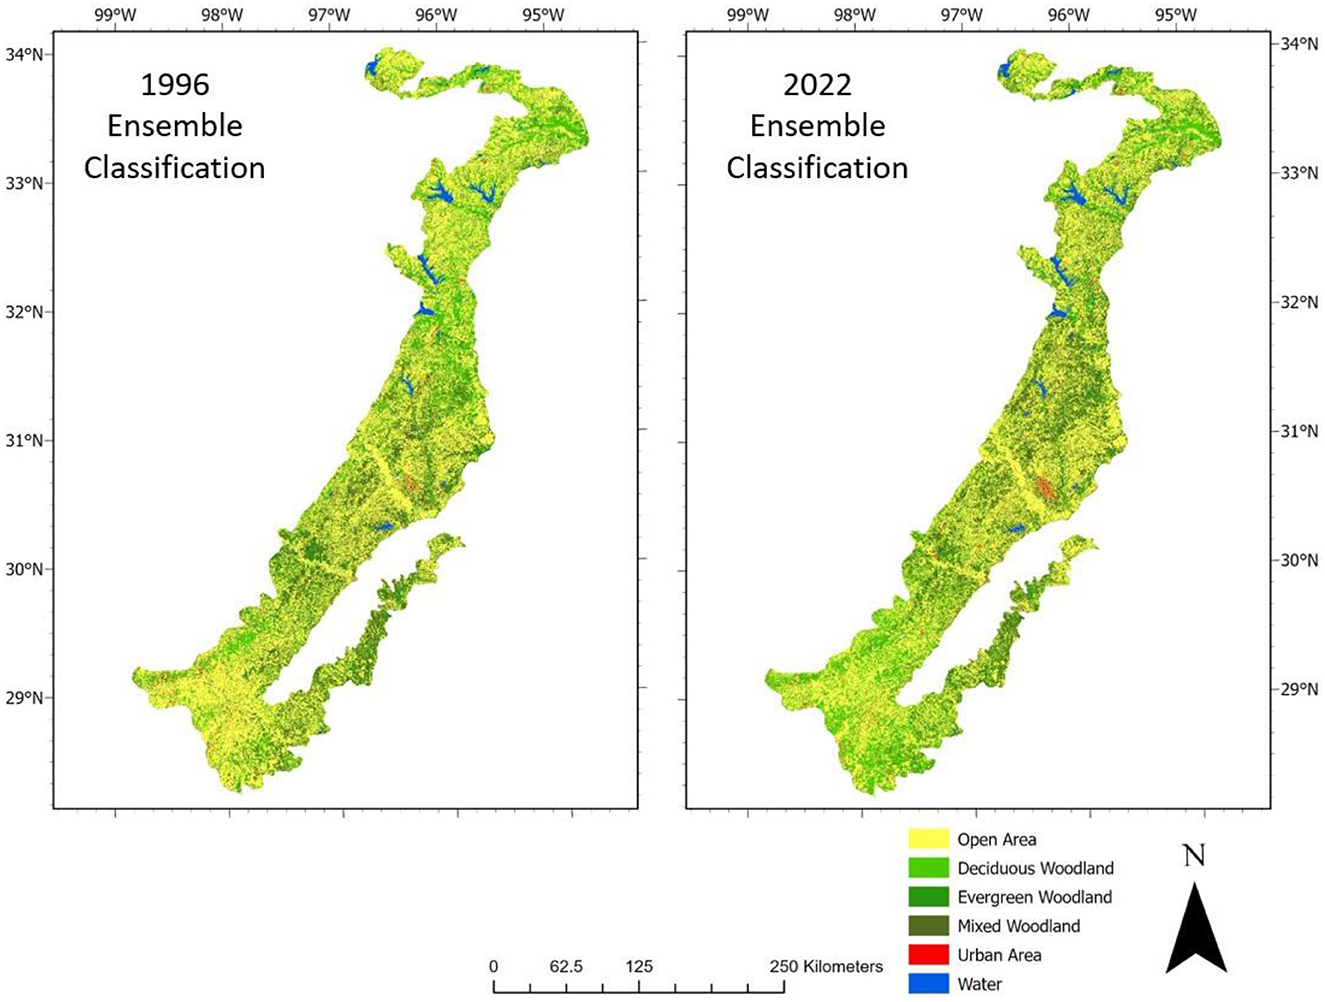
Figure 6. Changes in land cover between 1996 and 2022 as shown by the ensemble classification.
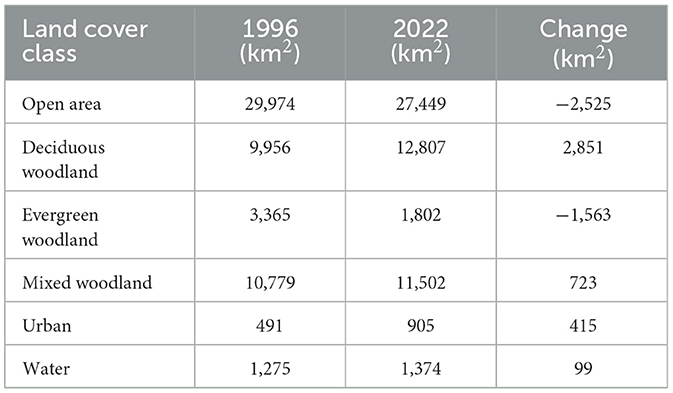
Table 4. Total coverage for each of the six land cover classes in 1996 compared with that in 2022, and extent of change.
Woody plant encroachment has been identified as the primary driver of change in the Post Oak Savannah ecosystem (Table 5). Between 1996 and 2022, ~5,338 km2 of open land underwent a conversion to woodland (Table 5). The greater part of this land cover consists of deciduous woodlands, which account for 4,117 km2 of the total encroached area (Table 5). The transformation of open land into deciduous woodlands is particularly evident in the southern, drier area of the Post Oak Savannah (Figure 6). In addition, a significant expanse of open land (some 1,063 km2) underwent encroachment by mixed forest species (Table 5). The amount of land initially encroached by deciduous woody plants and subsequently subjected to thicketization by evergreen species remains uncertain. Finally, a small area (158 km2) encroached by evergreen woodlands was observed, primarily in the central and northern regions of the Post Oak Savannah, which consists mainly of softwood trees planted for timber production (Table 5).
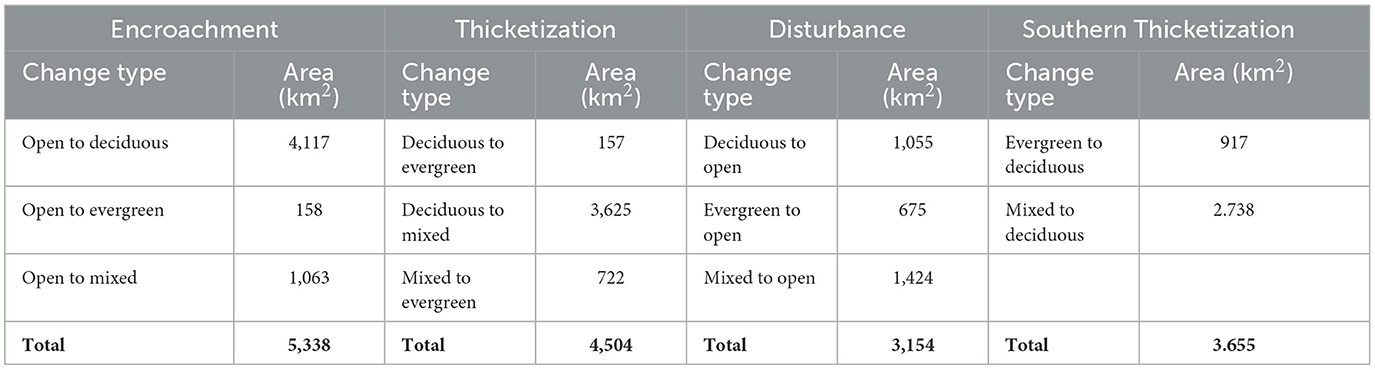
Table 5. Land cover changes during 1996–2022 that reflect the dynamic mechanisms driving changes across the Post Oak Savannah.
Thicketization—the overgrowth of evergreen woody species in the understory—has emerged as the second most important process of land cover change in the Post Oak Savannah (Table 5). A significant portion of this transformation took place in the central and northern regions, as the sub-canopy of the older deciduous woodlands was gradually invaded by evergreen woody plants. Our study identified a total of 3,782 km2 of deciduous woodlands underwent thicketization by evergreen woody plants, resulting in 3,625 km2 being converted to mixed woodlands and 157 km2 being converted to evergreen woodlands (Table 5). The southern portion of the Post Oak Savannah, in contrast, saw a reverse process: 917 km2 of evergreen woodlands and 2,738 km2 of mixed woodlands were transformed into deciduous woodlands, suggesting the action of a distinct dynamic in the southern region (Table 5).
Despite the substantial overall decrease in the extent of open area (about-2,525 km2), a noteworthy amount of open area was also gained through the loss of woodlands (Table 4). Between 1996 and 2022, a total of 1,055 km2 of deciduous woodland, 675 km2 of evergreen woodland, and 1,424 km2 of mixed woodland were converted into open areas (Table 5). Compared with the 3,365 km2 covered by evergreen woodlands in 1996, this class saw the greatest reduction, with over 20% being converted to open space.
The accuracy of LandTrendr outputs in identifying vegetation changes and their corresponding years of change was found to be satisfactory, with an OA of 80.4% (Table 6). Vegetation gain pixels exhibited a user accuracy of 79.3% and a producer accuracy of 83.2%. Vegetation loss pixels showed comparable outcomes, with a user accuracy of 80.7% and a producer accuracy of 83.4%. For the unchanged pixels, user accuracy was 81.3% and producer accuracy was 75.3% (Table 6).
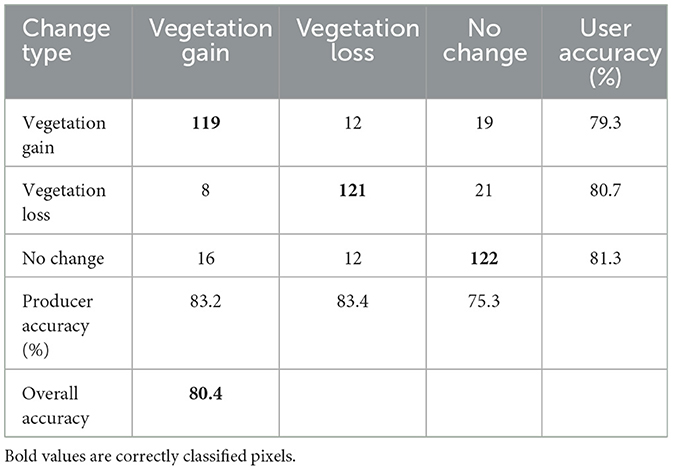
Table 6. LandTrendr vegetation validation using TimeSync and high-resolution Google Earth Pro imagery.
Figure 7 illustrates the processes of encroachment, thicketization, and disturbance taking place in the Post Oak Savannah, as well as LandTrendr fitted lines that effectively capture their temporal progression. Figure 7A illustrates the gradual expansion (mainly between 2001 and 2012) of deciduous woody species into an open area, as depicted by the upward trend of the fitted line. Similarly in Figure 7B, the NBR values show a gradual rise beginning in 2007, as indicated by the fitted line of the model, specifically for the southernmost evergreen woodland patch. The trend line for the northern evergreen woodland patch, depicting encroachment between 2009 and 2016, is not shown in the picture. Figure 7C reflects the impact of a thinning operation conducted in 2001 on a deciduous woodland, as well as the subsequent thicketization. Because these processes overlapped, the resulting mixed woodland was categorized as vegetation gain (having taken place following a vegetation loss).
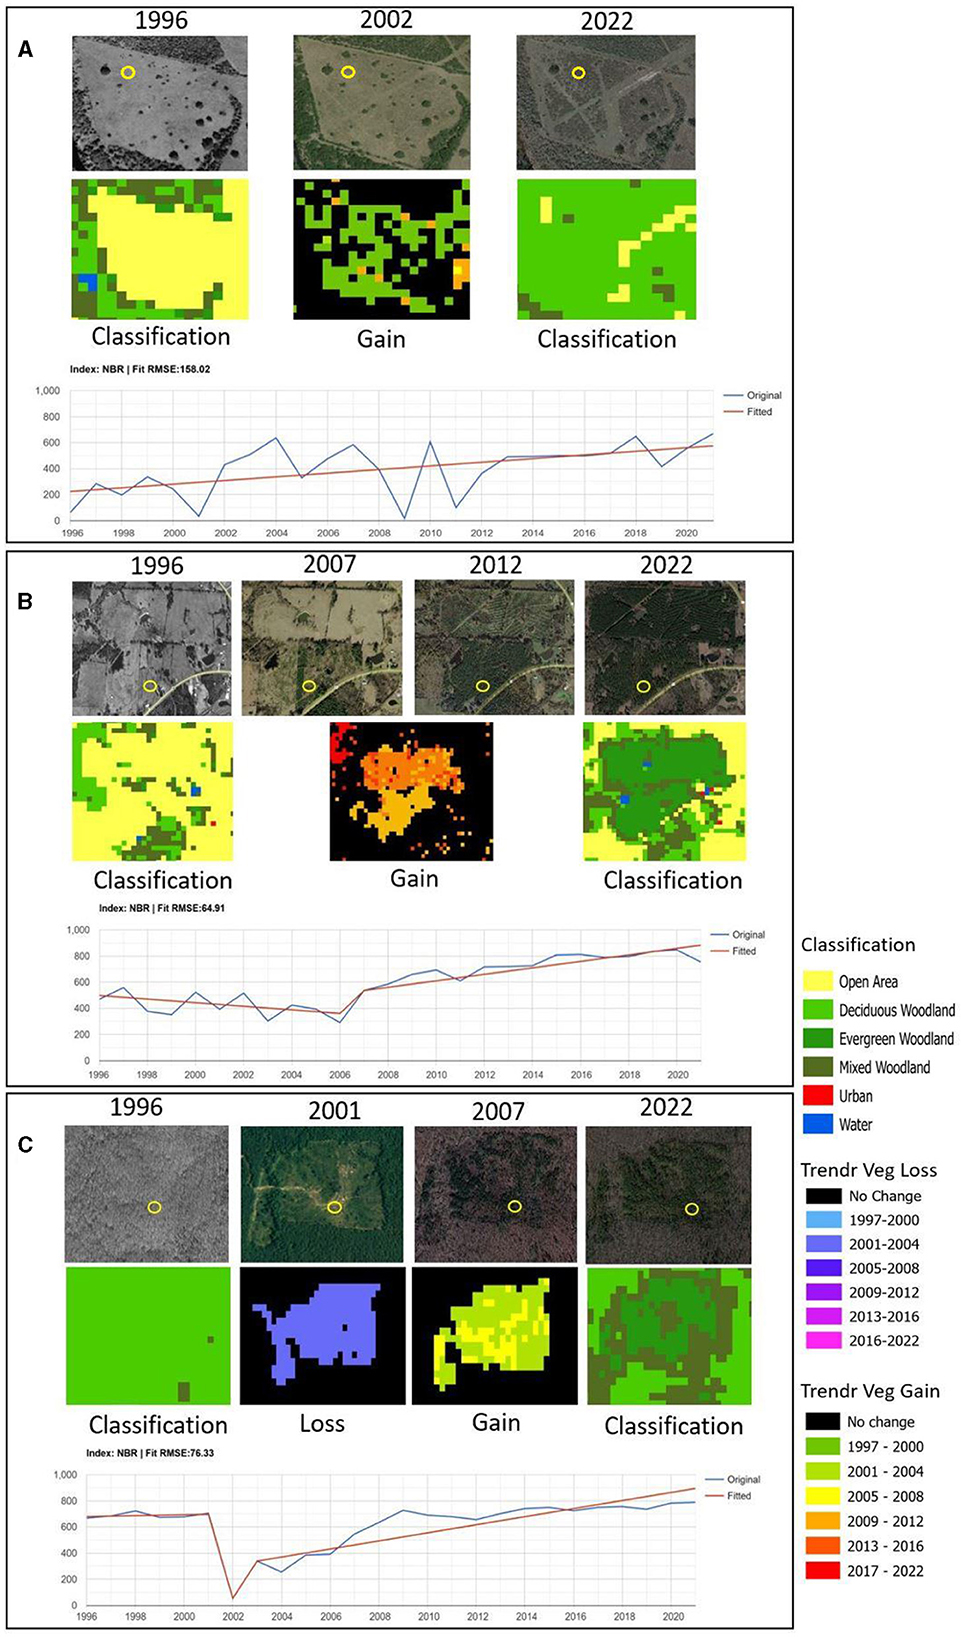
Figure 7. Maps of vegetation change within the Post Oak Savannah between 1996 and 2022, and the corresponding LandTrendr fitted-line graphs of a pixel (designated by yellow circle) within the designated area. The coordinates for the locations are as follows: (A) 97.6449961°W, 28.4604706°N, (B) 94.7603615°W, 33.4467194°N, (C) 95.0309760°W, 33.4861302°N.
Over the 26-year time period, the annual rate of encroachment was 0.37%. This rate varied among different types of woodlands, with deciduous woodlands experiencing a rate of 0.3%, mixed woodlands at 0.07%, and evergreen woodlands at a minuscule 0.008%. A majority of the land cover changes in the Post Oak Savannah took place during a period of just 3 years: 1997–2000 (Figure 8). This brief period saw a significant portion of the overall encroachment taking place, resulting in the conversion of 3,188 km2 of open land into woodland representing an annual rate of 1.4%—a sizeable amount of which was attributed to deciduous woody vegetation (2,342 km2 at an annual rate of 1.0%) and mixed woodlands (732 km2 at an annual rate of 0.3%) (Figure 8A). Evergreen woodlands accounted for the remainder. The next 3-year period (2001–2004) saw a substantial decrease in the level of encroachment and was then followed by a period of consistent increase (2005–2012) (Figure 8A). This trend was observed for all three classes of woodland (Figure 8A). Finally, for the period 2013–2022, overall encroachment rates declined significantly, with a cumulative total of only 114 km2 and an annual rate of 0.05% (Figure 8A).
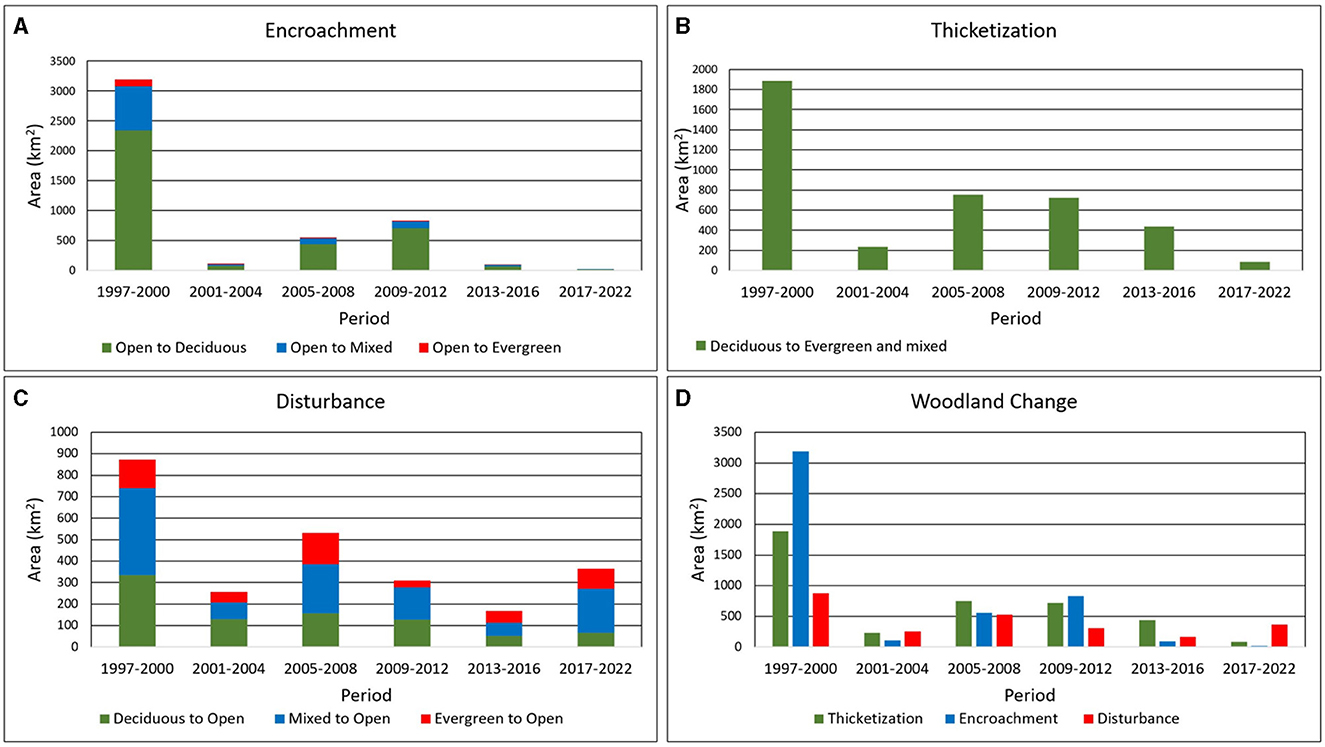
Figure 8. Changes in land cover by period for the three major mechanisms (A) encroachment, (B) thicketization, (C) disturbances, and (D) a period-based comparison of their significance.
Similar patterns were observed in the process of thicketization. Over the 26-year time period the annual rate of thicketization was 0.26%, Nearly half of the total thicketized area (1,886 km2 at an annual rate of 0.85%) came into being during the period 1997–2000 (Figure 8B). Then, between 2001 and 2004, thicketization rates decreased, affecting only 233 km2 at an annual rate of 0.1% (Figure 8B). For the periods 2005–2008 and 2009–2012, rates increased once more, reaching 752 km2 (0.3% annual rate) and 720 km2 (0.3% annual rate), respectively (Figure 8B). And finally— in contrast to the encroachment pattern—from 2013 to 2022 thicketization decreased only marginally, encompassing a total area of 526 km2 (0.1% annual rate) (Figure 8B).
With respect to disturbance, period-based trends showed a greater consistency than those of either encroachment or thicketization (Figure 8C). Over the 26 year time period the annual rate of disturbance was 0.22%. For the woodland classes, disturbance reached its peak between 1997 and 2000, with a total area of 873 km2 (an annual rate of 0.029%) affected (comprising 406 km2 of mixed woodland at an annual rate of 0.18%, 334 km2 of deciduous woodland at an annual rate of 0.15%, and 133 km2 of evergreen woodland at an annual rate of 0.06%) (Figure 8C). The mixed woodland category accounted for the bulk of disturbed woodlands during all periods, with the exception of 2001–2004, when the highest proportion converted to open areas consisted of deciduous woodland (Figure 8C). Between the years 2001 and 2022, the rates of disturbance exhibited a semi-constant pattern, with no instances of falling below 169 km2 (an annual rate of 0.08%) or exceeding 532 km2 (an annual rate of 0.25%) (Figure 8C).
Of the three processes, encroachment accounted for the most significant amount of change between 1996 and 2022, even though most of it took place during the period 1997–2000, with a noticeable decline in subsequent years (Figure 8D). After the year 2000, thicketization emerged as the primary mechanism of change, affecting a greater area than encroachment (Figure 8D). Disturbance was the least significant mechanism in terms of total area affected, yet its rates exhibited consistent stability across all time periods (Figure 8D). Additionally, it is noteworthy that between 2017 and 2022, disturbance affected a larger area than either encroachment or thicketization, marking this period as the start of an overall decline in woodland coverage (Figure 8D).
We found that changes in land cover resulting from encroachment, thicketization, and disturbance took place unevenly throughout the Post Oak Savannah (Figure 9). Encroachment emerged as the prevailing mechanism of change in the southern portion, while also playing a substantial role in the central and northern areas. Most of the encroachment in the latter areas occurred before 2004, in contrast to the southern area, which continued to undergo significant encroachment until 2016 (Figure 9). The prevailing mechanism of transformation in the central and northern areas was thicketization, which proceeded at a relatively consistent rate until 2016; this process was much more limited in the southern part of the region, where it was observed predominantly between 1997 and 2000 (Figure 9). Disturbance patterns were similar across the central and northern parts of the Post Oak Savannah, with a slight decrease observed in the southern area (Figure 9).
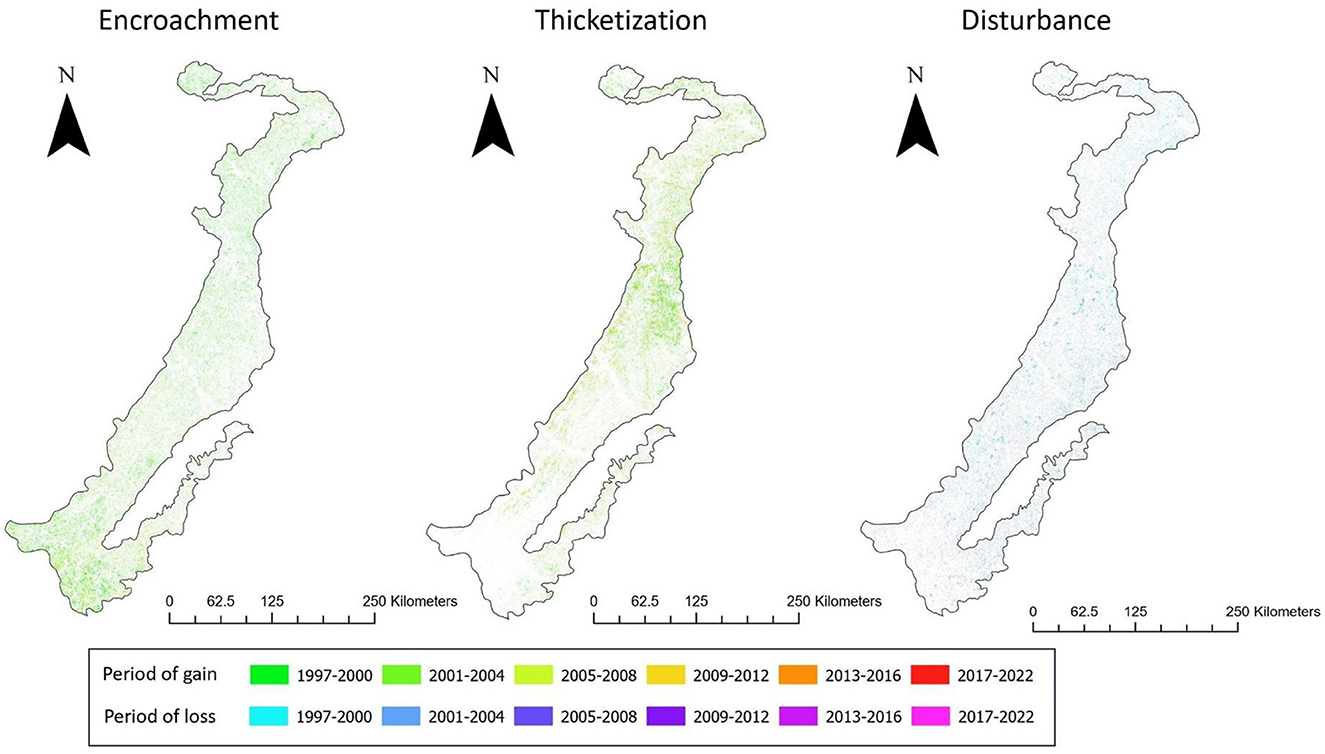
Figure 9. Spatial and temporal changes in land cover within the Post Oak Savannah region from 1996 and 2022 brought about by encroachment, thicketization, and disturbance, resulting in simultaneous periods of woodland cover expansion and reduction.
Compared to previous studies, our methodology demonstrated comparable or slightly improved performance in mapping of the three woodland types (deciduous, evergreen, and mixed). For example, Udali et al. (2021), employing a RF classifier to distinguish different woodland types, achieved a classification accuracy of 94.0% and concluded by emphasizing the importance of using leaf-off images for accurate mapping of woodland types in boreal regions. Wang R. et al. (2023) obtained similar findings when employing leaf-off imagery to distinguish woodland types in a subtropical and humid region of southeastern China. Yet other studies have found that a fusion of the imagery captured during different seasons yields favorable outcomes in the mapping of woodlands (Liu et al., 2018; Macintyre et al., 2020; Bjerreskov et al., 2021; Turlej et al., 2022). Our study, given the accuracy scores attained, further validates these findings—demonstrating the advantages of multi-temporal optical imagery, particularly leaf-off data, in the cartographic representation of woodlands.
The practice of stacking and categorizing multiple ML outputs as base-learners for meta-learning is a recent development, the results of which are comparable to those of deep learning (DL) algorithms (Long et al., 2021; Mallick et al., 2022; Zhang et al., 2022; Wang S. et al., 2023). In our study, use of the feature-based class predictions obtained from ML base learners as inputs for a ML meta-learning classifier enhanced the accuracy of our classification results. The integration of this algorithm into the GEE framework resulted in overall accuracies of 94.3 and 96.5% for the years 1996 and 2022, respectively (Table 3) —an increase of at least 0.9% compared to our most accurate classifier (GBT) and of 5.9% over that of our least accurate classifier (CART). Even so, the improvements in accuracy achieved in our study were not as significant as those reported for previous studies employing similar methodologies. For example, Long et al. (2021) reported a nearly 10% increase in accuracy when classifying land cover in a wetland in China. Similarly, Zhang et al. (2022) reported a remarkable 22.12% improvement in accuracy for estimating above-ground biomass worldwide. Possible factors contributing to the significant variations in accuracy improvement among the studies include disparities in data, scale, location, and classification methodologies. Nevertheless, it is clear that implementation of the ensemble-stacking algorithm yielded increased accuracies to those of the individual base-learners.
We employed the LandTrendr algorithm to effectively capture the dynamic temporal nature of land cover transitions in the Post Oak Savannah region from 1996 to 2022. The results obtained were satisfactory, with an overall accuracy of 80.4% in capturing both the year of change and the type of change (vegetation gain, vegetation loss, or no change—see Table 6). Our results were comparable with those of previous research conducted by Zhu et al. (2019), Gelabert et al. (2021), Long et al. (2021), and Xiao et al. (2023). Zhu et al. (2019) documented marginal enhancements in outcomes by employing Landtrendr, achieving accuracies of up to 87% for lake conversion and 83% for cropland conversion. This was accomplished by utilizing an NDVI image stack to track the yearly progression of lakes transitioning into croplands and vice versa. Furthermore, Gelabert et al. (2021) utilized Tasseled Cap transformation image stacks and integrated their results through SVM to map WPE during secondary succession in the Pyrenees Mountains of Northern Spain. The results showed a marginal enhancement in comparison to our findings, offering backing for the utilization of ML in the assessment of LandTrendr outputs for WPE classification. Based on these comparisons, it is suggested that enhancing the precision of these findings could be achieved through the integration of machine learning algorithms. This integration could be complemented by the utilization of different vegetation indices (e.g., NDVI, EVI, and Tasseled Cap Greenness) and optical bands such as NIR in conjunction with NBR. This approach holds promise for shaping forthcoming research endeavors.
Our findings confirm the hypothesis put forth by earlier researchers that the density of woody vegetation in the Post Oak Savannah has increased over time (Campbell, 1925; Tharp, 1926; McBride, 1933; Parmalee, 1955; Midwood et al., 1998; Singhurst et al., 2004; Stambaugh et al., 2011). The encroachment of 5,338 km2 of open area by woody plants (Table 5), as well as the thicketization of 3,782 km2 of long-established deciduous oak patches by the evergreen species Juniperus virginiana and Ilex vomitoria (Table 5), are likely attributable to a combination of overgrazing and an altered fire regime. Conversely, significant stretches of woodland, amounting to some 3,154 km2 (Table 5), have undergone conversion to open areas. The contribution of direct human disturbance of woodlands to this conversion, though active management practices such as mechanical removal of woody material and prescribed burning, has been a neglected factor in investigations of land cover change over the past 26 years. The net outcome of these various alterations of land cover is a modest (4.2%) rise in woodland coverage within the Post Oak Savannah region from 1996 to 2022—considerably less than initially expected. However, in comparison to previous studies on WPE conducted in the Southern Great Plains region, the annual rate of change for the woodland classes identified in this study was found to be similar. Our research identified a yearly percentage change of 0.37% from open areas to woodland, with 0.3% associated with deciduous woodlands and 0.07% with mixed and evergreen woodlands. Asner et al. (2003) reported an increment in woody cover by 0.2% in a 400-km2 area of northern Texas, USA, between 1937 and 1999, primarily attributed to the growth of deciduous shrubs, particularly Prospopis glandulosa. Smeins and Merrill (1988) discovered that Juniperus ashei and Juniperus pinchotti, which are evergreen trees resembling Juniperus virginiana, were gradually spreading into a semiarid grassland in central Texas at a yearly rate of 0.6%.
The 4.2% increase in woodland cover fails to fully capture the comprehensive and dynamic changes that have taken place during this period. This region's distinctive geographical characteristics, including pronounced differences in latitude (28 to 34°N) and in precipitation (with a gradient ranging from 900 mm in the southwest to 1,150 mm in the northeast), have given rise to an uneven distribution of alterations in land cover. Although all three change processes were observed in the entire region, their expression varied in magnitude. The northern and central areas of the Post Oak Savannah are dominated by a deciduous overstory consisting of Quercus stellata, Quercus Marilandica, and Carya texana, as is evident in the 1996 ensemble classification (Figure 6). Thicketization then took place, through the growth of sub-canopy woody plants (Juniperus virginiana and Ilex vomitoria), transforming a significant portion of these areas into mixed woodlands by the year 2022 (see Figure 6). In contrast, in 1996 the southern area of the Savannah consisted primarily of a phenologically diverse overstory, with Quercus fusiformis, Quercus virginiana, and Prosopis glandulosa being the dominant species (Figure 6). While many of the trees in the area persisted, by 2022 the invasion of the surrounding open spaces by deciduous woody species—particularly Prosopis glandulosa, Acacia ridgula, Colubrina texanis, and Esyanhardtia texana—had transformed the terrain into a predominantly deciduous woodland. In the region as a whole, woodland disturbance emerged as the most consistent mechanism of these changes. Responsible for the disturbances in woodland areas are shifts in historical land use (such as grazing, farming, urban and rural development, and lignite coal mining) (Parmalee, 1955; Bartlett, 1995; Loucks, 1999). For example, the urban land cover class increased by 84.3% over the period 1996 to 2022, expanding from 491 to 905 km2–which in fact is a conservative estimate because many small rural roads were misclassified as open space (disadvantage of medium resolution imagery) (Table 4). This growth aligns with population trends in Texas, as eight out of the ten fastest-growing counties in the United States are situated in Texas (U.S. Census Bureau, 2011).
Much of the anthropogenic influence on the Post Oak Savannah region is attributable to management practices employed on privately owned land. It is reported that as of 2016, around 63% of woodlands in the region are under private ownership (Willhoite, 2015). Additionally, according to Bexanson (2000), by the year 2001 < 1% of the ecological system was being actively managed for conservation purposes. In the mid 1900s, wildlife biologists conducted research that revealed the negative impact of brush control on wildlife, particularly in south Texas. Concurrently, hunting of white-tailed deer was growing in popularity, providing landowners with economic incentives to decrease brush control in order to enhance the habitat for deer and other wildlife species (Taylor et al., 1999). Furthermore, in 1995, Texas voters ratified a constitutional amendment making wildlife management an eligible “agricultural practice”, which permitted landowners whose land was currently assessed for agricultural use under the Open Space program to also use their land for wildlife management and thereby qualifying for tax exemptions from the Texas Parks and Wildlife Department. In south Texas, it is generally recommended that individuals enrolled in this program refrain from removing woody plants that constitute more than 25–30% of their total property. The findings of our study reflect the fact that these policies contributed to a substantial decrease in the clearance of woody plants by private landowners, which paved the way for the remarkable expansion of deciduous woody plants observed in the southern Post Oak Savannah from 1997 to 2012. Similar findings were reported by Gelabert et al. (2021) in Spain, where the abandonment of ranch land led to a surge in WPE (which then gradually diminished).
The observed temporal variations in woodland changes, as depicted in Figure 9, suggest the emergence of several stable vegetative states. The reduction in encroachment after 2012 indicates that the southern Post Oak Savannah has evolved into a stable landscape dominated by deciduous shrubs. Similarly, the decline in thicketization after 2016 led to the development of a stable thicketized oak woodland in the central and northern areas of the Post Oak Savannah. Hernández-Valdez et al. (2023) observed a comparable pattern in a secondary shrubland/oak woodland mosaic in Central Mexico. This particular ecosystem had been subjected to intensive grazing and farming activities for over 70 years, which were followed by a decrease in grazing intensity and the abandonment of cultivation. It has been proposed that in the early 20th century, human-induced fire suppression created the conditions for heightened oak recruitment and thereby for the subsequent invasion of oak savannahs by Juniperus virginiana and, later, Ilex vomitoria (Dupree, 2004; Stambaugh et al., 2014; Chapman and Bolen, 2017; Galgamuwa et al., 2020). In contrast to declining encroachment and thicketization rates, disturbance rates remained relatively consistent. This suggests that open areas currently under direct management will maintain their stability throughout the entire Post Oak Savannah region. Part of this phenomenon can be credited to the emergence of land management workshops that utilize “peer-to-peer” instructional methods, which have become increasingly popular in Texas. These workshops have encouraged land managers to participate in the conservation of open spaces (Restivo et al., 2023).
The advent of cloud-based computing and the availability of remote sensing databases have brought about a transformation in researchers' ability to conduct comprehensive and precise environmental analyses on a large scale. By facilitating the quantification and upscaling of field findings, these advancements enable the characterization of underlying ecological and anthropogenic processes that impact large regions. Our study has leveraged these advancements to assess the impacts of WPE, thicketization, and disturbance on the Post Oak Savannah region from 1996 to 2022. A major finding of this assessment is that three distinct plant species communities currently coexist and have remained stable over a period of time: deciduous shrubs in the southern area, and a mosaic of open areas and thicketized oak woodlands in the central and northern areas. Further, the successional divergence of these plant communities indicates the significant impact of human modification on the landscape.
In the past, the primary responsibility of management was predominantly delegated to private owners. Nonetheless, the results of this study have the potential to offer valuable insights for local and state governmental, as well as non-governmental organizations, concerning targeted WPE management initiatives. Furthermore, this study investigates different types of WPE, specifically encroachment and thicketization, which require diverse treatment strategies and aid in the understanding of challenges faced by inhabitants in this region. A notable limitation of this study was the unavailability of high-resolution leaf-off historical imagery predating 1996, which constrained the timeframe of the study. This dataset could have been utilized as valuable reference data to expand the study's baseline to 1985, aligning with the initiation of Landsat's systematic data collection. The phenomenon of WPE is a gradual process that unfolds over the course of several decades. Analyzing its influence on the Post Oak Savannah throughout a 26-year timeframe aids in illustrating its implications on the terrain. Nevertheless, the study could have provided more profound insights if it had been feasible to prolong the duration of the study and expand the time period intervals from 4–6 years to 10–15 years.
Future research endeavors can enhance the LandTrendr modeling technique by integrating various vegetation indices and surface reflectance bands. Reclassification through the use of DL architectures could be a promising avenue to explore, but may not warrant significant investment given the already high level of classification accuracy demonstrated by our study. Furthermore, the addition of Sentinel-2 imagery with a higher spatial resolution (10 m), can offer valuable insights into the historical developments of the Post Oak Savannah. Finally, the findings of this study could be utilized in tandem with other water-related research in the region to enhance comprehension of the effects of WPE and forest disturbance on the significant Carrizo-Wilcox Aquifer.
The original contributions presented in the study are included in the article/Supplementary material, further inquiries can be directed to the corresponding author.
HO: Conceptualization, Data curation, Formal analysis, Funding acquisition, Investigation, Methodology, Project administration, Resources, Software, Supervision, Validation, Visualization, Writing – original draft, Writing – review & editing. BW: Funding acquisition, Project administration, Supervision, Writing – review & editing. SP: Funding acquisition, Methodology, Project administration, Resources, Software, Supervision, Writing – review & editing.
The author(s) declare financial support was received for the research, authorship, and/or publication of this article. This work was supported by Thicketization of Oak Savannas: Can Restoration Lead to Greater Regional Groundwater Recharge?—National Institute of Food and Agriculture—AFRI Competitive Grant (2022-67019-36267).
The authors declare that the research was conducted in the absence of any commercial or financial relationships that could be construed as a potential conflict of interest.
All claims expressed in this article are solely those of the authors and do not necessarily represent those of their affiliated organizations, or those of the publisher, the editors and the reviewers. Any product that may be evaluated in this article, or claim that may be made by its manufacturer, is not guaranteed or endorsed by the publisher.
The Supplementary Material for this article can be found online at: https://www.frontiersin.org/articles/10.3389/ffgc.2024.1396999/full#supplementary-material
Adugna, T., Xu, W., and Fan, J. (2022). Comparison of random forest and support vector machine classifiers for regional land cover mapping using coarse resolution FY-3C images. Remote Sens. 14:574. doi: 10.3390/rs14030574
Alshari, E. A., Abdulkareem, M. B., and Gawali, B. W. (2023).Classification of land use/land cover using artificial intelligence (ANN-RF). Front. Artif. Intell. 5:964279. doi: 10.3389/frai.2022.964279
Al-Yaari, A., Wigneron, J. P., Dorigo, W., Colliander, A., Pellarin, T., Hahn, S., et al. (2019). Assessment and inter-comparison of recently developed/reprocessed microwave satellite soil moisture products using ISMN ground-based measurements. Remote Sens. Environ. 224, 289–303. doi: 10.1016/j.rse.2019.02.008
Archer, S. R. (2009). Rangeland Conservation and Shrub Encroachment: New Perspectives on an Old Problem. Wild Rangelands: Conserving Wildlife While Maintaining Livestock in Semi-Arid Ecosystems. John Wiley and Sons Ltd., 53–97.
Asner, G. P., Archer, S., Hughes, R. F., Ansley, R. J., and Wessman, C. A. (2003). Net changes in regional woody vegetation cover and carbon storage in Texas Drylands, 1937–1999. Glob. Chang. Biol. 9, 316–335. doi: 10.1046/j.1365-2486.2003.00594.x
Barger, N. N., Archer, S. R., Campbell, J., Huan, C., Morton, J., and Knapp, A. (2011). Woody plant proliferation in North American drylands: a synthesis of impacts on ecosystem carbon balance. J. Geophys. Res. 116:1506. doi: 10.1029/2010JG001506
Bartlett, R. C. (1995). Saving the Best of Texas: A Partnership Approach to Conservation. Austin, TX: University of Texas Press.
Basant, S., Wilcox, B., Wyatt, B., Newman, B., and Parada, C. (2023). Thicketized oak woodlands reduce groundwater recharge. Sci. Total Environ. 862:160811. doi: 10.1016/j.scitotenv.2022.160811
Basualdo, M., Huykman, N., Volante, J. N., Paruelo, J. M., and Piñeiro, G. (2019). Lost forever? Ecosystem functional changes occurring after agricultural abandonment and forest recovery in the semiarid Chaco forests. Sci. Total Environ. 650, 1537–1546. doi: 10.1016/j.scitotenv.2018.09.001
Belenguer-Plomer, M. A., Tanase, M. A., Fernandez-Carrillo, A., and Chuvieco, E. (2019). Burned area detection and mapping using Sentinel-1 backscatter coefficient and thermal anomalies. Remote Sens. Environ. 233:111345. doi: 10.1016/j.rse.2019.111345
Bexanson, D. (2000). Natural vegetation types of Texas and their representation in conservation areas (M. A. Thesis). University of Texas, Austin, TX, United States.
Bjerreskov, K. S., Nord-Larsen, T., and Fensholt, R. (2021). Classification of nemoral forests with fusion of multi-temporal sentinel-1 and 2 data. Remote Sens. 13:950. doi: 10.3390/rs13050950
Bonan, G. B. (2008). Forests and climate change: forcings, feedbacks, and the climate benefits of forest. Science 320, 1444–1449. doi: 10.1126/science.1155121
Breiman, L., Friedman, J., Olshen, R., and Stone, C. (2017). Classification and regression trees. New York, NY: Chapman and Hall/CRC, 1–358.
Brewer, J. S. (2023). Mechanisms of fire-maintained plant species diversity in species-rich wet pine savannas. Ecosphere 14:1. doi: 10.1002/ecs2.4387
Bright, B. C., Hudak, A. T., Kennedy, R. E., Braaten, J. D., and Henareh Khalyani, A. (2019). Examining post-fire vegetation recovery with Landsat time series analysis in three western North American forest types. Fire Ecol. 15, 1–14. doi: 10.1186/S42408-018-0021-9/TABLES/7
Buchhorn, M., Lesiv, M., Tsendbazar, N. E., Herold, M., Bertels, L., and Smets, B. (2020). Copernicus global land cover layers—collection 2. Remote Sens. 12:1044. doi: 10.3390/rs12061044
Bui, Q. T., Chou, T. Y., van Hoang, T., Fang, Y. M., Mu, C. Y., Huang, P. H., et al. (2021). Gradient boosting machine and object-based CNN for land cover classification. Remote Sens. 13:2709. doi: 10.3390/rs13142709
Cai, Y., Liu, S., and Lin, H. (2020). Monitoring the vegetation dynamics in the dongting lake wetland from 2000 to 2019 using the BEAST algorithm based on dense landsat time series. Appl. Sci. 10:4209. doi: 10.3390/app10124209
Camargo, F. F., Sano, E., Almeida, C., Mura, J., and Almeida, T. (2019). A comparative assessment of machine-learning techniques for land use and land cover classification of the Brazilian Tropical Savanna using ALOS-2/PALSAR-2 polarimetric images. Remote Sens. 11:1600. doi: 10.3390/rs11131600
Campbell, E. G. (1925). Plant relations in Brazos County, Texas with special reference to eastern and western types. Ecology 6, 163–170. doi: 10.2307/1929372
Chapman, B. R., and Bolen, E. G. (2017). The Natural History of Texas. College Station: Texas A&M University Press (Integrative Natural History Series). Available online at: https://www.tamupress.com/9781623495725/the-natural-history-of-texas (accessed: October 30, 2023).
Chen, X. L., Zhao, H., Li, P., and Yin, Z. (2006). Remote sensing image-based analysis of the relationship between urban heat island and land use/cover changes. Remote Sens. Environ. 104, 133–146. doi: 10.1016/j.rse.2005.11.016
Cohen, W. B., Healey, S. P., Yang, Z., Zhu, Z., and Gorelick, N. (2020). Diversity of algorithm and spectral band inputs improves landsat monitoring of forest disturbance. Remote Sens. 12:1673. doi: 10.3390/rs12101673
Cohen, W. B., Yang, Z., Healey, S. P., Kennedy, R. E., and Gorelick, N. (2018). A LandTrendr multispectral ensemble for forest disturbance detection. Remote Sens. Environ. 205, 131–140. doi: 10.1016/j.rse.2017.11.015
Dai, L., Guo, X., Ke, X., Zhang, F., Li, Y., Peng, C., et al. (2020). Moderate grazing promotes the root biomass in Kobresia meadow on the northern Qinghai-Tibet Plateau. Ecol. Evol. 9, 9395–9406. doi: 10.1002/ece3.5494
Diggs, G. M., Lipscomb, B. L., and O'Kennon, R. J. (1999). Shinners & Mahler's illustrated flora of north central Texas. Sida 16.
Dupree, S. R. (2004). Managing Invasive Yaupon Holly in the Texas Post Oak Savannah. Lubbock, TX: Texas Tech University.
Eldridge D. J. Bowker M. A. Maestre F. T. Roger E. Reynolds J. F. Whitford W. G. (2011) Impacts of shrub encroachment on ecosystem structure functioning: towards a global synthesis. Ecol. Lett. 14, 709–722. 10.1111/J.1461-0248.2011.01630.X
Eldridge, D. J., Wang, L., and Ruiz-Colmenero, M. (2015). Shrub encroachment alters the spatial patterns of infiltration. Ecohydrology 8, 83–93. doi: 10.1002/eco.1490
Fowler, N. L., and Beckage, B. (2019). Savannas of North America. Savanna Woody Plants Large Herb. 123–150. doi: 10.1002/9781119081111.ch5
Frolking, S., Palace, M. W., Clark, D. B., Chambers, J. Q., Shugart, H. H., and Hurtt, G. C. (2009). Forest disturbance and recovery: a general review in the context of spaceborne remote sensing of impacts on aboveground biomass and canopy structure. J. Geophys. Res. 114, 1–2. doi: 10.1029/2008JG000911
Fuhlendorf, S. D., Woodward, A., Leslie, D., and Shackford, J. (2002). Multi-scale effects of habitat loss and fragmentation on lesser prairie-chicken populations of the US Southern Great Plains. Landsc. Ecol. 17, 617–628. doi: 10.1023/A:1021592817039
Galgamuwa, G. A. P., Wang, J., and Barden, C. J. (2020). Expansion of Eastern Redcedar (Juniperus virginiana L.) into the deciduous woodlands within the forest–Prairie Ecotone of Kansas. Forests 11:154. doi: 10.3390/f11020154
Garza, N. E., and Blackburn, W. H. (1985). The effect of early winter or spring burning on runoff, sediment, and vegetation in the post oak savannah of Texas. J. Range Manage. 38, 283–287. doi: 10.2307/3898988
Ge, S., Antropov, O., Su, W., Gu, H., and Praks, J. (2019). “Deep recurrent neural networks for land-cover classification using sentinel-1 insar time series,” in International Geoscience and Remote Sensing Symposium (IGARSS) (Yokohama), 473–476.
Gelabert, P. J., Rodrigues, M., de la Riva, J., Ameztegui, A., Sebastia, M., and Vega-Garcia, C. (2021). LandTrendr smoothed spectral profiles enhance woody encroachment monitoring. Remote Sens. Environ. 262:112521. doi: 10.1016/j.rse.2021.112521
Gorelick, N., Hancher, M., Dixon, M., Ilyushchenko, S., Thau, D., and Moore, R. (2017). Google Earth Engine: planetary-scale geospatial analysis for everyone. Remote Sens. Environ. 202, 18–27. doi: 10.1016/j.rse.2017.06.031
Grace, J., Jose, J., Meir, P., Miranda, H., and Montes, R. (2006). Productivity and carbon fluxes of tropical savannas. J. Biogeogr. 33, 387–400. doi: 10.1111/j.1365-2699.2005.01448.x
Griffith, G. E., Bryce, S., Omernik, J., and Rodgers, A. (2007). Ecoregions of Texas. Austin, TX: Texas Commission on Environmental Quality.
Healey, S. P., Cohen, W., Yang, Z., Kenneth Brewer, C., Brooks, E., Gorelick, N., et al. (2018). Mapping forest change using stacked generalization: an ensemble approach. Remote Sens. Environ. 204, 717–728. doi: 10.1016/j.rse.2017.09.029
Hernández-Valdez, S., Douterlungne, D., Huber-Sannwald, E., Trujillo-Acatitla, R., Tuxpan-Vargas, J., and Flores-Cano, J. (2023). Using the Alternative Stable States Framework to understand the persistence of secondary shrubland within a Mexican oak forest with livestock and agricultural legacies. Ecol. Eng. 197:107109. doi: 10.1016/j.ecoleng.2023.107109
Huang, Y., Scanlon, B., Nicot, J., Reedy, R., Dutton, A., Van Kelley, A., et al. (2012). Sources of groundwater pumpage in a layered aquifer system in the Upper Gulf Coastal Plain, USA. Hydrogeol. J. 20, 783–796. doi: 10.1007/s10040-012-0846-2
Hutchison, R. W. (2009). Aquifers of the Upper Plains of Texas. Austin, TX: Texas Water Development Board.
Kennedy, R. E., Yang, Z., and Cohen, W. B. (2010). Detecting trends in forest disturbance and recovery using yearly Landsat time series: 1. LandTrendr — Temporal segmentation algorithms. Remote Sens. Environ. 114, 2897–2910. doi: 10.1016/j.rse.2010.07.008
Kennedy, R. E., Yang, Z., Gorelick, N., Braaten, J., Cavalcante, L., Cohen, W., et al. (2018). Implementation of the LandTrendr Algorithm on Google Earth Engine. Remote Sens. 10:691. doi: 10.3390/rs10050691
Key, C. H., and Benson, N. C. (2006). Landscape Assessment: Ground measure of severity, the Composite Burn Index; and Remote Sensing of Severity, the Normalized Burn Ratio. Ogden, UT: USDA Forest Service..
Keys, R. G. (1981). Cubic convolution interpolation for digital image processing. IEEE Trans. Acoust. 29, 1153–1160. doi: 10.1109/TASSP.1981.1163711
Lautenbach, J. M., Plumb, R. T., Robinson, S. G., Hagen, C. A., Haukos, D. A., and Pitman, J. C. (2016). Lesser prairie-chicken avoidance of trees in a grassland landscape. Rangeland Ecol. Manage. 70, 78–86. doi: 10.1016/J.RAMA.2016.07.008
Lehmann, C. E. R., Anderson, T. M., Sankaran, M., Higgins, S. I., Archibald, S., Hoffmann, W. A., et al. (2014). Savanna vegetation-fire-climate relationships differ among continents. Science 343, 548–552. doi: 10.1126/SCIENCE.1247355
Leite, P. A. M., Wilcox, B. P., and McInnes, K. J. (2020). Woody plant encroachment enhances soil infiltrability of a semiarid karst savanna. Environ. Res. Commun. 2:115005. doi: 10.1088/2515-7620/abc92f
Lewis, K., de Barros, V., Cure, F., Davies, M., Furtado, M., Hill, T., et al. (2022). Mapping native and non-native vegetation in the Brazilian Cerrado using freely available satellite products. Sci. Rep. 12, 1–17. doi: 10.1038/s41598-022-05332-6
Ling, Y., Teng, S., Liu, C., Dash, J., Morris, H., and Pastor-Guzman, J. (2022). Assessing the accuracy of forest phenological extraction from Sentinel-1 C-band backscatter measurements in deciduous and coniferous forests. Remote Sens. 14:674. doi: 10.3390/rs14030674
Liu, Y., Gong, W., Hu, X., and Gong, J. (2018). Forest type identification with random forest using Sentinel-1A, Sentinel-2A, Multi-Temporal Landsat-8 and DEM Dat. Remote Sens. 10:946. doi: 10.3390/rs10060946
Long, X., Li, X., Lin, H., and Zhang, M. (2021). Mapping the vegetation distribution and dynamics of a wetland using adaptive-stacking and Google Earth Engine based on multi-source remote sensing data. Int. J. Appl. Earth Observ. Geoinf. 102:102453. doi: 10.1016/j.jag.2021.102453
Loucks, C. (1999). “East-central Texas forests,” in Terrestrial Ecoregions of North America: A Conservation Assessment, eds. T. Rickets, E. Dinerstein, and D. Olson (Washington, DC: Island Press), 196–197.
Macintyre, P., van Niekerk, A., and Mucina, L. (2020). Efficacy of multi-season Sentinel-2 imagery for compositional vegetation classification. Int. J. Appl. Earth Observ. Geoinf. 85:101980. doi: 10.1016/j.jag.2019.101980
Mallick, J., Talukdar, S., and Ahmed, M. (2022). Combining high resolution input and stacking ensemble machine learning algorithms for developing robust groundwater potentiality models in Bisha watershed, Saudi Arabia. Appl. Water Sci. 12, 1–19. doi: 10.1007/s13201-022-01599-2
McBride, J. B. (1933). The vegetation and habitat factors of the Carrizo sands. Ecol. Monogr. 3, 247–297. doi: 10.2307/1943087
Midwood, A. J., Boutton, T., Archer, S. R., and Watts, S. (1998). Water use by woody plants on contrasting soils in a savanna parkland: assessment with δ2H and δ18O. Plant Soil 205, 13–24. doi: 10.1023/A:1004355423241
Moore, G. W., Barre, D. A., and Owens, M. K. (2012). Does shrub removal increase groundwater recharge in Southwestern Texas semiarid rangelands? Rangeland Ecol. Manag. 65, 1–10. doi: 10.2111/REM-D-11-00055.1
Olariu, H. G., Malambo, L., Popescu, S., and Virgil Wilcox, B. (2022). Woody plant encroachment: evaluating methodologies for semiarid woody species classification from drone images. Remote Sens. 14:1665. doi: 10.3390/rs14071665
Oo, T. K., Arunrat, N., Sereenonchai, S., Ussawarujikulchai, A., Chareonwong, U., and Nutmagul, W. (2022). Comparing four machine learning algorithms for land cover classification in gold mining: a case study of Kyaukpahto Gold Mine, Northern Myanmar. Sustainability 14:10754. doi: 10.3390/su141710754
Packard, S., and Mutel, C. (1997). The Tallgrass Restoration Handbook : for Prairies, Savannas, and Woodlands. Washington, DC: Island Press.
Pal, M. (2005). Random forest classifier for remote sensing classification. Int. J. Remote Sens. 26, 217–222. doi: 10.1080/01431160412331269698
Parmalee, P. (1955). Some factors affecting nesting success of the Bob-white Quail in east-central Texas. Am. Midland Nat. 53, 45–55. doi: 10.2307/2422296
Pasquarella, V. J., Arevalo, P., Bratley, K., Bullock, e., Gorelick, N., Yang, Z., et al. (2022). Demystifying LandTrendr and CCDC temporal segmentation. Int. J. Appl. Earth Observ. Geoinf. 110:102806. doi: 10.1016/j.jag.2022.102806
Pyne, S. J. (2016). Fire in the mind: changing understandings of fire in Western civilization. Philos. Transact. R. Soc. B Biol. Sci. 371:166. doi: 10.1098/rstb.2015.0166
Qiu, S., Zhu, Z., Olofsson, P., Woodcock, C. E., and Jin, S. (2023). Evaluation of Landsat image compositing algorithms. Remote Sens. Environ. 285:113375. doi: 10.1016/j.rse.2022.113375
Restivo, K. N., Smith, S., and Frank, M. G. (2023). A mediated peer-to-peer prescribed fire outreach program for Texas Hill country landowners. Rangeland Ecol. Manag. 91, 55–63. doi: 10.1016/j.rama.2023.08.004
Rideout, D. W. (1994). The Post Oak Savannah Deer Herd Past, Present, Future. Austin, TX: Texas Parks and Wildlife.
Rogan, J., Franklin, J., Stow, D., Miller, J., Woodcock, C., and Roberts, D. (2008). Mapping land-cover modifications over large areas: a comparison of machine learning algorithms. Remote Sens. Environ. 112, 2272–2283. doi: 10.1016/j.rse.2007.10.004
Sala, O. E., and Maestre, F. T. (2014). Grass–woodland transitions: determinants and consequences for ecosystem functioning and provisioning of services. J.Ecol. 102, 1357–1362. doi: 10.1111/1365-2745.12326
Schmidly, D. J. (2002). Texas natural history: a century of change. J. Mammal. 8, 329–331. doi: 10.1644/1545-1542(2003)084<0329:R>2.0.CO;2
Scholes, R. J., and Archer, S. R. (1997). Tree-grass interactions in Savannas. Annu. Rev. Ecol. Syst. 28, 517–544. doi: 10.1146/annurev.ecolsys.28.1.517
Shi, X., Deng, Z., Ding, X., and Li, L. (2020). Land cover classification combining Sentinel-1 and Landsat 8 imagery driven by Markov random field with amendment reliability factors. Eur. J. Wireless Commun. Network. 2020, 1–6. doi: 10.1186/s13638-020-01713-5
Singhurst, J. R., O'kennon, R. J., and Holmes, W. C. (2004). The genus Prenanthes (Asteraceae: Tribe Cichorieae) in Texas. Sida 21, 181–191.
Smeins, F. E., and Merrill, L. B. (1988). Long-Term Change in a Semiarid Grassland. Waco, TX: Baylor University Press, 209–230.
Stambaugh, M. C., Marschall, J. M., and Guyette, R. P. (2014). Linking fire history to successional changes of xeric oak woodlands. For. Ecol. Manage. 320, 83–95. doi: 10.1016/j.foreco.2014.02.022
Stambaugh, M. C., Sparks, J., Guyette, R., and Willson, G. (2011). Fire history of a relict oak woodland in Northeast Texas. Rangeland Ecol. Manag. 64, 419–423. doi: 10.2111/REM-D-10-00128.1
Stevens, N., Erasmus, B., Archibald, S., and Bond, W. (2016). Woody encroachment over 70 years in South African savannahs: overgrazing, global change or extinction aftershock?. Philos. Transact. R. Soc. B Biol. Sci. 371:437. doi: 10.1098/rstb.2015.0437
Stone, M. (1974). Cross-validatory choice and assessment of statistical predictions. J. R. Stat. Soc. 36, 47–111.
Talukdar, S., Singha, P., Shahfahad, Mahato, S., Praveen, B., and Rahman, A. (2020). Dynamics of ecosystem services (ESs) in response to land use land cover (LU/LC) changes in the lower Gangetic plain of India. Ecol. Indic. 112:106121. doi: 10.1016/j.ecolind.2020.106121
Tang, R., Shao, K., Li, Z. L., Wu, H., Tang, B. H., Zhou, G., et al. (2015). Multiscale validation of the 8-day MOD16 evapotranspiration product using flux data collected in China. IEEE J. Select. Top. Appl. Earth Observ. Remote Sens. 8, 1478–1486. doi: 10.1109/JSTARS.2015.2420105
Taylor, R. B., Rutledge, J., and Herrera, J. G. (1999). A Field Guide to Common South Texas Shrubs. Austin, TX: Texas Parks and Wildlife Press.
Tharp, B. (1926). Structure of Texas vegetation east of the 98th meridian. Univ. Texas Bull. 2606, 45–54.
Thies, B., and Bendix, J. (2011). Satellite based remote sensing of weather and climate: recent achievements and future perspectives. Meteorol. Appl. 18, 262–295. doi: 10.1002/met.288
Turlej, K., Ozdogan, M., and Radeloff, V. C. (2022). Mapping forest types over large areas with Landsat imagery partially affected by clouds and SLC gaps. Int. J. Appl. Earth Observ. Geoinform. 107:102689. doi: 10.1016/J.JAG.2022.102689
U.S. Census Bureau (2011). State Boundaries. Availanle online at: https://www.sciencebase.gov/catalog/item/52c78623e4b060b9ebca5be5
U.S. Environmental Protection Agency (2023). Level 3 and 4 Ecoregions of the Continental United States. Availanle online at: https://www.epa.gov/eco-research/level-iii-and-iv-ecoregions-continental-united-states (accessed February 8, 2024).
Udali, A., Lingua, E., and Persson, H. J. (2021). Assessing forest type and tree species classification using sentinel-1 C-band SAR data in Southern Sweden. Remote Sens. 13:3237. doi: 10.3390/RS13163237
Van Auken, O. W. (2009). Causes and consequences of woody plant encroachment into western North American grasslands. J. Environ. Manage. 90, 2931–2942. doi: 10.1016/j.jenvman.2009.04.023
Wang, J., Xiao, X., Basara, J., Wu, X., Bajgain, R., Qin, Y., et al. (2021). Impacts of juniper woody plant encroachment into grasslands on local climate. Agric. For. Meteorol. 307:108508. doi: 10.1016/j.agrformet.2021.108508
Wang, J., Xiao, X., Qin, Y., Doughty, R., Dong, J., and Zou, Z. (2018). Characterizing the encroachment of juniper forests into sub-humid and semi-arid prairies from 1984 to 2010 using PALSAR and Landsat data. Remote Sens. Environ. 205, 166–179. doi: 10.1016/j.rse.2017.11.019
Wang, R., Wang, M., Sun, X., Wang, J., and Li, G. (2023). Winter remote sensing images are more suitable for forest mapping in Jiangxi Province. Eur. J. Remote Sens. 56:2237655. doi: 10.1080/22797254.2023.2237655
Wang, S., Wu, Y., Li, R., and Wang, X. (2023). Remote sensing-based retrieval of soil moisture content using stacking ensemble learning models. Land Degrad. Dev. 34, 911–925. doi: 10.1002/ldr.4505
Wasowski, S., and Wasowski, A. (1988). Native Texas Plants: Landscaping Region by Region. Austin, TX: Texas Monthly Press.
Willhoite, R. G. (2015). Michael family forest, Texas, United States of America. For. Plans N. Am. 21–27. doi: 10.1016/B978-0-12-799936-4.00003-5
Wine, M. L., Ochsner, T., Sutradhar, A., and Pepin, R. (2012). Effects of eastern redcedar encroachment on soil hydraulic properties along Oklahoma's grassland-forest ecotone. Hydrol. Process. 26, 1720–1728. doi: 10.1002/hyp.8306
Wu, X., Xiao, Q., Wen, J., You, D., and Heuni, A. (2019). Advances in quantitative remote sensing product validation: overview and current status. Earth Sci. Rev. 196:102875. doi: 10.1016/j.earscirev.2019.102875
Xiao, W., Deng, X., He, T., and Guo, J. (2023). Using POI and time series Landsat data to identify and rebuilt surface mining, vegetation disturbance and land reclamation process based on Google Earth Engine. J. Environ. Manage. 327:116920. doi: 10.1016/j.jenvman.2022.116920
Xie, Z., Chen, Y., Lu, D., Li, G., and Chen, E. (2019). Classification of land cover, forest, and tree species classes with ZiYuan-3 multispectral and stereo data. Remote Sens. 11:164. doi: 10.3390/rs11020164
Xu, B., Li, J., Park, T., Liu, Q., Zeng, Y., Yin, G., et al. (2018). An integrated method for validating long-term leaf area index products using global networks of site-based measurements. Remote Sens. Environ. 209, 134–151. doi: 10.1016/j.rse.2018.02.049
Xu, D., and Zhang, M. (2022). Mapping paddy rice using an adaptive stacking algorithm and Sentinel-1/2 images based on Google Earth Engine. Remote Sens. Lett. 13, 373–382. doi: 10.1080/2150704X.2022.2027543
Yang, X., Xiao, X., Qin, Y., Wang, J., and Neal, K. (2021). Mapping forest in the southern Great Plains with ALOS-2 PALSAR-2 and Landsat 7/8 data. Int. J. Appl. Earth Observ. Geoinf. 104:102578. doi: 10.1016/j.jag.2021.102578
Yang, Y., Xu, J., Hong, Y., and Lv, G. (2012). The dynamic of vegetation coverage and its response to climate factors in Inner Mongolia, China. Stoch. Environ. Res. Risk Assess. 26, 357–373. doi: 10.1007/s00477-011-0481-9
Zafari, A., Zurita-Milla, R., and Izquierdo-Verdiguier, E. (2019). Evaluating the performance of a random forest kernel for land cover classification. Remote Sens. 11:575. doi: 10.3390/rs11050575
Zhang, Y., Ma, J., Liang, S., Li, X., and Liu, J. (2022). A stacking ensemble algorithm for improving the biases of forest aboveground biomass estimations from multiple remotely sensed datasets. GISci. Remote Sens. 59, 234–249. doi: 10.1080/15481603.2021.2023842
Zhao, Z., Islam, F., Waseem, L. A., Tariq, A., Nawaz, M., Islam, I. U., et al. (2024). Comparison of three machine learning algorithms using Google Earth Engine for land use land cover classification. Rangeland Ecol. Manag. 92, 129–137. doi: 10.1016/j.rama.2023.10.007
Zhou, Y., Bomfim, B., Bond, W., Boutton, T., Case, M., Coetsee, C., et al. (2023). Soil carbon in tropical savannas mostly derived from grasses. Nat. Geosci. 16, 710–716. doi: 10.1038/s41561-023-01232-0
Zhu, L., Liu, X., Wu, L., Tang, Y., and Meng, Y. (2019). Long-term monitoring of cropland change near Dongting Lake, China, using the landtrendr algorithm with landsat imagery. Remote Sens. 11:1234. doi: 10.3390/rs11101234
Keywords: Google Earth Engine (GEE), LandTrendr algorithm, machine learning, savanna systems, woody plant encroachment, Southern Great Plains Texas, ensemble learning algorithm, land cover change (LCC) detection
Citation: Olariu HG, Wilcox BP and Popescu SC (2024) Examining changes in woody vegetation cover in a human-modified temperate savanna in Central Texas between 1996 and 2022 using remote sensing. Front. For. Glob. Change 7:1396999. doi: 10.3389/ffgc.2024.1396999
Received: 06 March 2024; Accepted: 27 May 2024;
Published: 21 June 2024.
Edited by:
Xulin Guo, University of Saskatchewan, CanadaReviewed by:
Yihan Pu, University of Saskatchewan, CanadaCopyright © 2024 Olariu, Wilcox and Popescu. This is an open-access article distributed under the terms of the Creative Commons Attribution License (CC BY). The use, distribution or reproduction in other forums is permitted, provided the original author(s) and the copyright owner(s) are credited and that the original publication in this journal is cited, in accordance with accepted academic practice. No use, distribution or reproduction is permitted which does not comply with these terms.
*Correspondence: Horia Gabriel Olariu, aG9yaWFAdGFtdS5lZHU=
Disclaimer: All claims expressed in this article are solely those of the authors and do not necessarily represent those of their affiliated organizations, or those of the publisher, the editors and the reviewers. Any product that may be evaluated in this article or claim that may be made by its manufacturer is not guaranteed or endorsed by the publisher.
Research integrity at Frontiers
Learn more about the work of our research integrity team to safeguard the quality of each article we publish.