 Khurram Shahzad
 Waqar Shoukat Ali2†
94% of researchers rate our articles as excellent or good
Learn more about the work of our research integrity team to safeguard the quality of each article we publish.
Find out more
ORIGINAL RESEARCH article
Front. For. Glob. Change , 24 May 2024
Sec. Forest Growth
Volume 7 - 2024 | https://doi.org/10.3389/ffgc.2024.1362117
This article is part of the Research Topic Forest Growth in a Changing Climate: Insights from Predictive Modeling and Adaptive Strategies View all 5 articles
The tropical dry forests (TDF) have an enormously rich flora and fauna that offer various ecological services to the surrounding human societies. Biodiversity assessment is mandatory for implementing any sustainable forest management policy, which is why it is one of the important criteria and indicators currently used. Threats to TDF biodiversity are the primary challenges arising from environmental concerns caused by anthropogenic activity leading to global warming issues. The study aimed to investigate the vegetation assessment and several environmental and anthropogenic variables influencing forest biodiversity from 5 threatened forest sites of District Sialkot (Ghalotian, Kishan Garh, Daburgi Chanda Singh, Pir Kot, and Ghulab Garh), Pakistan. We collected 170 distinct plant species, including 135 dicots, 27 monocots, seven pteridophytes, and one bryophyte, categorized into 138 genera and 62 families, divided into 114 herbs, 32 trees, and 24 shrubs. The phytosociological analysis described the quantitative characteristics, including % frequency, % density, % cover, and importance Value Index (IVI) of all forest areas. Gulab Garh forest has the richest biodiversity forest area, and herbs are the dominant species that have been documented. Environmental factors such as temperature, precipitation, organic matter, soil pH, Ca+2, Mg+2, Na+, Cl−, and electric conductivity (EC) strongly affect forest vegetation investigated by principal coordinate analysis. Shannon and Simpson’s diversity indexes reveal that all sites contain loamy and sandy soil and display a significant relationship between alpha diversity and richness. Increasing trends in temperature and decreasing trends in rainfall suggested that climate significantly affects the Sialkot region’s plant biodiversity. SWOT analysis highlighted that population growth leads to increasing anthropogenic activities such as constructing housing societies and roads, inadequate farming, and excessive grazing, impacting the forest vegetation and altering TDF ecosystem properties/services and functioning. Our findings reinforce the vegetational assessment and importance of local forest biodiversity and significant environmental drivers that influence the plant species diversity in TDF areas. Future conservation strategies are suggested to reduce unlawful resource consumption, restore plant biodiversity in designated protected areas, and conserve rare species locally.
Forests are the best sources of good quality wood used for multiple purposes (such as timber, kindling, and medicinal plants) (Shahbaz and Suleri, 2009). Vegetation assessment is important for wildlife and forest management (Noss, 1990; McCleary and Mowat, 2002; Lindenmayer et al., 2006). For example, forest canopies mediate microclimate, provide perching, nesting, foraging, and covering habitats for many animal species, and influence food quality, diversity, and accessibility (Hamer and Herrero, 1987; Johnson et al., 2002). Monitoring forest biodiversity is a top priority in many local, regional, and global nature preservation plans (Van Beek et al., 2014). Regarding the environmental impact of climate change brought on by carbon dioxide, TDF plays an important role locally and worldwide. Therefore, protecting forest biodiversity is essential for sustainable development, resource allocation, and the environment. Much more worrying is that the rate of plant biodiversity loss will be significantly amplified due to climate change and intense anthropogenic activities (Keenan and Richardson, 2015; Urban, 2015; Di Marco et al., 2018), which alter the makeup of plant communities, highlighting the significance of these biodiversity places as forests. Global warming is the primary source of climate change, and excessive anthropogenic activity has exacerbated the greenhouse effect, which in turn has caused global warming (Verma, 2021). This requires urgent socio-political attention (Ellison et al., 2017; Springgay et al., 2019), and such works stand among the top priorities in suitable development goals, as defined in The Agenda 2030 (Wennersten and Qie, 2018).
Environmental factors that affect plant growth include soil, temperature, water, chemical contents, and nutrition. The relationship between plant element traits and the environment has been studied for a long time (Chua and Potts, 2018). Globally, TDF are negatively impacted by climate change, which makes a large portion of their biodiversity more vulnerable (Malhi and Phillips, 2004), even in the tropical forests of Central America and southern Mexico (Ortega et al., 2024), and protected regions (Tabor et al., 2018). For instance, massive Neotropical forests, like the Amazon, are in danger of collapsing due to the stress brought on by drought occurrences (Malhi et al., 2008; Feeley et al., 2012). Changes in plant–plant interactions and forest structure (Velázquez and Wiegand, 2020), reductions in the range of distribution of certain species (Dury et al., 2018), loss of forest carbon reserves (Vieilledent et al., 2016), and anthropogenic activities in surrounding communities all affect the TDF areas. It would be challenging to characterize TDF biogeography based solely on current conditions in an unprecedented future climate change scenario (Sunderland et al., 2015). The scope of dry forests may spread into regions presently occupied by wet tropical forests as the climate gets warmer and dryer. However, due to various disturbance factors, places currently classified as dry forests may transform into other ecosystems, such as savanna. According to the FAO definition, savanna ecosystems include, for example, the dry dipterocarp forests of Asia and the Miombo woodlands of Africa, which are now classed as dry forests (Lehmann et al., 2011; Dexter et al., 2015). In different settings, plants show relatively stable physiological and ecological characteristics by regulating the metabolism and circulation of various soil elements (Hu et al., 2014), which is a survival strategy of plants. If any ecological factor is less than ideal, it limits a plant’s growth and development. The soil characteristics affect forest structure and vegetation variation. Jiao et al. (2016) indicated that increasing soil drought level, temperature, and value would lead to the imbalance of Carbon, Nitrogen, and Phosphorus in the grassland-soil system. Under abiotic stress conditions, dominant plants are crucial in vegetation restoration and community stability (Ren et al., 2017). Therefore, the stoichiometric characteristics in each organ of the dominant species can reflect plants’ ecological niche and growth status.
Anthropogenic activities also increase the extinction risks of endangered species directly by fueling habitat loss through the conversion of natural ecosystems into croplands and artificial infrastructures and over-exploitation of trees for commercial, ornamental, and medical uses, and indirectly by promoting the spread of invasive alien species (Shearman et al., 2012; Bellard et al., 2016; Venter et al., 2016). Due to fast population growth, the degradation of forest lands and poor farming methods have gravely harmed native forest ecosystems. The main contributors to habitat loss include industrial processes, housing societies, agriculture, aquaculture, mining, deforestation, and water exploitation (Verma, 2017). This refers to removing important species at a level that exceeds the rate of natural population recovery. Biodiversity, or the variety of plant and animal species, is significantly threatened by the overuse of natural resources. Under intense anthropogenic activities, the extinction risks of endangered species may vary substantially, depending on their life-history traits that are usually correlated with retained and lost plant diversity (Pearson et al., 2014; De Kort et al., 2021).
To assess the conservation status of tropical forests in drylands, information is required on their distribution pattern and rate of change in the forest extent concerning global environmental changes (Miles et al., 2006). Such assessments, in turn, require a clear definition of vegetation type. We provide a summary of some of the common quantitative biodiversity characteristics of TDFs (such as % frequency, % density, % cover, relative cover, relative frequency, relative Density, Importance Value (IV), and Importance Value Index (IVI)) in this study. According to FAO (2006) report, successful forest management deals with both technical (silvicultural activities) and social aspects (policy/legal, administrative, and economic) of forests, aims at keeping a balance between consumption and conservation, i.e., sustaining the resource base while supporting livelihood and providing services. Besides, the high variability of rainfall and the increasing temperatures, evaporation, and evapotranspiration rates result in reduced ecosystem productivity in these regions. Thus, management activities should concentrate on conserving and restoring the remnant vegetation to use scarce resources effectively. This, in turn, requires appropriate and timely interventions from all stakeholders before the damage to the remnant dryland resources proceeds beyond the possibility of their rehabilitation. The method described here offers a helpful tool for ranking species in order of importance for conservation in the face of climate change, especially in tropical dry areas where the distribution of many taxa is poorly understood (Cayuela et al., 2009). Various soil and water conservation techniques and vegetation management activities have been suggested to enhance TDF resilience to climate change.
The primary goal of this study is to assess DTF and conserve dry forest biodiversity microhabitats in Pakistan. About 6,000 medicinal plants are reported in Pakistan under various surveys (Bahadur et al., 2020), with 600/6000 flowering plants. According to a recent study on ethnomedicinal plants, 112 species of medicinal herbs, shrubs, and trees belong to 61 families reported in the Sialkot area of Pakistan (Noreen et al., 2020). Another ethnopharmacological study led to enlisting of 114 medicinal plant species belonging to 97 genera and distributed among 47 plant families in this area (Shah et al., 2021). TDF of studied research areas (Ghalotian, Kishan Garh, Daburgi Chanda Singh, Pir Kot, and Gulab Garh Forests) are extremely important for ecosystems and livelihoods of surrounding communities. Compared to other tropical forests, the flora of Punjab (tropical forest regions), especially district Sialkot, is still the least known from research and development efforts, mainly due to a need for more access and resources (Ali et al., 2022). Many national policies still fail to recognize their importance. However, it is essential to prioritize the forest structure and take note of deforestation through conservation activities that are basic and useful for the forests and the surroundings. On the other hand, studies on species diversity, forest structure, and ecological factors in district Sialkot forests are essential elements to reveal how the vegetation of an area is threatened and depleting worldwide and the base for defining appropriate conservation strategies before losing the potential to provide ecosystem services.
To achieve effective biodiversity conservation, it is necessary to analyze the vegetation assessment of micro-ecological and biogeographical variables that affect species distribution and adaptation in local flora (Brooks et al., 2006; Et and Ganjali, 2014). The current research aimed: (i) to determine vegetation assessment and the impact of environmental factors, such as climate, soil composition, and chemical contents, on plant biodiversity in micro-level forests scattered across several sites in district Sialkot. (ii) The second objective of this research was to use quantitative and qualitative ecological methodologies to evaluate the species diversity and richness of wild flora and the ultimate impact of anthropogenic activities on vegetation change. (iii) The final objective is to pinpoint priority areas for plant conservation in this critical biodiversity hotspot under future warming, identify vulnerable species, and suggest some urgent conservation methods to protect the biodiversity of this area.
Sialkot is a district with a population of around 4 million, a 3,106 km2 area, and four significant tehsils (Daska, Sambrial, Pasrur, and Sialkot) with a population density of 1,300/km2. During the Indus Valley Civilization, the Sialkot District was an agricultural and forest-containing region with fertile and plain land. The weather is hot and muggy in the summer and chilly in the winter. The average annual temperature is 30°C in Sialkot, with 1,000 mm of precipitation annually. 6,43,624 acres of land are used for agriculture, and 99,241 acres are unused. We collected the plant species from five different forest areas (Ghalotian, Kishan Garh, Daburgi Chanda Singh, Pir Kot, and Gulab Garh Forests) of district Sialkot region from two different Tehsils, i.e., Daska and Sambrial (Figure 1). Our study region is located between 32° 27′ 88″ to 32° 50′ 21” N and 74° 34′ 74″ to 74° 24′ 90″ E. Ghalotian Forest area is located near Daska city at the bank of the upper Chanab canal near the boundary line of Gujranwala and Sialkot (Figure 1). The other four sites (Kishan Garh, Daburgi Chanda Singh, Pir Kot, and Gulab Garh Forests) are located between the Sialkot and Gujrat Districts near the downstream side of River Chanab.
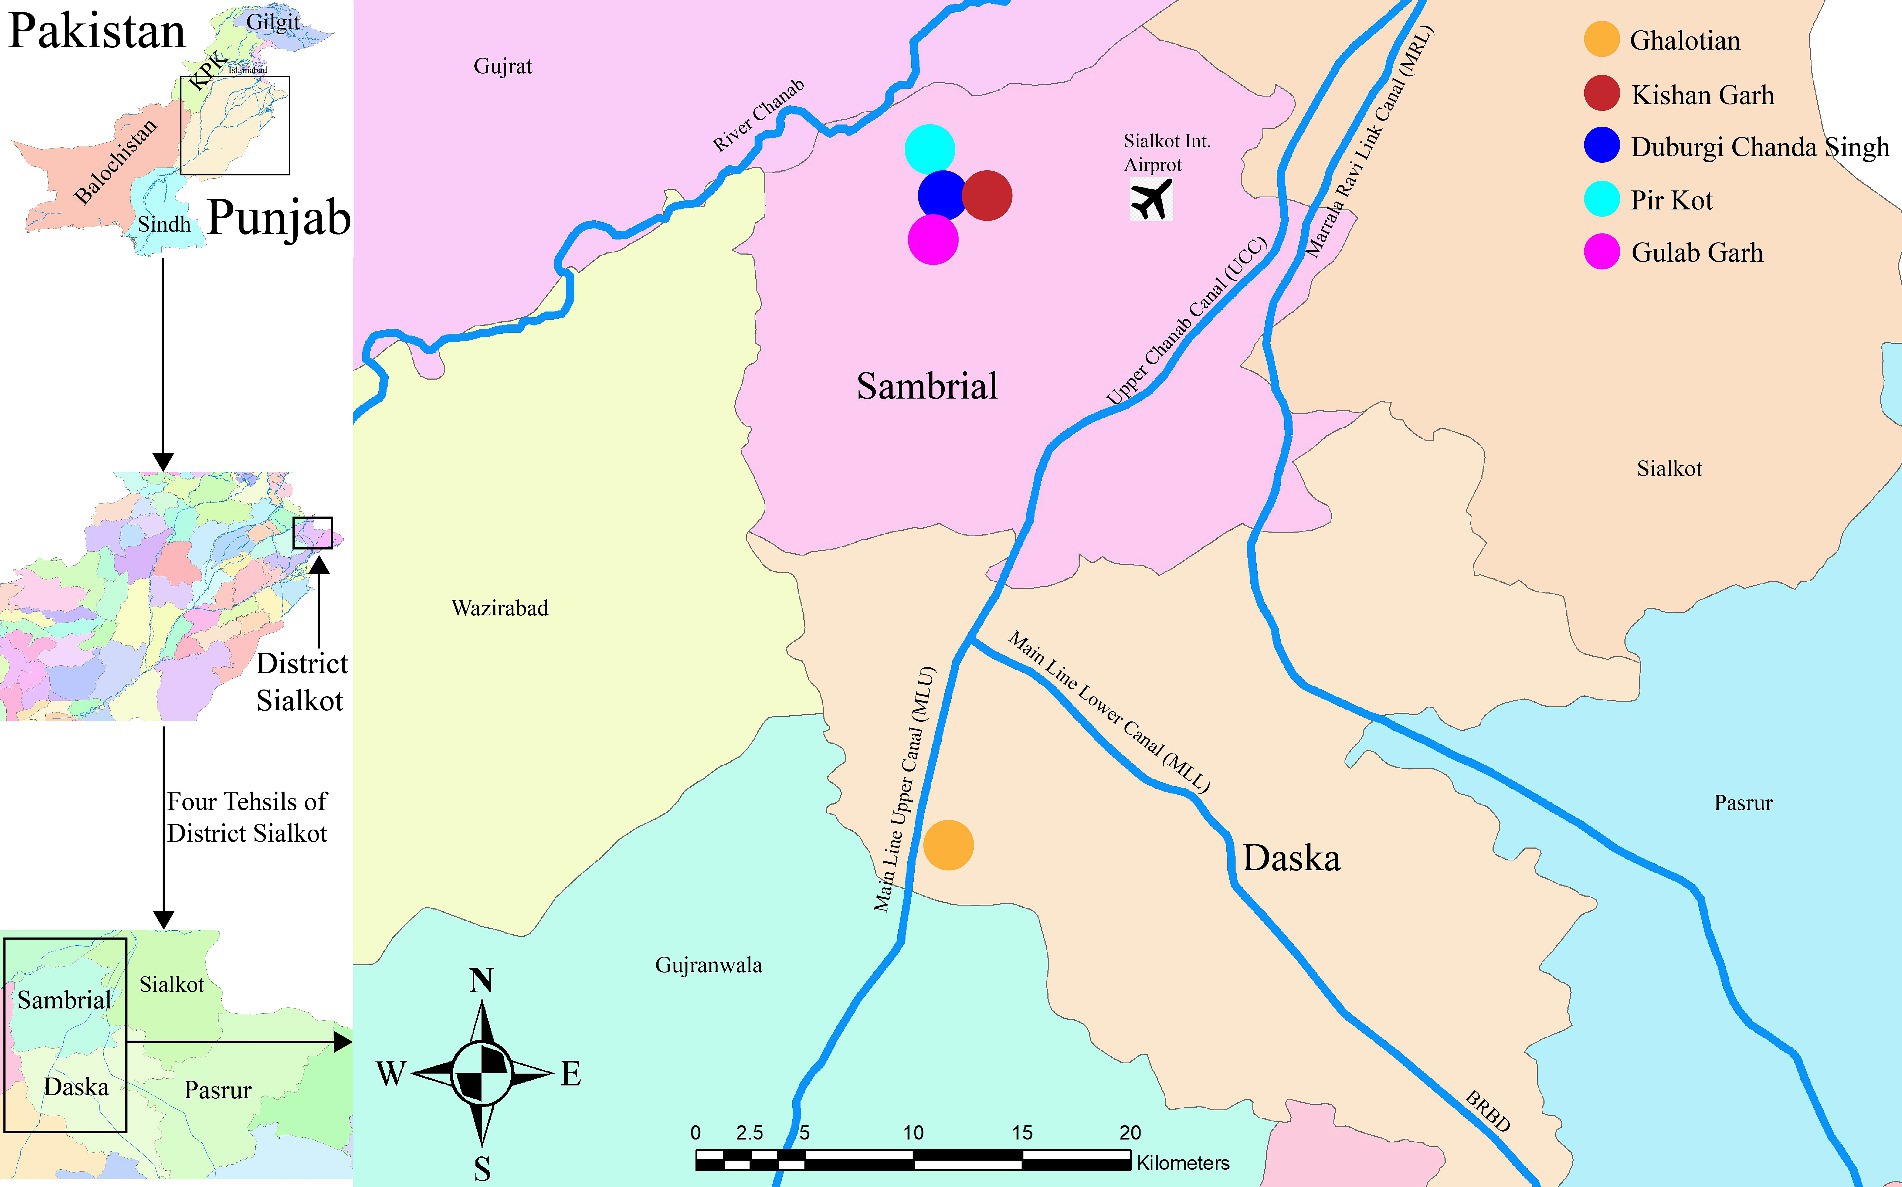
Figure 1. The geographical location of the study areas of Sialkot range forests, District Sialkot, Punjab, Pakistan.
We investigated the vegetation of the Sialkot range forests under bioclimatic settings to monitor changes in plant species composition brought on by a change in soil and climatic circumstances. Approximately 35 km of the study region was divided into five sampling sites. Agricultural fields, urban societies, road edges, and canal banks were simultaneously included in the catchment area. We sampled natural biodiversity species from all five forest sites. The field study was conducted to gather information on vegetation and environmental predictors from May 2020 through September 2022. We used the quadrat method to quantify plant species’ quantitative characteristics during soil sampling, including frequency (F), Density (D), and cover (C). Thirty-five quadrats were therefore utilized to analyze vegetation quantitatively. Supplementary Figure S1 shows pictorial pictures of all sites included in this study. Plant samples were prepared, dried, and mounted on typical herbarium sheets. Each sample was numbered as a voucher specimen and delivered to the Department of Botany, Government College, and University (GCU), Lahore, Pakistan (Supplementary Table S1).
During vegetation sampling, the following steps are systematically satisfied. The simplest way to evaluate vegetation analysis in varied settings is to use the quadrat method along the transects (Goldsmith et al., 1986; Everson and Clarke, 1987). We randomly selected quadrats of various sizes to sample the area for herbs, shrubs, and trees. The area species curve was established for the accurate size of the quadrat (Clements, 1905). The quadrat size used in this study was 1 × 1 m for herbs, 5 × 5 m for shrubs, and 10 × 10 m for trees to account for the probable diversity of the plant life in the research area. To collect floristic data, three quadrats were used at each location to sample the three plant layers-herbs, shrubs, and trees. All herbaceous plants in the first layer were under 1 m tall, all plants in the shrub layer ranged from 1 to 5 m, and the third tree layer was over 5 m tall.
The calculations were done to the following quantitative characteristics of the Sialkot range forest plant communities: % Frequency, Density, % Cover, relative cover, relative frequency, relative Density, Importance Value (IV), and Importance Value Index (IVI). The relative values of these quantitative attributes are based on these three criteria. We used the “Flora of Pakistan” to identify and name the species.1 To employ binomials for taxonomical reliability and understanding, the status of each plant binomial was verified using the Plants of the World Online Database2 (Khan et al., 2016). The phytosociological parameters were measured at various sites and calculated using the following formulas: Cover %, Density, Frequency %, relative cover, relative frequency, relative density %, Importance Value (IV), and Importance Value Index (IVI) of the species.
In the wake of Raunkiaer (1934), the frequency was calculated using the following formulas:
Curtis and McIntosh (1950) described the Density using the following formula:
We used the following formula to explain the % Cover classification after (Daubenmire, 1959) (Supplementary Table S2):
We determined the relative values of each of these three parameters to calculate the Importance Value (IV) (Curtis and Cottom, 1956).
Importance Value = Relative Frequency + Relative Density + Relative Coverage.
To create the Important Value Index (IVI), (Risser and Rice, 1971) divided the relative frequency, relative Density, and relative cover by three.
Each site’s soil was sampled at 0–15 cm depth using a barrel-style hand auger (Allen, 1989). We used initial air drying and packing of polythene bags for soil samples. We accurately represented the collection place and the sample collection date on the samples’ labels. Specimens were brought to the lab to be evaluated for their chemical and physical characteristics, including organic matter, soil pH, available Calcium (Ca+2), Magnesium (Mg+2), Sodium (Na+), Chlorine (Cl−), Electric Conductivity (EC) Carbonates (CO3−2) and Bicarbonates (HCO3−1) (Allen, 1989).
Following (Steel et al., 1996), we statistically examined the soil data for the significance of the findings using Dunken’s Multiple Range Test (DMRT) at a 0.5% significance level. In addition, we used Minitab software (v.18) to find the relationships between the phytosociological characteristics of 170 plant species. R packages were also employed to construct diversity indices such as Shannon-Weiner, Simpson, Evenness, and Richness (v.3.6.1). The data matrices were log-transformed using the log10 function from the zbase package before further analysis. The Shannon and Simpson diversity indices were produced using the vegan packages with diversity function (v.2.5–6) (Shannon and Weaver, 1963). Using the ggpubr3 package, diversity indices were further evaluated using the Wilcox test to confirm soil’s significant variations and impact on diversity indices. Similarly, we used Vegan’s vegdist and adonis functions to perform a permutational multivariate analysis of variance to look at plant diversity regarding several soil types (loamy and sandy) (PERMANOVA). Bray-Curtis distance matrices were calculated using converted community data. Principal coordinate analysis (PCoA) plots, part of the ggplot2 package, were used to show pair-wise differences between various soil types and environmental heterogeneity (Wickham, 2016).
We extracted district Sialkot’s daily temperature and precipitation data from4 to analyze this region’s temperature and precipitation trend.
We developed a Strengths, Weaknesses, Opportunities, and Threats analysis (SWOT) to combine the environmental and anthropogenic characteristics (Trujillo, 2005; Ali et al., 2022). Each site was studied and analyzed to categorize the indication and identify critical elements affecting how effectively a species can acclimate to its environment in the research location. Strengths, for instance, reveal vegetation’s presence, size, and placement. Native species, natural catastrophes like floods, anthropogenic activities, and interspecies competition are all displayed in vulnerability. Threats indicate artificial forces and uncontrollable natural disasters, while opportunities point to the involvement of NGOs, other departments, or people fighting for preservation and restoration. This method is more impulsive since the opportunities are discussed compared to the other descriptions. Regarding the relative relevance of weight ranges, a SWOT value can range from 100 to 1,000 within a specific area (100 denotes a low value, and 1,000 denotes a higher significance value for specific study-area characteristics). The important Coefficient (IC) was produced to evaluate the area quality, representing the total relevancy of all the variables. The individual ICs are calculated using the formula.
Wi is a single indicator weight, Wi-n is the total of all relevant indicator weights, and ICi n = 1 (Trujillo, 2005). In addition, we noted the subtotal descriptor weights, ICs, and variations in the quantity and weight of each descriptor.
The Sialkot range forest contains a variety of plant species due to variations in environmental factors. One hundred seventy plant species from 62 families and 138 genera were investigated from all sites. There were 135 plant species, 108 genera, and 48 dominating dicot families. In comparison, 27 plant species are included in monocots among seven families and 22 genera (Table 1). The research sites also reported a few species of pteridophytes and bryophytes. Additionally, two angiosperm families (Poaceae and Cyperaceae) were dominant in all locations, containing a total of 113 species: dicots (96 species) and monocots (17 species) (Table 2). In terms of plant life forms, 114 herb species (67%) were observed, along with 24 shrub species (14%) and 32 tree species (19%) from all research sites (Figure 2). The overall summary and vegetation assessment detail, including family name, species name, habitat, species group, and voucher numbers, were represented in Supplementary Table S1.
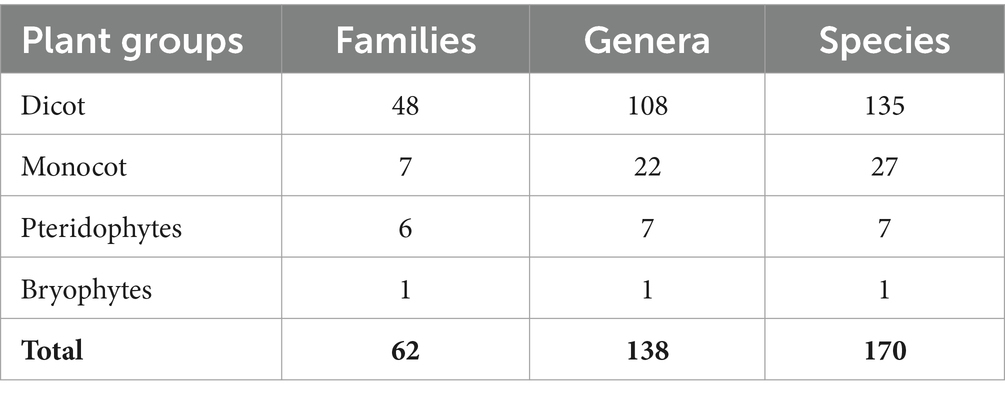
Table 1. Summary of the floristic diversity of the Sialkot Range Forest, District Sialkot, Punjab, Pakistan.
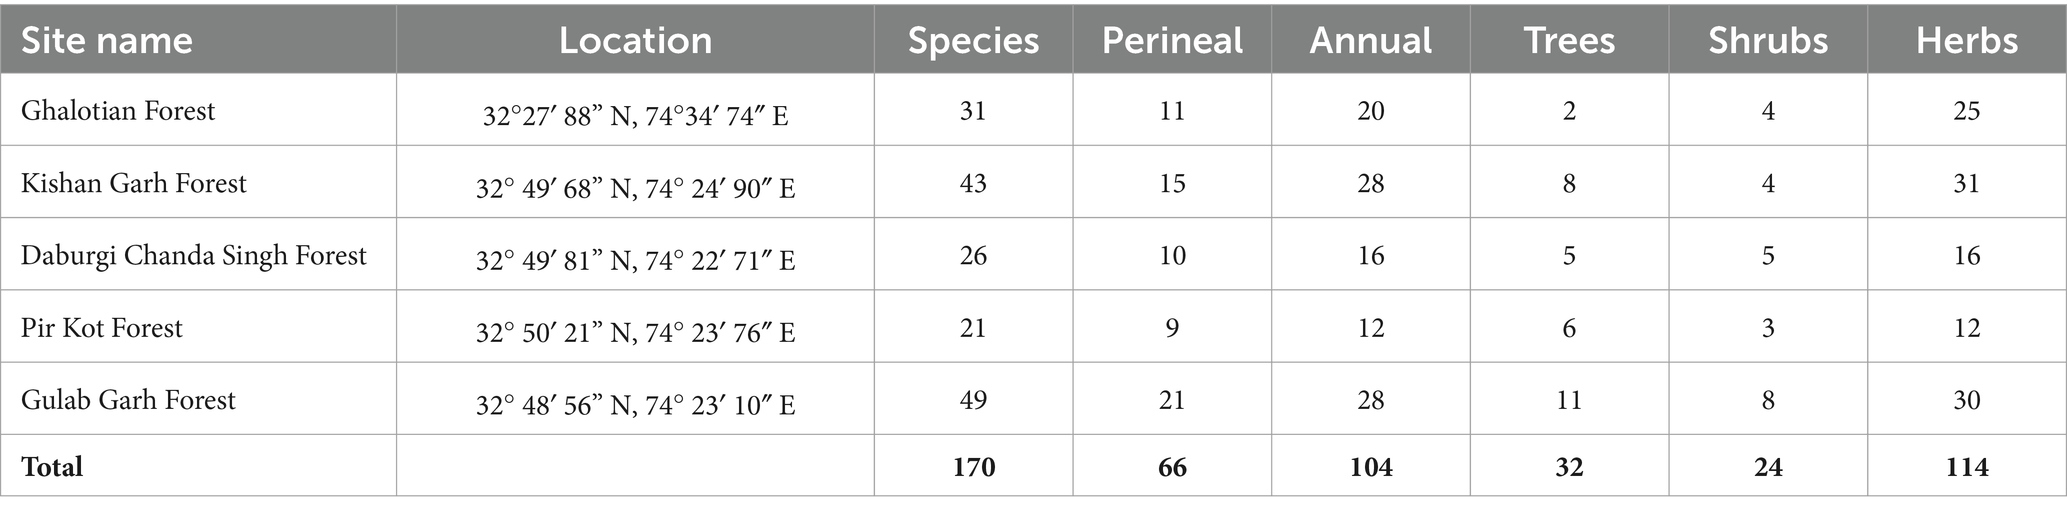
Table 2. Phytosociological analysis of 5 selected sites of Sialkot Range Forest, District Sialkot, Punjab, Pakistan.
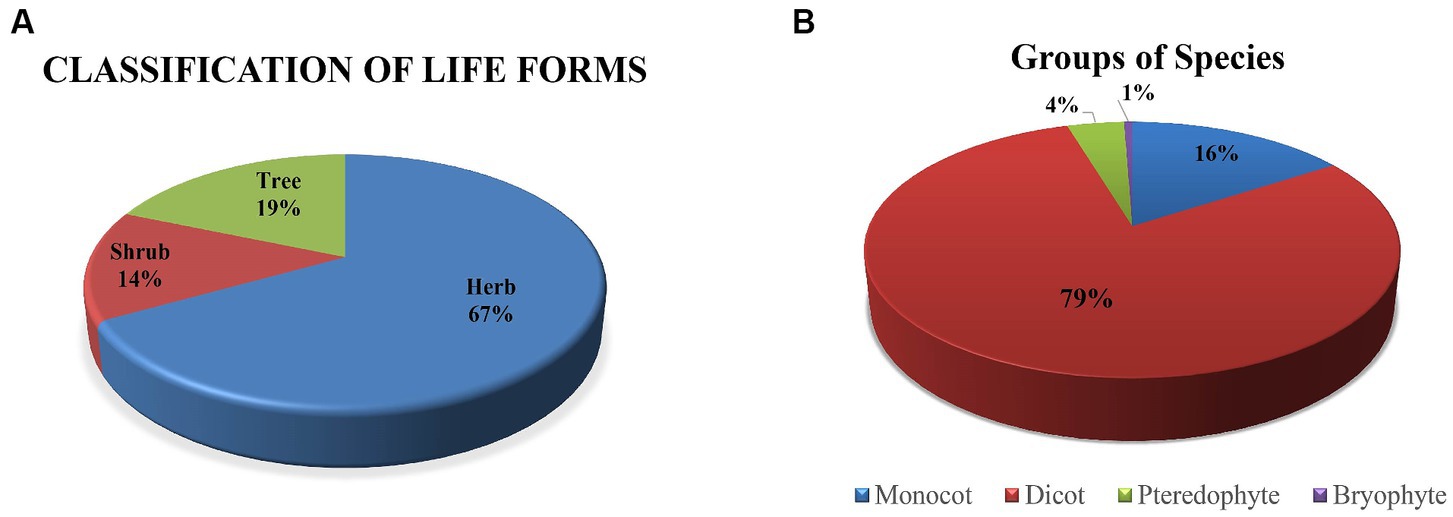
Figure 2. (A) Represents the percentage of plant life forms, and (B) illustrates the groups of plant species in five sites of Sialkot range forests, District Sialkot, Punjab, Pakistan.
The phytosociological analysis was described using quantitative characteristics, including % frequency, % density, % cover, relative cover, relative frequency, relative Density, Importance Value (IV), and importance Value Index (IVI) are shown in Supplementary Table S3. Among all families, the overall % frequency is higher in species of the family Acanthaceae (50), Caesalpinaceae (59.48), Drypoteridaceae (58.3), Equiteceae (50), Myrtaceae (72), Phyllanthaceae (51.28) and Salvicaceae (53.4). % Density was higher in species of family Acanthaceae (10.19), Caesalpinaceae (17.69), Cryophyllaceae (11.98), Drypoteridaceae (29.12), Geraniaceae (10.2), Phyllanthaceae (16.29), Proteaceae (11.33), and Salvicaceae (29.12). % cover was higher in species of family Acanthaceae (18.25), Azioceae (21.44), Caesalpinaceae (19.1), Convolvulaceae (20), Cucurbitaceae (24.61), Drypoteridaceae (23.64), Equiteceae (23), Euphorbiaceae (18.25), Phyllanthaceae (21.44), Proteaceae (18.21), Salvicaceae (22.23), and Simaroubaceae (23). Importance Value Index (IVI) was higher in species of family Acanthaceae (4.4), Apiaceae (4.22), Asphodelaceae (4.44), Caesalpinaceae (6.44), Cryophyllaceae (4.59), Drypoteridaceae (8.94), Geraniaceae (4.45), Lamiaceae (4.26), Myrtaceae (4.44), Phyllanthaceae (6.44), Proteaceae (4.59), and Salvicaceae (8.94). We calculated each site’s quantitative characteristics, shown in Supplementary Table S3. Supplementary Table S1 displays the overall number of species at each site and a vegetation assessment (annual, perennial, herbs, shrubs, and trees). Gulab Garh forest is the largest in forest area and plant species, with 49 total (28 annuals and 21 perennials) (Table 2). Supplementary Table S4 lists all the sites’ predominant species of trees, shrubs, and herbs. The number of herbs are higher in the Kishan Garh and Ghulab Garh forests than in other sites. In comparison, the number of shrubs and trees are higher in Ghulab Garh forest (Table 2 and Supplementary Table S4).
The Wilcoxon test was employed to verify these disparities and indicators of the differences in soil types between the sites. In contrast to other soil types, such as sandy, loamy, and clay and clay loamy soils, there was no discernible variation in the kind of soil discovered at each site. The Shannon and Simpson alpha diversity indexes varied between all locations (Figure 3). All forest sites with loamy and sandy soil have a variety of species, which may be caused by several other environmental conditions (Figure 4).
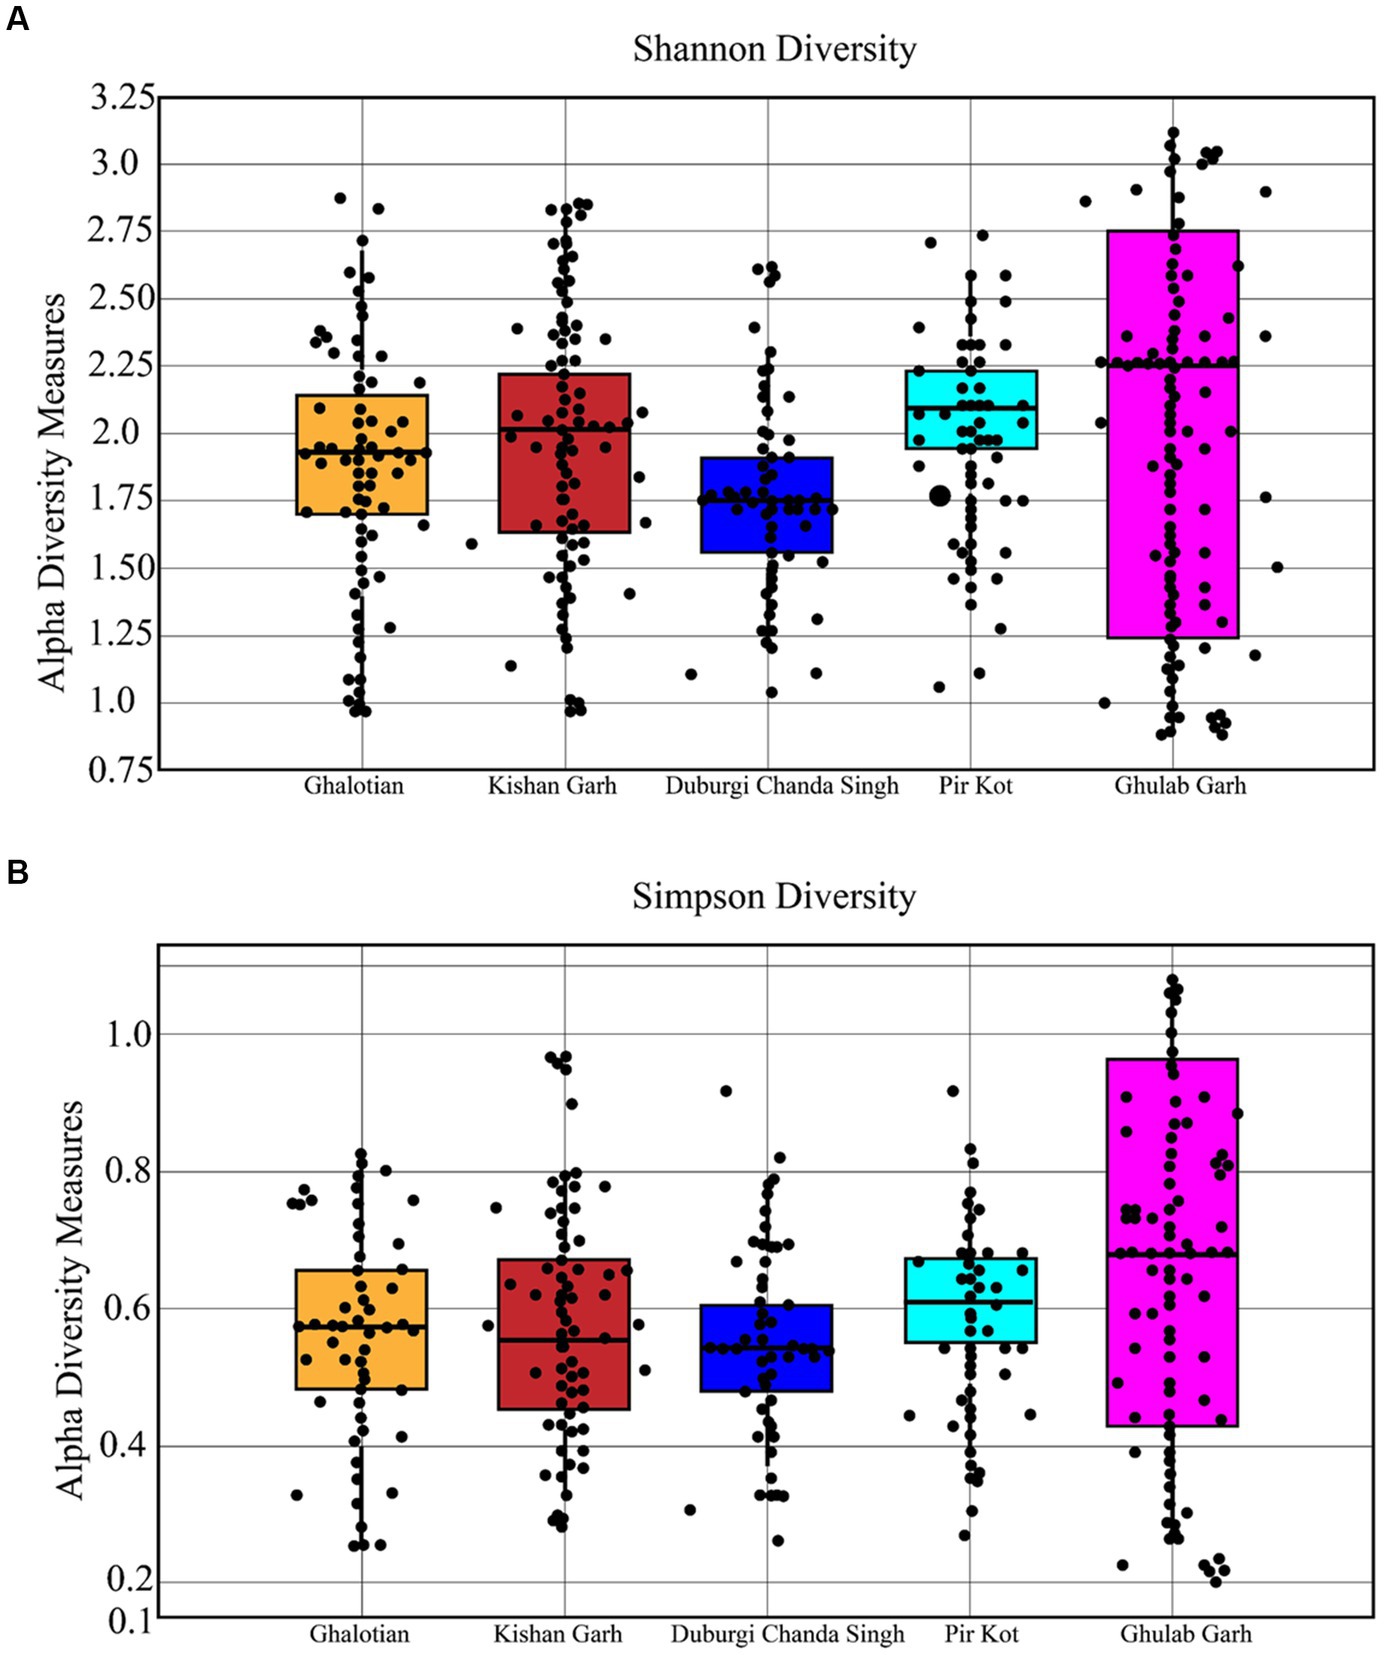
Figure 3. Shannon (A) and Simpson (B) diversity indices for plant species of 5 selected sites of Sialkot Range Forest, Sialkot, Punjab, Pakistan.
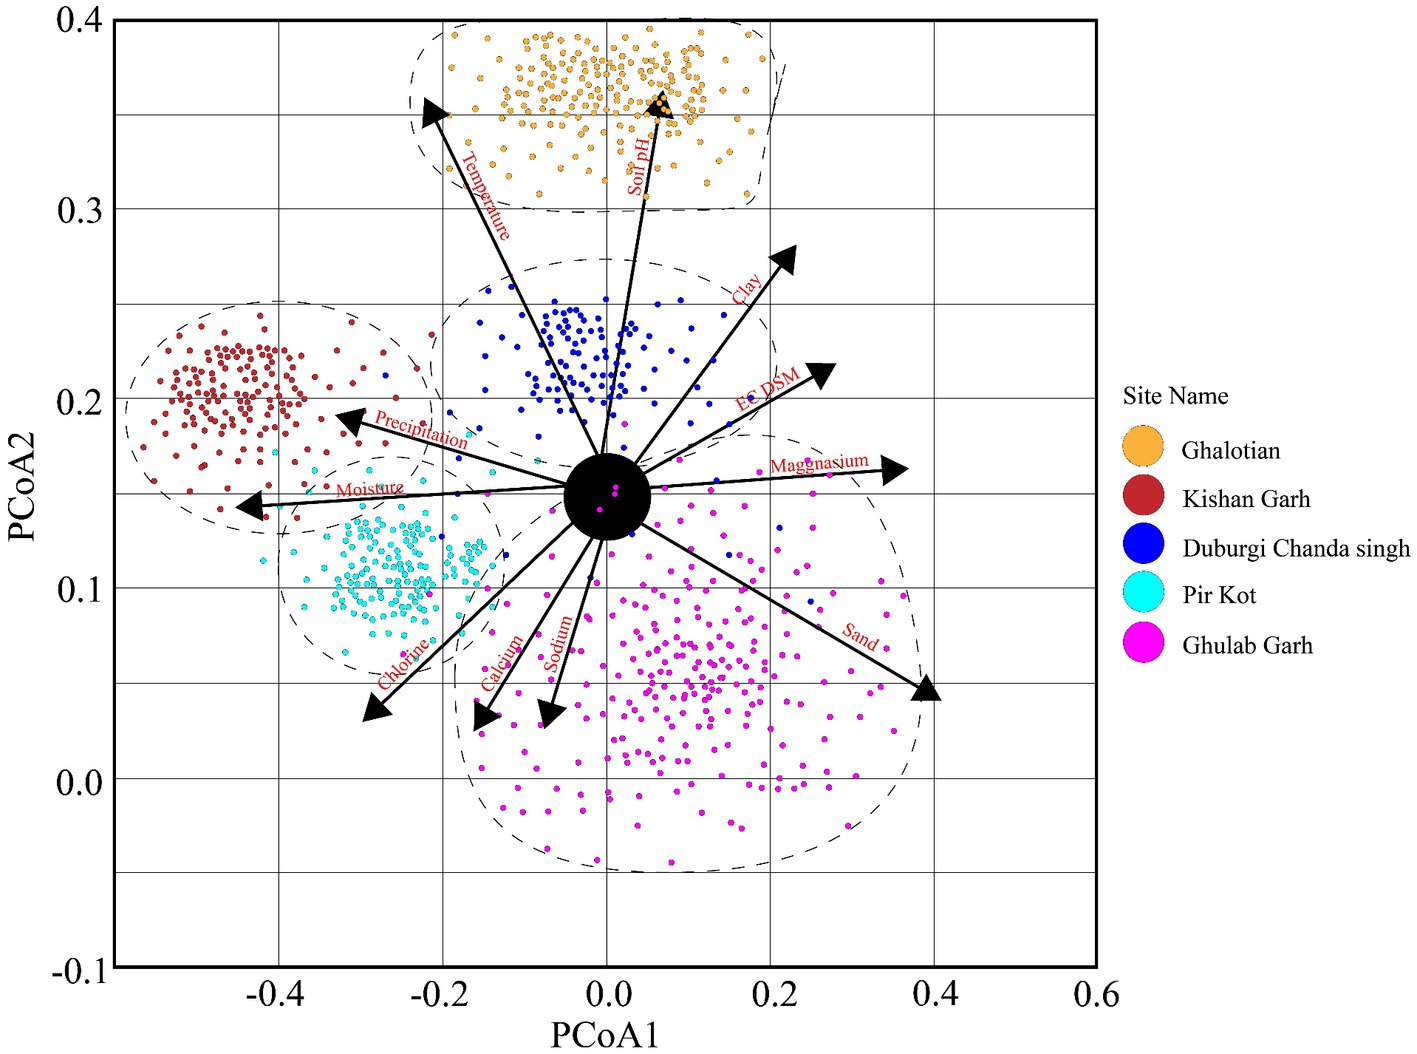
Figure 4. The principal coordinate analysis (PCoA) elaborates on plant diversity with different environmental factors of five selected sites of the Sialkot Range Forest, Sialkot, Punjab, Pakistan.
The richness and evenness values based on individual plant species ranged from 9.87 to 13.43 (Table 3). Our results show less richness diversity than other studies in that area due to anthropogenic and hot climates. It is important to note that species richness increases with species number. Significant values (p ≤ 0.05) were found in the association between relative frequency and Density.
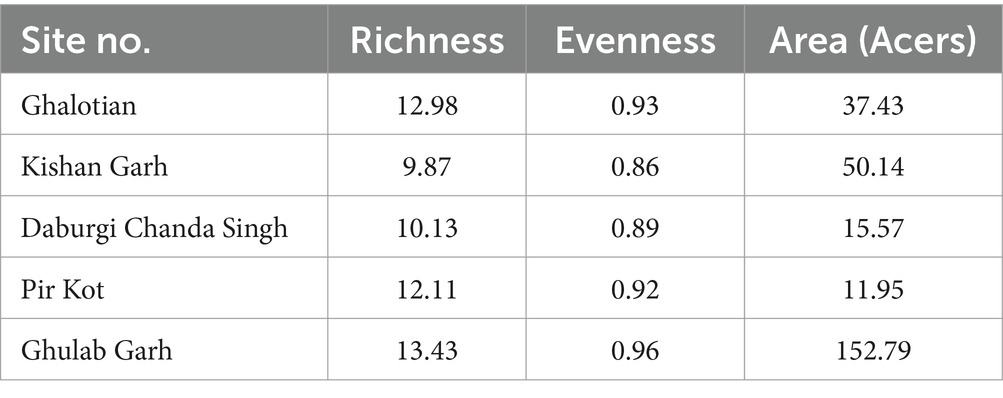
Table 3. Richness, evenness, and diversity indexes for the species of plants at five sites of the Sialkot range forest, District Sialkot, Punjab, Pakistan.
The species diversity also depends on the area of the forest. We investigated the extent of field study during the fieldwork. Notably, Table 3 shows a strong correlation between each site’s forest area and the richness of species diversity value; for example, Ghulab Garh forest has the most significant area of woodland with the highest valued species variety. At the same time, the Pir Kot Forest has less forest area and species diversity than other sites.
The Principal Coordinate Analysis (PCoA) employed plots to show the variation of 170 plant species along with different environmental conditions in 60 quadrats (Figure 4). Five plant groups, which stand in for five study sites, are represented on the plot. We demonstrated that the distribution and composition of species were strongly influenced by factors such as soil texture (clay, sand, loam, and sandy), organic matter, soil pH, calcium (Ca+2), magnesium (Mg+2), sodium (Na+), chlorine (Cl−), electric conductivity (EC) temperature, precipitation, and moisture. More vegetation was visible and distributed more widely in sandy and loamy soils than in other soil types. Temperature is the dominant trait influencing plant vegetation, followed by precipitation, soil pH, moisture contents, loamy and sandy soil, and other organic and chemical components (Figure 4).
Higher soil moisture levels were recorded in the Kishan Garh and Ghulab Garh forests compared to the other three sites with lower moisture contents. Cl−, Ca+2, Na+, Mg+2, and soil moisture contents vary greatly in all sites from place to place (Table 4). Kishan Garh forest displayed higher levels of plant diversity than the other sites due to its much higher quantities of accessible Cl−, Ca+2, Na+, and Mg+2. Thus, these mineral contents impact plant diversification (Table 4). For various sites, the range of EC ds/m was likewise diverse. Ghalotian forest has a maximum value of EC ds/m, whereas Kishan Garh Forest has a minimum value, making Ghalotian forest notably distinct from the other sites. CO3−2 and HCO3−1 tests reveal that CO3−2 is absent in all sites, while HCO3−1 is present in a small amount. Kishan Garh forest site has a minimum number of HCO3−1 and shows more plant diversity, while Pir Kot Forest has the maximum number of HCO3−1, representing less plant diversity in that area. Results show that HCO3−1 harms plant diversity.
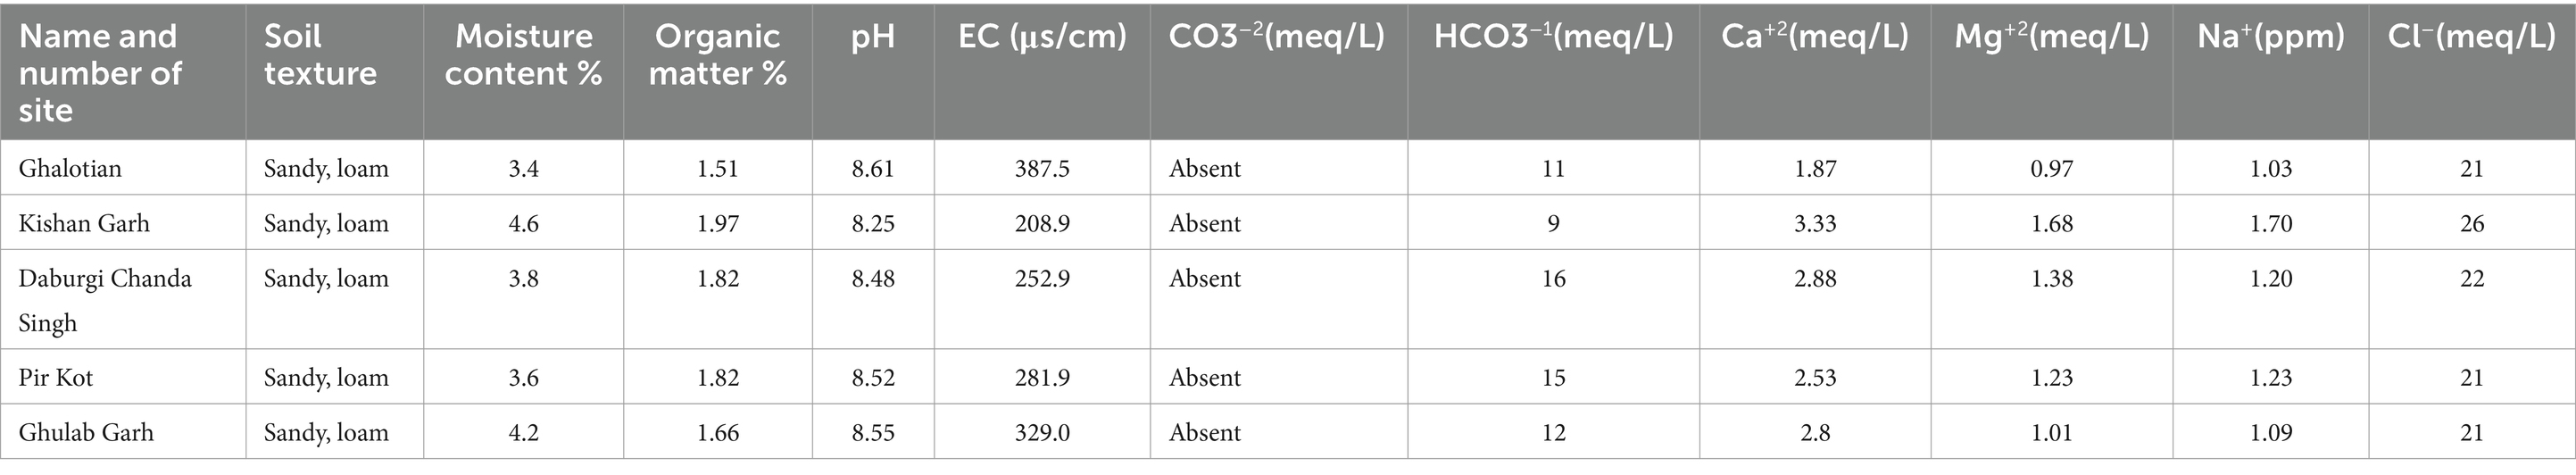
Table 4. Physiochemical analysis of soil of five selected sites of Sialkot Range Forest, Sialkot, Punjab, Pakistan.
Several studies have indicated the effects of climate change in dry forest areas, revealing increasing trends in temperature and decreasing trends in rainfall (Irwandi et al., 2017). However, previous studies only used data from a time series of less than 5 to 10 years, obtained from one climatic factor. Here, we use temperature and precipitation data sets of more than 70 years to check the temperature and precipitation trend in this area. The results showed that the increasing trend of temperature and decreasing trend of precipitation significantly affect the biodiversity of DTFs in the Sialkot region (Figure 5).
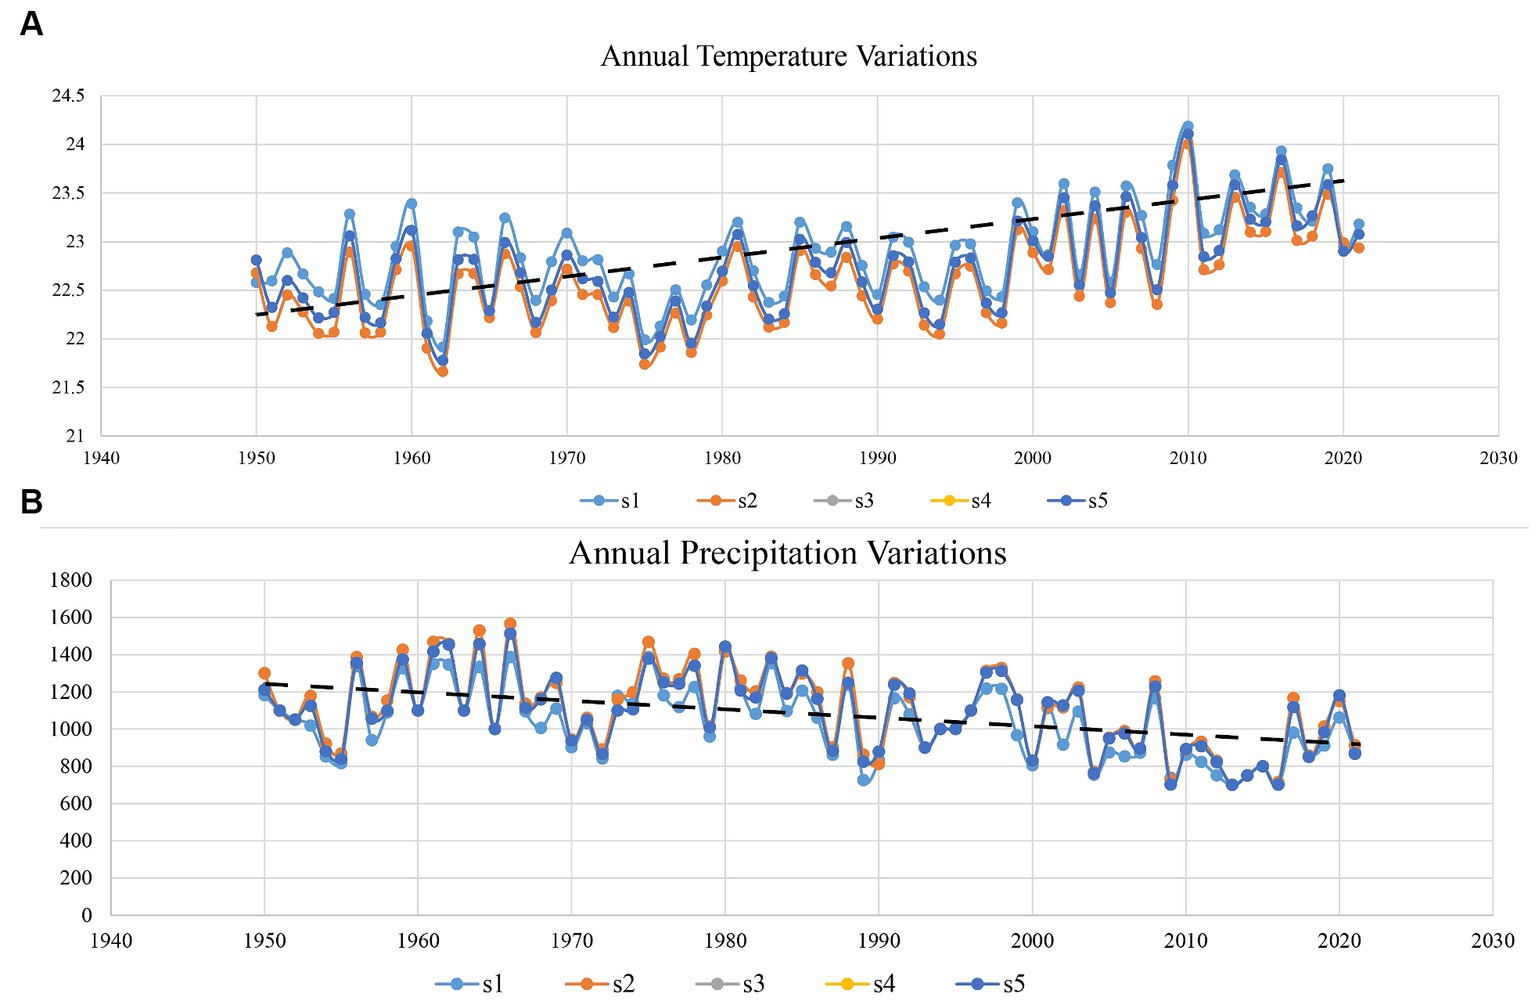
Figure 5. Variation in average annual temperature and precipitation trends from 1950 to 2021 of district Sialkot each site. (A) Represents the temperature and (B) the annual precipitation trend. S1 represents Ghalotian; S2 represents the Kishan Garh; S3 represents the Daburgi Chanda Singh; S4 represents the Pir Kot; and S5 represents the Gulab Garh forests, respectively.
The SWOT analysis revealed that vegetation and food availability were the study area’s strengths and extreme importance. The strength’s subtotal Importance Coefficient (IC) was 0.58, while its natural resource availability, size, climate, and biodiversity were moderate (Supplementary Table S5). In terms of opportunities, the Forest and Irrigation Departments were the primary forces behind the protection of wild flora and management techniques, and the subtotal sum of IC was 0.31 as indicators of significant (positive) descriptors (weakness and threats) also showed higher values (0.29 and 0.19), which suggests a more substantial impact. While additional vulnerabilities, such as anthropogenic activities, risk of human infrastructure, and agricultural practices, were at the extreme level. Threats, grazing, and anthropogenic activities also significantly contributed to a subtotal of 0.20 (Supplementary Table S5).
These forest areas contain diversified vegetation, mainly woody plants used for various purposes. This forest is also used for socioeconomic activities and hosts several animal and bird species. Some essential herb species treat circulatory diseases, digestive disorders, cough, fever, constipation, and skin diseases in these forests (Supplementary Table S6). This area is located near the urban and main Grand Trunk Roads side, with varying climatic conditions reflecting diversified vegetation. The locals of this area used these forests as unorganized agricultural practices, metropolitan area construction sites, and different anthropogenic activities such as parking and animal grazing (Supplementary Table S6). We identified numerous anthropogenic activities in the area, including habitat loss and degradation, depletion of resources of the region’s species richness, agricultural land transformation, and grazing sites (Supplementary Figure S2). Like other anthropogenic pressure points, these sites are threatened by mostly urbanization-related habitat loss. Additionally, the construction of roads between these forests fragmented and destroyed their habitat. The most significant hazard at Daburgi Chanda Singh Forest was habitat disruption because waste debris severely reduced flower diversity (Supplementary Figure S2). In contrast, locals were bound to observe the maintenance of wild areas along the Daburgi Chanda Singh, Pir Kot, and Gulab Garh forests (Supplementary Table S4). Likewise, district Sialkot’s Wildlife and forest departments protect the terrestrial ecosystem and conserve all other sites that various departments maintain. The forest and wildlife department should raise awareness among local people to preserve nature and ask them to contribute to keeping areas wild.
Forest and vegetation play a significant role in balancing ecosystem patterns, providing food security, and blessing the environment for living beings. To determine the status of global forests and biodiversity, their impact, and change over time by global change drivers is challenging and important. This study’s methods include forest cover, vegetation assessment, environmental and climatic threats to forest vegetation, anthropogenic impact on forest land, and causes of forest loss. In order to lessen risks to the region’s distinctive biodiversity, these findings collectively highlight the necessity of avoiding moderate to severe climate outcomes and giving tropical dry habitats and taxa priority in conservation planning schemes.
The increase in the frequency and severity of the dry period, as well as the high-temperature push brought on by changes in the climate, affects the biogeography, forest vegetation, tree mortality, and carbon sequestration (Allen et al., 2010). We collected data from five terrestrial forest locations to assess biodiversity and analyze the impacts of climate change and threats to biodiversity in Sialkot range dry forests. In this study, we investigate the vegetation assessment of the foliage and edaphic factors, such as the soil’s physical and chemical properties, and climatic and anthropogenic factors analysis to know how critical plant species distribution and diversity in the catchment area of Sialkot range forests. Simultaneously, phytosociological attributes aid in estimating vegetation structure and deforestation in local forest regions under heterogenic conditions (Khan et al., 2016). Our findings provide information about the interactions of an ecosystem’s various biotic and abiotic components (Baillie et al., 2004).
Floristic analysis helps identify plant diversity and overall productivity in any given location (Shaheen et al., 2016). During the summer of 2019–2021, we inspected five local forest sites of the Sialkot range forests. Its catchment areas comprise dry and wild regions, reserve woods, agricultural land, and human infrastructure of housing societies and factories. The current research reported 170 plant species from 62 families (Table 1). The Asteraceae, Fabaceae, and Poaceae groups dominated the flora. The documented families had several characteristics with the flora found in the country’s other regions, such as the dominance of the Asteraceae and Poaceae families (Shaheen et al., 2011; Abbasi et al., 2013; Abbas et al., 2016; Ijaz et al., 2016; Ali et al., 2022). Numerous studies on vegetation assessment on the native flora of the country from diverse regions have been published in the past (Ijaz et al., 2015; Kifayat et al., 2015; Saeed Khattak et al., 2015; Ahmad et al., 2016; Rahman et al., 2016; Ali et al., 2022). Furthermore, the overall recorded values are consistent with a recent study conducted in the catchment area of the river Chanab in Punjab, Pakistan (Ali et al., 2022).
Due to ideal environmental conditions, including soil chemistry, different plant species are naturally restricted to habitats or have adapted to settle in the same area. Findings suggested that the Kishan Garh Forest has a minimum richness value (9.86), while the Gulab Garh Forest revealed a maximum richness value (13.46), demonstrating the site’s species variety. According to our findings, the Gulab Garh forest has the highest number of species (49) and a more extensive area (152 acres). In contrast, the Pir Kot Forest has the lowest number of species (21) with the lowest area of forest (11 acres), and the remaining sites have moderate values (Table 1) with moderate area in size. At the same time, low species diversity has been reported from the Ghalotian forest. Our soil analysis results indicated that organic matter %, soil moisture contents, Ca+2, Mg+2, and Na+ are significantly lower in the Ghalotian forest than at other sites. In addition, deforestation, human interventions, agricultural activities, animal grazing, and warm climatic conditions also cause annual plants to disappear quickly from the Ghalotian forest area. The previous example of environmental stress decreases the species diversity in dry land (Khan et al., 2011). Another reason Gulab Garh forest had the most plant species of any site is that this area could be attributed to lower anthropogenic activity and a larger forest area than other sites. Because abiotic factors alter vegetation structure over time and geography, species richness interprets the biological variety resulting from numerous environmental conditions (Chawla et al., 2008; Khan et al., 2016). Furthermore, geography, climatic factors, and anthropogenic impact on the soil affect plants’ growth and alteration in environmental factors significantly impacts plant species’ evolution (Khan et al., 2014).
Our findings highlighted alpha diversity’s significant effects; a key factor of plant growth influenced by the soil structure. Environmental elements like loamy and sandy soil also impacted alpha diversity in various forest areas. We had the most remarkable plant diversity compared to other soil patterns because loamy and sandy soil played a vital role in alpha diversity. Recent research in the various parts of the country has found a similar design of variety across environmental parameters, such as the phytosociological study of River Chanab and the Naran Valley (Khan et al., 2011, 2012; Ali et al., 2022). Similarly, sites with the same soil characteristics have little variety, which might be influenced by numerous biotic or abiotic factors (Hussain et al., 2019). Gulab Garh forest had the highest richness evenness value compared to the other forest sites (Khan et al., 2011, 2012, 2016; Earnhardt et al., 2014). Supporting evidence for plant species composition was also provided by studies conducted in other parts of the country, including the Central Himalayan (Kumaun) region of India, Azad Jammu & Kashmir, Dao Khan Hills, and the river Chanab (Kharkwal et al., 2005; Ali et al., 2022).
Climate change has significantly influenced plant diversity, posing a severe threat to the basis of ecosystem structure and function. Specifically, temperature and precipitation are both expected to shift globally, and their separate and interactive effects will likely affect ecosystems differentially depending on current temperature, precipitation regimes, and other biotic and environmental factors. Our results suggested that increasing temperature trends and decreasing precipitation trends (Figure 5) significantly affect the plant biodiversity in this area. We found that warming effects were context-dependent, with the most significant adverse impacts of warming on diversity in the warmer, drier slope location. The long-term trend of decreased growing-season rainfall drove a decline in multivariate functional diversity (Miller et al., 2019), paralleling the loss of species richness. Our study is essential in understanding how global change will affect ecosystems across multiple scales and locations.
The SWOT analysis was modified to identify the emphasizing approaches, including negative and positive events at the regional, provincial, and national levels. Strength and opportunity indicators and higher values indicate a more significant beneficial influence (Stortini et al., 2015; White et al., 2015). It also helps to discover and decrease uncertainty. The SWOT analysis thoroughly broke down the external and internal elements (strengths and opportunities) and vulnerabilities (weaknesses and threats) that vegetation in the woods of the Sialkot range forest faced. Results revealed that the Sialkot range forest areas are affected due to multiple threats that will lead to deforestation. Several anthropogenic activities have impacted overall biodiversity, harming surrounding vegetation and thus depleting natural resources (Supplementary Tables S5, S6).
Other TDFs face significant problems from anthropogenic activities such as inappropriate cultivation, urbanization, and habitat destruction (Iqbal et al., 2021). The principal drawbacks and weaknesses of all the sites are building new housing societies and roads, clearing the forests, and livestock grazing (Supplementary Table S6). Changes in the topography, depletion of natural resources, and urbanization have always been associated with human activity (Khaleghi, 2017). The connectedness between biological relationships with other nearby places might be broken by habitat loss (Hanski and Ovaskainen, 2002). Previous studies also reported that anthropogenic activities have significantly affected the natural environment (Goudie, 2013). The area of agricultural land quadrupled between the 1700s and 2000s, and the amount of natural vegetation decreased by half worldwide (Scanlon et al., 2007; Pongratz et al., 2008). Over-harvesting, increasing populations and need for homes, expansion of agriculture, pollution, unsuitable, indiscriminate development, and habitat degradation are the leading causes of biodiversity loss (Kumar and Verma, 2020; Prakash, 2020).
Additionally, many experts argue that anthropogenic activities are the primary cause of the recent increase in CO2 levels in the atmosphere (Ghosh and Brand, 2003; Prakash, 2021). These human actions degrade the forest environment, endangering stability and lowering biodiversity, particularly in plant and animal species (Athirah et al., 2013). Akbar et al. (2017) conclude that anthropogenic activities are the main contributors to deforestation and forest degradation. To conserve species, the Forest and Irrigation Department planted trees in the catchment area of the Sialkot range forest to preserve the native flora. As a result of its location in the Himalayan foothills and proximity to the Bajwat wildlife sanctuary, the Jammu Tavi Bajwat area is likely to be designated as a game reserve area with less human interventions and more biodiversity than other places (Ali et al., 2022).
Plant biodiversity observational study is a lifetime endeavor that requires contributions from many academic fields, including the natural and social sciences. The Sialkot region’s vulnerable and nearly extinct micro-forest patches are the subject of this investigation. A thorough botanical investigation is necessary to describe the plant taxa, richness, and conservation status of the Sialkot range forest, District Sialkot, Pakistan. They were unrepairable losses to plant biodiversity, rising temperatures, and deforestation caused by human activities. As a result, we should consider all possible regional and local drivers of plant biodiversity. According to recent research, SWOT can be modified to account for risks to the plant community, from the individual to the community (Ali et al., 2022). Additionally, it must urgently communicate with planners, policymakers, and conservationists to conserve important wild species. Steps must be taken to address new issues locally and regionally through tight monitoring regulations. The local government must work with community organizations and NGOs to stop the widespread degradation of the natural ecosystems caused by increasing population, agriculture, deforestation, and the construction of illegal housing societies and roads.
Our results indicated that Thymelia passive, Argemone Mexicana, Adhatoda vasica, and Geranium rotundifolium were different species not previously known. Saccharum arundinaceum, Saccharum spontaneum L., Poa annua L., and Desmostachya bipinnata L. are a few examples of wild cultivated plants that can benefit from having stress and disease resistance traits. There is a suggestion that unique or fragmented ecosystems and the protection of rare species may go alongside one another. Furthermore, it is recommended that species be categorized following IUCN classifications to implement timely and systematic conserving action that is both effective and efficient. The Sialkot range forests also support other species not currently used as food, fuel, medicine, or timber. These are just wild genetic resources of essential biodiversity species. We could use two broad strategic methods to protect ecological variety in the Sialkot range forests to summarize the entire description for future management on an urgent basis. Firstly, stop using natural resources illegally. Secondly, create botanical gardens, reforest areas, designate protected areas, breed rare species locally, and create satellite seed and gene banks to restore plant biodiversity. The concerns are also addressed by adhering to Pakistan’s biodiversity action plan and working toward achieving sustainable development goals (Ali and Iqbal, 2021). In addition, it will be necessary to address habitat fragmentation and deforestation to allow plant species to use dispersal to track favorable conditions. Priorities should be given to conserve and restore the dry forest habitats and surrounding communities.
Tropical dry forests (TDF) are crucial for preserving biodiversity since they are home to rare and endemic species especially suited to harsh environmental circumstances. Along with supporting livelihoods and the general well-being of the locals, they also supply important ecosystem goods and services. Most of the remaining TDFs are currently threatened, primarily due to human activity and extreme environmental factors. A vicious cycle of deforestation, fragmentation, habitat degradation, and desertification ensnared these ecosystems. Our findings warn that these depressing images linked to TDFs are primarily the result of a lack of research, education, resources, and occupational duties. Our research indicates significant challenges to dryland resources generally and TDFs specifically, making their future questionable. The effects of anthropogenic activity exacerbate the impact of global climate change. The historical concerns of the more humid forest ecosystems cast a shadow over these critical ecosystems. Thus, we must consider these most important and least understood ecosystems more in our attempts to lessen the effects of climate change and achieve sustainable development goals. Further research is also needed to generate knowledge on the status and significance of TDFs and their responses in the face of the changing climate to bring their sustainable management to the attention of policymakers and managers.
The datasets presented in this study can be found in online repositories. The names of the repository/repositories and accession number(s) can be found in the article/Supplementary material.
KS: Conceptualization, Data curation, Formal analysis, Funding acquisition, Investigation, Methodology, Project administration, Resources, Software, Supervision, Validation, Visualization, Writing – original draft, Writing – review & editing. WA: Conceptualization, Data curation, Formal analysis, Investigation, Writing – review & editing. SM: Data curation, Formal analysis, Methodology, Writing – review & editing. JD: Conceptualization, Data curation, Formal analysis, Supervision, Writing – review & editing. UZ: Conceptualization, Data curation, Formal analysis, Methodology, Writing – review & editing. MZ: Data curation, Formal analysis, Methodology, Software, Writing – review & editing.
The author(s) declare that financial support was received for the research, authorship, and/or publication of this article. This research has been supported by the National Key Research and Development Program of China (grant no. 2023YFF1303804), the Strategic Priority Research Program of the Chinese Academy of Sciences (grant no. XDA26010202), and the National Natural Science Foundation of China (grant no. 42271062).
We thank the Department of Forest Sialkot, Pakistan for providing the important data. Our thanks to all the other workers and students at Government College and university Lahore and the Chinese Academy of Sciences, Beijing, China for their support during the data collection and analysis.
The authors declare that the research was conducted in the absence of any commercial or financial relationships that could be construed as a potential conflict of interest.
All claims expressed in this article are solely those of the authors and do not necessarily represent those of their affiliated organizations, or those of the publisher, the editors and the reviewers. Any product that may be evaluated in this article, or claim that may be made by its manufacturer, is not guaranteed or endorsed by the publisher.
The Supplementary material for this article can be found online at: https://www.frontiersin.org/articles/10.3389/ffgc.2024.1362117/full#supplementary-material
1. ^http://legacy.tropicos.org/Project/Pakistan
2. ^https://powo.science.kew.org/
3. ^https://cran.r-project.org/web/packages/ggpubr/index.html
Abbas, Z., Khan, S. M., Abbasi, A. M., Pieroni, A., Ullah, Z., Iqbal, M., et al. (2016). Ethnobotany of the Balti community, Tormik valley, Karakorum range, Baltistan, Pakistan. J. Ethnobiol. Ethnomed. 12:38. doi: 10.1186/s13002-016-0114-y
Abbasi, A. M., Khan, S. M., Ahmad, M., Khan, M. A., Quave, C. L., and Pieroni, A. (2013). Botanical ethnoveterinary therapies in three districts of the lesser Himalayas of Pakistan. J. Ethnobiol. Ethnomed. 9:84. doi: 10.1186/1746-4269-9-84
Ahmad, Z., Khan, S., Ali, S., Rahman, I. U., Begum, H., Noreen, I., et al. (2016). Indicator species analyses of weed communities of maize crop in district Mardan, Pakistan. Pak. J. Weed Sci. Res 22, 227–238,
Akbar, A. A., Sartohadi, J., Djohan, T. S., and Ritohardoyo, S. (2017). The role of breakwaters on the rehabilitation of coastal and mangrove forests in West Kalimantan, Indonesia. Ocean Coastal Manag. 138, 50–59. doi: 10.1016/j.ocecoaman.2017.01.004
Ali, M. A., and Iqbal, M. S. (2021). Impact of headworks of river Chenab on surrounding vegetation and Phytodiversity analysis. Engin. Proceed. 12:16. doi: 10.3390/engproc2021012016
Ali, M. A., Iqbal, M. S., Ahmad, K. S., Akbar, M., Mehmood, A., Hussain, S. A., et al. (2022). Plant species diversity assessment and monitoring in catchment areas of river Chenab, Punjab, Pakistan. PLoS One 17:e0272654. doi: 10.1371/journal.pone.0272654
Allen, S. E. (1989). Chemical analysis of ecological materials. 2nd, completely revised Edn. Oxford, England: Blackwell Scientific Publications.
Allen, C. D., Macalady, A. K., Chenchouni, H., Bachelet, D., McDowell, N., Vennetier, M., et al. (2010). A global overview of drought and heat-induced tree mortality reveals emerging climate change risks for forests. For. Ecol. Manag. 259, 660–684. doi: 10.1016/j.foreco.2009.09.001
Athirah, A., Asaf, R., and Ratnawati, E. (2013). Faktor lingkungan yang mempengaruhi produktivitas menggunakan aplikasi analisis jalur di tambak bandeng kabupaten indramayu, provinsi jawa barat. J. Kelautan Nasional 8:35. doi: 10.15578/jkn.v8i1.6219
Bahadur, S., Khan, M. S., Shah, M., Shuaib, M., Ahmad, M., Zafar, M., et al. (2020). Traditional usage of medicinal plants among the local communities of Peshawar valley, Pakistan. Acta Ecol. Sin. 40, 1–29. doi: 10.1016/j.chnaes.2018.12.006
Baillie, J., Hilton-Taylor, C., and Stuart, S. N. (2004). IUCN red list of threatened species: a global species assessment
Bellard, C., Cassey, P., and Blackburn, T. M. (2016). Alien species as a driver of recent extinctions. Biol. Lett. 12:20150623. doi: 10.1098/rsbl.2015.0623
Brooks, T. M., Mittermeier, R. A., da Fonseca, G. A. B., Gerlach, J., Hoffmann, M., Lamoreux, J. F., et al. (2006). Global biodiversity conservation priorities. Science 313, 58–61. doi: 10.1126/science.1127609
Cayuela, L., Golicher, D. J., Newton, A. C., Kolb, M., de Alburquerque, F. S., Arets, E. J. M. M., et al. (2009). Species distribution modeling in the tropics: problems, potentialities, and the role of biological data for effective species conservation. Trop. Conserv. Sci. 2, 319–352. doi: 10.1177/194008290900200304
Chawla, A., Rajkumar, S., Singh, K. N., Lal, B., Singh, R. D., and Thukral, A. K. (2008). Plant species diversity along an altitudinal gradient of Bhabha Valley in western Himalaya. J. Mt. Sci. 5, 157–177. doi: 10.1007/s11629-008-0079-y
Chua, S. C., and Potts, M. D. (2018). The role of plant functional traits in understanding forest recovery in wet tropical secondary forests. Sci. Total Environ. 642, 1252–1262. doi: 10.1016/j.scitotenv.2018.05.397
Curtis, J., and Cottom, G. (1956). Plant ecology workbook, laboratory field manual. Minnesota: Burgess Publishing, 193.
Curtis, J. T., and McIntosh, R. P. (1950). The interrelations of certain analytic and synthetic phytosociological characters. Ecology 31, 434–455. doi: 10.2307/1931497
De Kort, H., Prunier, J. G., Ducatez, S., Honnay, O., Baguette, M., Stevens, V. M., et al. (2021). Life history, climate and biogeography interactively affect worldwide genetic diversity of plant and animal populations. Nat. Commun. 12:516. doi: 10.1038/s41467-021-20958-2
Dexter, K. G., Smart, B., Baldauf, C., Baker, T. R., Balinga, M. P. B., Brienen, R. J. W., et al. (2015). Floristics and biogeography of vegetation in seasonally dry tropical regions. Int. For. Rev. 17, 10–32. doi: 10.1505/146554815815834859
Di Marco, M., Venter, O., Possingham, H. P., and Watson, J. E. M. (2018). Changes in human footprint drive changes in species extinction risk. Nat. Commun. 9:4621. doi: 10.1038/s41467-018-07049-5
Dury, M., Mertens, L., Fayolle, A., Verbeeck, H., Hambuckers, A., and François, L. (2018). Refining species traits in a dynamic vegetation model to project the impacts of climate change on tropical trees in Central Africa. Forests 9:722. doi: 10.3390/f9110722
Earnhardt, J., Vélez-Valentín, J., Valentin, R., Long, S., Lynch, C., and Schowe, K. (2014). The Puerto Rican parrot reintroduction program: sustainable management of the aviary population. Zoo Biol. 33, 89–98. doi: 10.1002/zoo.21109
Ellison, D., Morris, C. E., Locatelli, B., Sheil, D., Cohen, J., Murdiyarso, D., et al. (2017). Trees, forests and water: cool insights for a hot world. Glob. Environ. Chang. 43, 51–61. doi: 10.1016/j.gloenvcha.2017.01.002
Et, A., and Ganjali, S. (2014). Environmental and strategic assessment of ecotourism potential in Anzali wetland using SWOT analysis. Caspian J. Environ. Sci. 12, 155–165,
Everson, C. S., and Clarke, G. P. Y. (1987). A comparison of six methods of botanical analysis in the montane grasslands of Natal. Vegetatio 73, 47–51. doi: 10.1007/BF00031850
FAO (2006). Global Forest resources assessment 2005: progress towards sustainable forest management.
Feeley, K. J., Malhi, Y., Zelazowski, P., and Silman, M. R. (2012). The relative importance of deforestation, precipitation change, and temperature sensitivity in determining the future distributions and diversity of Amazonian plant species. Glob. Chang. Biol. 18, 2636–2647. doi: 10.1111/j.1365-2486.2012.02719.x
Ghosh, P., and Brand, W. A. (2003). Stable isotope ratio mass spectrometry in global climate change research. Int. J. Mass Spectrom. 228, 1–33. doi: 10.1016/S1387-3806(03)00289-6
Goldsmith, F. B., Harrison, C. M., and Morton, A. J. (1986). Description and analysis of vegetation. Methods in plant ecology. 2nd Edn. 505–509.
Goudie, A. (2013). The human impact on the natural environment: past, present and future. 7th Edn. St Cross College, Oxford: Wiley-Blackwell.
Hamer, D., and Herrero, S. (1987). Grizzly bear food and habitat in the front ranges of Banff National Park, Alberta, Alberta. Bears 7, 199–213. doi: 10.2307/3872626
Hanski, I., and Ovaskainen, O. (2002). Extinction debt at extinction threshold. Conserv. Biol. 16, 666–673. doi: 10.1046/j.1523-1739.2002.00342.x
Hu, Y. S., Yao, X. Y., and Liu, Y. H. (2014). The functional traits of forests at different succession stages and their relationship to terrain factors in Changbai Mountains. Acta Ecol. Sin. 34, 5915–5924. doi: 10.5846/stxb201301230133
Hussain, M., Khan, S. M., Abd_Allah, E. F., Ul Haq, Z., Alshahrani, T. S., Alqarawi, A. A., et al. (2019). Assessment of plant communities and identification of indicator species of an ecotonal forest zone at Durand line, district Kurram, Pakistan. Appl. Ecol. Environ. Res. 17, 6375–6396. doi: 10.15666/aeer/1703_63756396
Ijaz, F., Iqbal, Z., Alam, J., Khan, S. M., Afzal, A., Rahman, I., et al. (2015). Ethno medicinal study upon folk recipes against various human diseases in Sarban Hills, Abbottabad, Pakistan. Available at: (https://www.semanticscholar.org/paper/Ethno-Medicinal-Study-upon-Folk-Recipes-Against-in-Ijaz-Iqbal/c2491cabd42748e7e4523a80bd626c2096a2c364).
Ijaz, F., Iqbal, Z., Rahman, I. U., Alam, J., Khan, S. M., Shah, G. M., et al. (2016). Investigation of traditional medicinal floral knowledge of Sarban Hills, Abbottabad, KP, Pakistan. J. Ethnopharmacol. 179, 208–233. doi: 10.1016/j.jep.2015.12.050
Iqbal, M. S., Ahmad, K. S., Ali, M. A., Akbar, M., Mehmood, A., Nawaz, F., et al. (2021). An ethnobotanical study of wetland flora of head Maralla Punjab Pakistan. PLoS One 16:e0258167. doi: 10.1371/journal.pone.0258167
Irwandi, H., Ariantono, J. Y., Kartika, Q. A., Siregar, A. C. P., Tari, C. A., and Sudrajat, A. (2017). Pengaruh Iklim Terhadap Penurunan Tinggi Muka Air Danau Toba. In Seminar Nasional Sains Atmosfer 2017.
Jiao, F., Shi, X.-R., Han, F.-P., and Yuan, Z.-Y. (2016). Increasing aridity, temperature and soil pH induce soil C-N-P imbalance in grasslands. Sci. Rep. 6:19601. doi: 10.1038/srep19601
Johnson, C. J., Parker, K. L., Heard, D. C., and Gillingham, M. P. (2002). A multiscale behavioral approach to understanding the movements of woodland Caribou. Ecol. Appl. 12, 1840–1860. doi: 10.1890/1051-0761(2002)012[1840:AMBATU]2.0.CO;2
Keenan, T. F., and Richardson, A. D. (2015). The timing of autumn senescence is affected by the timing of spring phenology: implications for predictive models. Glob. Chang. Biol. 21, 2634–2641. doi: 10.1111/gcb.12890
Khaleghi, M. R. (2017). The influence of deforestation and anthropogenic activities on runoff generation. J. For. Sci. 63, 245–253. doi: 10.17221/130/2016-JFS
Khan, S., Harper, D., Page, S., and Ahmad, H. (2011). Residual value analyses of the medicinal Flora of the Western Himalayas: the Naran Valley, Pakistan. Pakistan J. Botany 43, 97–104,
Khan, W., Khan, S. M., Ahmad, H., Ahmad, Z., and Page, S. (2016). Vegetation mapping and multivariate approach to indicator species of a forest ecosystem: a case study from the Thandiani sub forests division (TsFD) in the Western Himalayas. Ecol. Indic. 71, 336–351. doi: 10.1016/j.ecolind.2016.06.059
Khan, S., Page, S., Ahmad, H., and Harper, D. (2012). Anthropogenic influences on the natural ecosystem of the Naran Valley in the Western Himalayas Pakistan. Pak. J. Bot. 44, 231–238,
Khan, S. M., Page, S., Ahmad, H., and Harper, D. (2014). Ethno-ecological importance of plant biodiversity in mountain ecosystems with special emphasis on indicator species of a Himalayan Valley in the northern Pakistan. Ecol. Indic. 37, 175–185. doi: 10.1016/j.ecolind.2013.09.012
Kharkwal, G., Mehrotra, P., Rawat, Y. S., and Pangtey, Y. P. S. (2005). Phytodiversity and growth form in relation to altitudinal gradient in the central Himalayan (Kumaun) region of India. Curr. Sci. 89, 873–878,
Kifayat, U., Khan, F., Khan, K., Shah, M., Ahmad, H., Ashraf, M., et al. (2015). Investigation of traditional veterinary Phytomedicines used in Deosai plateau, Pakistan. Global Veterinaria 15, 381–388. doi: 10.5829/idosi.gv.2015.15.04.96104
Lehmann, C. E. R., Archibald, S. A., Hoffmann, W. A., and Bond, W. J. (2011). Deciphering the distribution of the savanna biome. New Phytol. 191, 197–209. doi: 10.1111/j.1469-8137.2011.03689.x
Lindenmayer, D. B., Franklin, J. F., and Fischer, J. (2006). General management principles and a checklist of strategies to guide forest biodiversity conservation. Biol. Conserv. 131, 433–445. doi: 10.1016/j.biocon.2006.02.019
Malhi, Y., and Phillips, O. L. (2004). Tropical forests and global atmospheric change: a synthesis. Philosophical Transactions of the Royal Society of London. Series B: Biological Sciences. 359, 549–555.
Malhi, Y., Roberts, J. T., Betts, R. A., Killeen, T. J., Li, W., and Nobre, C. A. (2008). Climate change, deforestation, and the fate of the Amazon. Science 319, 169–172. doi: 10.1126/science.1146961
McCleary, K., and Mowat, G. (2002). Using forest structural diversity to inventory habitat diversity of forest-dwelling wildlife in the West Kootenay region of British Columbia. Available at: https://vtechworks.lib.vt.edu/handle/10919/66395
Miles, L., Newton, A. C., DeFries, R. S., Ravilious, C., May, I., Blyth, S., et al. (2006). A global overview of the conservation status of tropical dry forests. J. Biogeogr. 33, 491–505. doi: 10.1111/j.1365-2699.2005.01424.x
Miller, J. E. D., Li, D., LaForgia, M., and Harrison, S. (2019). Functional diversity is a passenger but not driver of drought-related plant diversity losses in annual grasslands. J. Ecol. 107, 2033–2039. doi: 10.1111/1365-2745.13244
Noreen, F., Choudri, M., Noureen, S., Muhammad, A. D. İ. L., Yaqoob, M., Mustafa, A. G., et al. (2020). Ethnomedicianal profile of Flora of district Sialkot, Punjab, Pakistan. New Trends Med. Sci. 1, 65–83,
Noss, R. F. (1990). Indicators for monitoring biodiversity: a hierarchical approach. Conserv. Biol. 4, 355–364. doi: 10.1111/j.1523-1739.1990.tb00309.x
Ortega, M. A., Cayuela, L., Griffith, D. M., Camacho, A., Coronado, I. M., del Castillo, R. F., et al. (2024). Climate change increases threat to plant diversity in tropical forests of Central America and southern Mexico. PLoS One 19:e0297840. doi: 10.1371/journal.pone.0297840
Pearson, R., Stanton, J., Shoemaker, K., Aiello-Lammens, M., Ersts, P., Horning, N., et al. (2014). Life history and spatial traits predict extinction risk due to climate change. Nature Clim. Change 4, 217–221. doi: 10.1038/nclimate2113
Pongratz, J., Reick, C., Raddatz, T., and Claussen, M. (2008). A reconstruction of global agricultural areas and land cover for the last millennium. Glob. Biogeochem. Cycles 22. doi: 10.1029/2007GB003153
Prakash, S. (2020). Climate change and need of biodiversity conservation: a review. Int. J. Appl. Res. 3, 554–557,
Prakash, S. (2021). Impact of climate change on aquatic ecosystem and its biodiversity: an overview. Int. J. Biol. Innov. 3. doi: 10.46505/IJBI.2021.3210
Rahman, A. U., Khan, S. M., Khan, S., Hussain, A., Rahman, I. U., Iqbal, Z., et al. (2016). Ecological assessment of plant communities and associated edaphic and topographic variables in the Peochar Valley of the Hindu Kush Mountains. Mt. Res. Dev. 36, 332–341. doi: 10.1659/MRD-JOURNAL-D-14-00100.1
Ren, H., Taube, F., Stein, C., Zhang, Y., Bai, Y., and Hu, S. (2017). Grazing weakens temporal stabilizing effects of diversity in the Eurasian steppe. Ecol. Evol. 8, 231–241. doi: 10.1002/ece3.3669
Risser, P. G., and Rice, E. L. (1971). Phytosociological analysis of Oklahoma upland Forest species. Ecology 52, 940–945. doi: 10.2307/1936049
Saeed Khattak, N., Nouroz, F., Ur Rahman, I., and Noreen, S. (2015). Ethno veterinary uses of medicinal plants of district Karak, Pakistan. J. Ethnopharmacol. 171, 273–279. doi: 10.1016/j.jep.2015.05.048
Scanlon, B. R., Jolly, I., Sophocleous, M., and Zhang, L. (2007). Global impacts of conversions from natural to agricultural ecosystems on water resources: quantity versus quality. Water Resour. Res. 43. doi: 10.1029/2006WR005486
Shah, S. A., Iqbal, W., Sheraz, M., Javed, B., Zehra, S. S., Abbas, H. A. B. E., et al. (2021). Ethnopharmacological study of medicinal plants in Bajwat wildlife sanctuary, district Sialkot, Punjab Province of Pakistan. Evid. Based Complement. Alternat. Med. 2021, 1–25. doi: 10.1155/2021/5547987
Shahbaz, B., and Suleri, A. Q. (2009). “The political economy of forest management in Pakistan” in Exploiting natural resources: growth, instability, and conflict in the Middle East and Asia, 21–31.
Shaheen, S., Iqbal, Z., Ijaz, F., Alam, J., and Rahman, I. U. (2016). Floristic composition, biological spectrum and phenology of Tehsil Havelian, District Abbottabad, KP, Pakistan Pak. J. Bot, 48, 1849–1859.
Shaheen, H., Khan, S. M., Harper, D. M., Ullah, Z., and Qureshi, R. A. (2011). Species diversity, community structure, and distribution patterns in Western Himalayan alpine pastures of Kashmir, Pakistan. MRED 31, 153–159. doi: 10.1659/MRD-JOURNAL-D-10-00091.1
Shannon, C. E., and Weaver, W. (1963). The measurement theory of communication. Urbana: University of Illinois Press.
Shearman, P., Bryan, J., and Laurance, W. F. (2012). Are we approaching ‘peak timber’ in the tropics? Biol. Conserv. 151, 17–21. doi: 10.1016/j.biocon.2011.10.036
Springgay, E., Casallas Ramirez, S., Janzen, S., and Vannozzi Brito, V. (2019). The Forest–water Nexus: an international perspective. Forests 10:915. doi: 10.3390/f10100915
Steel, R. G. D., Torrie, J. H., and Dickey, D. A. (1996). Principles and procedures of statistics: A biometrical approach. New York: McGraw-Hill College.
Stortini, C. H., Shackell, N. L., and O’Dor, R. K. (2015). A decision-support tool to facilitate discussion of no-take boundaries for marine protected areas during stakeholder consultation processes. J. Nat. Conserv. 23, 45–52. doi: 10.1016/j.jnc.2014.07.004
Sunderland, T., Apgaua, D., Baldauf, C., Blackie, R., Colfer, C., Cunningham, A. B., et al. (2015). Global dry forests: a prologue. Int. For. Rev. 17, 1–9. doi: 10.1505/146554815815834813
Tabor, K., Hewson, J., Tien, H., González-Roglich, M., Hole, D., and Williams, J. W. (2018). Tropical protected areas under increasing threats from climate change and deforestation. Land, 7:90. doi: 10.3390/land7030090
Trujillo, A. M. (2005). Evaluation of the suitability of the karst region of north-Central Puerto Rico for the reintroduction of the Puerto Rican parrot (Amazona vittata). Mayagüez, Puerto Rico: Thesis, Univ. Puerto Rico.
Urban, M. C. (2015). Accelerating extinction risk from climate change. Science 348, 571–573. doi: 10.1126/science.aaa4984
Van Beek, J. G., Van Rosmalen, R. F., Van Tooren, B. F., and Van Der Molen, P. C. (2014). Werkwijze Natuurmonitoring en-Beoordeling Natuurnetwerk en. Utrecht, Netherlands: Natura 2000/PAS; BIJ12.
Velázquez, E., and Wiegand, T. (2020). Competition for light and persistence of rare light-demanding species within tree-fall gaps in a moist tropical forest. Ecology 101:e03034. doi: 10.1002/ecy.3034
Venter, O., Sanderson, E. W., Magrach, A., Allan, J. R., Beher, J., Jones, K. R., et al. (2016). Sixteen years of change in the global terrestrial human footprint and implications for biodiversity conservation. Nat. Commun. 7:12558. doi: 10.1038/ncomms12558
Verma, A. K. (2021). Influence of climate change on balanced ecosystem, biodiversity and sustainable development: An overview. Intern. J. Biolog. Innov. doi: 10.2139/ssrn.3935095
Vieilledent, G., Gardi, O., Grinand, C., Burren, C., Andriamanjato, M., Camara, C., et al. (2016). Bioclimatic envelope models predict a decrease in tropical forest carbon stocks with climate change in Madagascar. J. Ecol. 104, 703–715. doi: 10.1111/1365-2745.12548
Wennersten, R., and Qie, S. (2018). United Nations sustainable development goals for 2030 and resource use
White, T. H., de Melo Barros, Y., Develey, P. F., Llerandi-Román, I. C., Monsegur-Rivera, O. A., and Trujillo-Pinto, A. M. (2015). Improving reintroduction planning and implementation through quantitative SWOT analysis. J. Nat. Conserv. 28, 149–159. doi: 10.1016/j.jnc.2015.10.002
Keywords: anthropogenic activities, plant biodiversity, climate change, conservation management, Sialkot (Pakistan), environmental variables
Citation: Shahzad K, Ali WS, Muhammad S, Dai J, Zeb U and Zhu M (2024) Assessment of plant biodiversity in tropical dry forests of Sialkot, Pakistan; insight into environmental, anthropogenic influence and conservation strategies. Front. For. Glob. Change. 7:1362117. doi: 10.3389/ffgc.2024.1362117
Edited by:
Alireza Rahemi, Morehead State University, United StatesReviewed by:
Kamran Ullah, The University of Haripur, PakistanCopyright © 2024 Shahzad, Ali, Muhammad, Dai, Zeb and Zhu. This is an open-access article distributed under the terms of the Creative Commons Attribution License (CC BY). The use, distribution or reproduction in other forums is permitted, provided the original author(s) and the copyright owner(s) are credited and that the original publication in this journal is cited, in accordance with accepted academic practice. No use, distribution or reproduction is permitted which does not comply with these terms.
*Correspondence: Khurram Shahzad, a2h1cnJhbXMua2h1cnJhbUBnbWFpbC5jb20=; Junhu Dai, amhkYWlAaWdzbnJyLmFjLmNu
†These authors have contributed equally to this work
Disclaimer: All claims expressed in this article are solely those of the authors and do not necessarily represent those of their affiliated organizations, or those of the publisher, the editors and the reviewers. Any product that may be evaluated in this article or claim that may be made by its manufacturer is not guaranteed or endorsed by the publisher.
Research integrity at Frontiers
Learn more about the work of our research integrity team to safeguard the quality of each article we publish.