 Hui Liu
 Xibin Dong
 Ying Zhang1
 Baoshan Zhang
- 1College of Mechanical and Electrical Engineering, Northeast Forestry University, Harbin, Heilongjiang, China
- 2Harbin Institute of Forestry Machinery, National Forestry and Grassland Administration, Harbin, Heilongjiang, China
Introduction: Pinus koraiensis is a dominant tree species in northeastern China. Estimating its biomass is required for forest carbon stock monitoring and accounting.
Methods: This study investigates biomass estimation methods for P. koraiensis components. A Bayesian approach was used to synthesize the parameter distributions of 298 biomass models as prior information to estimate the trunk, branch, leaf, and root biomass of P. koraiensis. The results were compared with non-informative prior and the minimum least squares (MLS).
Results: The results indicated that the Bayesian approach outperformed the other methods regarding model fit and prediction error. In addition, the responses of different components to tree height varied. The models of trunk and root biomass exhibited a smaller response to tree height, whereas those of branches and leaves showed a larger response to tree height. The model parameters yield precise estimations.
Discussion: In sum, this study highlights the potential of the Bayesian methods in estimating P. koraiensis biomass and proposes further enhancements to improve estimation accuracy.
1 Introduction
Estimating tree biomass is essential to comprehend the material cycling and energy flow in forest ecosystems (Zeng and Hausmann, 2022). During the 75th session of the United Nations General Assembly in September 2020, China announced its commitment to reducing peak carbon emissions by 2030 and achieving carbon neutrality before 2060. This acknowledgment underscores the significance of forest carbon sinks and the imperative to monitor, protect, and enhance terrestrial carbon stocks. It is grounded in the recognition that alterations in forest carbon stocks can impact atmospheric CO2 concentrations (Kurz and Apps, 2006). Research on biomass estimation methods can enhance the accuracy of estimating forest carbon stocks and deepen our understanding and analysis of carbon cycling in forest ecosystems (Campbell et al., 2009; Stinson et al., 2011). However, due to the high cost and time consumption of collecting biomass data, it is necessary to estimate biomass accurately for carbon accounting and monitoring. Biomass models can be used with tree survey data (Wagers et al., 2023; Zanvo et al., 2023), such as diameter and height measurements.
Biomass estimation models have been established for Pinus koraiensis, a dominant tree species in Northeast China. Allometric growth models utilizing the diameter at breast height (DBH), tree height (H), and D2H have provided accurate biomass estimates (Wang, 2006; Dai et al., 2013). A major limitation of biomass models is that they cannot be universally applied to different species and locations due to the variability in allometric relationships (West et al., 1997; Enquist et al., 1998). The allometric relationships of trees are significantly influenced by environmental and competitive factors, which vary over time and across locations (Holbrook and Putz, 1989; King, 1991; Chambers et al., 2001). For instance, different light, soil fertility, and moisture conditions can affect tree growth patterns. Additionally, trees face competition from both conspecific and heterospecific plants, leading to variations in growth relationships (von Oheimb et al., 2011). Even within the same species, growth relationships can vary significantly across different locations, contradicting the universal scaling rules predicted by metabolic scaling theory for diverse species and biological communities (Li et al., 2005; Muller-Landau et al., 2006; Návar, 2009). Probability distributions can be used to overcome this limitation (Dong et al., 2014; Dogn et al., 2015; Widagdo et al., 2021; Xie et al., 2022b). Specifically, the probability distribution of scaling coefficients can assess the range of variation in these coefficients across different locations, providing prior information for Bayesian inference. Moreover, combining this information with field data can effectively capture the variability of growth parameters under different environmental conditions, thereby establishing a more general and accurate biomass estimation model. Building upon these findings, we propose a method using these parameter distributions to formulate new biomass models and apply it to P. koraiensis, a tree species indigenous to Northeast China.
Bayesian Statistics are employed to establish biomass models for different components of P. koraiensis. Non-informative and informative priors are used in the Bayesian framework. A total of 298 biomass models are synthesized for P. koraiensis components using data from the literature. The parameter distributions of the data are used as prior distributions to establish biomass models using Bayesian inference, an alternative approach in inferential statistics frequently used for assessing ecological models (Amir et al., 2022; Leach et al., 2022; Piccioni et al., 2022). Despite the discussion over Bayesian and classical Statistics in different scientific disciplines, research has revealed two notable advantages of Bayesian Statistics. First, Bayesian Statistics aims to learn from experience by incorporating prior knowledge about the data (Ghazoul and McAllister, 2003; Ellison, 2004). Second, Bayesian Statistics align entirely with mathematical logic, while classical Statistics demonstrate logicality solely in probabilistic statements regarding the long-term averages of repeatedly acquired sample data, rather than relying on hypotheses (Berger and Berry, 1988; Jaynes, 2003). Bayesian Statistics have been used in forestry to estimate tree diameter (Green et al., 1994; Deng et al., 2023), tree growth (Yue et al., 2022), tree mortality (Xie et al., 2022a), and other tree species biomass (Zhang et al., 2013; Aabeyir et al., 2020; Asrat et al., 2020), establish height-diameter models (Zhang et al., 2014), volume models (Yoon et al., 2013), and determine the spatial distribution of tree species (Engel et al., 2022). The goal of this study is to compile a dataset of allometric equations and parameters for P. koraiensis in the Northeast China region and derive the probability distribution of its parameters. In addition, we use data from the Lesser Khingan Mountains to evaluate the Bayesian framework for estimating the biomass of trunks, branches, leaves, and roots. Furthermore, we compare Bayesian methods with and without prior information to the least squares method for estimating the biomass of P. koraiensis.
2 Materials and methods
2.1 Study area
The study area was the Dongfanghong Forest Farm in the Lesser Khingan Mountains in Northeast China (Figure 1). The annual average temperature is 1.4°C, with the lowest average temperature occurring in early January (−40°C) and the highest temperature occurring in July (37°C). The area has a temperate continental humid monsoon climate, with an average annual precipitation of 661 mm, most of which falls in July and August. The predominant soil type is dark brown soil, with a few areas of valley meadow soil and marsh soil in forested areas. The approximate soil depth is 30 cm. The stand is a natural mixed secondary forest composed of coniferous and broad-leaved trees. There are six dominant tree species in this stand: P. koraiensis Sieb et Zucc, Picea koraiensis Nakai, Abies nephrolepis Maxim, Fraxinus mandshurica Rupr, Tilia amurensis Rupr, and Betula platyphylla Suk.
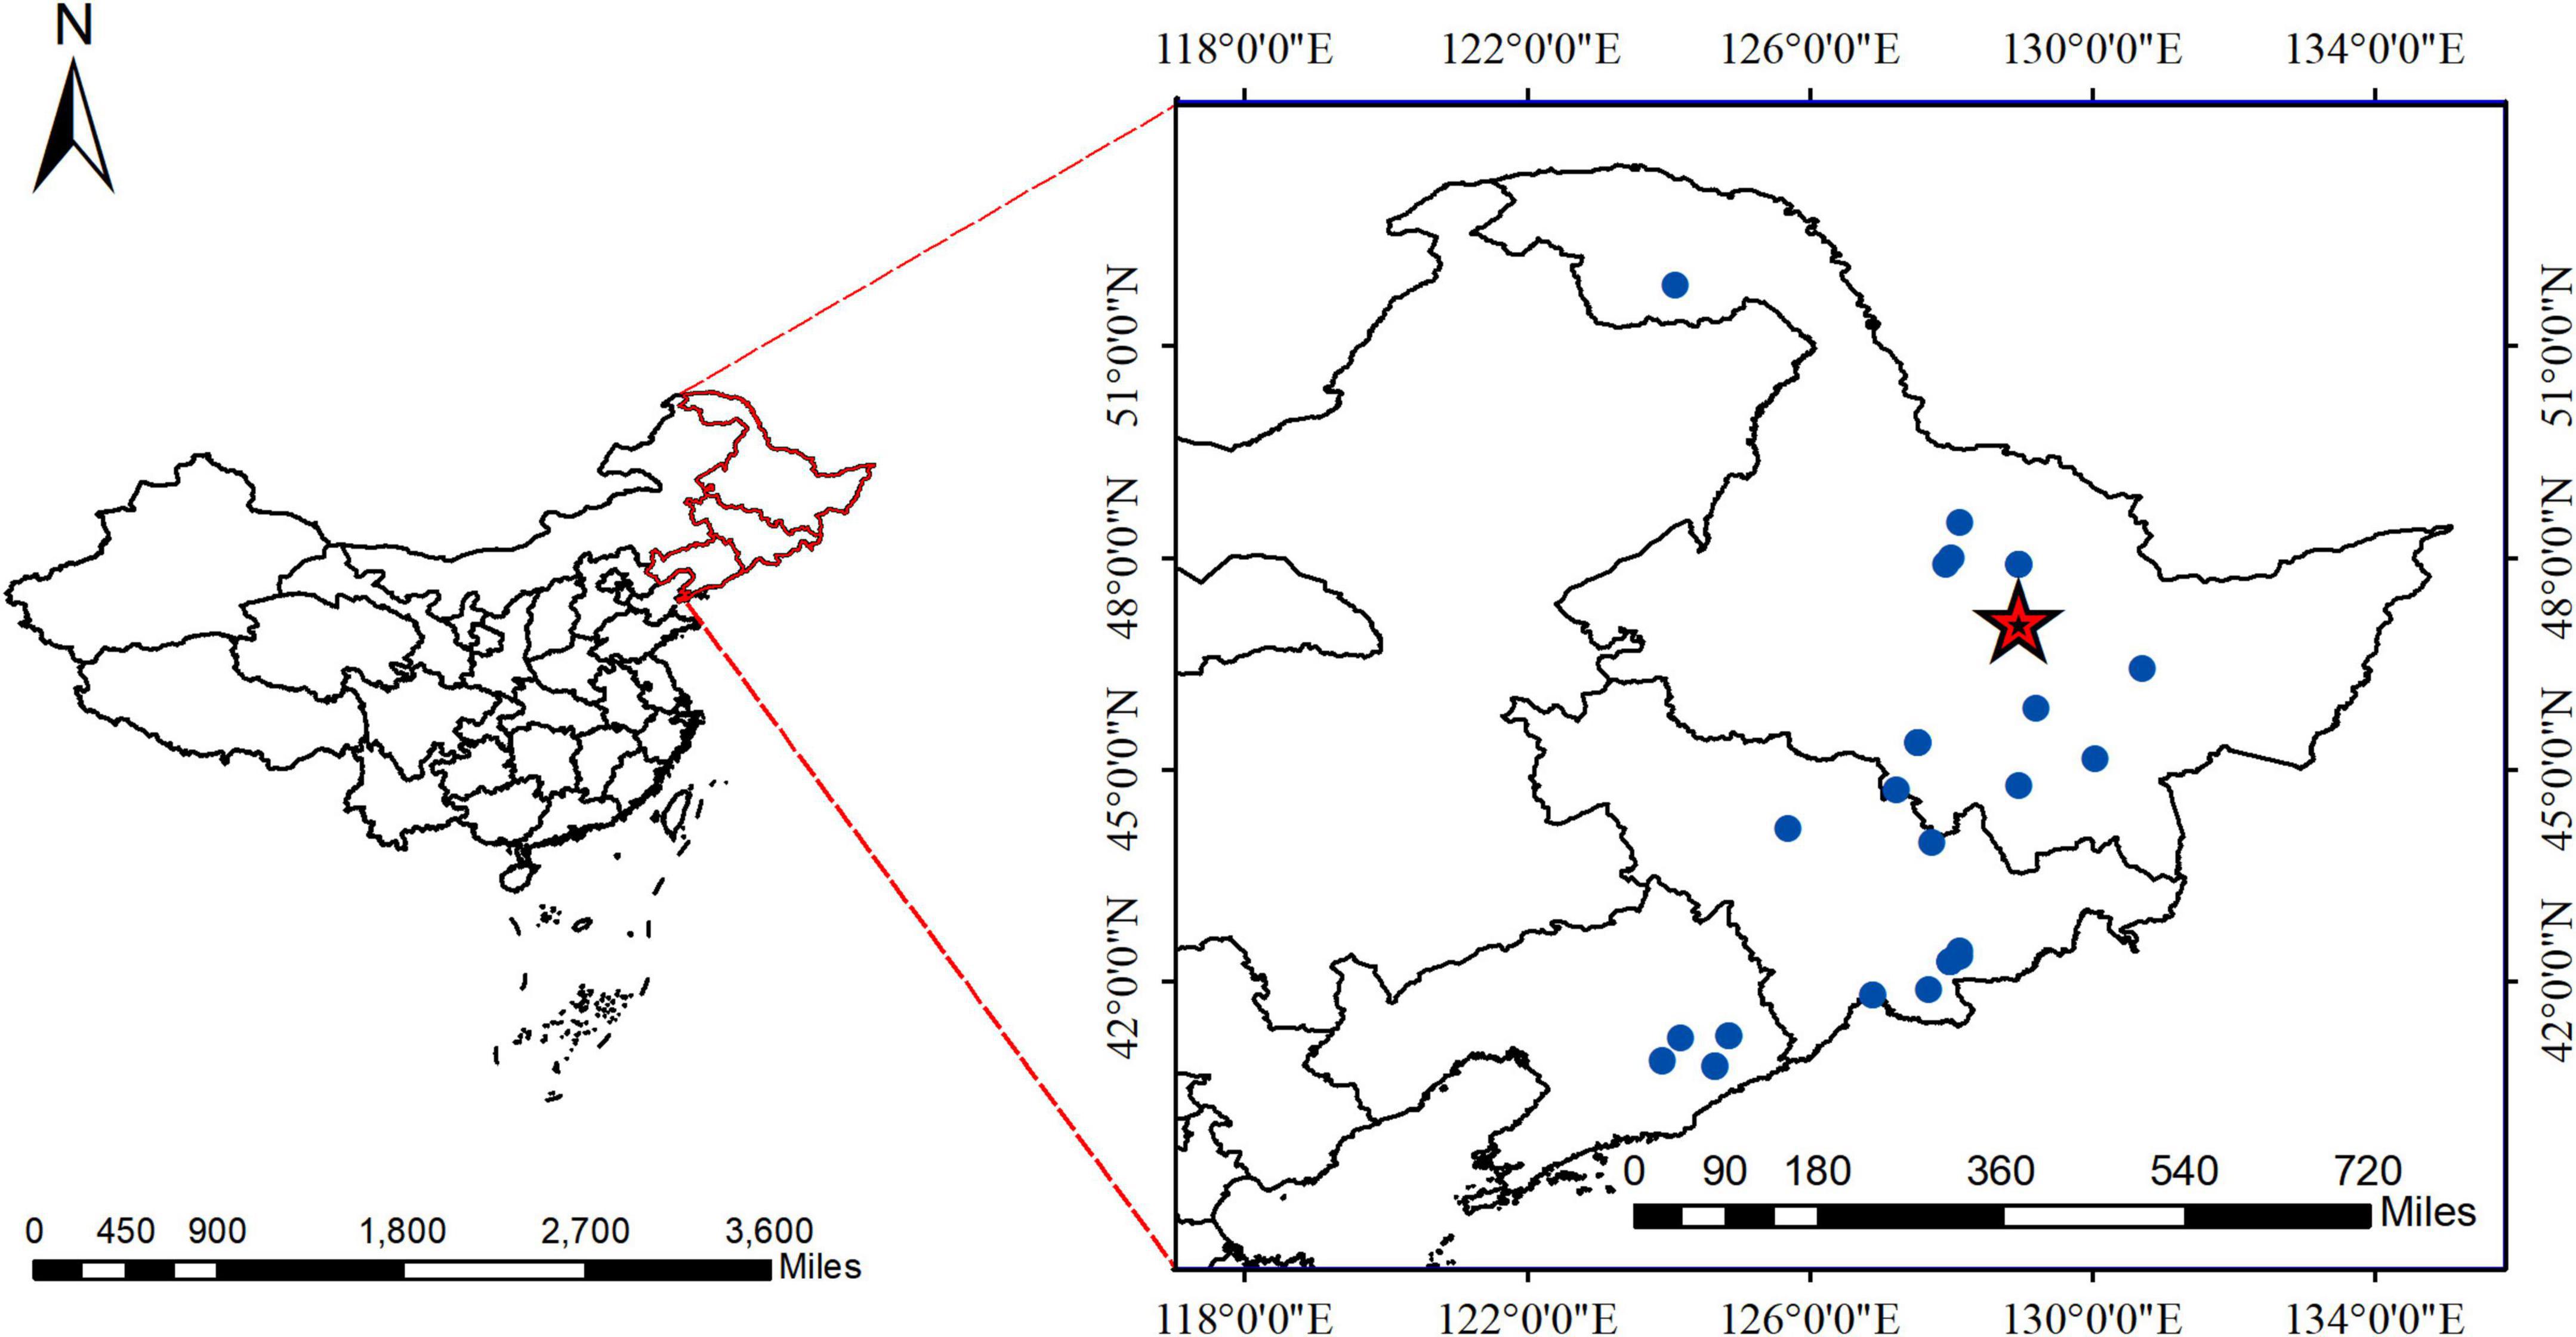
Figure 1. The geographical location of Pinus koraiensis. Areas labeled with red pentagrams belong to the Dongfanghong Forest, and the blue dots indicate where data from the literature was used.
2.2 Sampling design and biomass estimation
In the Dongfanghong Forest, a total area of 7 hm2 were chosen in areas with similar site conditions, altitude, aspect, and slope. The stand density was 1,000 trees⋅hm–2. Trees with a DBH greater than 5 cm were selected. The diameter range of the trees is listed in Supplementary Table 2. Systematic random sampling was conducted to harvest trees in this diameter range in 2022.
2.2.1 Biomass
In this study, a trunk is considered the primary supporting part of the branches from the ground to the top of the felled trees. The section with the largest circumference was considered part of the trunk to avoid ambiguity between branches and the trunk at the forks. The total fresh weight of trunks, branches, leaves, and roots was measured in the field. The trunk was cut into 1-m-long sections for measurement. Approximately 5 cm-thick discs were obtained from each section and weighed using spring scales. Samples of branches and leaves (approximately 50–100 g) were collected from average-sized branches and brought to the laboratory for moisture content analysis. The roots were excavated manually, weighed using a crane, and washed with a high-pressure water pump to remove all soil particles. The roots were classified and sampled based on diameter size into the following categories: stump (aboveground and underground parts), undifferentiated parts of coarse roots (diameter greater than 2 cm), and fine roots (diameter less than 2 cm). Fine roots (diameter less than 5 mm) were intentionally excluded from this study. One disc was obtained from the middle of the stump to calculate the dry weight of the belowground parts. The discs with different diameters were collected from coarse roots, and three full-length roots with diameters less than 2 cm were obtained to represent the biomass of small roots. The sum of the biomass of the root sections represented the total belowground dry biomass, and the fresh-to-dry weight ratios were obtained for each section. Thirty-one trees were sampled, with diameters at breast height (DBH) ranging from 5 to 35 cm, and heights ranging from 4 to 22.6 m. The samples (roots, trunks, branches, and leaves) were dried in the laboratory using a high-temperature oven at 105°C until a stable weight was reached. The dry biomass was calculated by multiplying the wet weight of the component by the dry/fresh weight ratio. The total dry weight of trunks, branches, leaves, and roots are summarized in Table 1.
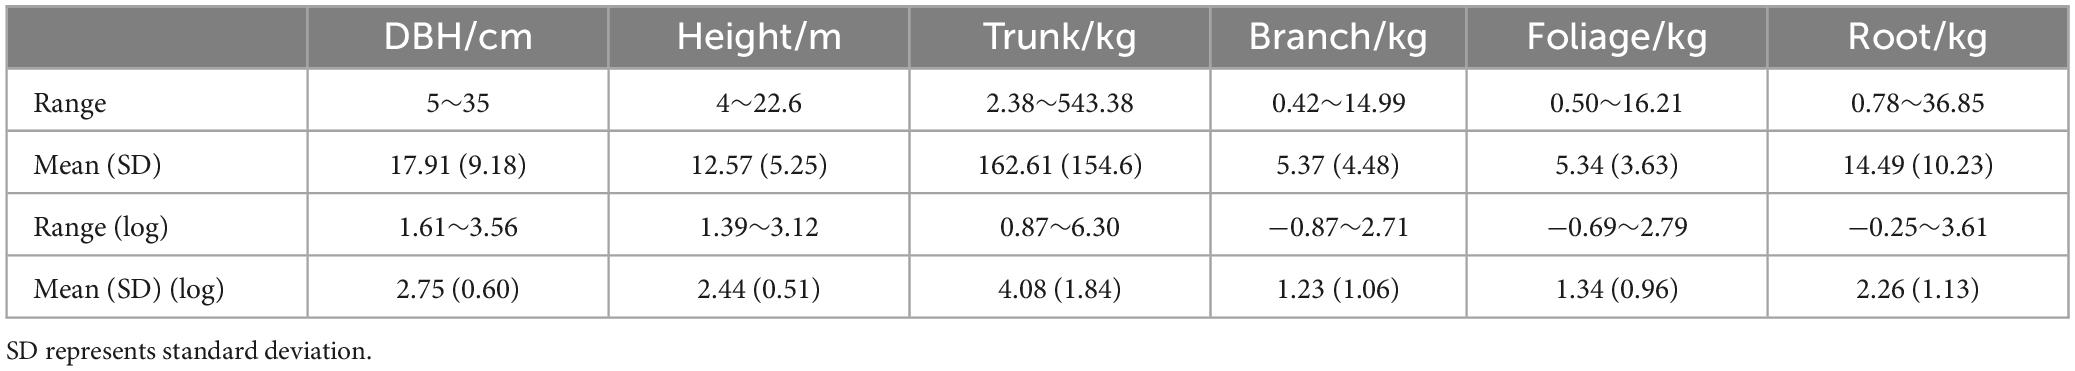
Table 1. Summary statistics of the destructively sampled trees in the Lesser Khingan Mountains.
2.3 Parameter value collection
We collected existing literature (journals, books, and reports) from 1978 to 2022 on biomass equations for P. koraiensis in Northeast China. We used keywords with logical operators (P. koraiensis, biomass, allometry, relationships, equations, models, and functions) to search the National Library of China (National Digital Library of China and China Forestry Digital Library), online literature databases (Web of Science, China National Knowledge Infrastructure, and China Science and Technology Journal Database), ecological data papers (Luo et al., 2020), as shown in “Supplementary Table 1.” We conducted an in-depth analysis of the literature to obtain reliable biomass equations and used the following criteria:
1. The search scope was only for equations applicable to forest-grown trees and open-grown trees.
2. The data for establishing biomass equations were based on at least three sample trees that were harvested and weighed to determine the tree biomass and its components (such as trunk, branches, leaves, and roots), although the number of tree components depended on the research objectives.
3. The biomass equations considered in the study were examined. Biomass equations meeting the above criteria were compiled and organized into the P. koraiensis Biomass Equation Dataset “Supplementary Table 1.” It consisted of a general table and an equation table. The former contained background information on the equations, including geographical location (e.g., latitude, longitude, and altitude), climate [mean annual temperature (MAT) and mean annual precipitation (MAP)], and stand description (e.g., forest type, dominant tree species, stand origin, stand age, and tree spacing). The latter included details, such as tree components for developing the biomass equations, predictor variables, equation form, coefficients, goodness-of-fit statistics (e.g., correlation coefficient and determination coefficient), and applicability range (i.e., methods and ranges of predictor variable values).
2.4 Methods
Bayesian methods are statistical frameworks that use prior information on parameter values to derive probabilities. By modeling observed data and unobserved variables, the Bayesian approaches provide a cohesive framework for combining data models and external knowledge.
2.4.1 Biomass model
We modeled the dry weight (W, kg) of different tree components (trunks, branches, leaves, and roots) as a function of height (H, m) and DBH (D, cm). Furthermore, we used logarithmic transformations to address heteroscedasticity (Refer to Equations 1, 2).
Where α = lna and b represent the parameters of the model, and e denotes the error term, which follows a normal distribution with a mean of zero and a variance of σ2. Classical methods to estimate the parameters include maximum likelihood estimation (MLE) and minimum least squares (MLS). The latter was used in this study to compare with the proposed Bayesian approach. The optimal intercept and slope are obtained by minimizing the sum of squared residuals between the observed and predicted values.
2.4.2 Bayesian rule
The Bayesian framework uses probability distributions to account for the uncertainty of the estimated parameters (Koricheva et al., 2013; LeBauer et al., 2013). Based on the observed data, θ has the following probability distribution (See Equation 3):
We focus on the posterior probability distribution (abbreviated as posterior) of θ given the observed data y(p(θ|y)). The likelihood function p(y|θ) describes the distribution of y given the value of θ (Edwards, 1996). The prior probability distribution of the parameters, p(θ), is commonly referred to as the prior. It reflects the assumptions of the model. A distinguishing characteristic of Bayesian method is the treatment of parameters as random variables (Ellison, 2004; Li et al., 2012) in contrast to classical methods that assume the parameters to be true and fixed quantities (if unknown) (De Valpine and Hastings, 2002). In this study, the statistical model describes the relationship between the biomass of the different components (trunks, branches, leaves, and roots), denoted as W, and the variables D and H (See Equations 4, 5):
2.4.3 Prior distribution
The choice of prior distributions is critical in Bayesian methods (De Valpine and Hastings, 2002). However, many researchers have chosen uninformative normal (Gaussian) priors with large or infinite variances disregarding any prior information that could potentially influence the parameters. Alternatively, if prior knowledge is available from external sources (e.g., parameters reported in the literature), this information can be utilized to construct informative prior distributions. In this study, we compared the predictions between models fit with an uninformative prior distribution versus an informative prior distribution. The prior Gaussian (normal) distributions of the uninformative priors for parameters α and b are αN(0, 1,000) and bN(0, 1,000).
For the models employing informative priors, we assume that α and b follow a bivariate normal distribution N(μ,Σ). The mean vector μ represents the central tendency of the data for each variable. It is typically calculated as the average of the observed values. For a bivariate normal distribution involving two variables α and b (See Equation 6):
Where μα and μb are the sample means of α and b, respectively.
The covariance matrix Σ captures the variance within each variable and the covariance between them. It is calculated based on the deviations of each variable from their respective means. For two variables α and b, the covariance matrix is Equation 7:
Where and are the variances of α and b, and σαb is the covariance between α and b. In this study, we chose not to employ a formal meta-analysis approach to construct the priors for our model. Many of the studies we synthesized did not report all necessary statistics comprehensively. This lack of complete data can lead to biases if not appropriately handled. While hierarchical meta-analysis models that incorporate missing data models can address these concerns (Koricheva et al., 2013; LeBauer et al., 2013), they require making conservative assumptions about the missing information. These assumptions, although helpful, may introduce uncertainty. Additionally, a hierarchical meta-analysis model is computationally intensive and requires substantial expertise and resources. Given our project’s scope and the availability of resources, we opted for a more direct approach using well-established empirical data from a foundational study (Gelman et al., 1995). A total of 298 biomass models were synthesized using data from the literature for the trunks, branches, leaves, and roots of P. koraiensis. The data are summarized in the document “Supplementary Table 1.” We performed correlation coefficient calculation, Shapiro–Wilk test, and bivariate normality test on the collected parameters using the cor, Shapiro test, and mvn functions in R, respectively.
Additionally, we assumed that the errors followed a normal distribution e ∼ N(0,σ2). Following Hadfield (2010), we used the scalar parameter for the prior of the errors, which follows an inverse Gamma distribution. The scalar and shape were equal to 0.0005.
2.4.4 Model fit and convergence assessment
The parameters in the linear Gaussian models were estimated using a Bayesian framework implemented in the R package MCMCglmm. Gibbs sampling (Chib and Greenberg, 1995) was employed to update the parameters iteratively. We performed 25,000 iterations for each model to ensure convergence and accurate estimation of the posterior distribution. The initial 5,000 iterations were discarded as burn-in to eliminate potential bias from the initial state of the chains. Additionally, we retained every second value in the posterior chains to reduce autocorrelation between consecutive iterations. For each model, we generated one MCMC chain and performed 25,000 iterations to ensure convergence and accurate estimation of the posterior distribution.
To evaluate convergence, we visualized the posterior samples using trace plots and employed Geweke (1991) convergence diagnostic on the model outputs. The results are shown in the Supplementary Information. All z-scores obtained from Geweke’s diagnostic were smaller than 1.96, indicating satisfactory convergence. Supplementary Table 2 and Supplementary Images 1–4 indicate the convergence of the MCMC chains.
2.4.5 Model evaluation
The evaluation metrics included the mean absolute deviation (MAD), mean deviation (MD), root mean square error (RMSE), model efficiency (MEF), and model bias (). MEF represents the proportion of total variance explained by the model, considering the number of parameters and observations (Soares and Tomé, 2007; Hevia Cabal et al., 2013). A value of 1.0 indicates a perfect fit, while a value of 0.0 suggests that the model performs no better than average. Negative values indicate poor model performance (Soares and Tomé, 2007). Model bias measures the systemic deviation between the model predictions and observed data. Smaller values indicate better model performance for the remaining criteria (See Equations 8–12).
Where yi represents the observed value of the biomass of the ith tree, represents the predicted value, is the mean value of the observed values, n represents the number of observed values, and k is the number of parameters.
To compare posterior estimates derived from our proposed Bayesian models, we computed the absolute difference and absolute percentage difference in the means and standard deviations using the following Equations 13–16:
Where and are the posterior means for the models employing a non-informative and an informative prior, respectively, while and are the standard deviations of the posterior distributions.
3 Results
3.1 Prior distribution of the parameters
A total of 298 biomass models for each component were compiled from the literature. Multiple models were available for some sites, and most models were derived from areas in northeastern China (Figure 1). The data indicates that the average ranges of the collected model parameters α and b are as follows: −5.5274 to −2.7086 and 0.6987 to −2.3875, respectively (Table 2). Within the same model, the average values of parameter α for both the tree trunk and tree leaf exceed those of the tree branch and root. However, in terms of parameter b, the maximum value is associated with the root, while the minimum value is observed for the leaf. The estimates for parameters α and b in collected biomass models sharing the same predictor and response variables were normally distributed and negatively correlated (Figure 2 and Supplementary Table 2). Bivariate normality tests further confirmed that they followed a bivariate normal distribution (Supplementary Table 2). The posterior probability distributions of the information and non-information priors based on Bayesian methods were very similar (Table 3 and Figures 3, 4).
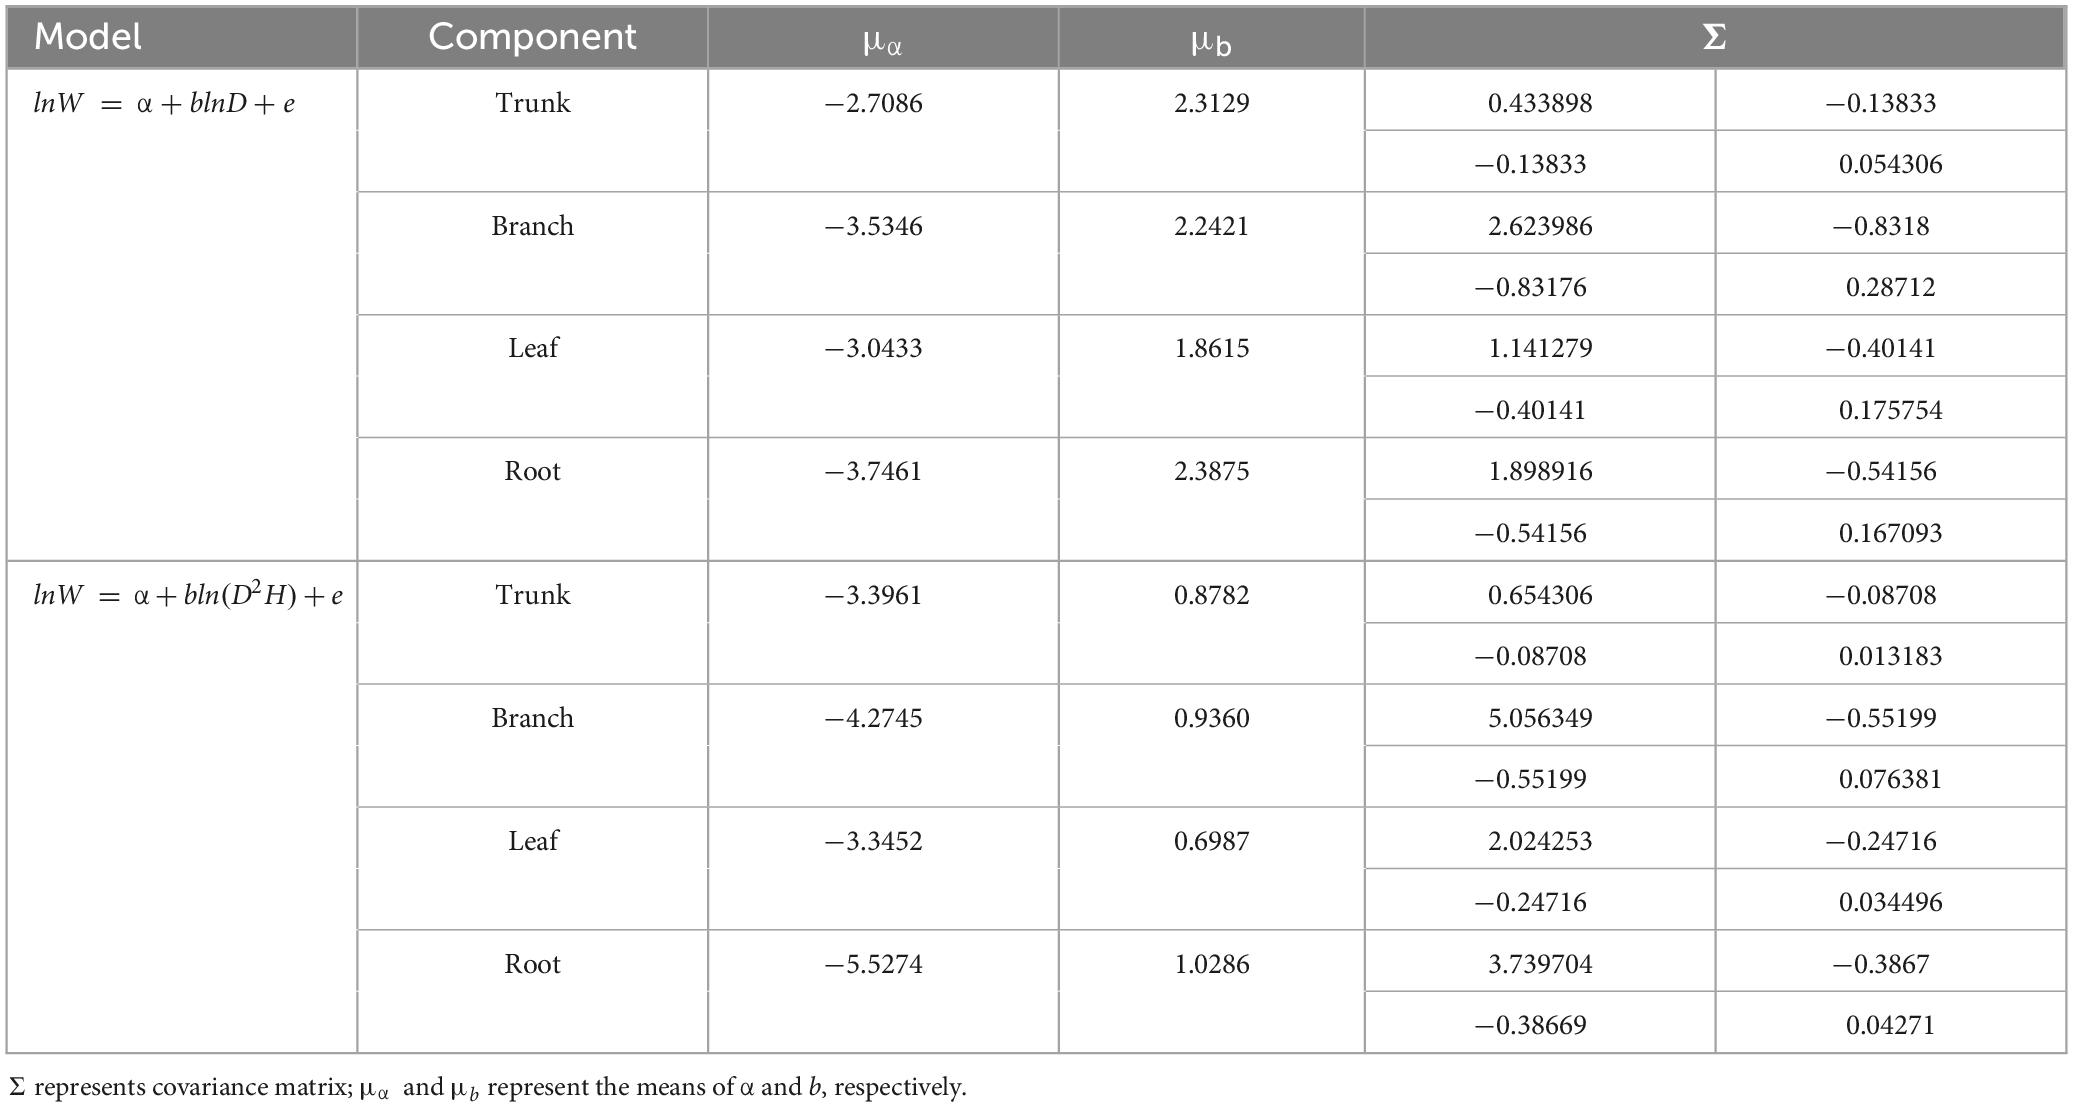
Table 2. The prior distribution of parameters in the component biomass models that were derived from the dataset.
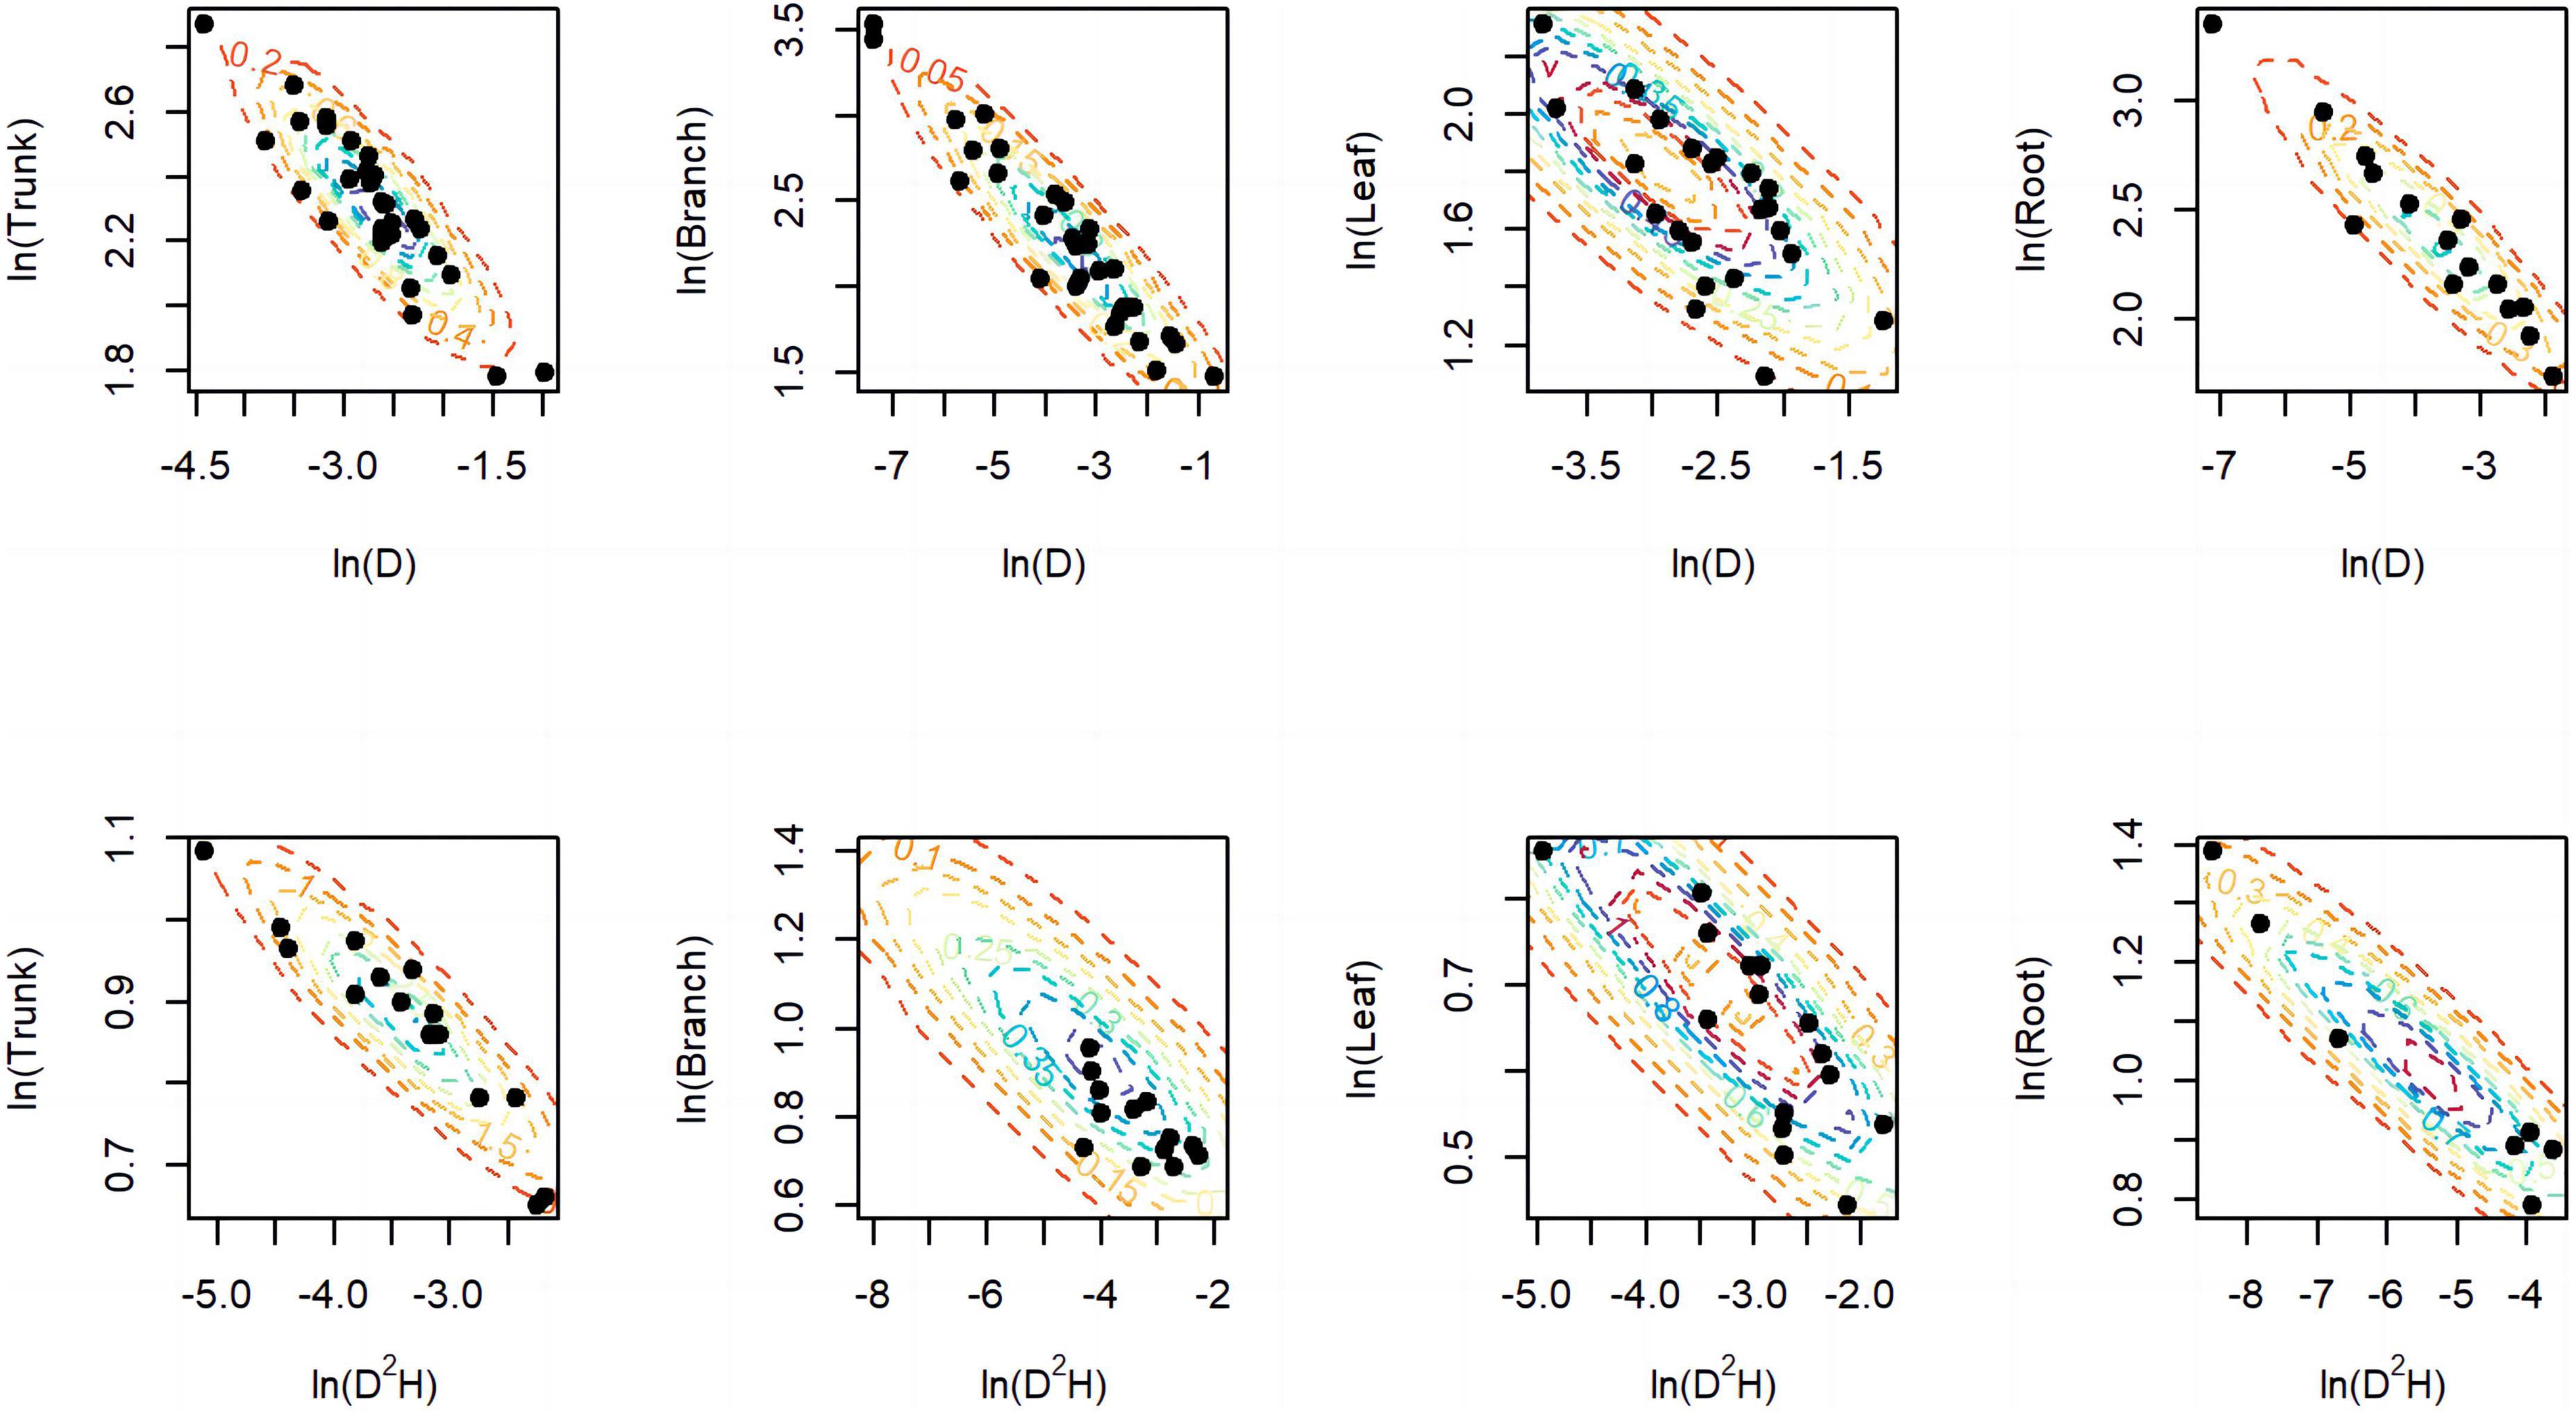
Figure 2. Distribution of parameters α (x-axis) and b (y-axis) for component models. The black dots represent the estimated values in literature, while the dashed lines represent the prior bivariate normal distributions we used for inference in the models.
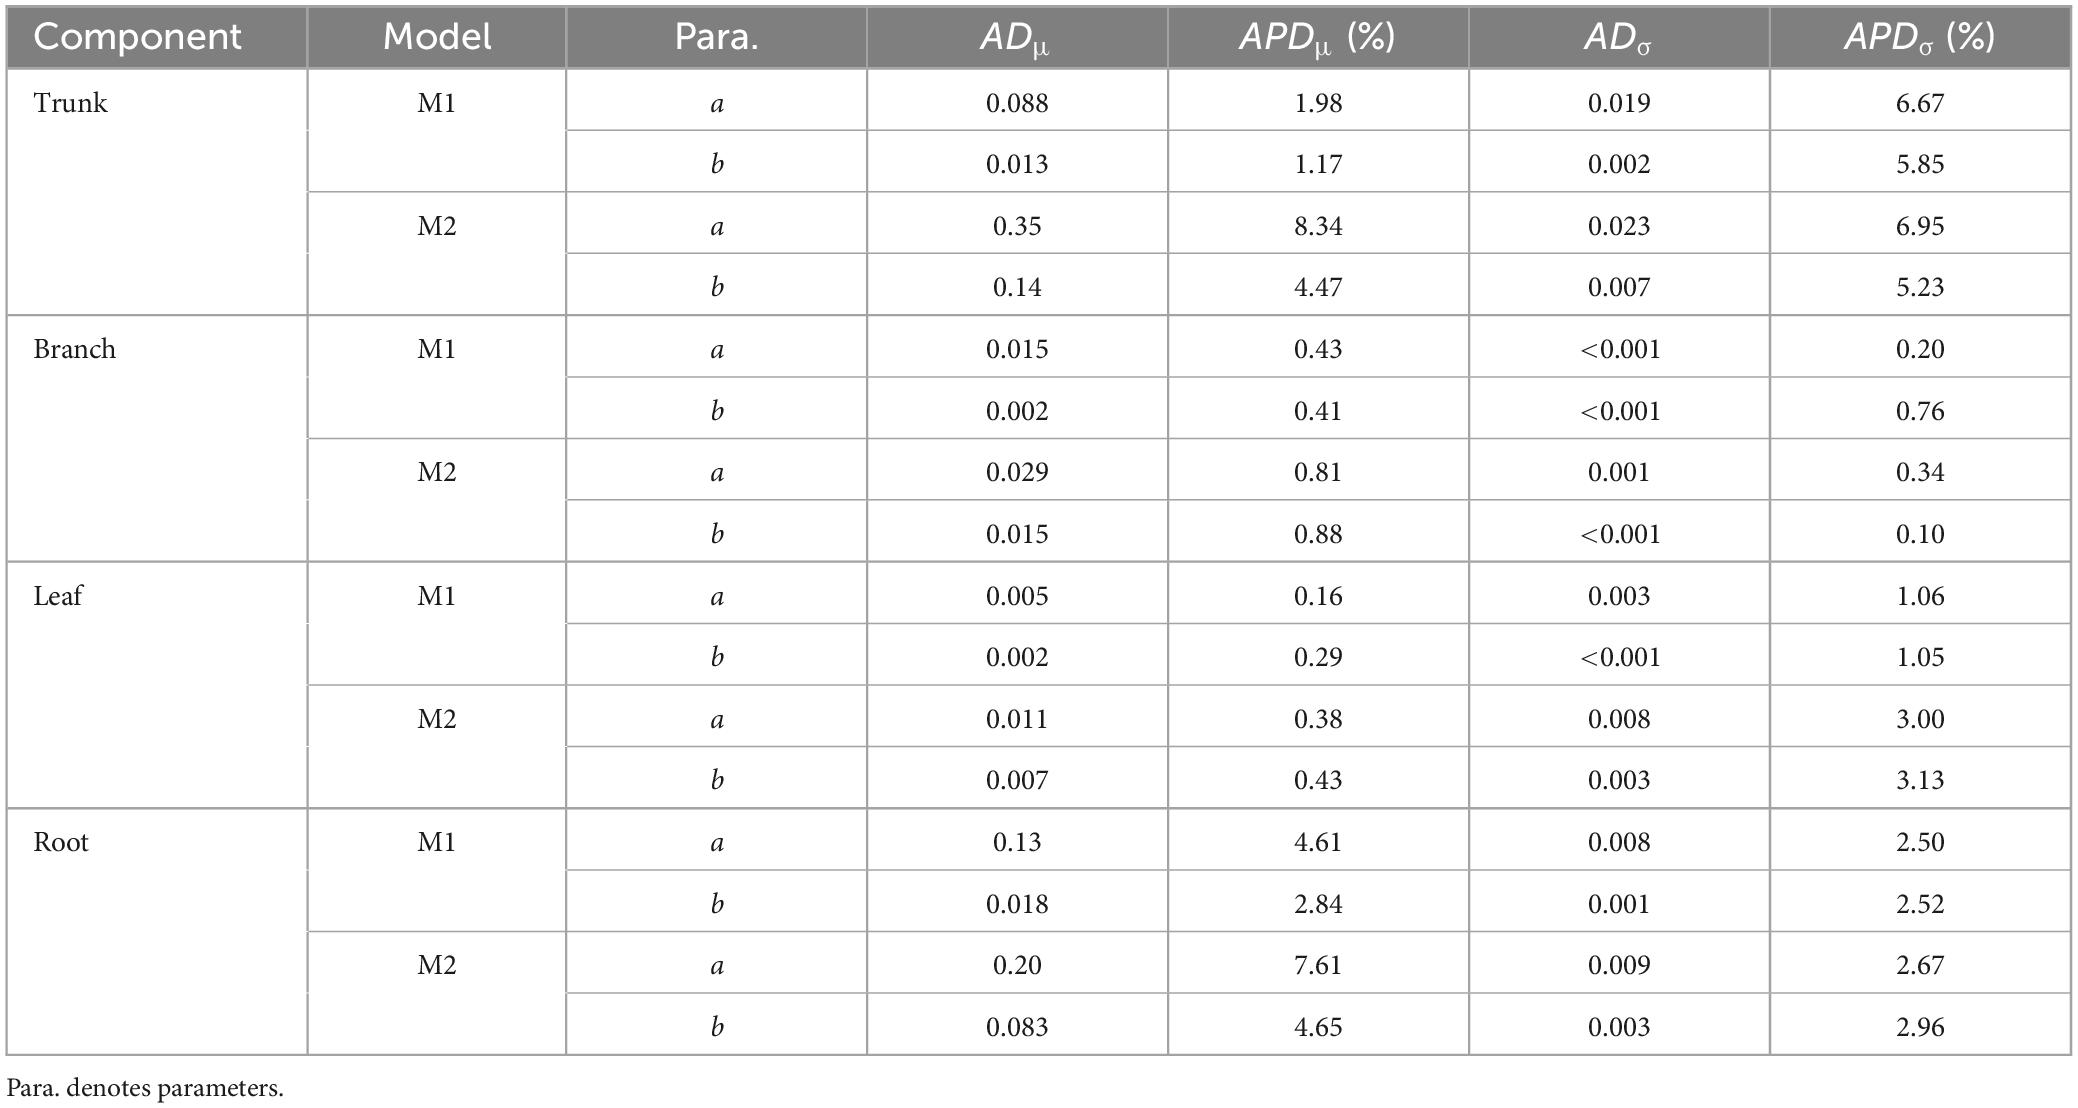
Table 3. The absolute difference and absolute percentage difference (%) in the means and standard deviations for models with different priors.
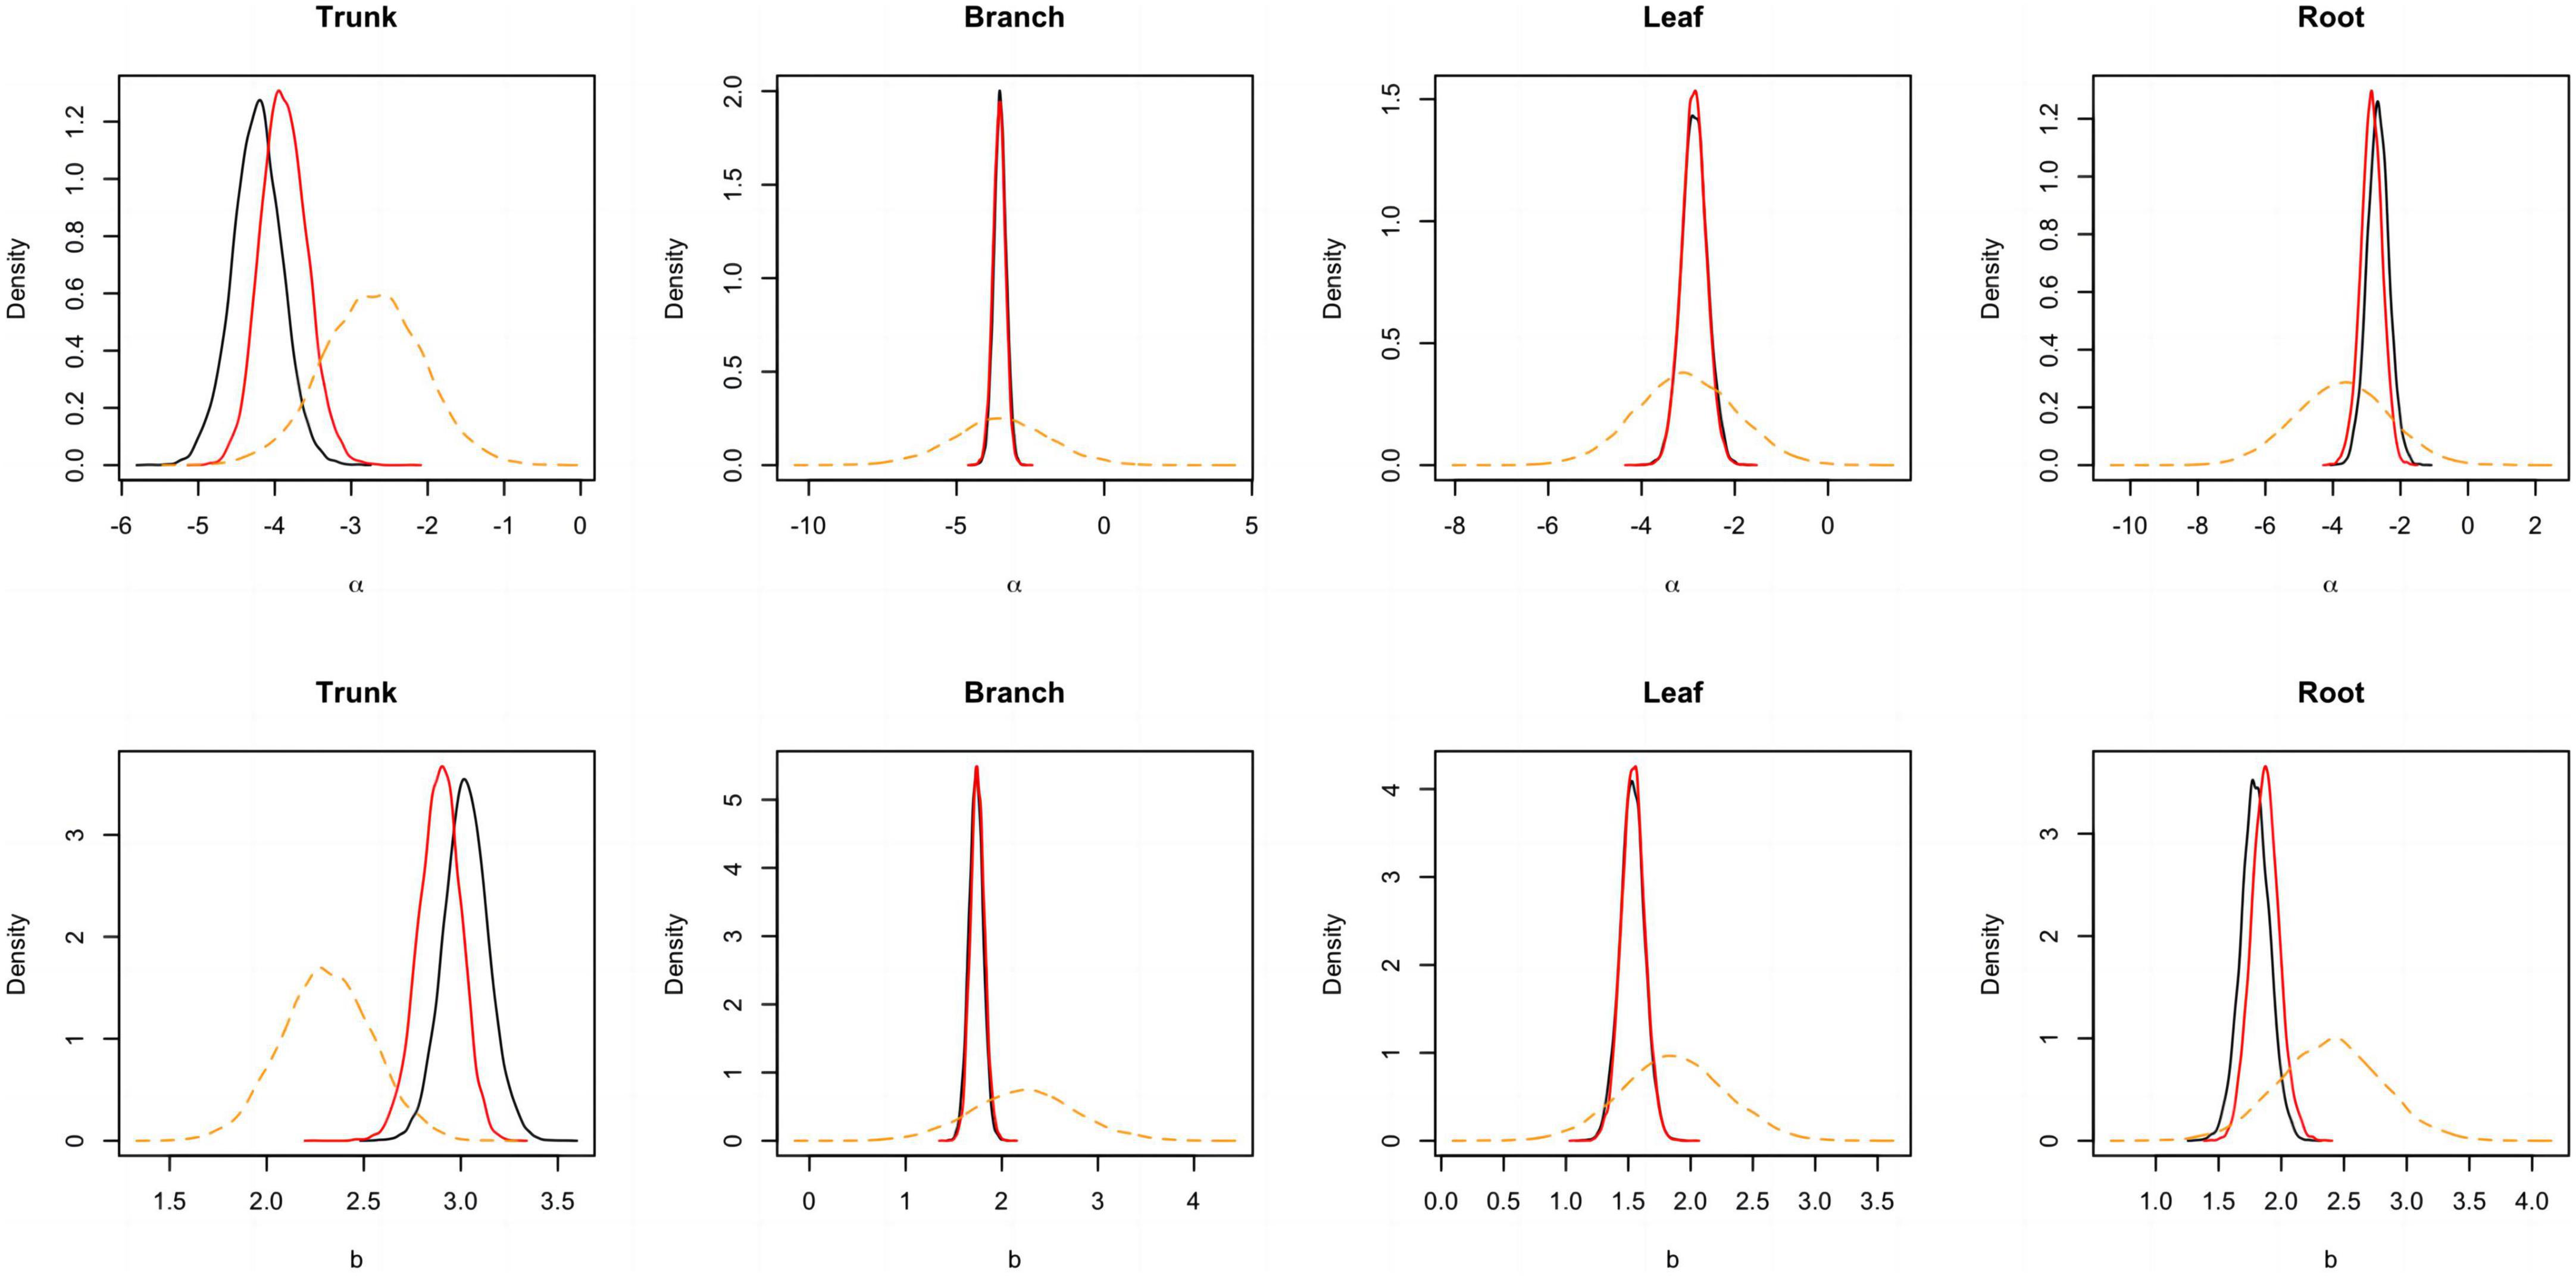
Figure 3. Posterior probability density of two parameters for the component biomass models lnW = α + blnD + e. The black and blue solid lines respectively represent the outputs for the model employing a non-informative and informative prior, while the orange dashed line corresponds to the informative prior.
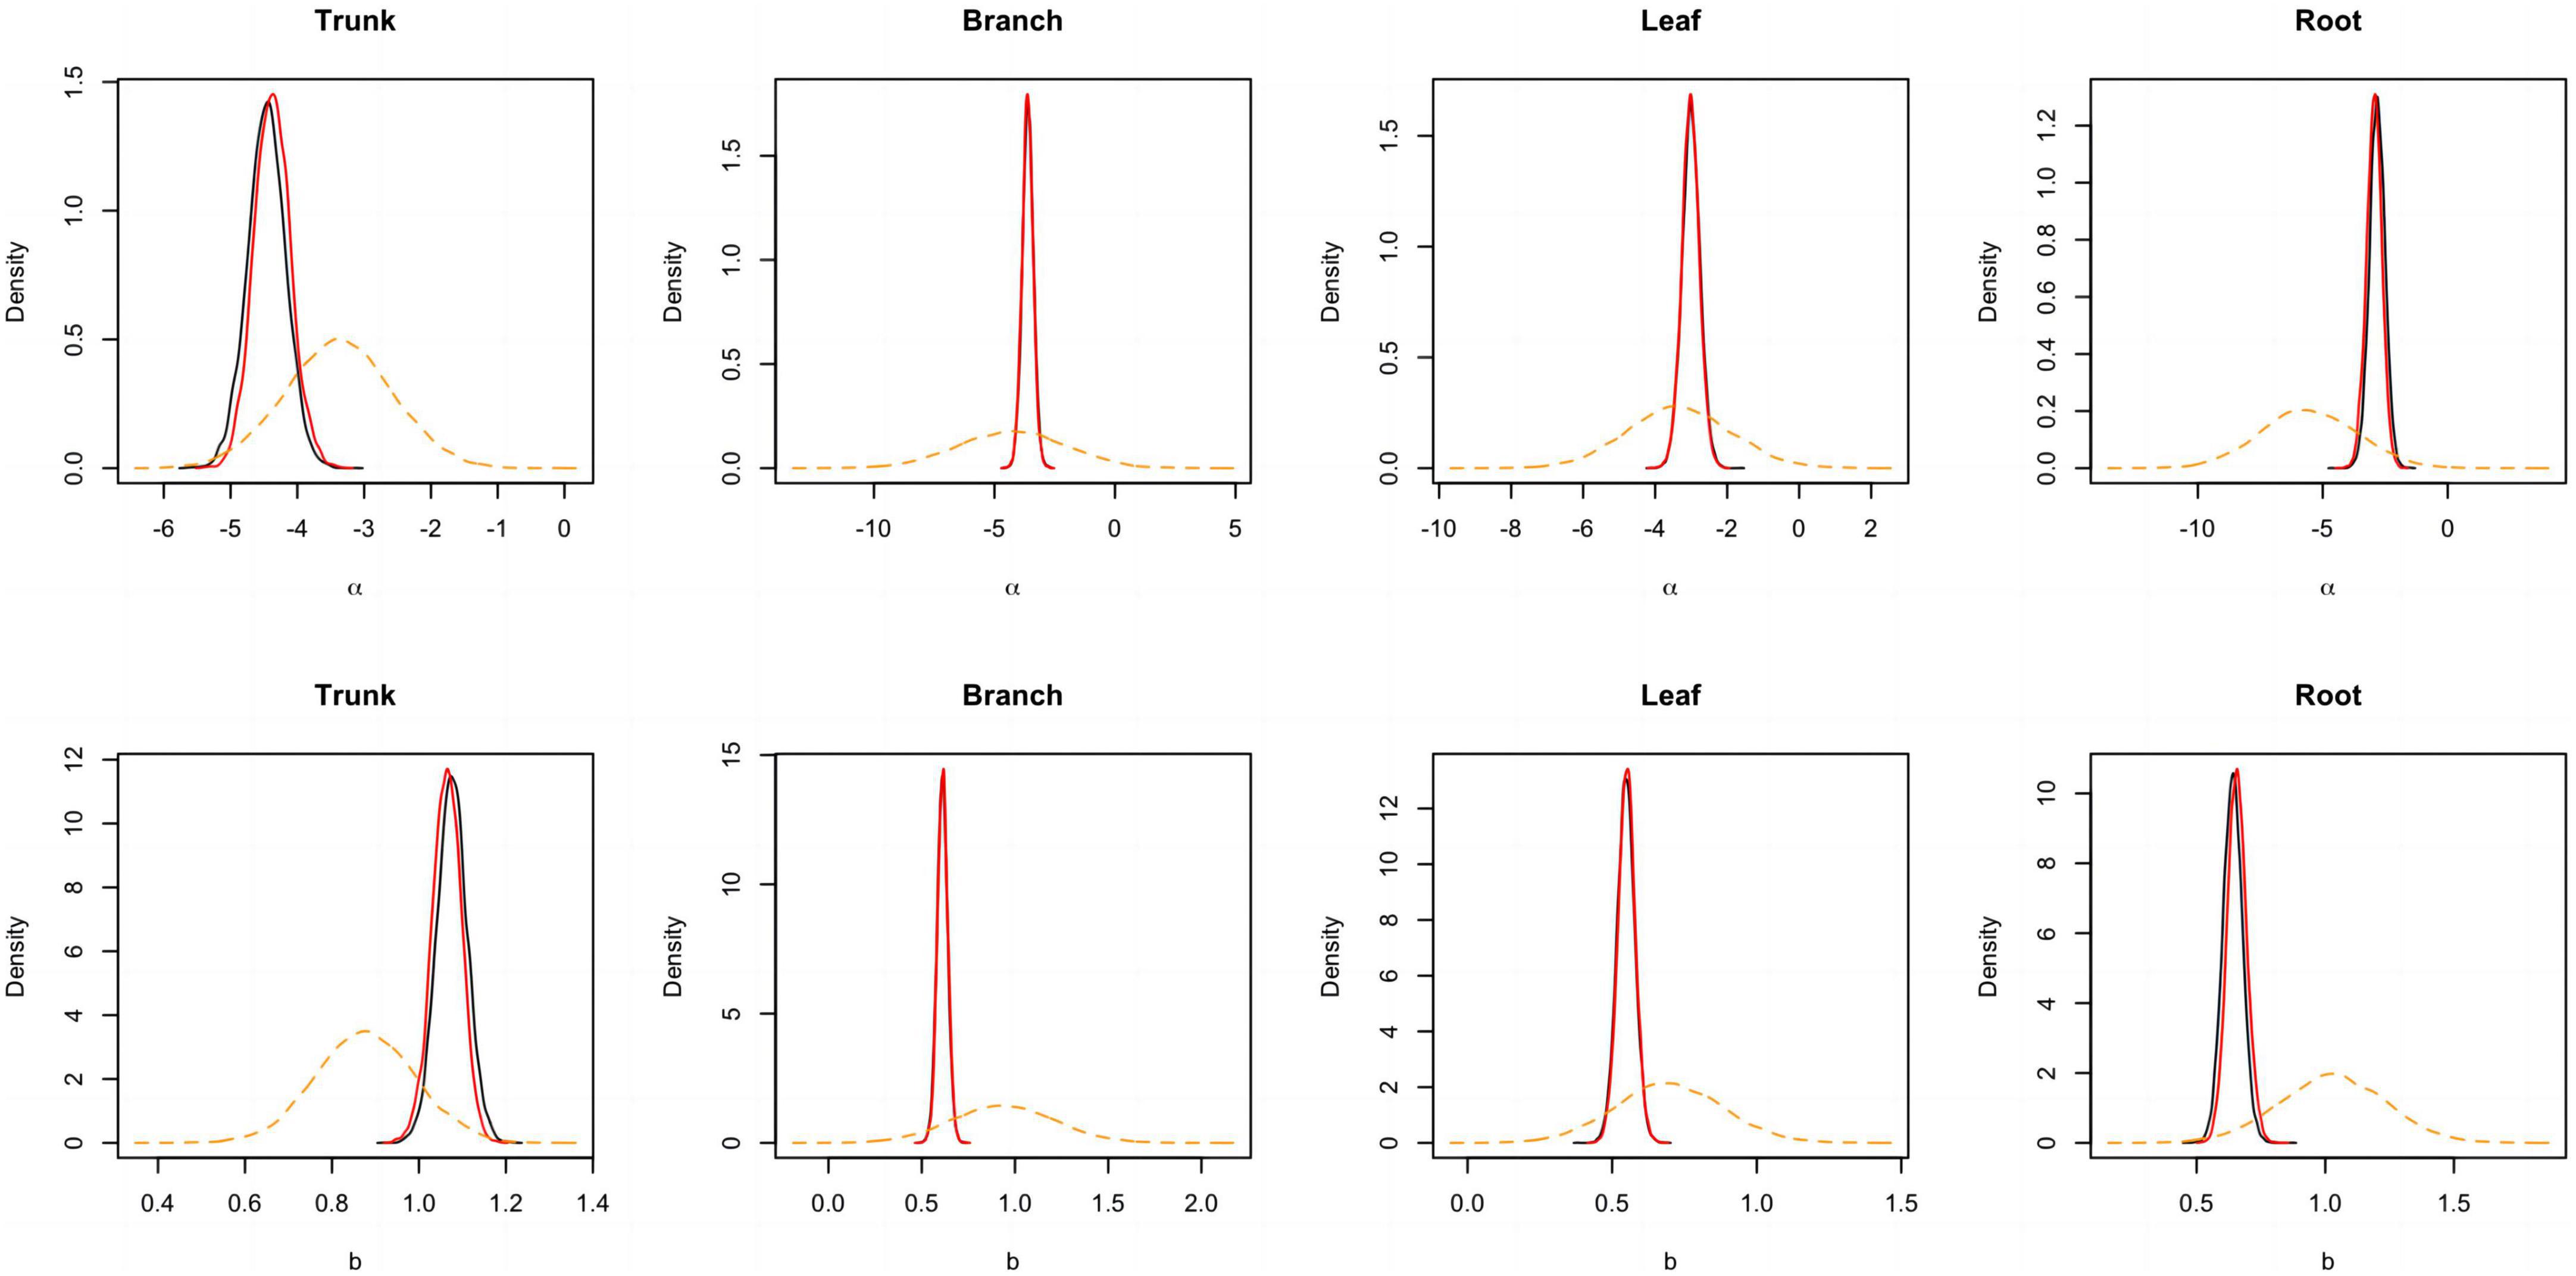
Figure 4. Posterior probability density of two parameters for the component biomass models lnW = α + bln(D2H) + e. The black and blue solid lines respectively represent the outputs for the model employing a non-informative and informative prior, while the orange dashed line corresponds to the informative prior.
3.2 Model parameters
A comparison of the parameters from the same model using the same method showed that the α value of the trunk was the smallest, but the b value was the largest. However, the α and b values of the roots were higher than those of the branches and leaves. For models of the same component, the values of parameters α and b were similar and had similar ranges for the non-information-rich prior and MLS methods. The ranges of parameters α and b were larger for these two methods than for the informative prior method (see Table 4). The analysis of variance revealed significant differences between the parameters and zero for each model at the 95% confidence level. The estimated allometric coefficient was higher for M1 than for M2 for the same component model and the same method. Furthermore, comparing the allometric exponents of the same method, it was found that in each component model, the estimated allometric exponent of M1 was higher than that of M2. This result suggests that in the biomass models of each component, the allometric exponent of the model without tree height as a predictor variable (M1) is higher than that of the model with tree height as a predictor variable (M2).
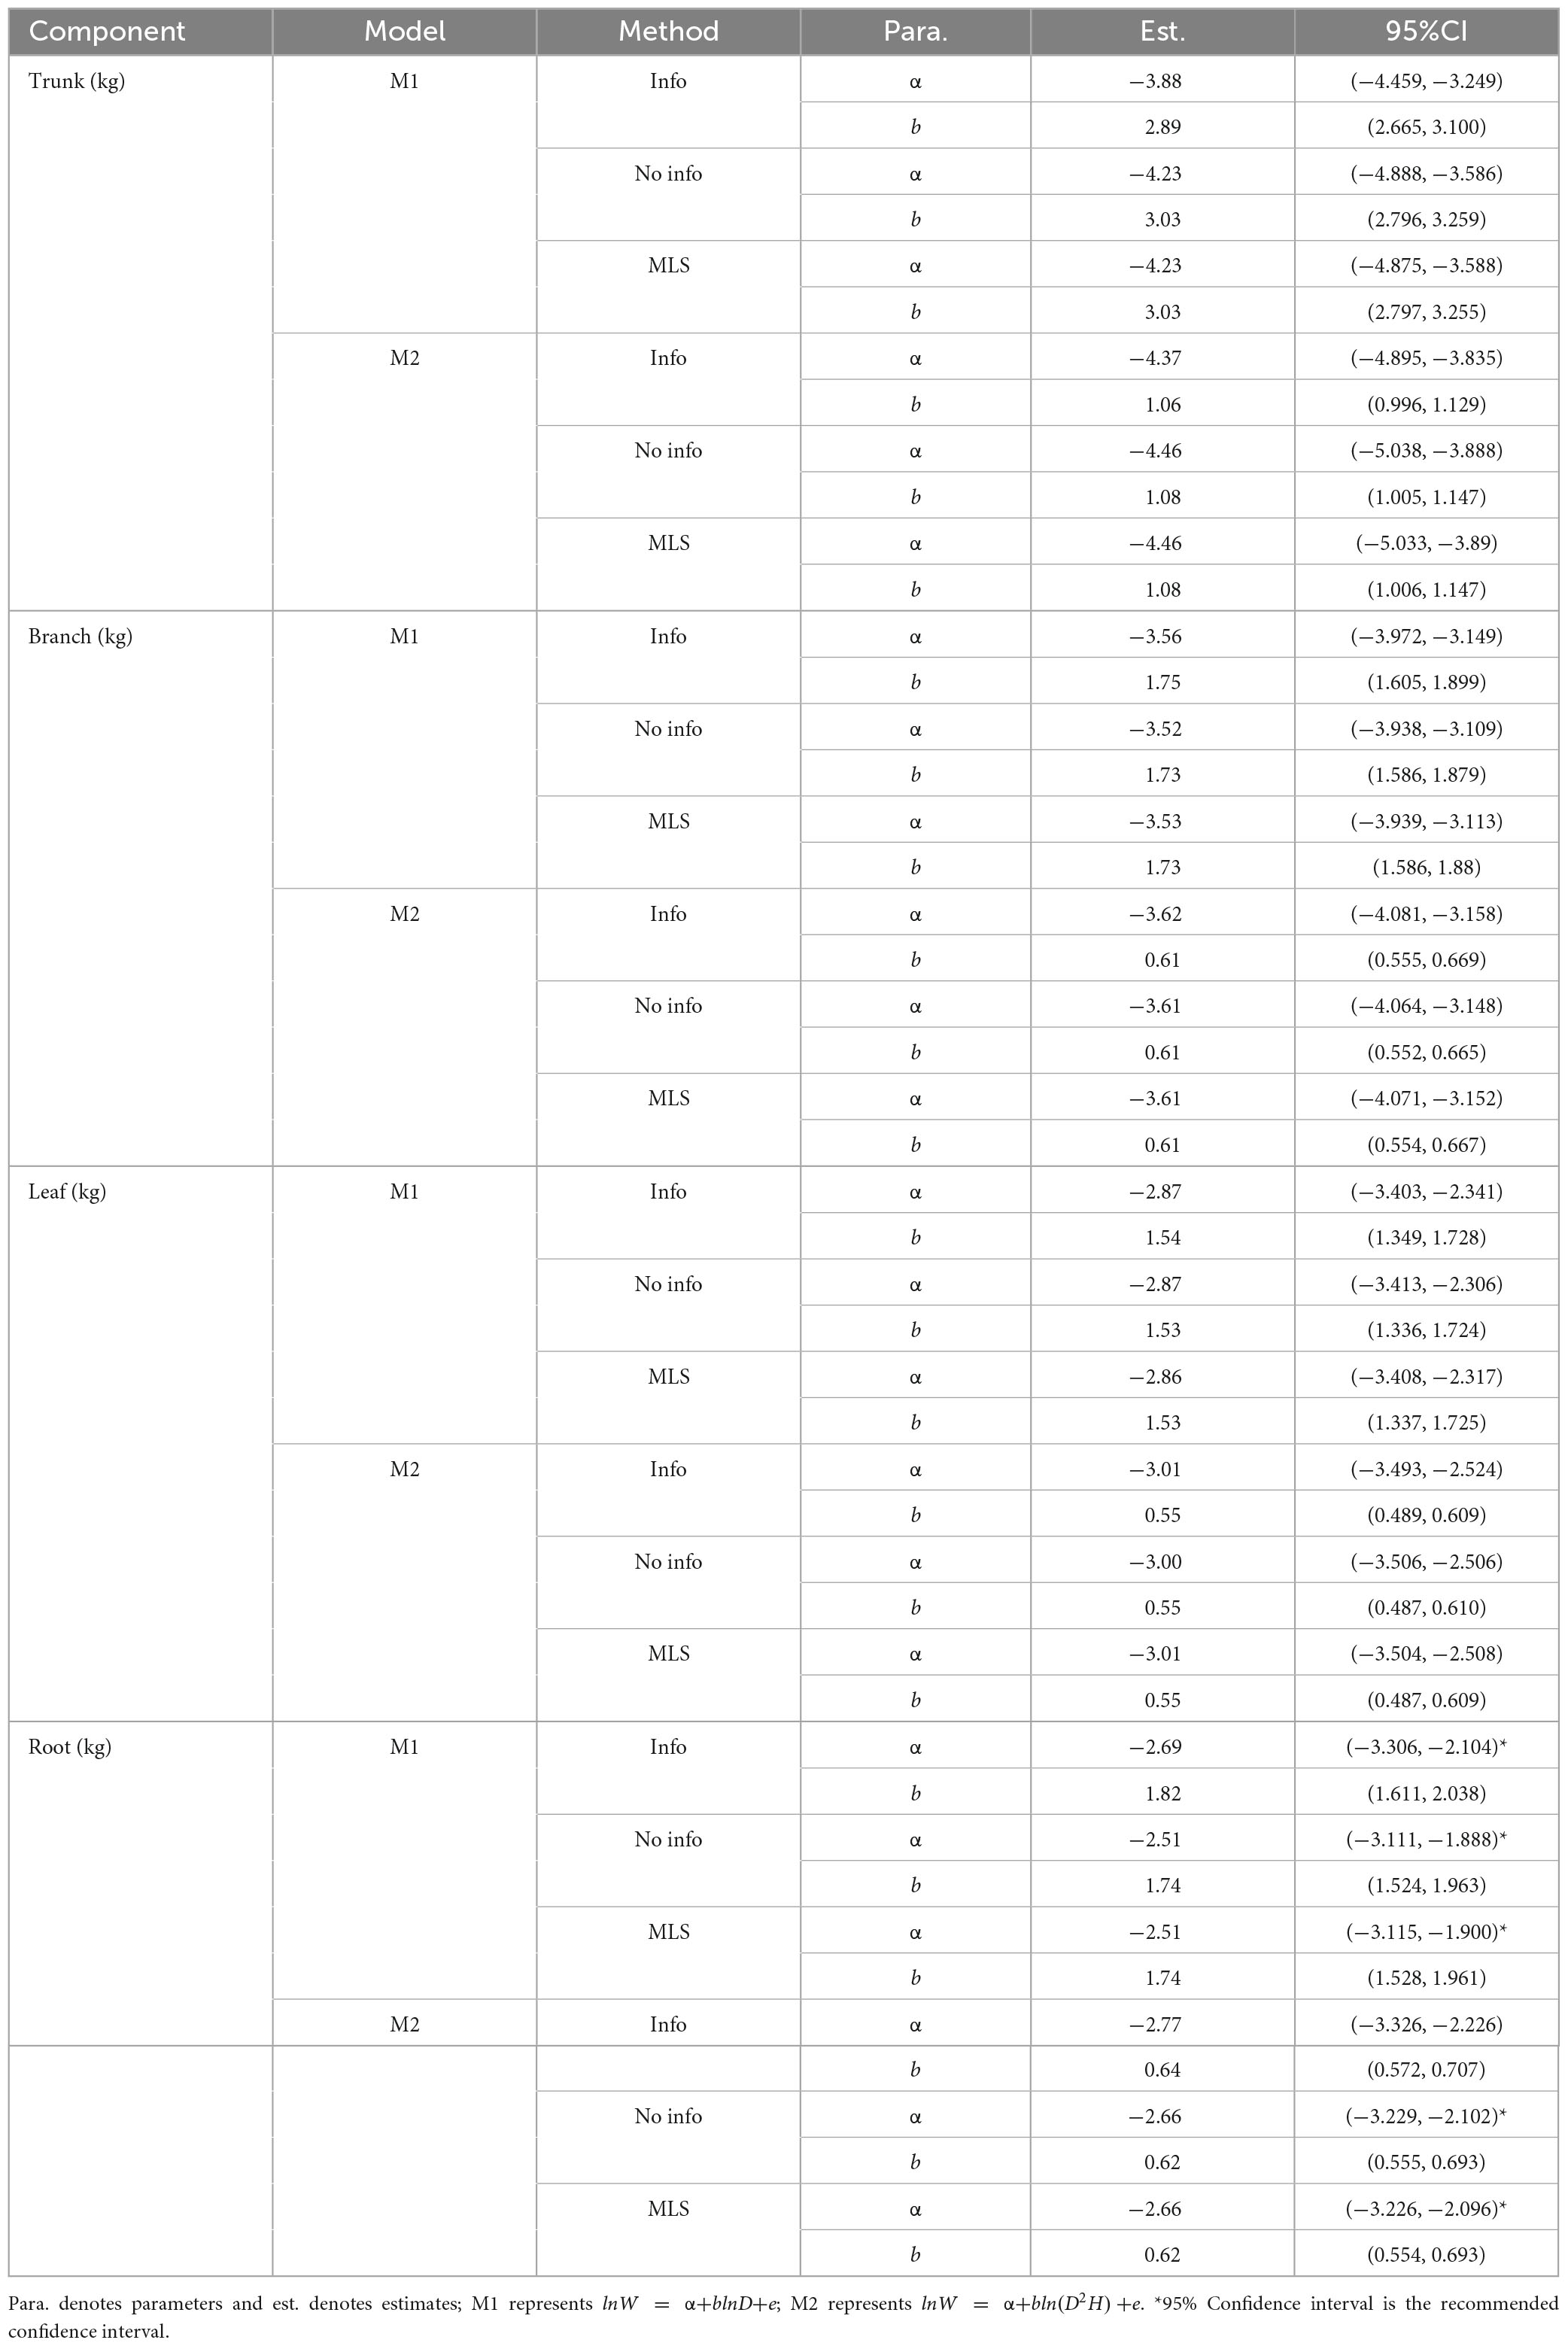
Table 4. Estimates and 95% confidence interval (CI) of model parameters.
3.3 Model evaluation
The model evaluation metrics are listed in Figure 5. Bayesian methods with only prior information (M1 and M2) yielded trunk biomass higher than the predicted values. The differences between the predicted and observed values of trunk biomass were larger than the differences between other biomass components for all methods. However, the deviations were within the 95% interval suggested by Huang and Wang (2003). The MEF was used to assess the degree of model fit. The variance explained by the trunk, branch, and leaf biomass models ranged from 71.40% to 96.75%. The values of all evaluation metrics were similar for the non-information-rich prior and MLS methods. Bayesian methods with an information-rich prior had the largest MEF and the smallest RMSE and MAD for the trunk, branch, and leaf biomass models without tree height. The same results were obtained from the trunk, branch, and leaf biomass models containing tree heights. The Bayesian approach with an informative prior and the tree height predictor had the largest MEF among all trunk biomass models. Conversely, Bayesian methods with an informative prior but without tree height predictors obtained the maximum MEF values among all branch and leaf biomass models, respectively. The MEFs for the tree root biomass models were 4.36%–11.26% higher for models with than without tree height predictors. The MADs and RMSEs were also smaller than those of the tree root biomass models with tree height predictors.
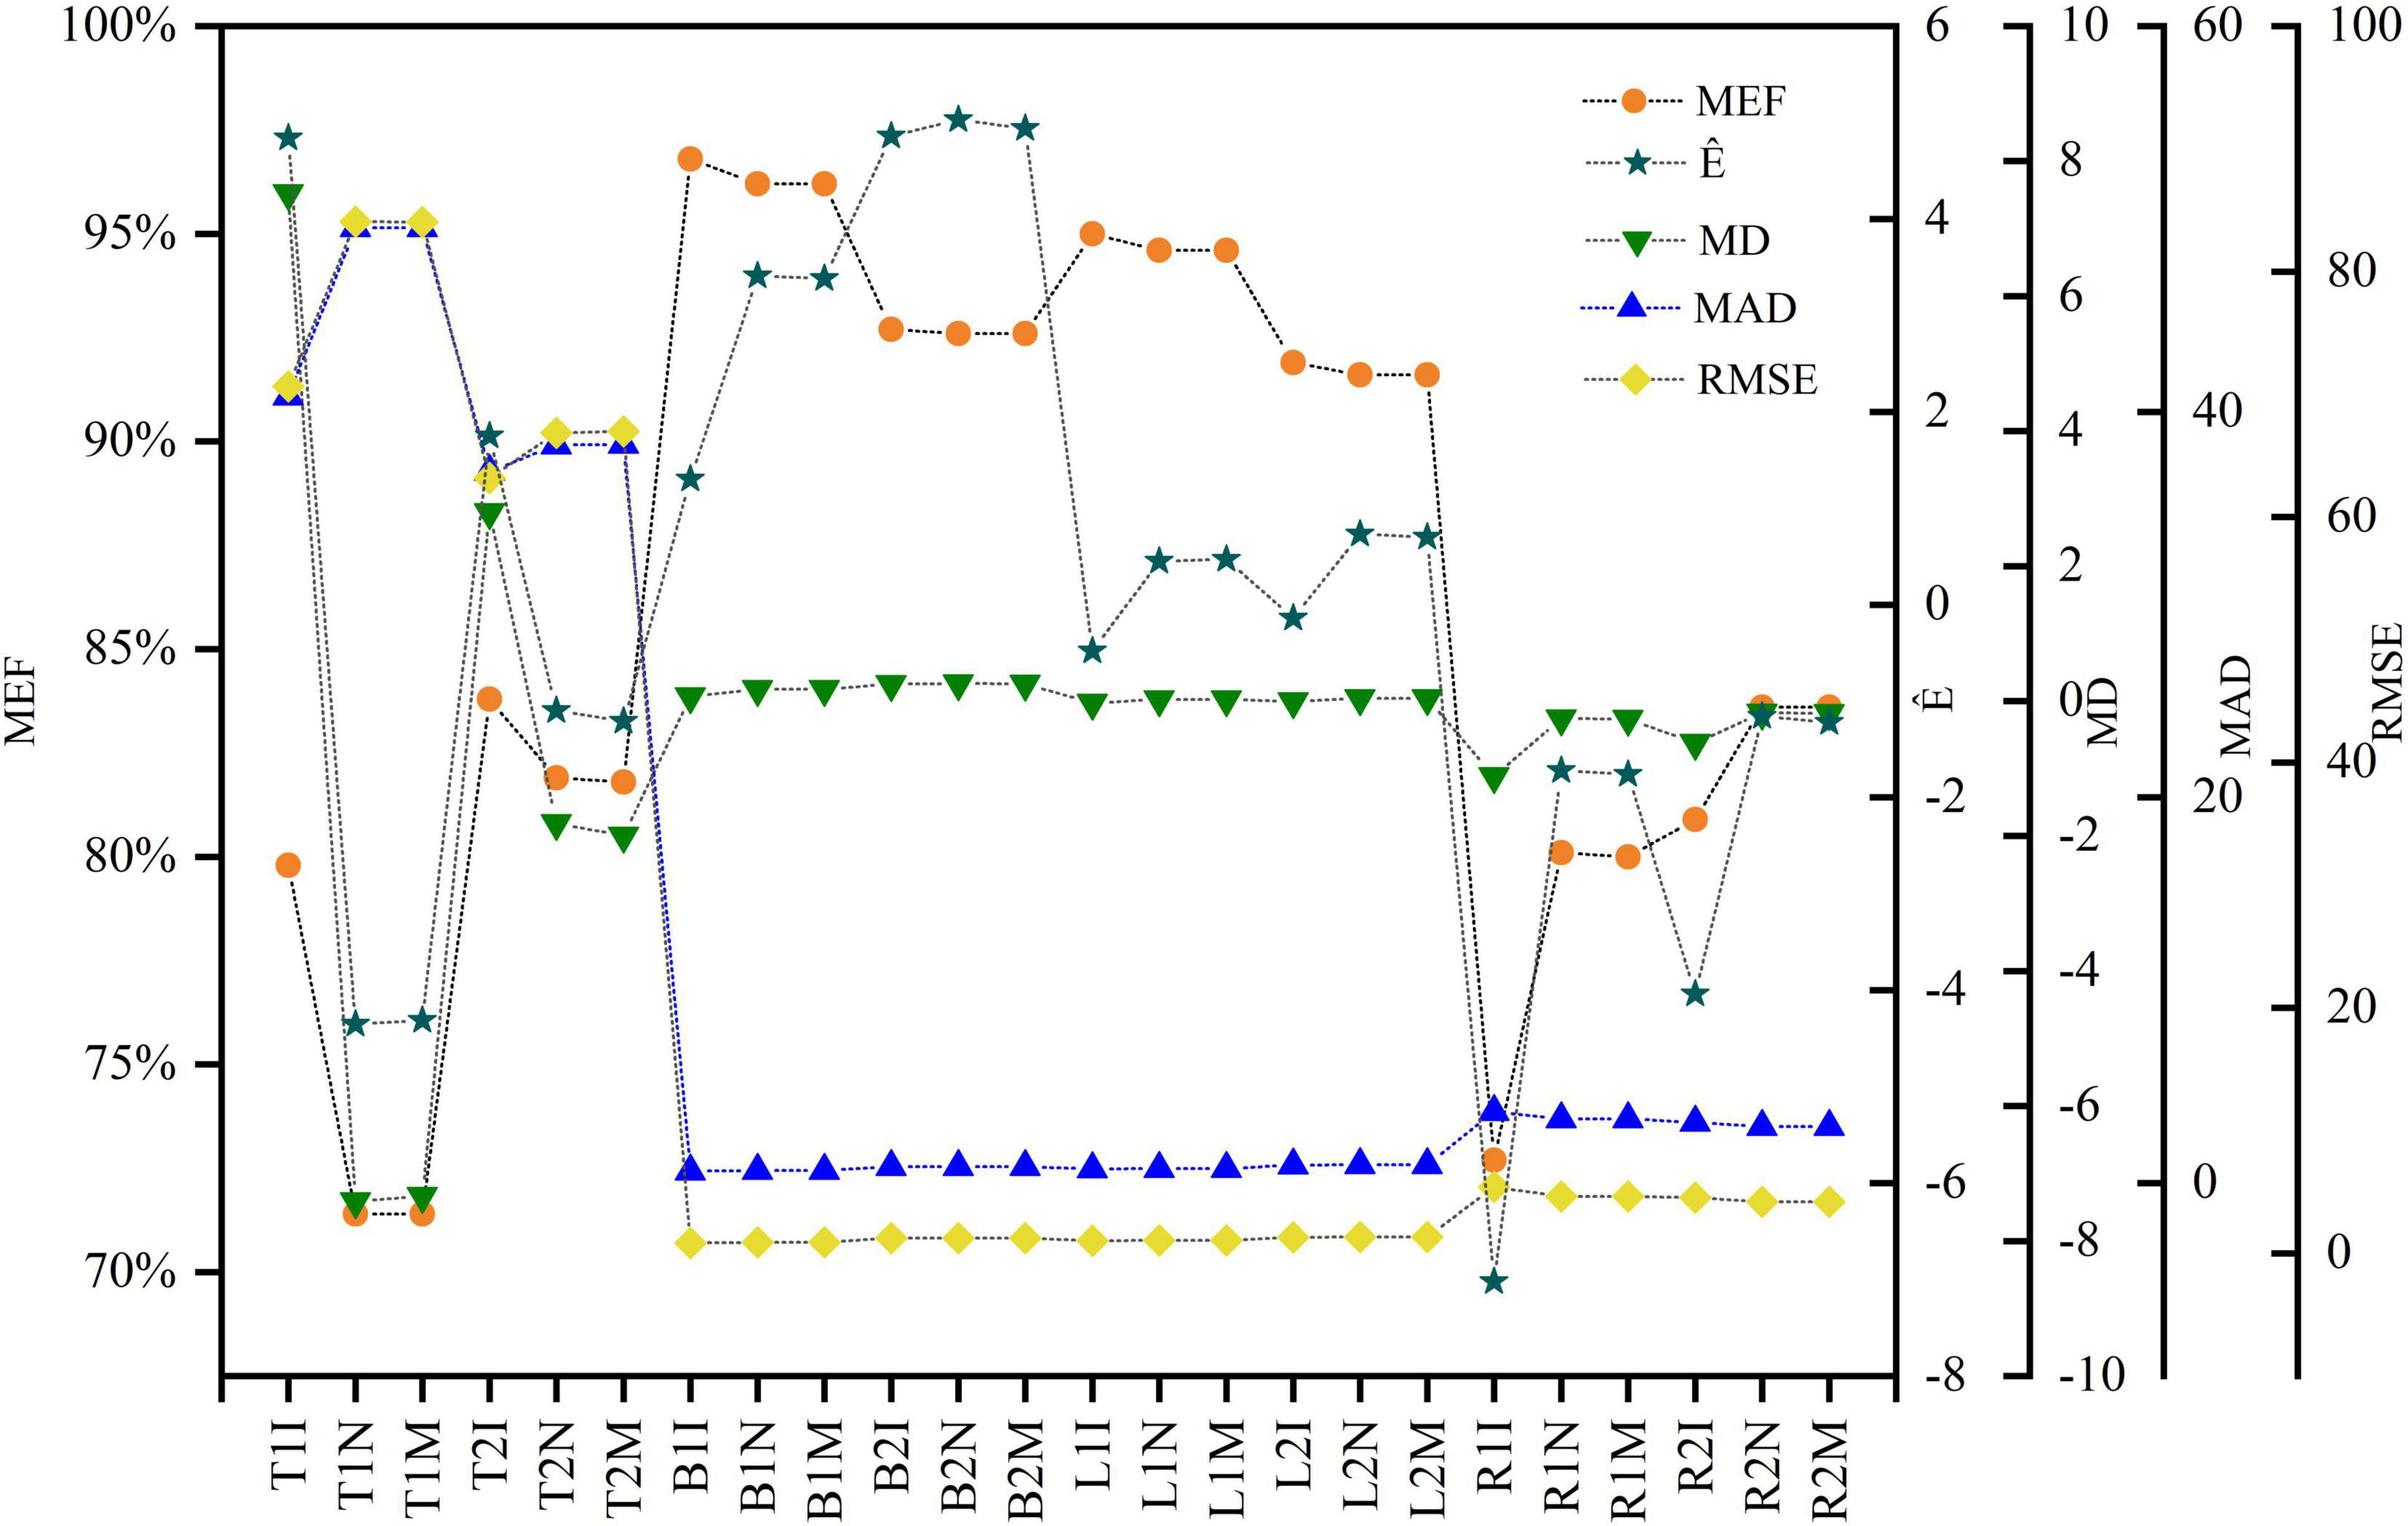
Figure 5. Evaluation indicators for three approaches and the two models for the tree components. The x-axis label uses the acronym for the components, equations and methods. For example, T1I represents the information prior method for the trunk and the M1 equation (lnW = α + blnD + e).
4 Discussion
Parameter estimation is an important error source in biomass models and determines model applicability. The predicted trunk biomass was larger than the actual values when the DBH was less than 13 cm or greater than 25 cm (Figures 6, 7). The predicted branch biomass was lower than the actual values when the DBH was less than 10 cm or greater than 30 cm. Leaf biomass was underestimated when the DBH was greater than 10 cm and less than 25 cm. Similarly, root biomass predictions were underestimated when the DBH was greater than 10 cm and less than 16 cm. These trends indicate an overestimation of biomass for trunk, leaves, and roots at smaller and larger diameters and the opposite trend for branches. However, if the Bayesian prior does not contain information, the Bayesian confidence interval is usually numerically consistent with the classical confidence interval (McCarthy, 2007; Zhang et al., 2013), which was confirmed in this study (see Table 3). A non-informative prior indicates that the data arecrucial in the Bayesian theorem, and the prior probabilities of all plausible parameter values are similar. As a result, the posterior distribution has a similar form to the likelihood function. However, using a noninformative prior leads to a less precise posterior distribution, wider confidence intervals, and worse predictive performance (see Table 3). In this study, allometric growth models for P. koraiensis were established using data from the published literature. It was found that the bivariate normal distribution accurately described the parameter distributions of the allometric growth model. The bivariate normal distribution is typically the prior distribution for estimating tree biomass using a Bayesian model. One of the advantages of Bayesian methods is its capability to incorporate prior information when updating the model. Thus, the samples and the parameters being estimated are considered random variables. Consequently, Bayesian methods generally outperform MLS (see Figure 5).
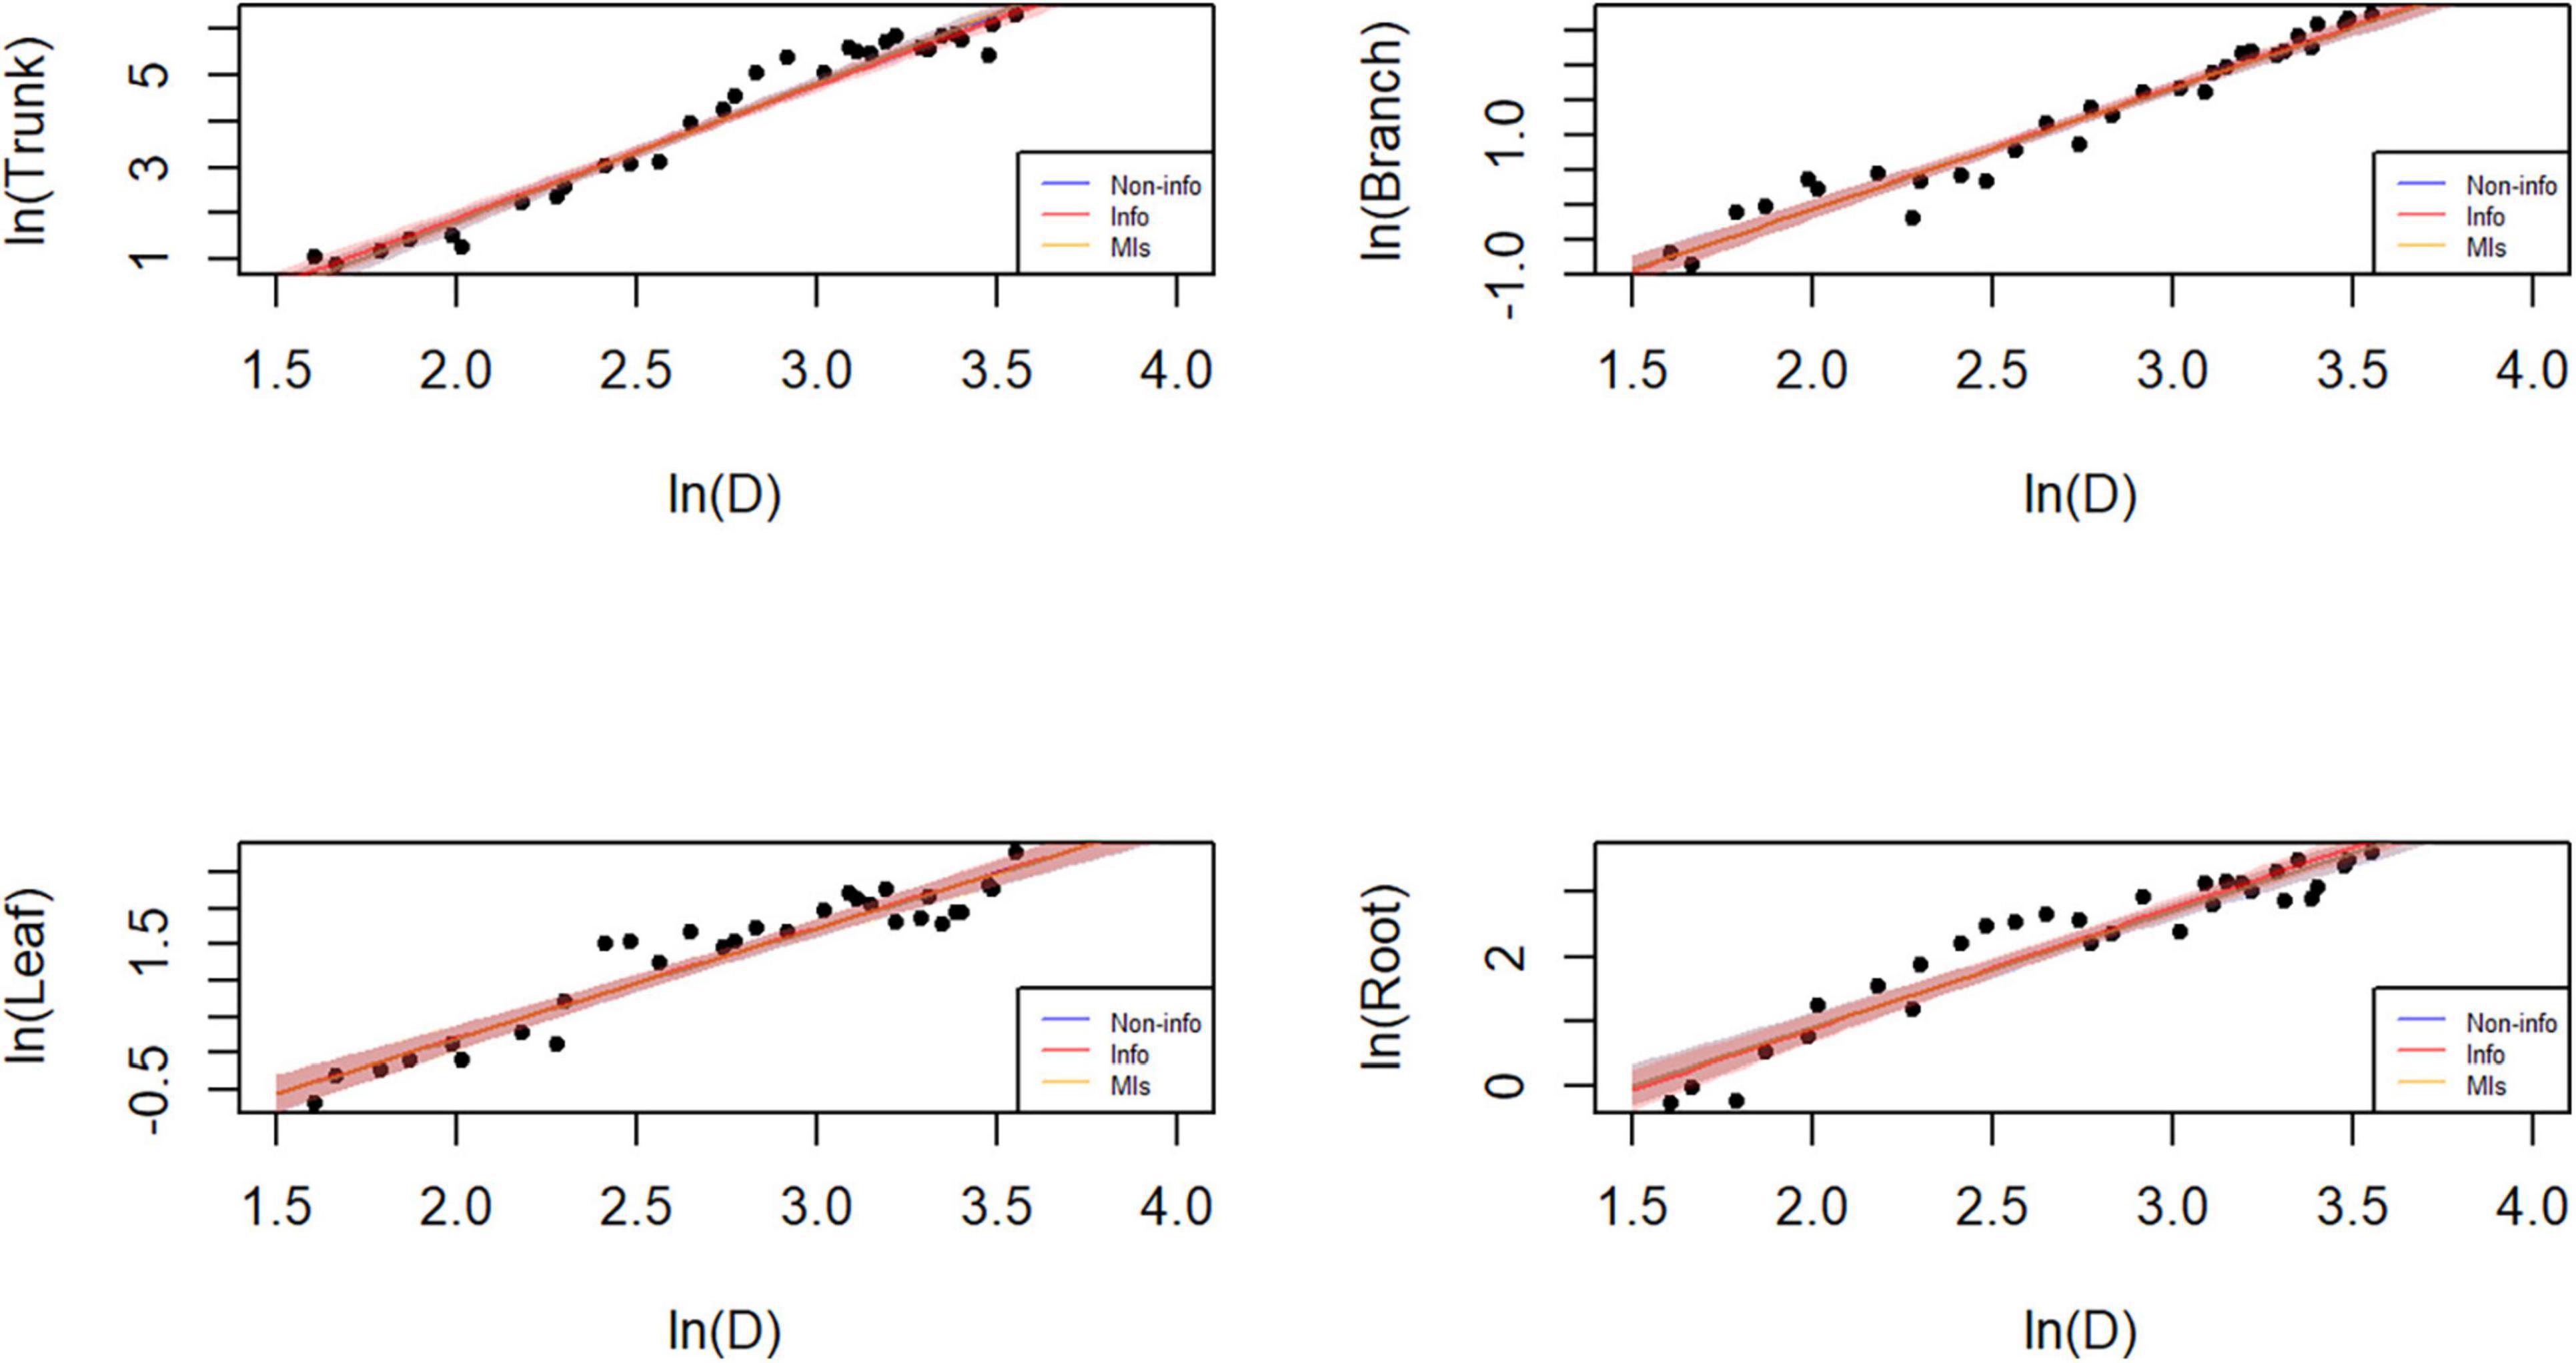
Figure 6. Plot of the data and predictions for each component biomass model lnW = α + blnD + e. Black dots represent the observed data points. Blue, red, and orange shaded areas denote the 95% credible or confidence intervals of the expected biomass using the three different parameter estimation approaches, while the lines correspond to the (posterior) predictive means. Note that both x and y axes are on a logarithmic scale. Note that both x and y axes are on a logarithmic scale, and that the blue and orange lines and shades mostly overlap with the red ones.
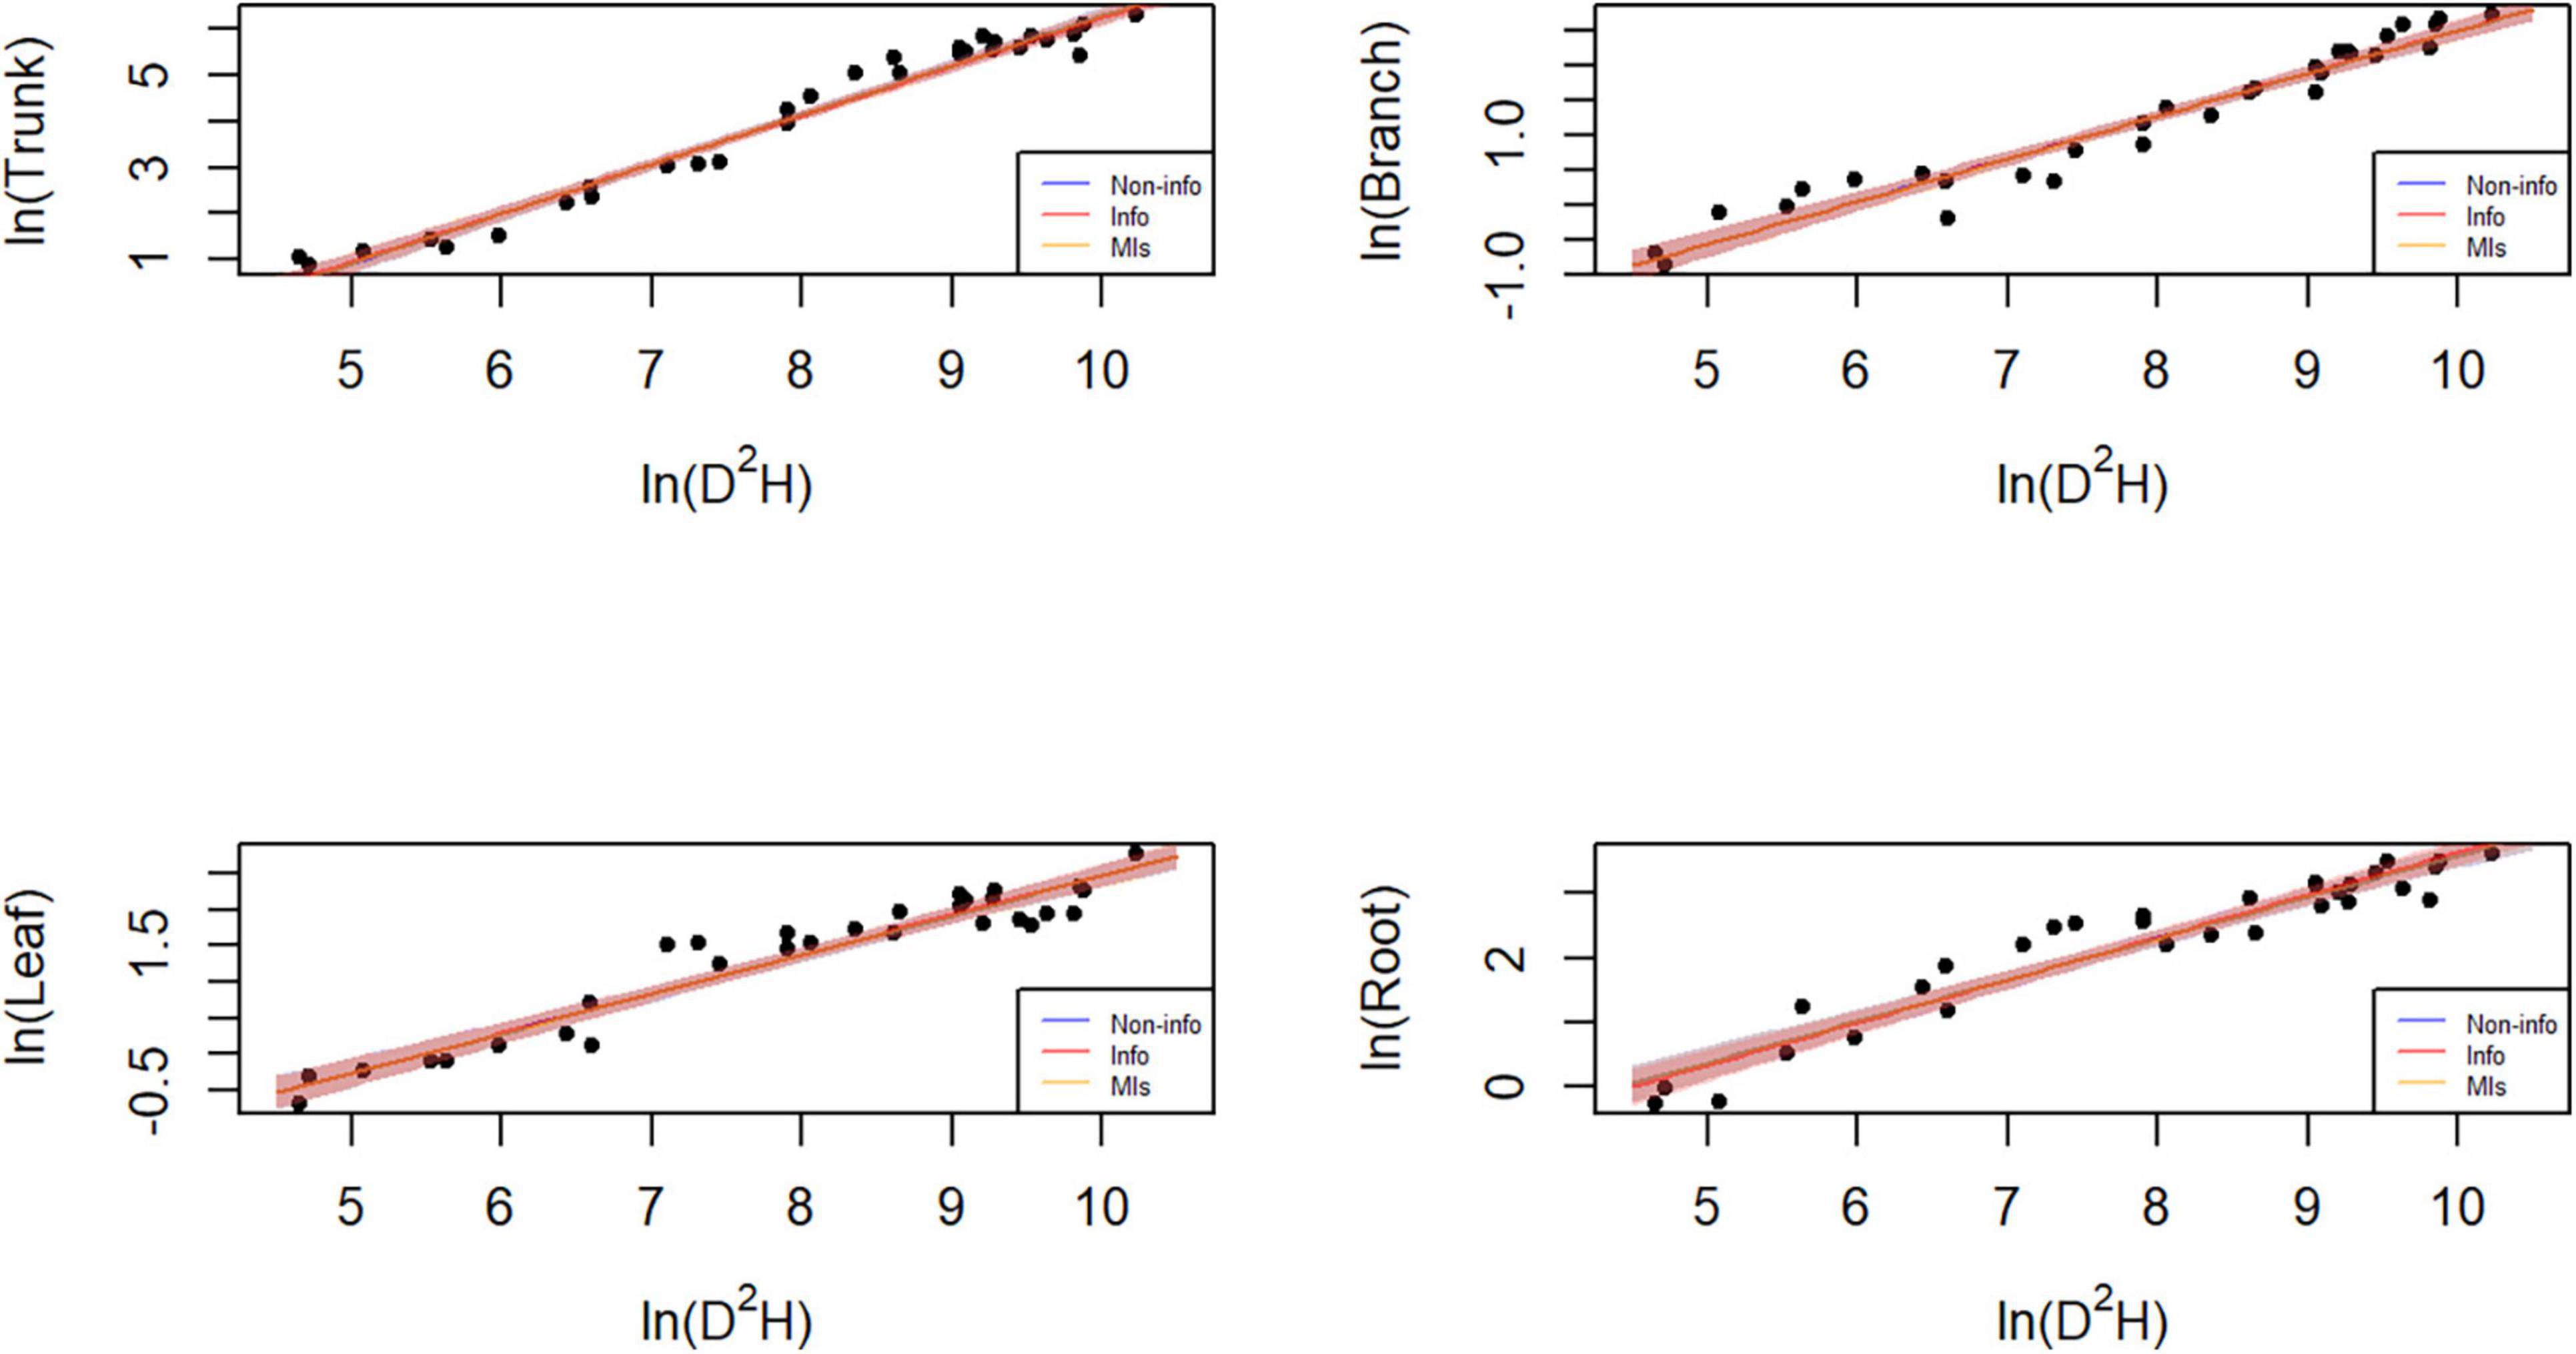
Figure 7. Plot of the data and predictions for each component biomass model lnW = α + bln(D2H) + e. Black dots represent the observed data points. Blue, red, and orange shaded areas denote the 95% credible or confidence intervals of the expected biomass using the three different parameter estimation approaches, while the lines correspond to the (posterior) predictive means. Note that both x and y axes are on a logarithmic scale. Note that both x and y axes are on a logarithmic scale, and that the blue and orange lines and shades mostly overlap with the red ones.
Different model types affect the efficiency, bias, and other numerical values of models. Various allometric biomass models have been employed to estimate forest biomass (Chen, 1981; Wang, 2006; Ma and Li, 2008; Dai et al., 2013; Dong et al., 2014; Widagdo et al., 2021; Xie et al., 2022b), particularly the models W ∼ aDb and W ∼ a(D2H)b. For example, the MEF of a model (M1) with only the DBH as an explanatory variable explained 96.8% and 95.0% of the variation of branch and leaf biomass, respectively. Therefore, the DBH is widely used to estimate biomass (Baker et al., 2004; Chave et al., 2005; Henry et al., 2011). This variation can be attributed to the influence of ecological conditions and the tree age, which affect biomass (Picard et al., 2012). Therefore, the DBH is a critical parameter in allometric growth models of trees and is a primary indicator of above-ground biomass. The addition of tree height to the model slightly increased the MEF of trunk biomass from 79.8% to 83.8%. In contrast, Feldpausch et al. (2012) found that tree height was a significant parameter in estimating tree biomass. The slight increase in the MEF may be partly attributed to difficulties in accurately measuring tree height using Haga hypsometers in the field, especially when the treetop is obscured by other crowns.
The results of different methods for the same model showed that the method affected the estimation of model parameters and MEF. Previous studies have estimated P. koraiensis biomass using two models and the classical method (Wang, 2006; Xu et al., 2022). Although these two models yielded satisfactory performance with high R2 values, their accuracy in estimating forest biomass beyond the specified data range and site conditions is limited (Case and Hall, 2008; Sileshi, 2014). Incorporating parameter factors from different geographical locations into tree biomass models increases variability, suggesting that probability distributions are better suited for parameterizing allometric growth models than the fixed values typically used in MLS (Figure 3). Hence, the widespread application of P. koraiensis biomass models at the stand level may overlook significant variations among different stands. This study proposed a Bayesian approach for modeling the biomass of P. koraiensis components. Zapata-Cuartas et al. (2012) found that the Bayesian and MLS methods provided almost identical RMSE values for estimating parameters using large sample sizes. However, Bayesian methods had a smaller RMSE for small sample sizes, indicating that it has higher efficiency in parameter estimation. In this study, the sample size for the trunk, branch, and leaf biomass models was 31, and Bayesian methods outperformed the MLS in terms of MEF, RMSE, and MAD.
5 Conclusion
This study utilized the Bayesian approach to develop and compare two commonly used models for estimating the biomass of P. koraiensis components. Information priors from the published literature were used to establish 298 P. koraiensis biomass models. The prior distribution was used in the Bayesian model to estimate tree biomass. The Bayesian approach outperformed the MLS, offering a more reasonable and effective approach for estimating the biomass of P. koraiensis components. Several metrics (MEF, , MD, MAD, and RMSE) indicated differences in the biomass models for different components when the tree height was included or excluded. The DBH and the tree height were the main predictor variables significantly affecting the variation in trunk and root biomass, whereas only the DBH affected the variation in branch and leaf biomass. The model parameters provided accurate estimation results. However, Bayesian methods have room for improvement. Additional variables can be incorporated, and a hierarchical Bayesian model can be established to provide more accurate prior information. There may exist potential confounders affecting both the observed biomass and the predictors (i.e., D and H). Incorporating these variables into the regression models would facilitate better estimation of the predictors’ effects. In addition, considering a hierarchical Bayesian model would help pool information from trees of different subspecies or from different geological areas, while enabling a better characterization of the differences among them (Dietze et al., 2008). By incorporating hyper-parameters, the hierarchical model also prevents the model estimates from being overly affected by the prior information provided. This is particularly important due to the possible inconsistency between the biomass data utilized to derive the priors and those collected in our study, reducing the validity of direct extrapolation (Vieilledent et al., 2010).
Data availability statement
The original contributions presented in this study are included in the article/Supplementary material, further inquiries can be directed to the corresponding author.
Author contributions
HL: Conceptualization, Data curation, Formal analysis, Methodology, Software, Validation, Writing – original draft. XD: Conceptualization, Resources, Validation, Writing – review & editing. YZ: Data curation, Formal analysis, Investigation, Writing – review & editing. HQ: Investigation, Project administration, Writing – review & editing. YR: Investigation, Writing – original draft. BZ: Data curation, Writing – review & editing. TG: Writing – review & editing.
Funding
The author(s) declare financial support was received for the research, authorship, and/or publication of this article. This study was funded by the Key Technologies Research and Development Program (CN) (2022YFD2201001) and the Heilongjiang Province Applied Technology Research and Development Program Project (GA19C006).
Acknowledgments
The authors thank Dongfanghong Forest Farm for their help in the data collection.
Conflict of interest
The authors declare that the research was conducted in the absence of any commercial or financial relationships that could be construed as a potential conflict of interest.
Publisher’s note
All claims expressed in this article are solely those of the authors and do not necessarily represent those of their affiliated organizations, or those of the publisher, the editors and the reviewers. Any product that may be evaluated in this article, or claim that may be made by its manufacturer, is not guaranteed or endorsed by the publisher.
Supplementary material
The Supplementary Material for this article can be found online at: https://www.frontiersin.org/articles/10.3389/ffgc.2024.1350888/full#supplementary-material
References
Aabeyir, R., Adu-Bredu, S., Agyare, W. A., and Weir, M. J. C. (2020). Allometric models for estimating aboveground biomass in the tropical woodlands of Ghana, West Africa. For. Ecosyst. 7, 1–23. doi: 10.1186/s40663-020-00250-3
Amir, Z., Sovie, A., and Luskin, M. S. (2022). Inferring predator-prey interactions from camera traps: A Bayesian co-abundance modeling approach. Ecol. Evol. 12:e9627. doi: 10.1002/ece3.9627
Asrat, Z., Eid, T., Gobakken, T., and Negash, M. (2020). Aboveground tree biomass prediction options for the dry afromontane forests in south-central Ethiopia. For. Ecol. Manag. 473:118335. doi: 10.1016/j.foreco.2020.118335
Baker, T. R., Phillips, O. L., Malhi, Y., Almeida, S., Arroyo, L., Di Fiore, A., et al. (2004). Variation in wood density determines spatial patterns in Amazonian forest biomass. Glob. Change Biol. 10, 545–562. doi: 10.1111/j.1365-2486.2004.00751.x
Berger, J. O., and Berry, D. A. (1988). Statistical analysis and the illusion of objectivity. Am. Sci. 76, 159–165.
Campbell, J., Alberti, G., Martin, J., and Law, B. E. (2009). Carbon dynamics of a ponderosa pine plantation following a thinning treatment in the northern Sierra Nevada. For. Ecol. Manag. 257, 453–463. doi: 10.1016/j.foreco.2008.09.021
Case, B. S., and Hall, R. J. (2008). Assessing prediction errors of generalized tree biomass and volume equations for the boreal forest region of west-central Canada. Can. J. For. Res. 38, 1701–1701. doi: 10.1139/X08-906
Chambers, J. Q., Dos Santos, J., Ribeiro, R. J., and Higuchi, N. (2001). Tree damage, allometric relationships, and above-ground net primary production in central Amazon forest. For. Ecol. Manag. 152, 73–84.
Chave, J., Andalo, C., Brown, S., Cairns, M. A., Chambers, J. Q., Eamus, D., et al. (2005). Tree allometry and improved estimation of carbon stocks and balance in tropical forests. Oecologia 145, 87–99. doi: 10.1007/s00442-005-0100-x
Chib, S., and Greenberg, E. (1995). Understanding the metropolis-hastings algorithm. Am. Stat. 49, 327–335. doi: 10.1080/00031305.1995.10476177
Dai, H., He, H., Zhao, X., Zhang, C., Wang, J., and Yang, S. (2013). Biomass Allocation patterns and allometric models of two dominant tree species in broad-leaved and KOREAN pine mixed forest. Chin. J. Appl. Environ. Biol. 19, 718–722. doi: 10.3724/SP.J.1145.2013.00718
De Valpine, P., and Hastings, A. (2002). Fitting population models incorporating process noise and observation error. Ecol. Monogr. 72, 57–76. doi: 10.1890/0012-96152002072[0057:FPMIPN]2.0.CO;2
Deng, X., Xu, F., Zhao, S., and Xiang, W. (2023). Tree height-DBH model for Picea schrenkiana in Tianshan Mountain, Xinjiang of northwestern China based on Bayesian method. J. Beijing For. Univers. 45, 11–20.
Dietze, M. C., Wolosin, M. S., and Clark, J. S. (2008). Capturing diversity and interspecific variability in allometries: A hierarchical approach. For. Ecol. Manag. 256, 1939–1948.
Dogn, L. H., Li, F. R., and Song, Y. W. (2015). Error structure and additivity of individual tree biomass model for four natural conifer species in Northeast China. J. Appl. Ecol. 26, 704–714.
Dong, L., Zhang, L., and Li, F. (2014). A compatible system of biomass equations for three conifer species in Northeast. China. For. Ecol. Manag. 329, 306–317. doi: 10.1016/j.foreco.2014.05.050
Edwards, D. (1996). Comment: The first data analysis should be journalistic. Ecol. Appl. 6, 1090–1094. doi: 10.2307/2269593
Ellison, A. M. (2004). Bayesian inference in ecology. Ecol. Lett. 7, 509–520. doi: 10.1111/j.1461-0248.2004.00603.x
Engel, M., Mette, T., and Falk, W. (2022). Spatial species distribution models: Using Bayes inference with INLA and SPDE to improve the tree species choice for important European tree species. For. Ecol. Manag. 507:119983. doi: 10.1016/j.foreco.2021.119983
Enquist, B. J., Brown, J. H., and West, G. B. (1998). Allometric scaling of plant energetics and population density. Nature 395, 163–165. doi: 10.1038/25977
Feldpausch, T. R., Lloyd, J., Lewis, S. L., Brienen, R. J. W., Gloor, M., Mendoza, A. M., et al. (2012). Tree height integrated into pantropical forest biomass estimates. Biogeosciences 9, 3381–3403. doi: 10.5194/bg-9-3381-2012
Gelman, A., Carlin, J. B., Stern, H. S., and Rubin, D. B. (1995). Bayesian data analysis. New York, NY: Chapman and Hall/CRC.
Geweke, J. (1991). Evaluating the accuracy of sampling-based approaches to the calculation of posterior moments. Minneapolis, MN: Federal Reserve Bank of Minneapolis.
Ghazoul, J., and McAllister, M. (2003). Communicating complexity and uncertainty in decision making contexts: Bayesian approaches to forest research. Int. For. Rev. 5, 9–19. doi: 10.1505/IFOR.5.1.9.17433
Green, E. J., Roesch, F. A., Smith, A. F. M., and Strawderman, W. E. (1994). Bayesian estimation for the three-parameter Weibull distribution with tree diameter data. Biometrics 50, 254–269. doi: 10.2307/2533217
Hadfield, J. D. (2010). MCMC methods for multi-response generalized linear mixed models: The MCMCglmm R package. J. Stat. Softw. 33, 1–22. doi: 10.18637/jss.v033.i02
Henry, M., Picard, N., Trotta, C., Manlay, R. J., Valentini, R., Bernoux, M., et al. (2011). Estimating tree biomass of sub-Saharan African forests: A review of available allometric equations. Silva Fenn. 45, 477–569. doi: 10.14214/sf.38
Hevia Cabal, A., Vilcko, F., and Álvarez González, J. G. (2013). Dynamic stand growth model for Norway spruce forests based on long-term experiments in Germany. Recursos Rurais 9, 45–54.
Holbrook, N. M., and Putz, F. E. (1989). Influence of neighbors on tree form: Effects of lateral shade and prevention of sway on the allometry of Liquidambar styraciflua (sweet gum). Am. J. Bot. 76, 1740–1749.
Huang, Y. Y., and Wang, Y. (2003). “A critical look at procedures for validating growth and yield models. Di dalam: Amaro A, Reed D, Soares P, editor. Modelling Forest Systems,” in Modelling forest systems, Workshop on the interface between reality, modelling and the parameter estimation processes, eds A. Amaro, D. Reed, and P. Soares (London: CABI Publishing), 271–292.
Jaynes, E. T. (2003). Probability theory: The logic of science. New York, NY: Cambridge University Press.
King, D. A. (1991). Tree allometry, leaf size and adult tree size in old-growth forests of western Oregon. Tree Physiol. 9, 369–381. doi: 10.1093/treephys/9.3.369
Koricheva, J., Gurevitch, J., and Mengersen, K. (2013). Handbook of meta-analysis in ecology and evolution. Princeton, NJ: Princeton University Press.
Kurz, W. A., and Apps, M. J. (2006). Developing Canada’s National Forest Carbon Monitoring, Accounting and Reporting System to Meet the Reporting Requirements of the Kyoto Protocol. Mitig. Adapt. Strat. Glob. Change 11, 33–43. doi: 10.1007/s11027-006-1006-6
Leach, C. B., Williams, P. J., Eisaguirre, J. M., Womble, J. N., Bower, M. R., and Hooten, M. B. (2022). Recursive Bayesian computation facilitates adaptive optimal design in ecological studies. Ecology 103:e03573. doi: 10.1002/ecy.3573
LeBauer, D. S., Wang, D., Richter, K. T., Davidson, C. C., and Dietze, M. C. (2013). Facilitating feedbacks between field measurements and ecosystem models. Ecol. Monogr. 83, 133–154. doi: 10.1890/12-0137.1
Li, H. T., Han, X. G., and Wu, J. G. (2005). Lack of evidence for 3/4 scaling of metabolism in terrestrial plants. J. Integr. Plant Biol. 47, 1173–1183.
Li, R., Stewart, B., and Weiskittel, A. (2012). A Bayesian approach for modelling non-linear longitudinal/hierarchical data with random effects in forestry. Forestry 85, 17–25. doi: 10.1093/forestry/cpr050
Luo, Y., Wang, X., Ouyang, Z., Lu, F., and Tao, J. (2020). A review of biomass equations for China’s tree species. Earth Syst. Sci. Data 12, 21–40. doi: 10.5194/essd-12-21-2020
Ma, X. X., and Li, W. J. (2008). Table of Biomass of Korean pine Trees on the Northeast of Changbai Mountain. For. Invest. Des. 3, 74–75.
Muller-Landau, H. C., Condit, R. S., Chave, J., Thomas, S. C., Bohlman, S. A., Bunyavejchewin, S., et al. (2006). Testing metabolic ecology theory for allometric scaling of tree size, growth and mortality in tropical forests. Ecol. Lett. 9, 575–588.
Návar, J. (2009). Biomass component equations for Latin American species and groups of species. Ann. For. Sci. 66, 1–21.
Picard, N., Saint-Andre, L., and Henry, M. (2012). Manual for building tree volume and biomass allometric equations: From field measurement to prediction.
Piccioni, F., Casenave, C., Baragatti, M., Cloez, B., and Vinçon-Leite, B. (2022). Calibration of a complex hydro-ecological model through approximate Bayesian computation and random forest combined with sensitivity analysis. Ecol. Inf. 71:101764. doi: 10.1016/j.ecoinf.2022.101764
Sileshi, G. W. (2014). A critical review of forest biomass estimation models, common mistakes and corrective measures. For. Ecol. Manag. 329, 237–254. doi: 10.1016/j.foreco.2014.06.026
Soares, P., and Tomé, M. (2007). Model evaluation: From model components to sustainable forest management indicators. Cuad. Soc. Esp. Cienc. For. 23, 27–34.
Stinson, G., Kurz, W. A., Smyth, C. E., Neilson, E. T., Dymond, C. C., Metsaranta, J. M., et al. (2011). An inventory-based analysis of Canada’s managed forest carbon dynamics, 1990 to 2008. Glob. Change Biol. 17, 2227–2244.
Vieilledent, G., Courbaud, B., Kunstler, G., Dhôte, J.-F., and Clark, J. S. (2010). Individual variability in tree allometry determines light resource allocation in forest ecosystems: A hierarchical Bayesian approach. Oecologia 163, 759–773. doi: 10.1007/s00442-010-1581-9
von Oheimb, G., Lang, A. C., Bruelheide, H., Forrester, D. I., Wäsche, I., Yu, M., et al. (2011). Individual-tree radial growth in a subtropical broad-leaved forest: The role of local neighbourhood competition. For. Ecol. Manag. 261, 499–507.
Wagers, S., Castilla, G., Voicu, M., Rea, T., and Sanchez-Azofeifa, G. A. (2023). New aboveground biomass equations by components for small black spruce in peatland ecosystems of Western Canada. Can. J. For. Res. 54:31. doi: 10.1139/cjfr-2023-0031
Wang, C. K. (2006). Biomass allometric equations for 10 co-occurring tree species in Chinese temperate forests. For. Ecol. Manag. 222, 9–16. doi: 10.1016/j.foreco.2005.10.074
West, G. B., Brown, J. H., and Enquist, B. J. (1997). A general model for the origin of allometric scaling laws in biology. Science 276, 122–126. doi: 10.1126/science.276.5309.122
Widagdo, F. R. A., Dong, L., and Li, F. (2021). Biomass functions and carbon content variabilities of natural and planted Pinus koraiensis in Northeast China. Plants (Basel) 10:201. doi: 10.3390/plants10020201
Xie, L., Fu, L., Widagdo, F. R. A., Dong, L., and Li, F. (2022b). Improving the accuracy of tree biomass estimations for three coniferous tree species in Northeast China. Trees 36, 451–469. doi: 10.1007/s00468-021-02220-w
Xie, L., Chen, X., Zhou, X., Sharma, R. P., and Li, J. (2022a). Developing tree mortality models using bayesian modeling approach. Forests 13:604. doi: 10.3390/f13040604
Xu, Z. Z., Du, W. X., Zhou, G., Qin, L. H., Meng, S. W., Yu, J., et al. (2022). Aboveground biomass allocation and additive allometric models of fifteen tree species in northeast China based on improved investigation methods. For. Ecol. Manag. 505:119918. doi: 10.1016/j.foreco.2021.119918
Yoon, T. K., Park, C.-W., Lee, S. J., Ko, S., Kim, K. N., Son, Y., et al. (2013). Allometric equations for estimating the aboveground volume of five common urban street tree species in Daegu, Korea. Urban For. Urban Green. 12, 344–349. doi: 10.1016/j.ufug.2013.03.006
Yue, Q., Geng, Y., Von Gadow, K., Fan, C., Zhang, C., and Zhao, X. (2022). Effects of neighborhood interaction on tree growth in a temperate forest following selection harvesting. Ecol. Indic. 136:108663. doi: 10.1016/j.ecolind.2022.108663
Zanvo, S. M. G., Mensah, S., Salako, K. V., and Glèlè Kakaï, R. (2023). Tree height-diameter, aboveground and belowground biomass allometries for two West African mangrove species. Biomass Bioenerg. 176:106917. doi: 10.1016/j.biombioe.2023.106917
Zapata-Cuartas, M., Sierra, C. A., and Alleman, L. (2012). Probability distribution of allometric coefficients and Bayesian estimation of aboveground tree biomass. For. Ecol. Manag. 277, 173–179. doi: 10.1016/j.foreco.2012.04.030
Zeng, N., and Hausmann, H. (2022). Wood vault: Remove atmospheric CO2 with trees, store wood for carbon sequestration for now and as biomass, bioenergy and carbon reserve for the future. Carbon Balance Manag. 17:2. doi: 10.1186/s13021-022-00202-0
Zhang, X., Duan, A., and Zhang, J. (2013). Tree biomass estimation of Chinese fir (Cunninghamia lanceolata) based on Bayesian method. PLoS One 8:e79868. doi: 10.1371/journal.pone.0079868
Keywords: Pinus koraiensis, Bayesian, tree component, biomass, carbon
Citation: Liu H, Dong X, Zhang Y, Qu H, Ren Y, Zhang B and Gao T (2024) Estimation of biomass in various components of Pinus koraiensis based on Bayesian methods. Front. For. Glob. Change 7:1350888. doi: 10.3389/ffgc.2024.1350888
Received: 06 December 2023; Accepted: 03 June 2024;
Published: 17 June 2024.
Edited by:
Nesibe Köse, Istanbul University-Cerrahpasa, TürkiyeReviewed by:
Michael C. Dietze, Boston University, United StatesZhen Yu, Nanjing University of Information Science and Technology, China
Copyright © 2024 Liu, Dong, Zhang, Qu, Ren, Zhang and Gao. This is an open-access article distributed under the terms of the Creative Commons Attribution License (CC BY). The use, distribution or reproduction in other forums is permitted, provided the original author(s) and the copyright owner(s) are credited and that the original publication in this journal is cited, in accordance with accepted academic practice. No use, distribution or reproduction is permitted which does not comply with these terms.
*Correspondence: Xibin Dong, eGliaW5kb25nQG5lZnUuZWR1LmNu