
95% of researchers rate our articles as excellent or good
Learn more about the work of our research integrity team to safeguard the quality of each article we publish.
Find out more
ORIGINAL RESEARCH article
Front. For. Glob. Change , 18 March 2024
Sec. Forest Disturbance
Volume 7 - 2024 | https://doi.org/10.3389/ffgc.2024.1345047
 Muhammad Tariq Badshah1,2
 Khadim Hussain1,3
 Arif Ur Rehman4,5
 Kaleem Mehmood1,2,6
 Bilal Muhammad1,2
 Rinto Wiarta1,7
 Rato Firdaus Silamon1,8
 Muhammad Anas Khan8
 Jinghui Meng1,2*
Introduction: This study delves into the spatiotemporal dynamics of land use and land cover (LULC) in a Metropolitan area over three decades (1991–2021) and extends its scope to forecast future scenarios from 2031 to 2051. The intent is to aid sustainable land management and urban planning by enabling precise predictions of urban growth, leveraging the integration of remote sensing, GIS data, and observations from Landsat satellites 5, 7, and 8.
Methods: The research employed a machine learning-based approach, specifically utilizing the random forest (RF) algorithm, for LULC classification. Advanced modeling techniques, including CA–Markov chains and the Land Change Modeler (LCM), were harnessed to project future LULC alterations, which facilitated the development of transition probability matrices among different LULC classes.
Results: The investigation uncovered significant shifts in LULC, influenced largely by socio-economic factors. Notably, vegetation cover decreased substantially from 49.21% to 25.81%, while forest cover saw an increase from 31.89% to 40.05%. Urban areas expanded significantly, from 7.55% to 25.59% of the total area, translating into an increase from 76.31 km2 in 1991 to 258.61 km2 in 2021. Forest area also expanded from 322.25 km2 to 409.21 km2. Projections indicate a further decline in vegetation cover and an increase in built-up areas to 371.44 km2 by 2051, with a decrease in forest cover compared to its 2021 levels. The predictive accuracy of the model was confirmed with an overall accuracy exceeding 90% and a kappa coefficient around 0.88.
Discussion: The findings underscore the model’s reliability and provide a significant theoretical framework that integrates socio-economic development with environmental conservation. The results emphasize the need for a balanced approach towards urban growth in the Islamabad metropolitan area, underlining the essential equilibrium between development and conservation for future urban planning and management. This study underscores the importance of using advanced predictive models in guiding sustainable urban development strategies.
The continuous transformation in earth surface through land use land cover (LULC) changes impact life forms, climate, and terrestrial ecosystems (Koschke et al., 2012; Salazar et al., 2015; Niquisse et al., 2017). Nearly half of the earth’s surface has been transformed by human activities (Vitousek et al., 1997). At global and local levels, understanding the changes of LULC are necessary for managing natural resources and addressing global climate change mitigation (Xiao et al., 2004; Jung et al., 2006). Land use changes in urban areas, forest cover and other vegetation are indicators of human activities (Wu et al., 2021). The LULC change trajectory categorized worldwide by gains in urban land, agriculture, and declines in forests, these changes are associated with the change of forest land to agricultural expansion, urban growth and deforestation (Foley et al., 2005; Tian et al., 2014; Muhammad, 2023). The degree and size of LULC are changing in many parts of the world. Particularly in developing countries, urbanization, population growth, and rural-to-urban migration have increased the importance of monitoring land use and land cover changes (Wang et al., 2018). Due to LULC changes, habitat degradation and fragmentation are major factors contributing to biodiversity loss (Yohannes et al., 2018; Mumtaz et al., 2023). The natural landscapes are changing due to deforestation, population growth, development and agriculture practices (Mori, 2011).
Under such scenarios, studies using GIS and remote sensing technologies can provide scientifically reliable information for sustainable land management, particularly temporal information enhance monitoring and analysis of LULC changes in past and future for policy recommendations (Chettry and Surawar, 2021). Further, the cloud-based Google Earth Engine (GEE) platform has made significant progress that enables rapid analysis of satellite data (Tamiminia et al., 2020; Habibie, 2022; Pan et al., 2022; Pham-Duc et al., 2023). LULC classifications obtained from diverse data sources have shown a high level of accuracy and visual quality ensuring reliable outcomes for research and applications (Hu and Hu, 2019; Aksoy et al., 2022). Using remote sensing and GIS to model LULC dynamics, the CA-Markov chain model provides enhanced LULC forecasting capabilities over other models such as Holt-Winters Exponential Smoothing (HWES), Artificial Neural Networks (ANNs), where most of these models use historical land use data to assess the past land transformation and transition (Civco, 1993; Pan, 2024). Autoregression (AR) and linear regression (Sexton et al., 2013; Ullah et al., 2019). To provide a comprehensive overview of the application of machine learning in urban growth prediction. Supplementary Table S1. has been incorporated summarizing key references and their contributions to illustrates various methodologies and models used in the field, enhancing the reader’s understanding of the diverse applications of machine learning in urban growth prediction.
These studies have provided highly accurate information on the dynamics of land use changes and their drivers, which can assist in better guiding city planning for sustainability. Therefore, accurate geospatial modeling of urbanization is a prerequisite for sustainable development of cities. Previous studies have found that the Land Change Modeler (LCM), using an integrated multilayer perceptron (MLP) and Markov chain (MC), is an effective model for further simulation of land use change as well as the accurate validation of the result (Wang et al., 2018; Wang and Maduako, 2018; Hasan et al., 2020; Aksoy and Kaptan, 2022). The MLP-MCA-based hybrid approach has been implemented to integrate the Multilayer Perception (MLP) model with the Markov Chain model, which is a widely accepted model for modeling LULC changes using current trends (El-Hallaq and Habboub, 2015; Aksoy and Kaptan, 2021). The most important feature of the Markov chain model is to predict complex dynamic spatial patterns with high accuracy (Gidey et al., 2017; Aksoy and Kaptan, 2022).
Developing countries like Pakistan suffer from rapid urbanization and as a result local temperatures increased, native habitats have been fragmented and air pollution has increased (Hassan et al., 2016). Islamabad the capital of Pakistan is a prime example of these challenges. As a result of population growth and migration for employment and education, LULC in the city has changed dramatically (Mumtaz et al., 2020; Fahad et al., 2021). Despite these challenges, Islamabad stands out for its effective forest conservation and infrastructure management. Dynamic landscape patterns require understanding the complex interactions between changes in the landscape (Coomes et al., 2001). Islamabad’s urban growth contributes to unplanned sprawl and declining living standards. To overcome these challenges, an effective strategy for improving urban quality of life, promoting sustainable development, and mitigating environmental degradation is needed.
Addressing gaps in predicting Land Use and Land Cover (LULC) changes, this study leverages multi-temporal Landsat imagery and the Random Forest algorithm for classification, alongside cellular automata and Markov chain models for future urban growth projections. It offers insights for sustainable urban planning by forecasting trends in forests, vegetation, urban, and barren lands, underscoring the imperative of harmonizing socio-economic development with environmental conservation.
Islamabad, the capital of Pakistan, is the crucible of socio-economic, political, and environmental development in the country. Geographically, the city is part of the northern extension, situated at (33° 44′ 16.9620” N, 73° 5′ 4.1568″ E) (Figure 1) located at the Potohar plateau of Punjab province. Which makes it an important administrative and commercial center. With an area of 1,010 km2 both mountainous terrain and undulating plains exist between 450 and 600 m above sea level (Ahmed et al., 2023). The topography of Islamabad is characterized by high elevations in the north, east, and west, and relatively low elevations in the south. The city is surrounded by Margalla hills rising over 685 meters at the western end and 1,604 meters on its east. The Margalla Hills National Park is an area of significant biological diversity (Badshah et al., 2020). Numerous wildlife species inhabit the surrounding forests (Mannan et al., 2019). The urban center has experienced significant demographic expansion, surpassing a population of 1.2 million individuals, as reported by the National Population Census (Pakistan Statistics of Bureau, 2017). Based on its climatic conditions, the region has a humid subtropical climate with warm summers and dry winters (Butt et al., 2015). The mean annual temperature is 13°C. The temperature drops to a minimum of 4°C in December and January. The hottest months are May, June, and July, with average temperatures between 36 and 42°C (Ahmed et al., 2023). A Tertiary sandstone, limestone, and alluvial sediment deposit has been identified in the area.
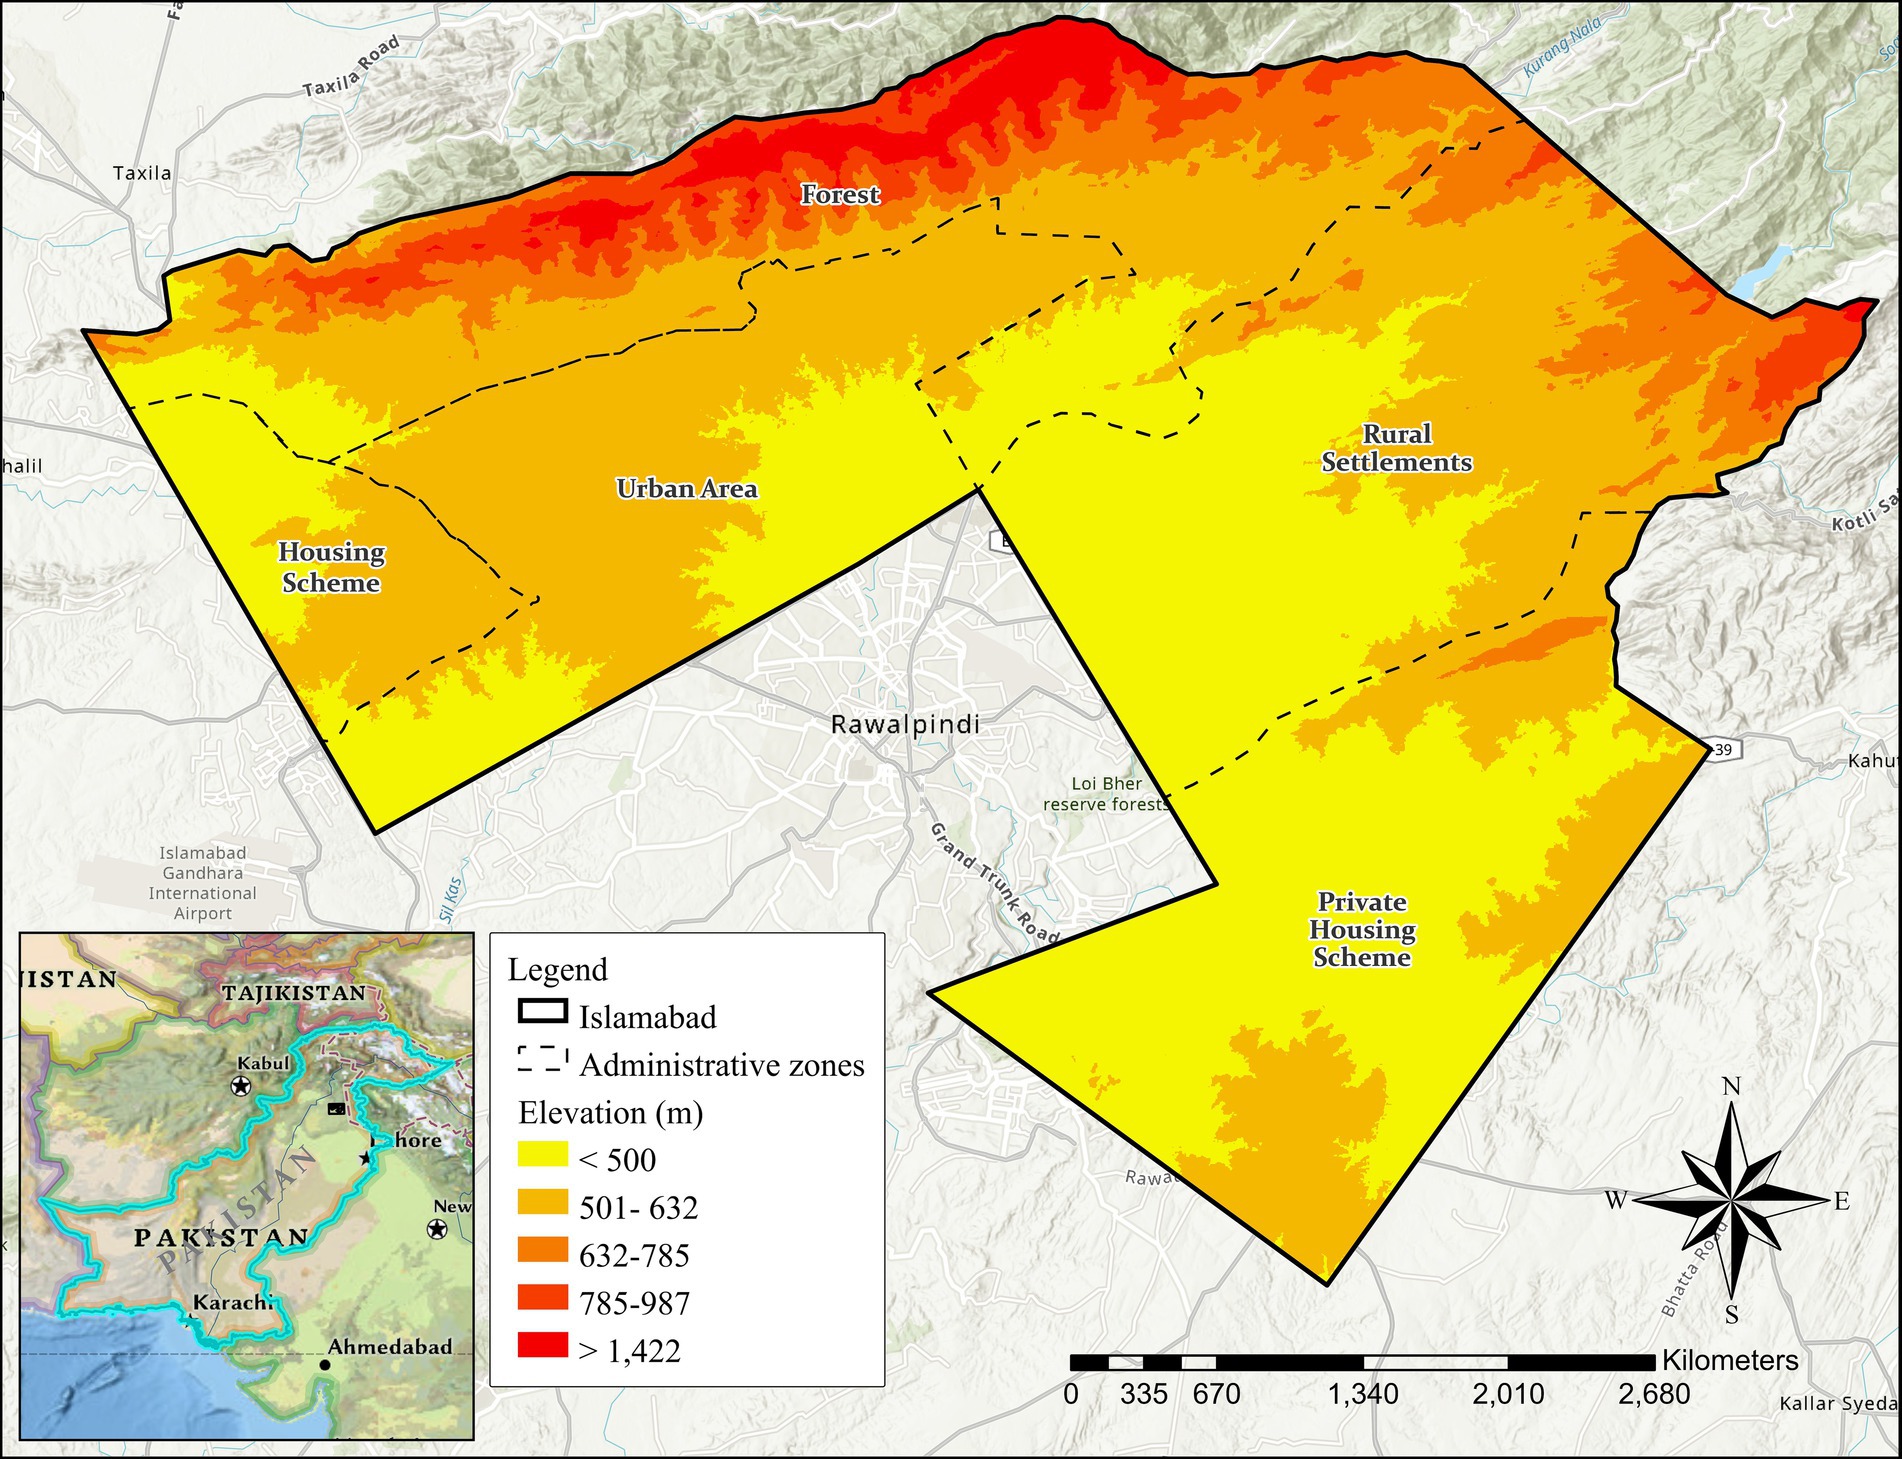
Figure 1. Altitudinal-based map of the study area.
This study used multi-temporal Landsat data to model urban growth. The analysis was performed using four time periods of Landsat datasets to produce LULC maps, the TM Landsat-5 from 1991 and 2001, ETM+ Landsat-7 from 2011, and OLI_TIRS Landsat-8 from 2021 which were available as Level 1, Collection 1, Tier 1 datasets using GEE platform, selected all temporal images with zero or close to zero (less than 10%) cloud coverage, atmospherically corrected surface reflectance scenes for the study area. Our study area is covered by a single scene (path 150 and row 37). Supplementary Table S2 shows the relevant data.
One major function of pre-processing is to remove such distortions, especially when optical sensor data is used, during May of 2003, the hardware of the Landsat 7 ETM+ sensor failed, leading to scanline problems that caused gaps in the images (Wang et al., 2020; Choate et al., 2021). To address this concern in our research, we adopted a two-pronged strategy. Firstly, we opted for images with fewer scanline errors, especially in locations with human settlements. Secondly, we employed sophisticated gap-filling techniques, including the Local Linear Histogram Matching (LLHM) method (Chen et al., 2015; Lee et al., 2016). This method utilizes statistical properties of neighboring pixels to estimate missing pixel values, thereby minimizing the effects of data gaps on our analysis (Asare et al., 2020). In 2021, Landsat-8 Surface Reflectance (SR) images were procured and classified via the Google Earth Engine (GEE) platform. Annual composite images were integrated, employing median values to generate a synthetic image with minimal cloud cover across the study area. Clouds and shadows were efficiently obscured using the quality assurance (QA) band, ensuring clarity in the resultant imagery (Qiu et al., 2019; Article, 2021). Further, SRTM DEM with a spatial resolution of 30-meters was used to estimate terrain variables such as distance to highways, elevation, proximity to rivers, and distance to urban areas using Euclidean Distance Method. The purpose of including these terrain elements was to improve the accuracy of the classification process.
Methodological framework of the study has been illustrated in Figure 2. All analysis was conducted using GEE. Supervised classification approaches were used to derive five land use classes for study area. Supplementary Table S3 shows five land cover types. These clusters were WA, FL, BA, BL, and VL, for each of the land use types, training samples were randomly generated in GEE platform. In terms of image classification, the outputs were then subjected to supervised classification using Random Forest (RF) classifier to obtain the basic features of land form.
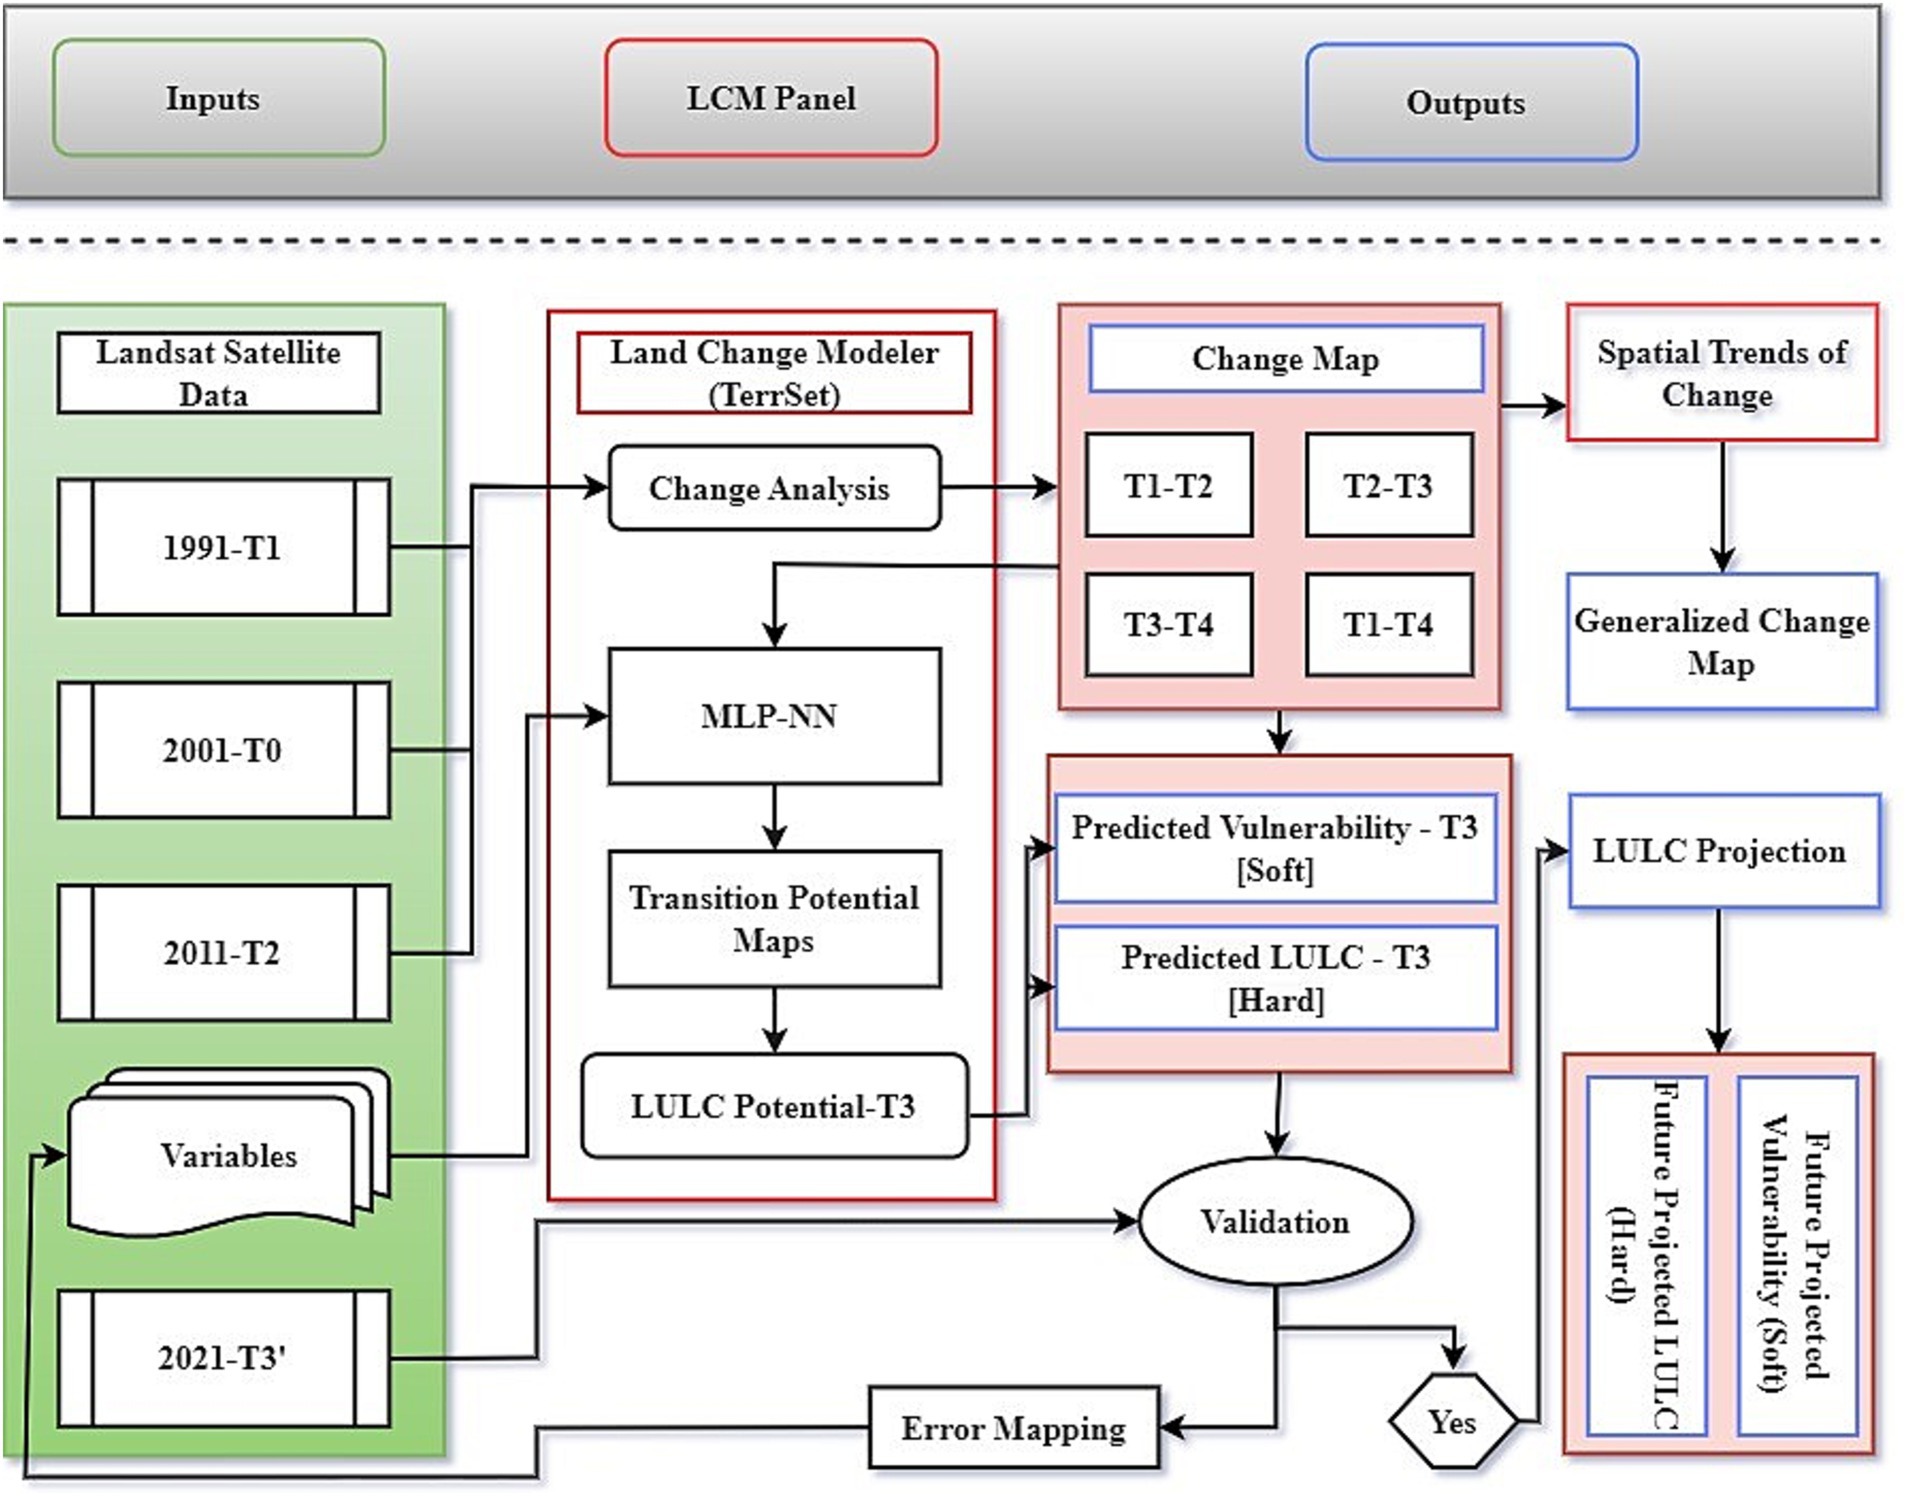
Figure 2. Methodological overview of current study.
There are a number of classification methods available, such as Random Forest (RF), Support-Vector-Machine (SVM), Decision-Tree-Classifier (DTC), Classification and Regression (CART), MLC and Artificial Neural-Network (ANN) (Li et al., 2019). RF is widely used algorithm for remote sensing image classification in land-cover categorization, based on decision tree model involves the production of several trees widely used in land cover classification, achieved efficient classification results in a variety of remote sensing experiments (Jin et al., 2018; De Sousa et al., 2020). RF classifications are generally thought to be more stable than other commonly used parametric techniques, such as Maximum Likelihood, due to the use of bootstrapping and a random subset of data in building the RF model (Strobl et al., 2009).
Random Forest (RF) algorithm developed by Breiman (2002) is based on decision trees and has received significant attention over the past two decades and has been successfully applied in ecological research. Implementation of RF is simplified by only fine-tuning n-tree and m-try (Maxwell et al., 2018). The RF method is most commonly employed for the interpretation of satellite imagery, according to a comprehensive meta-analysis of 349 peer reviewed studies conducted over the past decade (Tamiminia et al., 2020). Given the various factors considered, RF was selected as the classification method for the current investigation. Following the suggestions provided by prior research (Cánovas-García et al., 2017). For the current study, RF was selected as the classification method. Based on preliminary assessments of our dataset, 100 trees were selected (ntree = 100) (the number of trees to grow). As a default, “mtry” represents the square root of the total number of features at each node. The dataset is randomly split into two portions, with 70% of the data utilized for training the RF model and the remaining 30% employed to validate the constructed model. In this technique, a bootstrap sample consisting of approximately 90% of the training data is randomly selected to construct an individual decision tree.
Training samples were selected based on five categories of land use. The training data were 70% of the samples, while the testing data were 30%. Data sets for 1991 (train 1,661, test 504), 2001 (train 1,473, test 441), 2011 (train 909, test 272), and 2021 (train 909, test 272), respectively. To measure classification results accuracy, 1,027 and 308 pixels are collected from the train and test (Siddique et al., 2021). Accuracy assessment was carried out on the resulting classified imagery using confusion matrix and kappa index (Morales-Barquero et al., 2019). The confusion matrix uses a variety of statistical indicators, including user accuracy, producer accuracy, and kappa statistics. (Equation 1–2) was used to estimate the Kappa coefficient (Jenness and Wynne, 2005). Kappa coefficients below 0.4 indicate a lack of agreement, while 0.4–0.8 indicates a moderate agreement, and above 0.8 indicate great agreement (Mishra and Rai, 2016). Kappa coefficient was calculated using the formula.
N is the total number of observations. m is the number of rows (and columns) in the matrix. Xii represents the count of observations in both row i and column i, specifically the diagonal elements of the matrix. Xi + denotes the marginal total of row i. X + i denotes the marginal total of column i.
The Land Change Modeler (LCM) is a highly reliable model that has consistently outperformed other methods for simulating and predicting LULC types using the CA-Markov model. This model is integrated into the TerrSet Geospatial Monitoring and Modeling System (TGMMS) software, which was used to predict future LULC for a specified year based on classified historical satellite images. To make these predictions, Landsat images from previous years were analyzed using the LCM model to assess factors affecting future LULC changes and quantify the extent of changes between specific periods (Eastman, 2016). This methodology has been thoroughly tested and widely utilized to predict and analyze changes, providing both losses and gains in LULC assessment. The LCM model produces two types of maps: hard projections and soft projections. Hard projections develop a simulated map for the prediction year, with each pixel assigned to a specific land use category. Soft projections assess vulnerability, with each pixel assigned a value from 0 to 1. A small value indicates a low level of vulnerability change, while a high value indicates a high level (Ayele et al., 2019).
Spatial analysis was conducted on the land use and land cover (LULC) variations in Islamabad for the years 1991, 2001, 2011, and 2021. To produce future land use scenarios, we examined current land use patterns, temporal data, and future growth trends. We utilized LCM analyses, including “change analysis,” “transition potentials,” and “change prediction” tabs, to simulate future trends. These models utilized sub-models and explanatory factors to generate transition potential maps. Several machine learning tools, such as similarity-weighted (SimWeight), MLP neural networks and logistic regression, were employed to calculate the amount of land predicted to change based on additional images obtained from simulations (Eastman, 2016). Models reflect a complex relationship between land change phenomena and their explanatory variables, offering greater flexibility and dynamic flexibility than other approaches (Fathizad et al., 2015). The LULC categories and scenarios were also predicted using the Transition Probability Matrix (TPM) (Wang et al., 2012; Li et al., 2015). Markov chain model is capable of simulating LULC changes, utilizing the Bayes equation (Equations 3–5). Additionally, a hybrid CA-MC model calculates transition probabilities using LULC layers from different periods and distinguishes LULC classes by their transition probabilities. TerrSet software estimates future changes based on temporal data using the CA-MC model (Eastman, 2020).
The variable S (t + 1) denotes the state of the system at time t, whereas Pij refers to the transitional probability matrix that quantifies the likelihood of transitioning between different land use groups.
P denotes the Markov probability matrix, while Pij signifies the probability of transitioning from state i to state j in the subsequent time increment. The probabilities of transitions from low to high are approximately 0 and 1, correspondingly.
These variables represent the system status at t and t + 1, respectively. The cellular field is denoted by N, f denotes the algorithm responsible for transforming local space in a cellular manner. The term S refers to a collection of distinct and restricted cellular states. The transition probability matrix Pij corresponds to each state.
A single map of suitability is generated by the CA-Markov model through the integration of numerous constraints and parameters is illustrated in Figure 3 (Eastman, 2012, 2016; Singh et al., 2015). A probability transition matrix is generated by identifying probability transition regions. A probability transitional matrix shows the likelihood of a specific LULC class being transferred to an alternative class over time. For each LULC category, the transitional zone matrix contains the predicted changes in pixel values (Eastman, 2020). In order to prepare for future simulations of land use and land cover (LULC), multiple datasets were collected from 1991 and 2001. Based on these datasets, LULC patterns for 2011 were simulated. The transition probabilities derived from the changes observed between 1991 and 2001 provided insights into the dynamics of land use changes over time. We simulated the LULC patterns for the year 2021 based on the validated simulation results of 2001 and 2011. To measure our model’s predictive accuracy, validation metrics were used for years 2011 and 2021 to assess our model’s predictive accuracy. A validated model was then used to forecast the LULC covers for the years 2031, 2041, and 2051 through simulations. Future projections enable an understanding of how land use patterns will change over time and provide valuable insight into future landscapes.
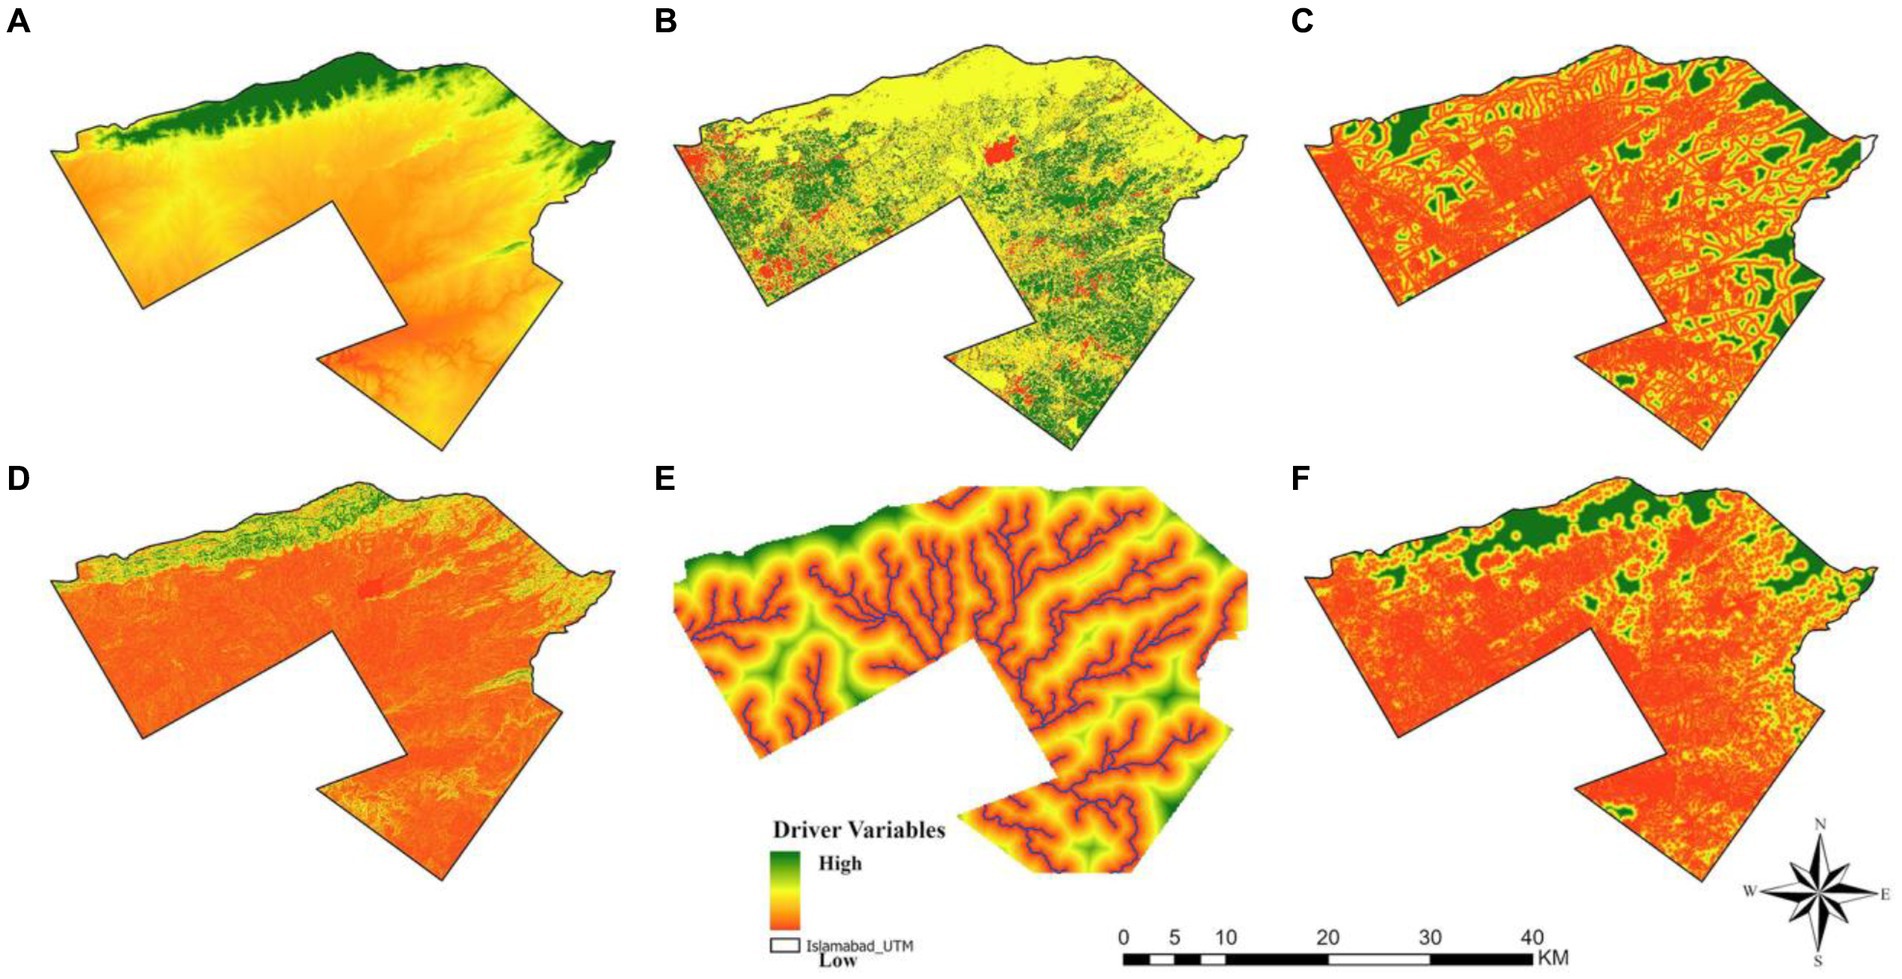
Figure 3. Layer nodes of input variables: (A) Elevation. (B) Evidence likelihood. (C) Distance from the road. (D) Slope. (E) River proximity. (F) Distance from urban.
LULC is influenced by many factors, both natural and anthropogenic. In order to accurately simulate LULC, it is crucial to take into account the potential impact of the independent variables, as highlighted by Gharaibeh et al. (2020). The present study investigated the main independent factors, as indicated in Figure 3. Elevation, slope, proximity to highways, proximity to rivers, proximity to metropolitan regions, and likelihood raster were the potential driver variables. Moving distances over time was represented by distances from roads, streams, and city. According to Leta et al. (2021), land use patterns and resource accessibility are enhanced by rivers’ proximity, while the proximity of roads facilitates urban development (Kim et al., 2020). According to Gharaibeh et al. (2020) Proximity to urban areas significantly affects land transformation. The proximity of a property site to urban centers directly correlates with its potential for conversion into an urban area. Closer to urban centers, land is more easily converted (Leta et al., 2021). Based on the findings of Zhang et al. (2019), the slope of the terrain impacts the alteration of land cover. A gentler slope promotes land use transition. Urban land accumulation is predominantly observed in areas with relatively flat slopes, while deforestation rates decrease as slope gradients increase (Wang et al., 2017).
The process of validation is essential in assessing the precision and dependability of a predicted maps in comparison to a reference map (Wang et al., 2016). LULC changes and urban growth were simulated using the CA-MC and MLP-NN hybrid models. LULC data from 1991 and 2011 were compared with simulation results for 2021. MLP-NN was used to simulate future perditions for (2031, 2041, and 2051 respectively). LULC map remapping to reflect 2021 provided an evaluation of algorithm precision. LCM performs a cross-tabulation as part of its validation procedure. Comparing the projected map from 2021 with the actual map from 2021 is shown in Supplementary Table S3. A comparison of the predicted LULC map for 2021 with the reference image from the same year was undertaken using the validation algorithm within the LCM model (Wang et al., 2016).
A kappa coefficient was used to compare the actual and projected land use maps. VALIDATE and Receiver Operating Characteristic (ROC) modules in TerrSet were used to calculate the area under the receiver operating characteristics curve, evaluate the location agreement between observed and projected LULC layers (Giglioni et al., 2021; Girma et al., 2022). According to the study conducted by Mosammam et al. (2017), the first kappa metric has a limitation in its ability to differentiate between quantification and location errors, thus limiting its overall accuracy. By computing the K-indices of several variables, specifically Kno (kappa for no information), Klocation (kappa for location), Kstandard (kappa for standard), and Klocation Strata (kappa for stratum-level location), the resolve the issues (Mosammam et al., 2017). Four key measures are taken into account when examining precision, both spatially and numerically. The K standard, Kno, and Klocation stratum scores. Several other measures can be used to assess agreement and disagreement in addition to the aforementioned statistical indicators. This includes Agreement Quantity, Agreement Chance, Agreement Grid Cell, and Disagreement Grid Cell. The simulated map and the base map are compared using these measures. The relevant data are presented in Supplementary Table S4 (Viera and Garrett, 2005).
Understanding the simulated model requires a thorough understanding of disagreement quantity and grid cell components (Wang et al., 2016). Predicted and actual LULC maps are compared using this validation method (Islam et al., 2018). There is a significant difference between the maps of the two categories in quantity (changes or persistence) and allocation. A difference in amount refers to an inaccurate alignment in the proportion of LULC classes between two maps. A spatial allocation discrepancy refers to the difference between images resulting from an incomplete integration of spatial allocations across all categories (Kim et al., 2011).
The assessment of LULC change was conducted employing the LCM framework. This analysis comprised three distinct sections: a quantitative evaluation of LULC categories, a net change analysis, and an assessment of the individual contributions of each LULC class to the overall net change. The research utilized classified maps from 1991, facilitating a comparative analysis with observed LULC data from 2001, 2011, and 2021. This comparison underpins the projection of LULC changes for 2031, 2041, and 2051, thereby elucidating the trajectory of LULC transformations (Mosammam et al., 2017). The LULC dynamics in each study period were assessed using the numerical values extracted from the classified images. To acquire the change pattern, the images classified from consecutive periods were cross-tabulated and compared to each other. There are four distinct time intervals, The probability matrix was done between 1991–2001, 2001–2011, 2011–2021, and beyond 2021 using LCM. Finding the least common multiple of two or more numbers requires finding the smallest positive integer divisible by each number. This concept can be used to calculate the percentage change (Hassen and Assen, 2018), and the rate of change were determined for LULC categories by using Equations (6–7) to determine LULC classes (Gashaw et al., 2014). to determine the amount of the changes experienced between the periods of the different LULC categories.
The dynamics of LULC were analyzed using numerical data from classified imagery. Images from successive intervals were cross-tabulated for pattern analysis across four time intervals: 1991–2001, 2001–2011, 2011–2021, and beyond 2021, using the LCM framework. The methodology for estimating percentage and rate of change in LULC categories employs the least common multiple concept and is detailed through (Equation 6–7) as per (Gashaw et al., 2014; Hassen and Assen, 2018), facilitating the quantification of LULC changes over the study periods.
In this instance, Ax represents the LULC area (ha) of an earlier land cover image while Ay represents the later image. T is the period between Ax and Ay (Leta et al., 2021).
Based on RF classification method the changes in LULC were assessed by generating confusion matrixes for each land cover category in 1991, 2001, 2011 and 2021. The overall accuracy, kappa statistics, user and producer accuracy, obtained through confusion matrix for each land cover class are listed in Table 1. The overall accuracy values for 1991, 2001, 2011, and 2021 were 90.89, 90.76, 91.19, and 91.11%, respectively. The corresponding kappa statistics for these years are 0.87, 0.87, 0.88, and 0.88, respectively. The accuracy of the more current land map exhibits an improvement, as compared to previous years maps.
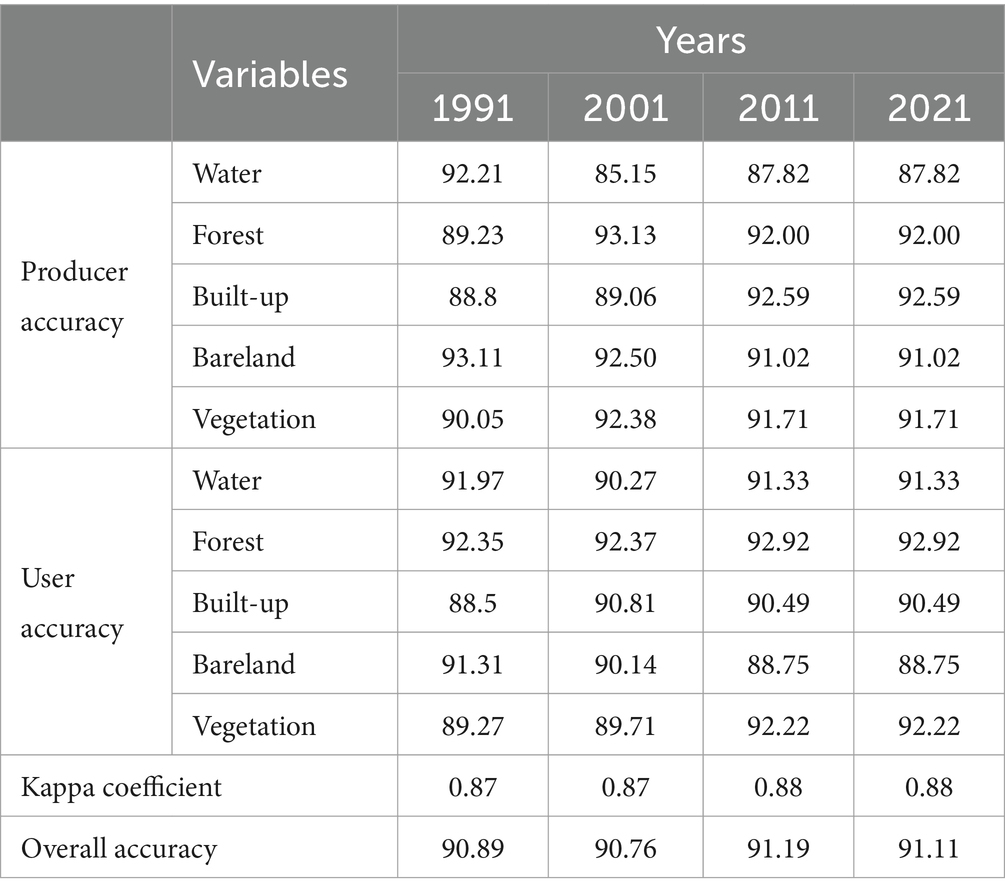
Table 1. Accuracy calculation of 1991–2021 LULC maps.
The study analyzed the land use changes in Islamabad for 1991, 2001, 2011, and 2021, specifically emphasizing, five major land cover classes were identified viz., WA, FL, BA, BL, and VL (Figure 4). The data from 1991 indicates that the extent of land covered by vegetation Increased at 49.21% (497.22 km2). Over three decades, this proportion progressively declined to 25.81% (260.83 km2) in 2021. The forest area, as determined in 1991 was around 31.89% (322.25 km2) of the total land area, after three decades, this proportion had an upward trend, reaching 40.05% (409.21 km2) in 2021. It indicates an average increase of 8.61% in the forest area from 1991 to 2021. The calculation of the bare land area in 1991 yielded a value of 106.52 km2, accounting for 10.54% of the total area. In 2021, the bare land area was determined to be 73.66 km2, representing 7.29% of the total area (Supplementary Table S5; Figure 5). It indicates a decline of −3.25% in the bare land area from 1991 to 2021. Our findings showed a built-up area in 1991 was determined to be 76.31 km2, accounting for 7.55% of the total area. Where it expanded significantly to 258.61 km2 in 2021, representing 25.59% of the total area. It indicates a substantial increase of 18.04% in the built-up area from 1991 to 2021 (Figure 5). The predicted cumulative change in water area between 1991 and 2021 was roughly −0.03 km2. Specifically, the water area was 7.93 km2 in 1991 and 7.90 km2 in 2021. There was no discernible alteration in the extent of the water surface between 1991 and 2021 (Figures 4, 5).
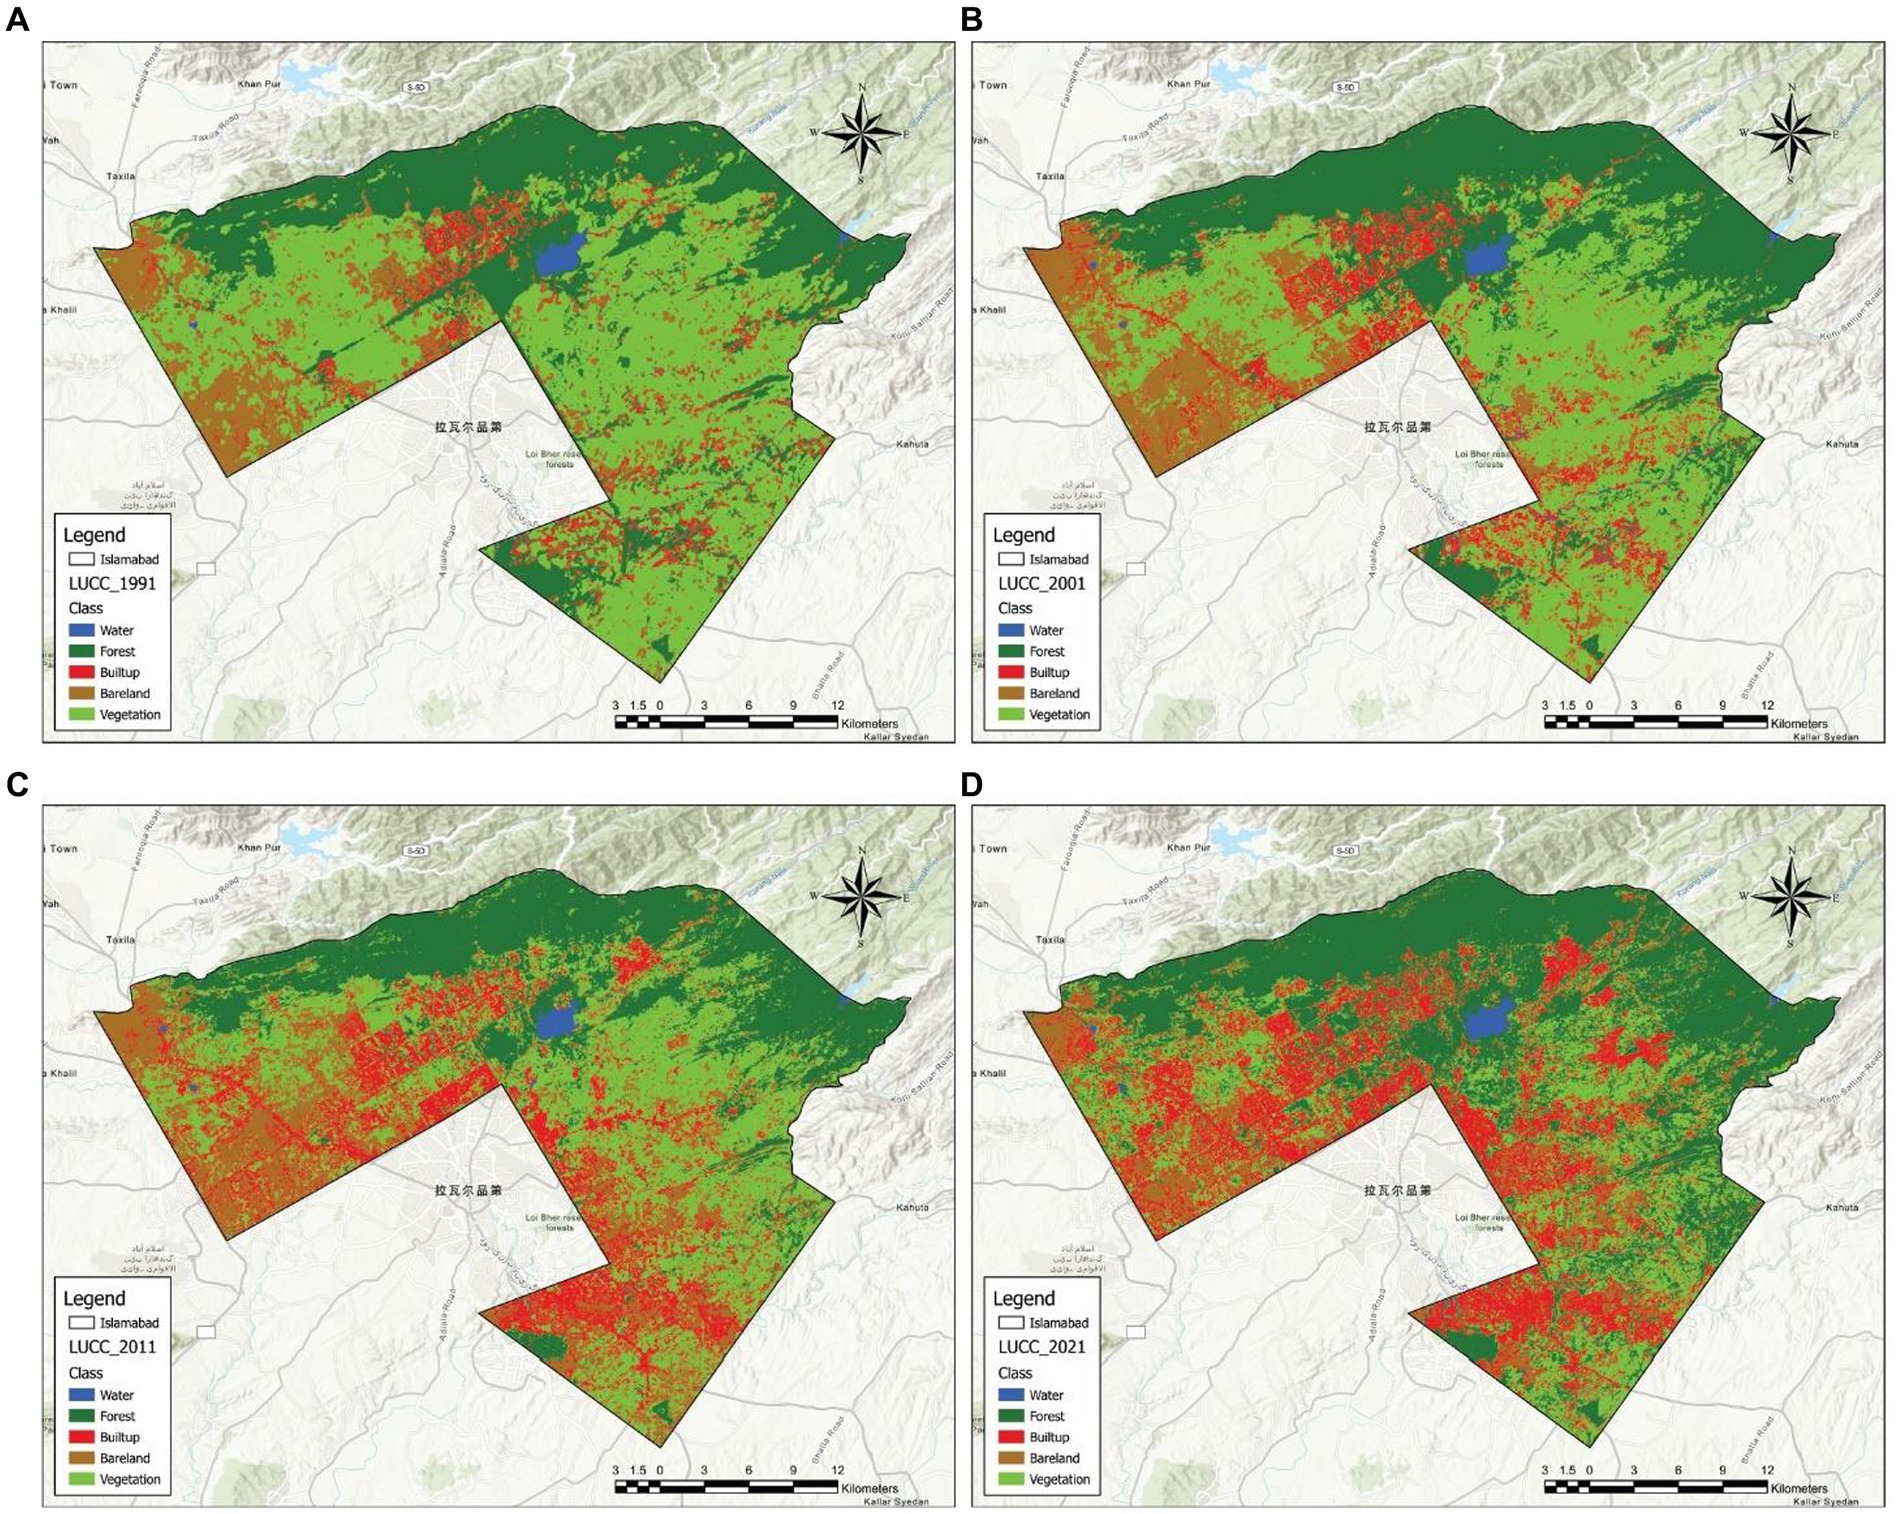
Figure 4. The land use map of the capital territory of Islamabad region in (A) 1991, (B) 2001, (C) 2011, (D) 2021.
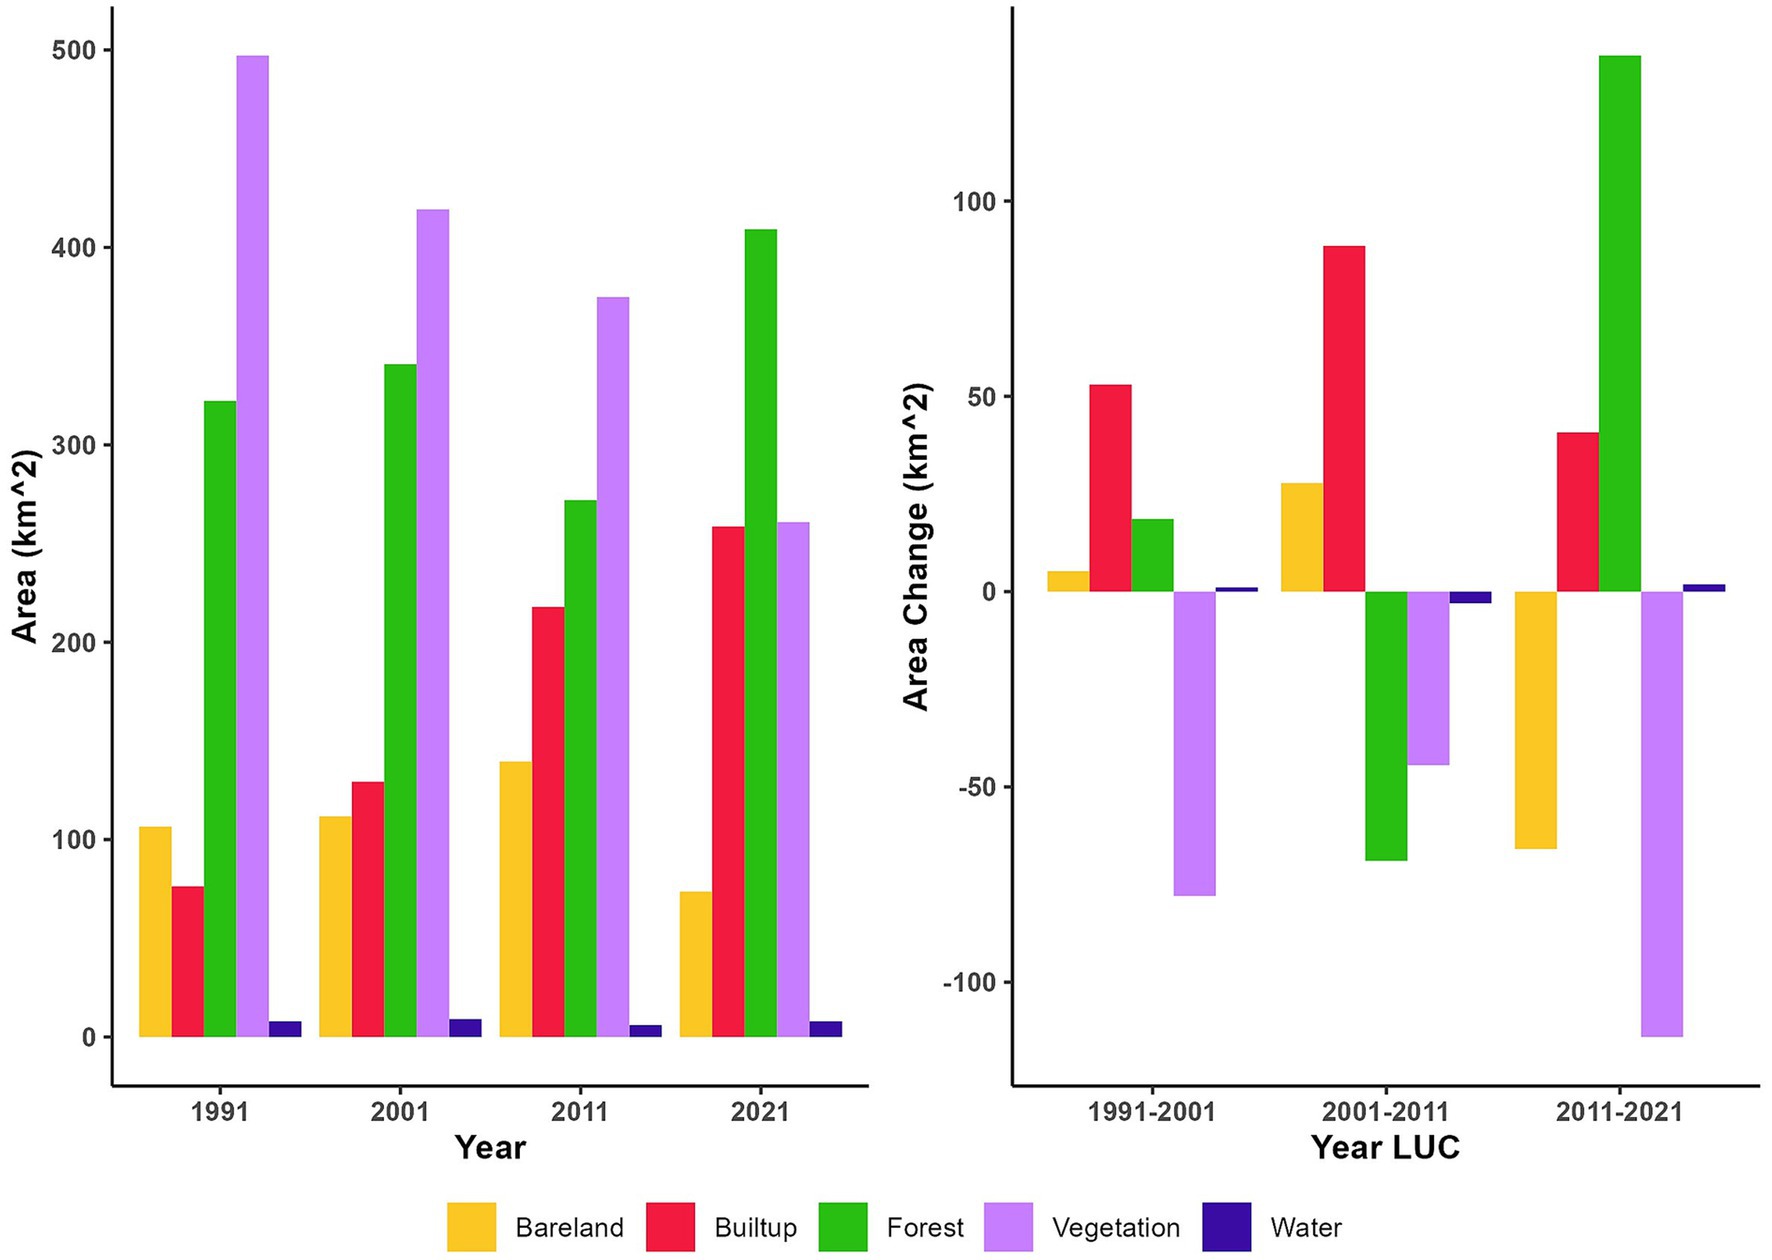
Figure 5. LULC area coverage (km2) of Islamabad during 1991–2021.
Land use change models, particularly the LCM, were applied to LULC maps (1991–2021) to predict net changes, including gains and losses, across different classes, aiming to show spatial and temporal variations (Figure 6). Transformations are categorized into loss, gain, and net change, with gains calculated from persistence and column totals, and losses from row totals and persistence. Significant impacts were noted on vegetation and bare land distribution. Forests recorded the highest gains (2011–2021), while the largest vegetation losses occurred between 1991 and 2001 and 2011 and 2021, with forests also experiencing losses (2001–2011). Built-up areas expanded, between 2001 and 2011, whereas barren land observed gains and losses in the same periods, respectively. Water bodies had minimal changes. Overall, there was a decline in vegetation cover and bare land, against an increase in urban land use, highlighting significant shifts in Islamabad’s LULC, with increased forest and built-up areas and decreased vegetation and bare land.
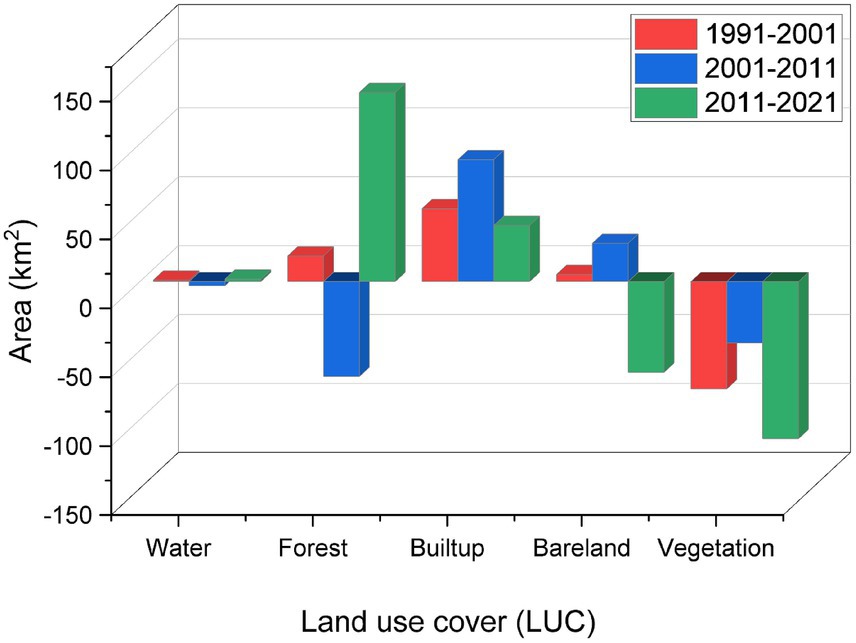
Figure 6. Gain and loss area of the LULC class in 1991–2001, 2001–2011, and 2011–2021.
The model generated transition probability matrices (TPM) to represent the changes between LULC types during three time periods: 1991–2001, 2001–2011, and 2011–2021 (Supplementary Table S6; Figure 7). During 1991–2001 the highest conversion rate was observed for vegetation to forest (55.56 ha), built-up (56.80 ha), and barren land (49.95 ha) (Figure 8). At the same time, barren land was significantly converted to the built-up area (23.71 ha). Between 2001 and 2011, vegetation was observed to convert to built-up (87.58 ha) and barren land (56.35 ha), while barren land was dominantly converted to built-up (34.49 ha). However, the forest was considerably converted to vegetation (62.74 ha). From 2011 and 2021, vegetation was significantly converted to forest (131.62 ha) and built-up (61.96 ha), barren land was converted to built-up (57.33 ha) and vegetation (40.85 ha). Overall, the highest conversion during 1991–2021 was observed for vegetation to built-up (142.44 ha) and forest (125.30 ha), respectively.
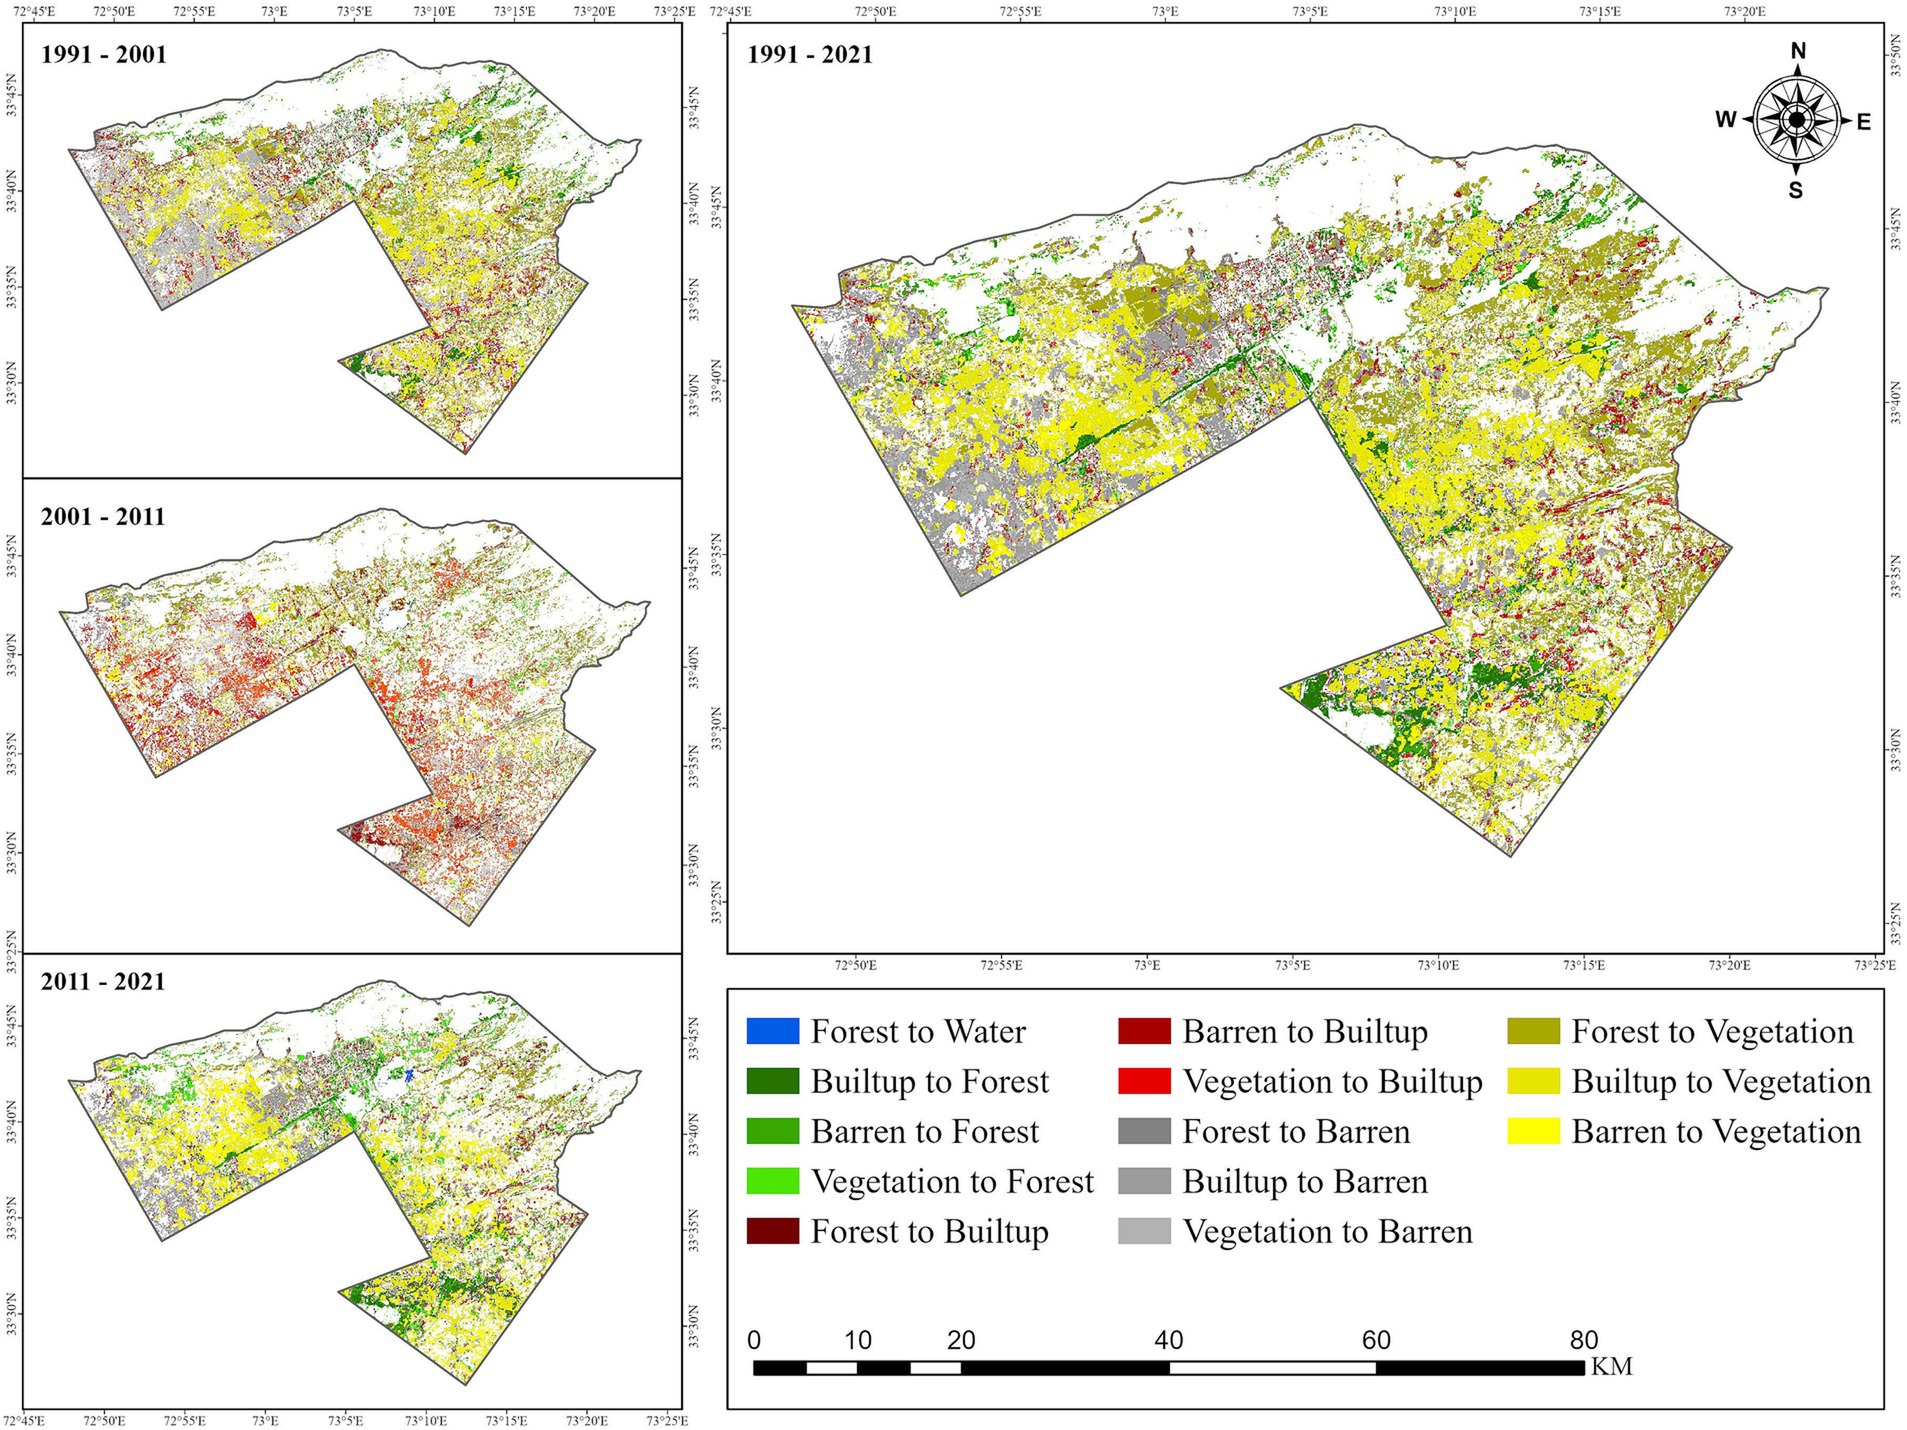
Figure 7. LULC changes in Islamabad from 1991 to 2021.
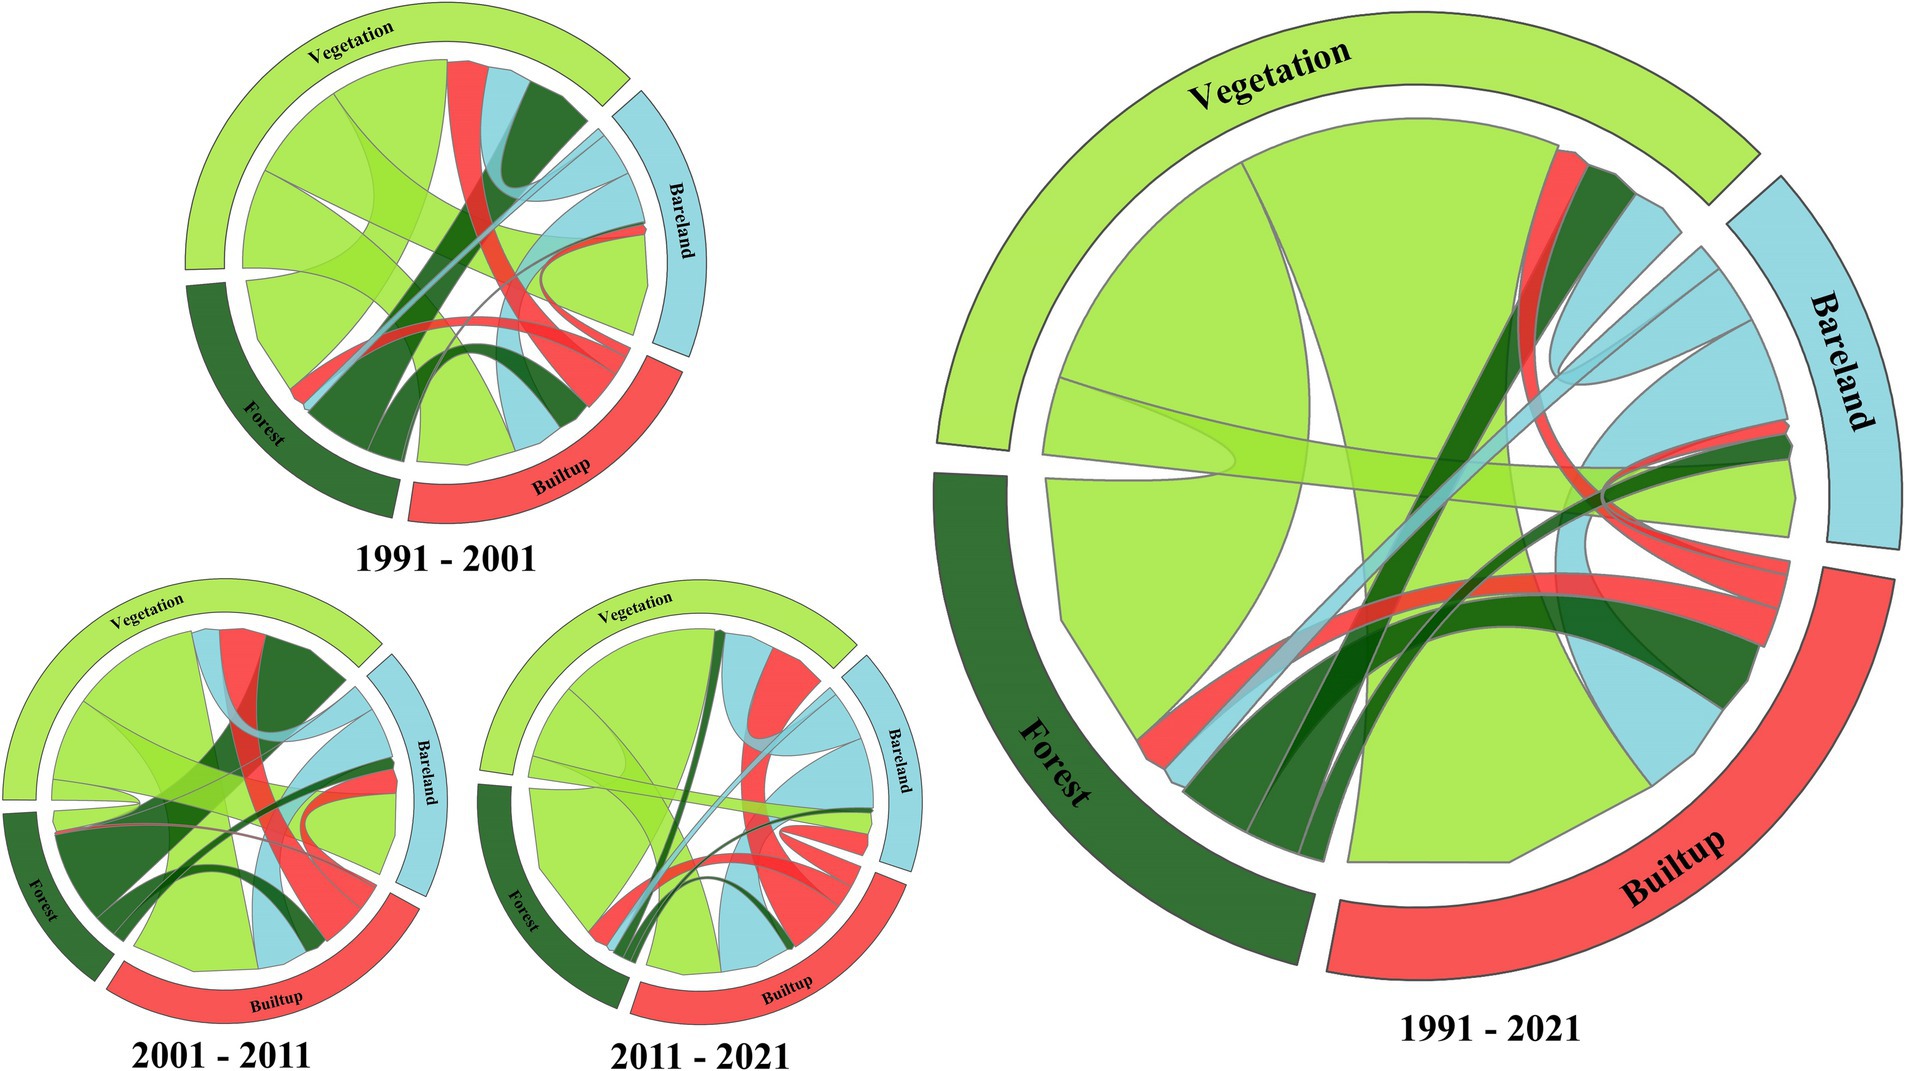
Figure 8. Transition area matrix of LULC classes between 1991 and 2021.
The construction of a future LULC map involves key stages, starting with the application of a Markov chain technique to formulate a prospective land change matrix based on results analysis. Significant changes in simulated land use for 2011 include a 0.22 probability of transitioning from bare land to built-up areas and a 0.11 probability of transitioning from vegetation to forest (Table 2). In 2021, significant changes were identified, particularly a predicted shift from bare land to built-up areas (probability of 0.11) and bare land to vegetation (likelihood of 0.13). The predicted map correlated strongly with the actual area distribution, as indicated in Supplementary Table S7.
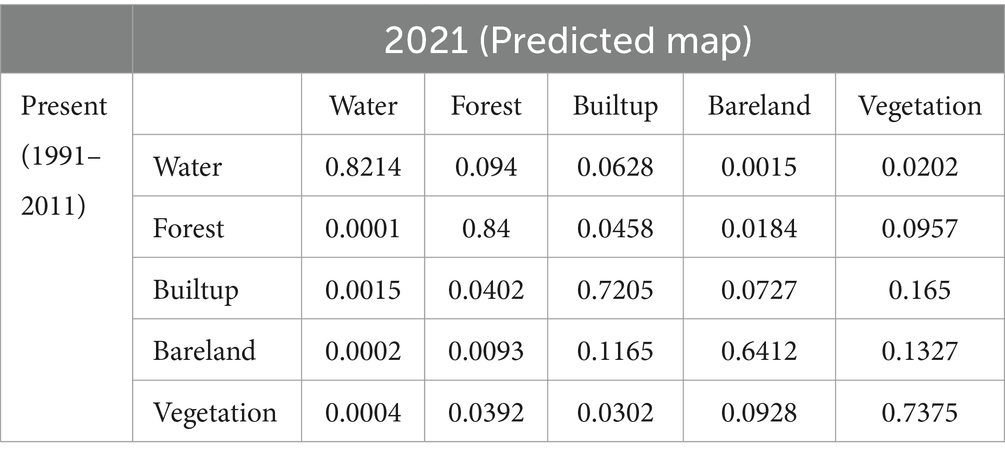
Table 2. Transition probabilities matrix for 2011 and 2021.
Prior to predictions, maps from 1991 to 2001 and 2001 to 2011 were analyzed to generate historical and present predictive models for 2011 and 2021, respectively. Subsequent projections for 2031, 2041, and 2051 were formulated using probability and transition area matrices derived from a Markov chain model (Table 3; Figure 9). This analysis revealed a progressive increase in the transition of vegetation to forest, with probabilities of 35% in 2031, escalating to 56% by 2051. A similar upward trend was observed in the conversion of vegetation to built-up areas, with projected probabilities rising from 16% in 2031 to 20% in 2041, before slightly decreasing to 19% in 2051. Conversely, the transition from bare land to built-up areas demonstrated a declining trend within the same period. The transition probability matrix facilitated an assessment of the predicted percentage changes in land cover from 2021 to 2051, revealing a significant shift toward predominance in built-up land (Figure 8; Table 4). The data indicated a continuous increase in built-up land, growing from 25.59% in 2021 to 36.76% in 2051, primarily due to the conversion of vegetation, barren, and forested areas. Despite an initial increase in forested areas by 40.50% from 1991 to 2021, a subsequent decline was projected through to 2051, resulting in a decrease to 36.88%. Similarly, undeveloped areas were consistently diminishing from 2011 to 2050. The study mapped the spatial extent of five LULC classes for historical (1991, 2001, 2011, and 2021) and projected years (2031, 2041, and 2051), indicating a notable evolution in land use patterns over the projected period (Figure 9).
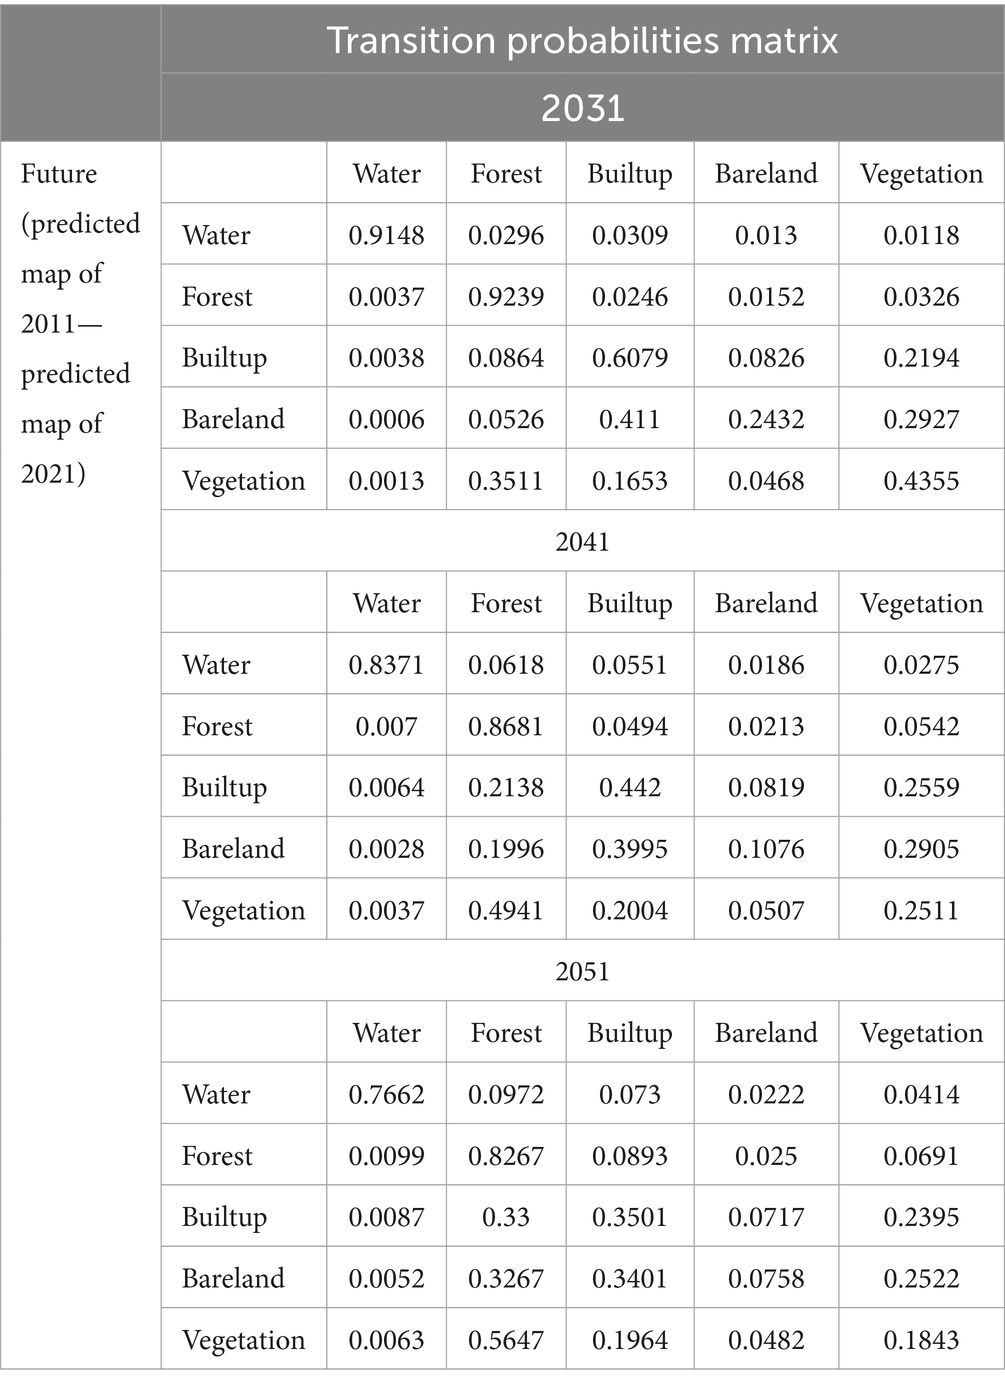
Table 3. Transition probabilities matrix for 2031, 2041, and 2051.
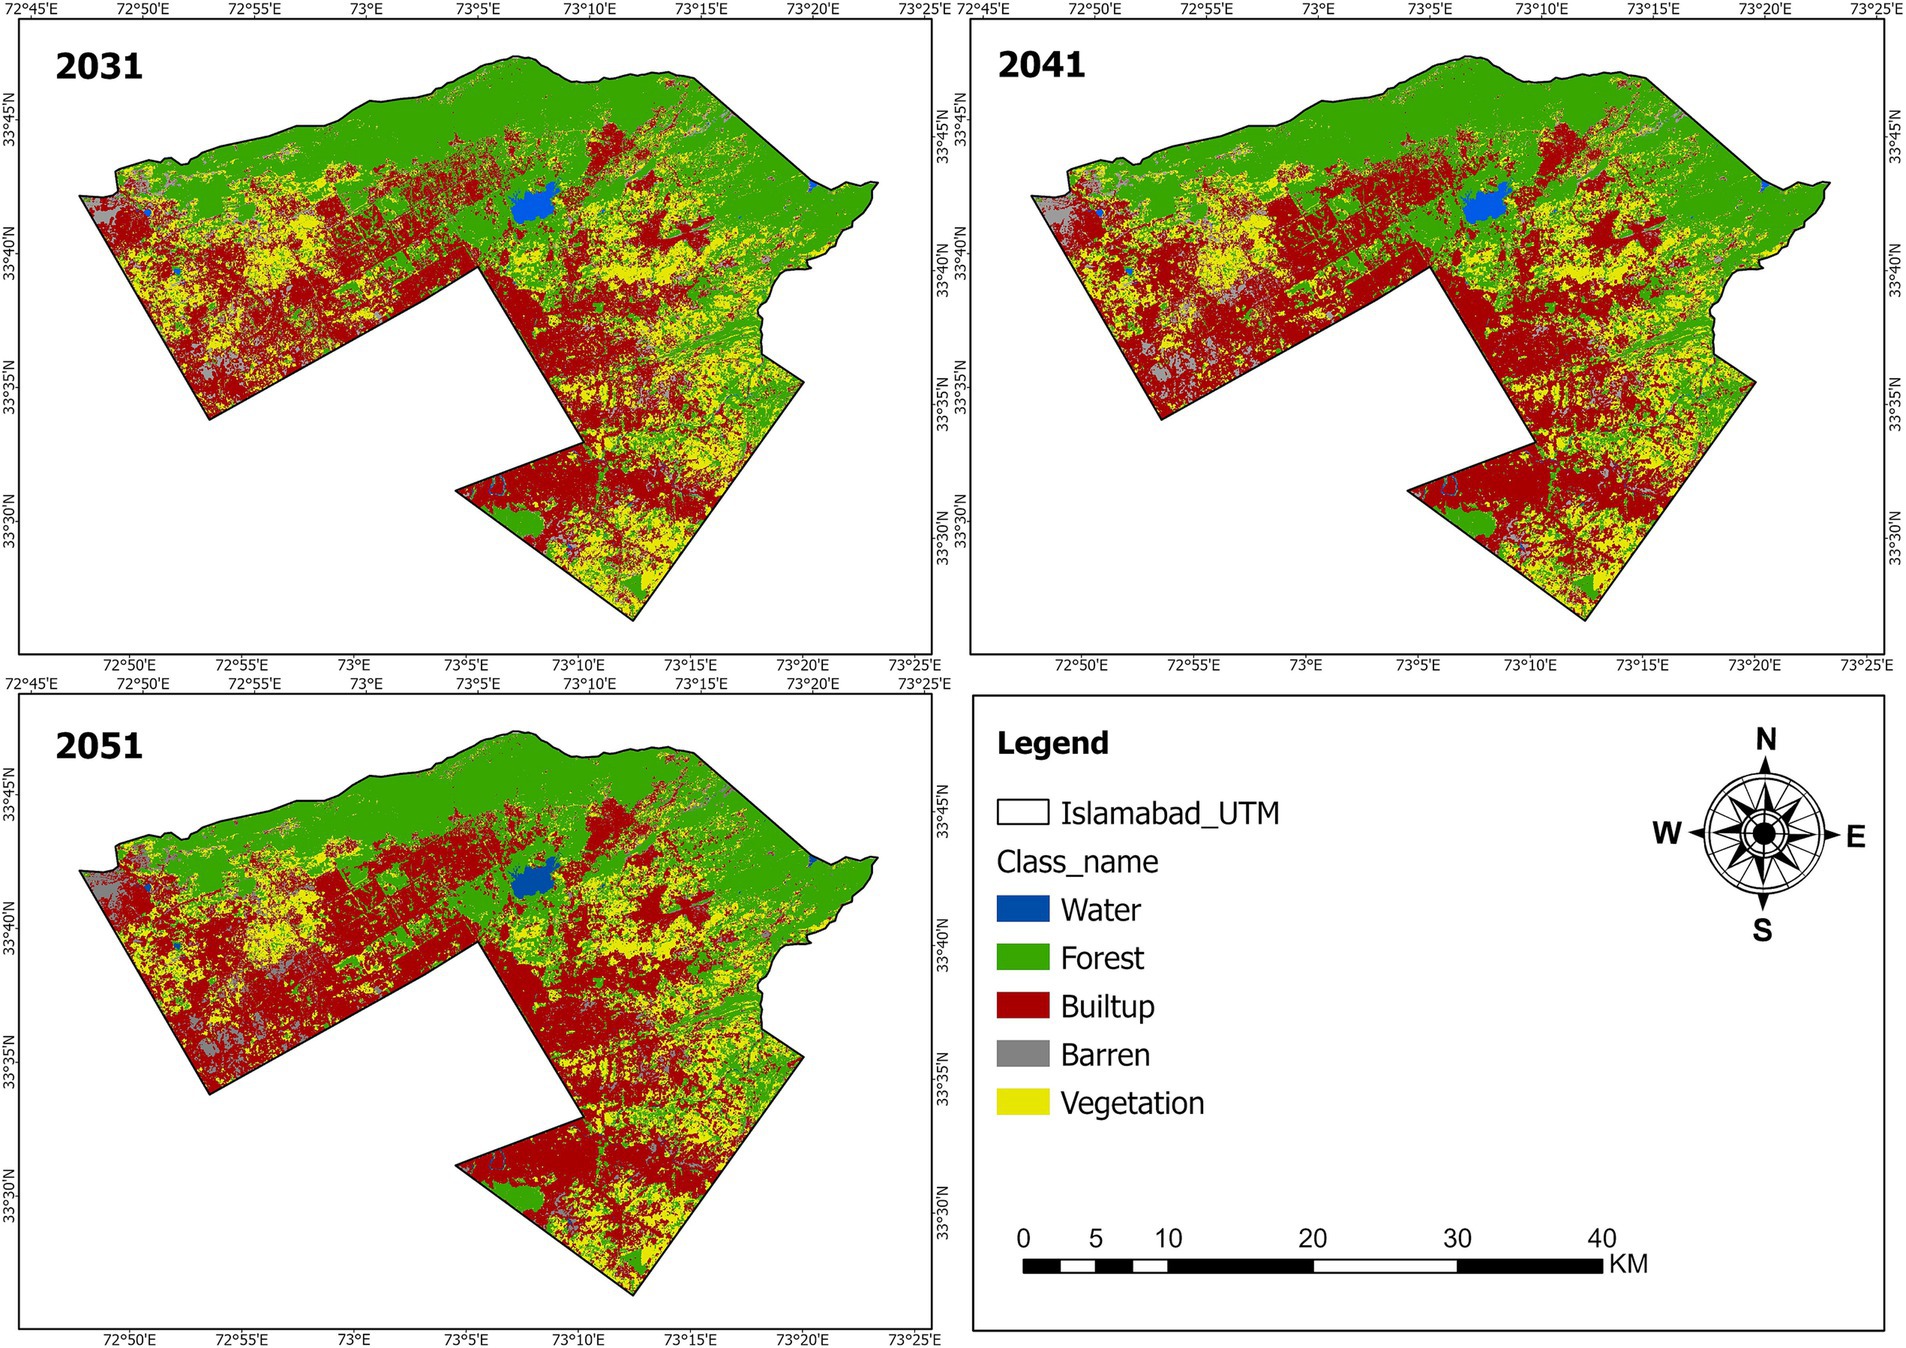
Figure 9. Predicted LULC classification maps of Islamabad of 2031, 2041, and 2051.
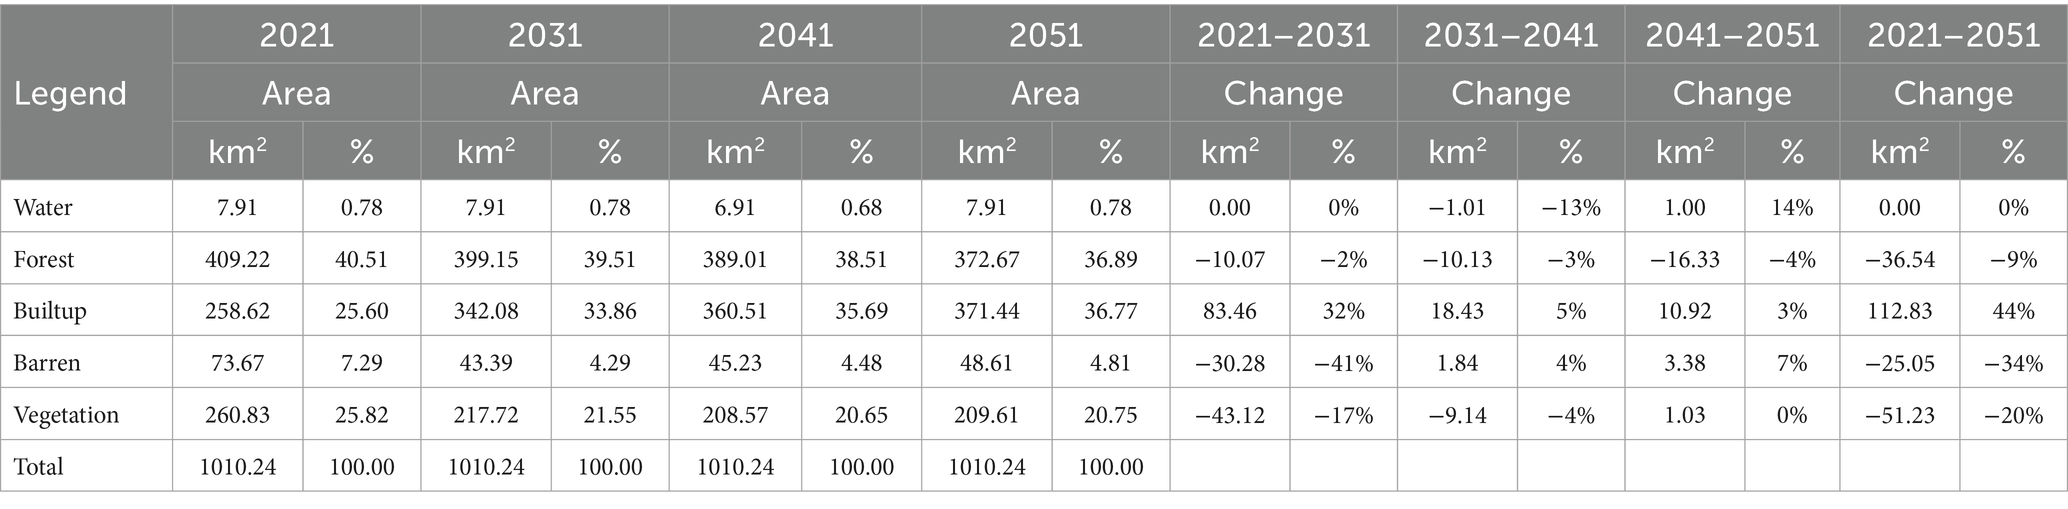
Table 4. Area coverage, percentage, and change of LULC in Islamabad of predicted maps for 2031, 2041, and 2051.
Using MLP-NN, a widely used machine learning technique, to identify complicated patterns and behaviors (Albuquerque et al., 2005; Reitz, 2006). The model, with input, hidden, and output layers detailed in Table 5, achieved significant optimal results. The MLP-MC model, with seven input nodes, eight hidden nodes, and nine output nodes, delivered the highest accuracy. Analyzing each driving variable’s impact on MLP-NN performance, we employed sensitivity analysis across 10,000 iterations. Utilizing unique methods, the study showcased proficiency, with 0.8821 skill and 89.08% accuracy, verifying the model’s reliability in categorizing unknown pixels based on optimized weights and training dataset patterns.
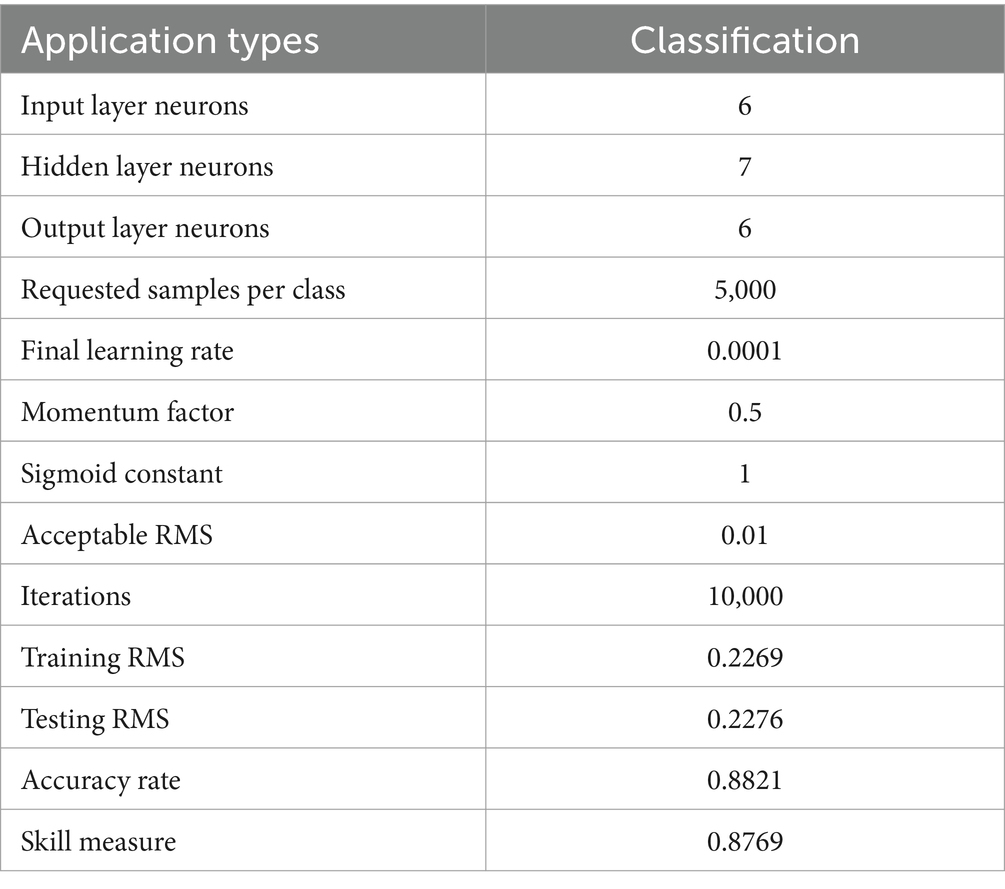
Table 5. Parameter and model performance result.
As part of our study, we assessed how independent variables interact in our study, maintaining each constant during model evaluation. Supplementary Table S8 reveals patterns, showing a 22.67% accuracy reduction when keeping evidence likelihood constant. This factor emerged as crucial in our study, aligning with previous research (Leta et al., 2021). Despite its impact, our model remained effective, emphasizing the importance of recognizing biophysical properties in understanding environmental dynamics.
The specific effects of individual independent variables to analyzed the effects of individual independent variables by isolating one while keeping others constant, revealing unique characteristics. Supplementary Table S9 reveal Significant accuracy and skill metric variations, except for the initial attempt with unrestricted variables. The methodology provided insight into interaction effects and intercorrelations among input variables, consistent with prior discussions (Ozturk, 2015).
A training method is used in which all variables are examined at the beginning and used consistently throughout training. To assess which pair may have the least impact on the model’s proficiency if included or excluded, hold each variable constant. When some variables are removed from the equation, the model’s skill increases slightly. This method identified pairs of variables whose joint removal had little effect on model performance. Due to variable interactions, this iterative approach can comprehensively evaluate model performance. Since the model skill variance was negligible, all factors in Supplementary Table S10 were used in this investigation (Girma et al., 2022).
By using the Validate module in TerrSet, to validate the MLP, CA-MC model, it was initially employed to simulate the land cover patterns in 2011 (T’3) by utilizing the land cover maps from 1991 (T’1) and 2001 (T’2). Subsequently, the model was further used to simulate the land cover patterns in 2021 (T’4) by utilizing the land use maps from 2001 (T’2) and 2011 (T’3). The Kappa statistic was calculated to assess the compatibility between the simulated quantities and locations and the reference maps from 2011 and 2021. According to the overall Kappa statistics. The Kno = 78%, the Klocation = 80%, the KlocationStrata = 80%, and the Kstandard is 72%. Figure 10 illustrates the distribution of agreement and disagreement factors, along with an overall correctness of 88.2% for MLP-CA-MC. Validation results, consistently exceeding 80%, indicate robust agreement between observed and projected LULC layers. Post-validation, the model was prepared for predicting land use changes in 2031, 2041, and 2051, showcased in Figure 9. The ROC measure gauged the model’s predictive ability regarding the continuous surface distribution of a Boolean variable, emphasizing soft prediction evaluation.
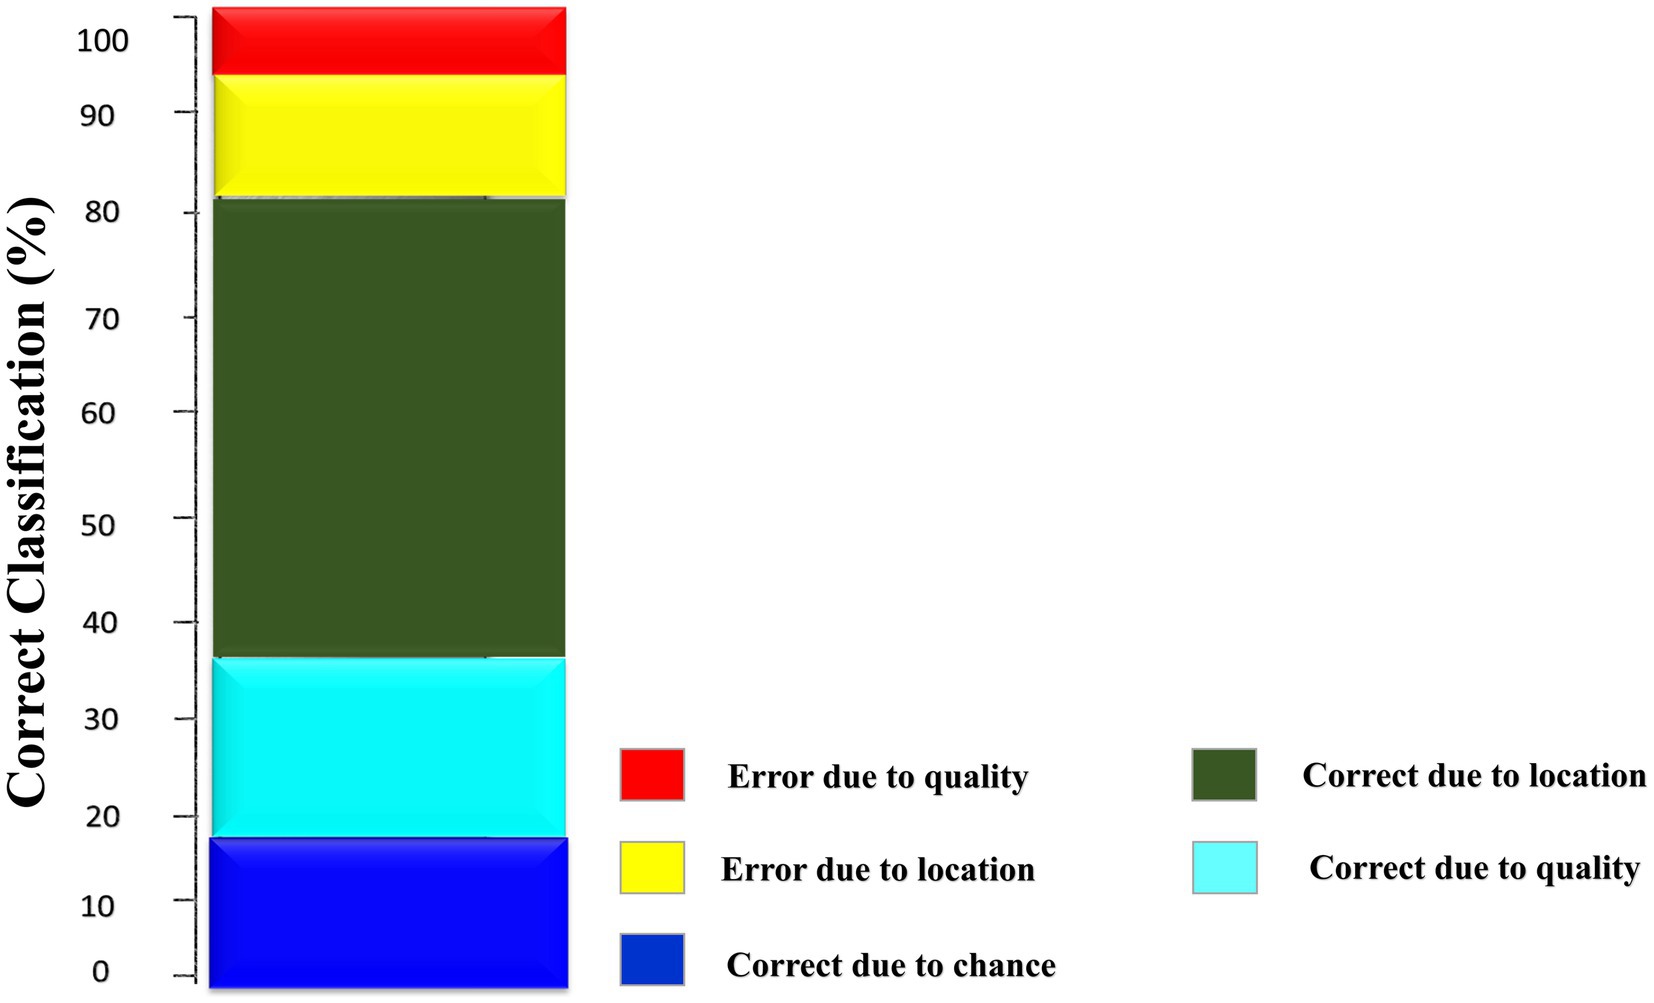
Figure 10. Successes and errors of the simulation.
The use of GIS tools and machine learning algorithms to predict future LULC patterns has been studied in several studies. In our study, Google Earth Engine (GEE) was used to evaluate LULC changes across four time periods (1991, 2001, 2011, and 2021). Additionally, the Cellular Automata-Markov model was used to predict LULC changes in 2031, 2041, and 2051. Over 90% precision was consistently achieved over four distinct time periods. Accordingly, the results of Gharaibeh et al. (2020), Girma et al. (2022), Abbas et al. (2023), and Uddin et al. (2023) align with the findings of our study, indicating that all categories of producers were categorized with an accuracy rate over 85%. Consistently high accuracy across various studies supports the validity of the supervised classification method employed. A study conducted by Dewan and Yamaguchi (2009), that the minimum level of accuracy achieved across all parameters measured was 85.6% using the Multispectral Scanner (MSS) data. Another study Kayiranga et al. (2016) reported that all images from 1986 to 2015, the accuracy and Kappa coefficient values were over 75%. In the present investigation, within the four-time intervals of 1991, 2001, 2011, and 2021, the Kappa coefficients exhibited values exceeding 0.86% across all categories. Similar findings were observed in the study conducted by Martinez del Castillo et al. (2015) where they examined the Kappa coefficients exceeded 0.8 for all forest classifications.
Changes in LULC have significantly affected the distribution of vegetation, bare land, forests, and built-up areas within the study area. Vegetation represents the largest portion of land usage and has declined significantly. Islamabad’s built-up areas and forests significantly increased from 1991 to 2021, while vegetation and bare land decreased dramatically. Mannan et al. (2021) also reported that since 1990, Islamabad’s built-up area has increased. Rural residents move to urban areas for several reasons, such as pursuing education, finding work or opening businesses (Mannan et al., 2021). Urban growth is a result of governmental policies and real estate development (Hassan et al., 2016). A gradual decline in barren land and vegetation area was observed between 1991 and 2021. Also, Mannan et al. (2021) found a decline in both barren and agricultural land in Islamabad between 1990 and 2020, with an annual reduction rate of 0.25 and 1.24%, respectively. A recent study conducted by Habte et al. (2021) in Ethiopia revealed a decline in the extent of bare land resulting from land restoration efforts in the country’s northeastern region from 1984 to 2005. The findings of our study indicate a general upward trend in the extent of forested land in Islamabad for the period spanning from 1991 to 2021. The present finding aligns with the research conducted by Mannan et al. (2021). Since 1990, the forested area of Islamabad has been preserved and has shown a growth rate of 0.92% annually. Forested areas within Islamabad expanded from 2011 to 2021 due to effective management strategies and law enforcement measures implemented by the forest management department. According to Chen and Liu (2005) and Ioja et al., (2020) Forest conservation regulations in urban areas can contribute to the creation of diverse protected zones, such as green belts, research centers, and botanical gardens. Margallah Hills National Park (MHNP) near Islamabad is an example of urban forest preservation (Ahmed et al., 2023). Furthermore, it is worth noting that Islamabad is also home to an increasing number of green belts, roadside plantations, and botanical gardens as highlighted by Shinwari and Khan (2000) The forest policies implemented by the federal government in Islamabad account for the increase in forested areas.
The Markov chain and MLP neural network techniques in LCM provide insights into the magnitude and spatial distribution of change in LULC prediction, respectively (Hepinstall et al., 2008). All of the kappa index values in the study surpass the acceptable threshold of 80% (Mandrekar, 2010; Gharaibeh et al., 2020). Indicating a high level of agreement between the simulated and observed LULC maps. Besides that, a highly satisfactory Area Under the Curve (AUC) value of 0.88 was achieved (Mandrekar, 2010). According to our analysis, significant urbanization is projected for the region by 2031, 2041, and 2051, with vegetation and barren land converting to built-up areas during the study period. The study results indicate massive urban expansion, replacing other land cover forms. The CA-MC model predicts expansion to cover approximately 371.44 km2 by 2051, representing a net increase of 112.83 km2 compared to land cover in 2021 (Figures 4, 9). Additionally, forested areas are expected to experience a minor reduction in coverage due to built-up area expansion. Overall, rapid population growth drives urban expansion, contributing to forest loss. The findings of this study align with the results reported by Samie et al. (2017) which indicate that the expansion of built-up areas is followed by continuous reduction in other land use categories, such as forests, both now and in the future. Alsharif et al. (2022) Under the CA-MC prediction model, built-up area continues to increase as other land uses decrease. Dey et al. (2021) A combination of multi-layer perceptron (MLP) and Markov chain (MC) modeling techniques was used to analyze LULC change dynamics in Rajshahi, Bangladesh, for 2000–2020 and 2020–2040. Overall, the findings predict a 30% urban expansion by 2030, with a 17% decrease in green cover. However, urban areas are predicted to increase in our study area as green cover decreases (−36.55 km2).
In this study, we used Random Forest algorithms, Cellular Automata, and Markov Chain models to predict changes in LULC. For better land use and land cover classification and future prediction using Landsat data from 1991 to 2021, satellite remote sensing is an efficient means of generating large-scale land use and land cover data. Furthermore, Random Forest can only capture certain aspects of complex urban environments. Meanwhile, The Cellular Automata and Markov Chain models use simplified dynamics. While the study predicted changes up to 2051, longer-term forecasts could face significant uncertainties due to unforeseen socio-economic and environmental changes. LULC classification and urban growth are two areas that should be explored further, according to this study. Higher resolution and more recent satellite data, notably from the Sentinel series, are crucial to improving LULC classifications and urban growth predictions. Using advanced deep learning techniques and neural networks could also yield more precise urban expansion forecasts. Future research should also integrate socioeconomic data. Urban dynamics can be better understood by incorporating population growth, economic development, and land use policies into models. Moreover, analyzing various urban development scenarios beyond 2051 would provide valuable insights for long-term urban planning and sustainability. The field is still underexplored.
The objective of this study was to assess the LULC changes and forecast the future land use patterns of the metropolitan area Islamabad of Pakistan. The study employs Landsat satellite imagery from 1991–2021 to derive LULC maps and changes are examined to estimate urban growth. Further the CA-Markov model was used to estimate the future land cover changes in the Metropolitan area. The analysis utilizes the multi-layer perceptron (MLP) and Markov chain (MC) modeling methodologies. The findings unveiled a significant advancement in socioeconomic conditions. The process of urban expansion resulted in the depletion of vegetation, including both barren and forest areas. The results of the simulation conducted for the projected time frame of 2021–2051 indicate a significant decrease in the extent of vegetation, bare land, and forested areas, with reductions of 51.22, 25.05, and 36.53 km2, respectively. The land covered by vegetation is subject to significant effect, resulting in a projected drop from 260.83 to 209.60 km2. According to the Metropolitan Comprehensive Plan (MCA), there is a significant level of urban expansion projected, amounting to approximately 371.44 square kilometers by the year 2051. This expansion is expected to result in a net increase of 112 km2 between the years 2021 and 2051. The results obtained from this research possess the capacity to provide valuable perspectives for policymakers in developing efficient approaches for future urban land utilization planning and administration. Furthermore, the study also underscored the urgent need for reformation of urban planning and urban forest practices in order to safeguard the visual attractiveness of the city and guarantee the overall conservation of green areas. A noteworthy benefit of this study is its utilization of an extensive time range, which enabled a thorough assessment of changes in LULC within the study area. This holds special significance considering the constrained availability of reports within this specific setting.
The raw data supporting the conclusions of this article will be made available by the authors, without undue reservation.
MB: Conceptualization, Software, Writing – original draft, Formal analysis, Methodology, Validation. KH: Writing – review & editing, Visualization. AR: Writing – review & editing, Data curation. KM: Data curation, Writing – review & editing. BM: Data curation, Writing – review & editing. RW: Data curation, Writing – review & editing. RS: Data curation, Writing – review & editing. MK: Data curation, Writing – review & editing. JM: Writing – review & editing, Funding acquisition, Supervision, Writing – original draft.
The author(s) declare financial support was received for the research, authorship, and/or publication of this article. This research was funded by the National Natural Science Foundation of China (32271871).
The authors declare that the research was conducted in the absence of any commercial or financial relationships that could be construed as a potential conflict of interest.
All claims expressed in this article are solely those of the authors and do not necessarily represent those of their affiliated organizations, or those of the publisher, the editors and the reviewers. Any product that may be evaluated in this article, or claim that may be made by its manufacturer, is not guaranteed or endorsed by the publisher.
The Supplementary material for this article can be found online at: https://www.frontiersin.org/articles/10.3389/ffgc.2024.1345047/full#supplementary-material
Abbas, H., Tao, W., Khan, G., Alrefaei, A. F., Iqbal, J., Albeshr, M. F., et al. (2023). Multilayer perceptron and Markov chain analysis based hybrid-approach for predicting land use land cover change dynamics with Sentinel-2 imagery. Geocarto Int. 38:2256297. doi: 10.1080/10106049.2023.2256297
Ahmed, H., Jallat, H., Hussain, E., Saqib, N., Saqib, Z., Khokhar, M. F., et al. (2023). Quantitative assessment of deforestation and Forest degradation in Margalla Hills National Park (MHNP): employing Landsat data and socio-economic survey. Forests 14:201. doi: 10.3390/f14020201
Aksoy, H., and Kaptan, S. (2021). Monitoring of land use/land cover changes using GIS and CA-Markov modeling techniques: a study in northern Turkey. Environ. Monit. Assess. 193:507. doi: 10.1007/s10661-021-09281-x
Aksoy, H., and Kaptan, S. (2022). Simulation of future forest and land use/cover changes (2019–2039) using the cellular automata-Markov model. Geocarto Int. 37, 1183–1202. doi: 10.1080/10106049.2020.1778102
Aksoy, H., Kaptan, S., Varol, T., Cetin, M., and Ozel, H. B. (2022). Exploring land use/land cover change by using density analysis method in Yenice. Int. J. Environ. Sci. Technol. 19, 10257–10274. doi: 10.1007/s13762-021-03847-5
Albuquerque, A. C. M. L., Melo, J. D., and Dória Neto, A. D. (2005). “Evolutionary computation and parallel processing applied to the Design of Multilayer Perceptrons” in Evolvable machines. Vol 161. Part of the Studies in Fuzziness and Soft Computing series. Berlin, Heidelberg: Springer.
Alsharif, M., Alzandi, A. A., Shrahily, R., and Mobarak, B. (2022). Land use land cover change analysis for urban growth prediction using Landsat satellite data and Markov chain model for Al Baha region Saudi Arabia. Forests 13:1530. doi: 10.3390/f13101530
Article, O. (2021). Combining Landsat-8 spectral bands with ancillary variables for land cover classification in mountainous terrains of northern Pakistan. J. Mt. Sci. 18, 2388–2401. doi: 10.1007/s11629-020-6548-7
Asare, Y. M., Forkuo, E. K., Forkuor, G., and Thiel, M. (2020). Evaluation of gap-filling methods for Landsat 7 ETM+ SLC-off image for LULC classification in a heterogeneous landscape of West Africa. Int. J. Remote Sens. 41, 2544–2564. doi: 10.1080/01431161.2019.1693076
Ayele, G., Hayicho, H., and Alemu, M. (2019). Land use land cover change detection and deforestation modeling: in Delomena District of bale zone, Ethiopia. J. Environ. Prot. 10, 532–561. doi: 10.4236/jep.2019.104031
Badshah, M. T., Ahmad, A., Muneer, M. A., Rehman, A. U., Wang, J., Khan, M. A., et al. (2020). Evaluation of the forest structure, diversity and biomass carbon potential in the southwest region of Guangxi, China. Appl. Ecol. Environ. Res. 18, 447–467. doi: 10.15666/aeer/1801_447467
Breiman, L. (2002). Manual on setting up, using, and understanding random forests v3. 1. Tech. Report, University of California, Department of Statistics: Berkeley, CA. Available at: http://oz.berkeley.edu/users/breiman
Butt, A., Shabbir, R., Ahmad, S. S., and Aziz, N. (2015). Land use change mapping and analysis using remote sensing and GIS: a case study of Simly watershed, Islamabad, Pakistan. Egypt. J. Remote Sens. Sp. Sci. 18, 251–259. doi: 10.1016/j.ejrs.2015.07.003
Cánovas-García, F., Alonso-Sarría, F., Gomariz-Castillo, F., and Oñate-Valdivieso, F. (2017). Modification of the random forest algorithm to avoid statistical dependence problems when classifying remote sensing imagery. Comput. Geosci. 103, 1–11. doi: 10.1016/j.cageo.2017.02.012
Chen, X. W., and Liu, M. (2005). Prediction of protein-protein interactions using random decision forest framework. Bioinformatics 21, 4394–4400. doi: 10.1093/bioinformatics/bti721
Chen, F., Yang, S., Yin, K., Zhao, X., and Chan, P. (2015). Making full use of the Landsat7 SLC-off ETM+ data for urban thermal environment monitoring, in: ICSDM 2015 - proceedings 2015 2nd IEEE International Conference on Spatial Data Mining and Geographical Knowledge Services. Fuzhou, China.
Chettry, V., and Surawar, M. (2021). Assessment of urban sprawl characteristics in Indian cities using remote sensing: case studies of Patna, Ranchi, and Srinagar. Environ. Dev. Sustain. 23, 11913–11935. doi: 10.1007/s10668-020-01149-3
Choate, M. J., Rengarajan, R., Storey, J. C., and Lubke, M. (2021). Geometric calibration updates to landsat 7 ETM+ instrument for landsat collection 2 products. Remote Sens. 13:1638. doi: 10.3390/rs13091638
Civco, D. L. (1993). Artificial neural networks for land-cover classification and mapping. Int. J. Geogr. Inf. Syst. 7, 173–186. doi: 10.1080/02693799308901949
Coomes, O. T., Lambin, E. F., Turner, B. L., Geist, H. J., Agbola, S. B., Angelsen, A., et al. (2001). The causes of land-use and land-cover change: moving beyond the myths the causes of land-use and land-cover change: moving beyond the myths Helle Sk a. Glob. Environ. Chang. 11, 261–269. doi: 10.1016/S0959-3780(01)00007-3
De Sousa, C., Fatoyinbo, L., Neigh, C., Boucka, F., Angoue, V., and Larsen, T. (2020). Cloud-computing and machine learning in support of country-level land cover and ecosystem extent mapping in Liberia and Gabon. PLoS One 15:e0227438. doi: 10.1371/journal.pone.0227438
Dewan, A. M., and Yamaguchi, Y. (2009). Land use and land cover change in greater Dhaka, Bangladesh: using remote sensing to promote sustainable urbanization. Appl. Geogr. 29, 390–401. doi: 10.1016/j.apgeog.2008.12.005
Dey, N. N., Al Rakib, A., Kafy, A.Al, and Raikwar, V. (2021). Geospatial modelling of changes in land use/land cover dynamics using multi-layer perception Markov chain model in Rajshahi City, Bangladesh. Environ. Chall. 4:100148. doi: 10.1016/j.envc.2021.100148
El-Hallaq, M. A., and Habboub, M. O. (2015). Using cellular automata-Markov analysis and multi criteria evaluation for predicting the shape of the Dead Sea. Adv. Remote Sens. 4, 83–95. doi: 10.4236/ars.2015.41008
Fahad, S., Li, W., Lashari, A. H., Islam, A., Khattak, L. H., and Rasool, U. (2021). Evaluation of land use and land cover Spatio-temporal change during rapid urban sprawl from Lahore, Pakistan. Urban Clim. 39:100931. doi: 10.1016/j.uclim.2021.100931
Fathizad, H., Rostami, N., and Faramarzi, M. (2015). Detection and prediction of land cover changes using Markov chain model in semi-arid rangeland in western Iran. Environ. Monit. Assess. 187:629. doi: 10.1007/s10661-015-4805-y
Foley, J. A., DeFries, R., Asner, G. P., Barford, C., Bonan, G., Carpenter, S. R., et al. (2005). Global consequences of land use. Science 309, 570–574. doi: 10.1126/science.1111772
Gashaw, T., Bantider, A., and Mahari, A. (2014). Evaluations of land use/land cover changes and land degradation in Dera District, Ethiopia: GIS and remote sensing based analysis. Int. J. Sci. Res. Environ. Sci. 2, 199–208. doi: 10.12983/ijsres-2014-p0199-0208
Gharaibeh, A., Shaamala, A., Obeidat, R., and Al-Kofahi, S. (2020). Improving land-use change modeling by integrating ANN with cellular automata-Markov chain model. Heliyon 6:e05092. doi: 10.1016/j.heliyon.2020.e05092
Gidey, E., Dikinya, O., Sebego, R., Segosebe, E., and Zenebe, A. (2017). Cellular automata and Markov chain (CA_Markov) model-based predictions of future land use and land cover scenarios (2015–2033) in Raya, northern Ethiopia. Model. Earth Syst. Environ. 3, 1245–1262. doi: 10.1007/s40808-017-0397-6
Giglioni, V., García-Macías, E., Venanzi, I., Ierimonti, L., and Ubertini, F. (2021). The use of receiver operating characteristic curves and precision-versus-recall curves as performance metrics in unsupervised structural damage classification under changing environment. Eng. Struct. 246:113029. doi: 10.1016/j.engstruct.2021.113029
Girma, R., Fürst, C., and Moges, A. (2022). Land use land cover change modeling by integrating artificial neural network with cellular automata-Markov chain model in Gidabo river basin, main Ethiopian rift. Environ. Chall. 6:100419. doi: 10.1016/j.envc.2021.100419
Habibie, M. I. (2022). The application of machine learning using Google earth engine for remote sensing analysis. J. Teknoinf. 16:233. doi: 10.33365/jti.v16i2.1872
Habte, D. G., Belliethathan, S., and Ayenew, T. (2021). Evaluation of the status of land use/land cover change using remote sensing and GIS in Jewha watershed, northeastern Ethiopia. SN Appl. Sci. 3:501. doi: 10.1007/s42452-021-04498-4
Hasan, S., Shi, W., Zhu, X., Abbas, S., and Khan, H. U. A. (2020). Future simulation of land use changes in rapidly urbanizing South China based on land change modeler and remote sensing data. Sustain. For. 12:4350. doi: 10.3390/su12114350
Hassan, Z., Shabbir, R., Ahmad, S. S., Malik, A. H., Aziz, N., Butt, A., et al. (2016). Dynamics of land use and land cover change (LULCC) using geospatial techniques: a case study of Islamabad Pakistan. Springerplus 5:812. doi: 10.1186/s40064-016-2414-z
Hassen, E. E., and Assen, M. (2018). Land use/cover dynamics and its drivers in Gelda catchment, Lake Tana watershed, Ethiopia. Environ. Syst. Res. 6:4. doi: 10.1186/s40068-017-0081-x
Hepinstall, J. A., Alberti, M., and Marzluff, J. M. (2008). Predicting land cover change and avian community responses in rapidly urbanizing environments. Landsc. Ecol. 23, 1257–1276. doi: 10.1007/s10980-008-9296-6
Hu, Y., and Hu, Y. (2019). Land cover changes and their driving mechanisms in Central Asia from 2001 to 2017 supported by Google earth engine. Remote Sens. 11:554. doi: 10.3390/rs11050554
Ioja, C., Breuste, J., Ioja, I. C., Vânău, G. O., Hossu, C. A., and Breuste, J. (2020). “Urban protected areas and urban biodiversity” in Making Green cities: concepts, challenges and practice. (pp. 289–398). Cham: Springer International Publishing.
Islam, K., Rahman, M. F., and Jashimuddin, M. (2018). Modeling land use change using cellular automata and artificial neural network: the case of Chunati wildlife sanctuary, Bangladesh. Ecol. Indic. 88, 439–453. doi: 10.1016/j.ecolind.2018.01.047
Jenness, J., and Wynne, J. J. (2005). Cohen’s kappa and classification table metrics 2.0: an ArcView 3. X extension for accuracy assessment of spatially explicit models. USGS Publications Warehouse.
Jin, Y., Liu, X., Chen, Y., and Liang, X. (2018). Land-cover mapping using random Forest classification and incorporating NDVI time-series and texture: a case study of Central Shandong. Int. J. Remote Sens. 39, 8703–8723. doi: 10.1080/01431161.2018.1490976
Jung, M., Henkel, K., Herold, M., and Churkina, G. (2006). Exploiting synergies of global land cover products for carbon cycle modeling. Remote Sens. Environ. 101, 534–553. doi: 10.1016/j.rse.2006.01.020
Kayiranga, A., Kurban, A., Ndayisaba, F., Nahayo, L., Karamage, F., Ablekim, A., et al. (2016). Monitoring Forest cover change and fragmentation using remote sensing and landscape metrics in Nyungwe-Kibira Park. J. Geosci. Environ. Prot. 4, 13–33. doi: 10.4236/gep.2016.411003
Kim, I., Jeong, G., Park, S., and Tenhunen, J. (2011). Predicted land use change in the Soyang River basin, South Korea. In 2011 TERRECO Science Conference, Karlsruhe Institute of Technology, Garmisch-Partenkirchen, 2–7.
Kim, Y., Newman, G., and Güneralp, B. (2020). A review of driving factors, scenarios, and topics in urban land change models. Land 9:246. doi: 10.3390/LAND9080246
Koschke, L., Fürst, C., Frank, S., and Makeschin, F. (2012). A multi-criteria approach for an integrated land-cover-based assessment of ecosystem services provision to support landscape planning. Ecol. Indic. 21, 54–66. doi: 10.1016/j.ecolind.2011.12.010
Lee, S., Cho, M., and Lee, C. (2016). An effective gap interpolation and filtering (GIF) method for landsat 7 ETM+ SLC-off data. Terr. Atmos. Ocean. Sci. 27, 921–932. doi: 10.3319/TAO.2016.07.18.02
Leta, M. K., Demissie, T. A., and Tränckner, J. (2021). Modeling and prediction of land use land cover change dynamics based on land change modeler (lcm) in nashe watershed, upper Blue Nile basin, Ethiopia. Sustain. For. 13:3740. doi: 10.3390/su13073740
Li, S. H., Jin, B. X., Wei, X. Y., Jiang, Y. Y., and Wang, J. L. (2015). Using CA-Markov model to model the spatiotemporal change of land use/cover in Fuxian lake for decision support, ISPRS annals of the photogrammetry. Rem. Sens. Spat. Inform. Sci. II-4/W2, 163–168. doi: 10.5194/isprsannals-II-4-W2-163-2015
Li, S., Song, W., Fang, L., Chen, Y., Ghamisi, P., and Benediktsson, J. A. (2019). Deep learning for hyperspectral image classification: an overview. IEEE Trans. Geosci. Remote Sens. 57, 6690–6709. doi: 10.1109/TGRS.2019.2907932
Mandrekar, J. N. (2010). Receiver operating characteristic curve in diagnostic test assessment. J. Thorac. Oncol. 5, 1315–1316. doi: 10.1097/JTO.0b013e3181ec173d
Mannan, A., Yongxiang, F., Khan, T. U., Nizami, S. M., Mukete, B., Ahmad, A., et al. (2021). Urban growth patterns and forest carbon dynamics in the metropolitan twin cities of Islamabad and Rawalpindi, Pakistan. Sustain. For. 13:12842. doi: 10.3390/su132212842
Mannan, A., Zhongke, F., Khan, T. U., Saeed, S., Amir, M., Khan, M. A., et al. (2019). Variation in tree biomass and carbon stocks with respect to altitudinal gradient in the Himalayan forests of northern Pakistan. J. Pure Appl. Agric. 4, 21–28.
Martinez del Castillo, E., García-Martin, A., Longares Aladrén, L. A., and de Luis, M. (2015). Evaluation of forest cover change using remote sensing techniques and landscape metrics in Moncayo Natural Park (Spain). Appl. Geogr. 62, 247–255. doi: 10.1016/j.apgeog.2015.05.002
Maxwell, A. E., Warner, T. A., and Fang, F. (2018). Implementation of machine-learning classification in remote sensing: an applied review. Int. J. Remote Sens. 39, 2784–2817. doi: 10.1080/01431161.2018.1433343
Mishra, V. N., and Rai, P. K. (2016). A remote sensing aided multi-layer perceptron-Markov chain analysis for land use and land cover change prediction in Patna district (Bihar), India. Arab. J. Geosci. 9:249. doi: 10.1007/s12517-015-2138-3
Morales-Barquero, L., Lyons, M. B., Phinn, S. R., and Roelfsema, C. M. (2019). Trends in remote sensing accuracy assessment approaches in the context of natural resources. Remote Sens. 11:2305. doi: 10.3390/rs11192305
Mori, A. S. (2011). Ecosystem management based on natural disturbances: hierarchical context and non-equilibrium paradigm. J. Appl. Ecol. 48, 280–292. doi: 10.1111/j.1365-2664.2010.01956.x
Mosammam, H. M., Nia, J. T., Khani, H., Teymouri, A., and Kazemi, M. (2017). Monitoring land use change and measuring urban sprawl based on its spatial forms: the case of Qom city. Egypt J. Remote Sens. Sp. Sci. 20, 103–116. doi: 10.1016/j.ejrs.2016.08.002
Muhammad, S. (2023). Analyzing the impact of forest harvesting ban in northern temperate forest. A case study of Anakar Valley, Kalam swat region, Khyber-Pakhtunkhwa, Pakistan. Pure Appl. Biol. 12, 1434–1439. doi: 10.19045/bspab.2023.120143
Mumtaz, F., Li, J., Liu, Q., Tariq, A., Arshad, A., Dong, Y., et al. (2023). Impacts of green fraction changes on surface temperature and carbon emissions: comparison under forestation and urbanization reshaping scenarios. Remote Sens. 15:859. doi: 10.3390/rs15030859
Mumtaz, F., Tao, Y., Leeuw, G.De, Zhao, L., Fan, C., Elnashar, A., et al. (2020). Modeling spatio-temporal land transformation and its associated impacts on land surface temperature (LST). Remote Sens. 12::2987. doi: 10.3390/RS12182987
Niquisse, S., Cabral, P., Rodrigues, Â., and Augusto, G. (2017). Ecosystem services and biodiversity trends in Mozambique as a consequence of land cover change. Int. J. Biodivers. Sci. Ecosyst. Serv. Manag. 13, 297–311. doi: 10.1080/21513732.2017.1349836
Ozturk, D. (2015). Urban growth simulation of Atakum (Samsun, Turkey) using cellular automata-Markov chain and multi-layer perceptron-Markov chain models. Remote Sens. 7, 5918–5950. doi: 10.3390/rs70505918
Pakistan Statistics of Bureau (2017). No title [WWW document]. Islam. - Pakistan Census. Available at: https://www.pbs.gov.pk/census-2017-district-wise/results/135
Pan, S. (2024). The stoichiometric characteristics and the relationship with hydraulic and morphological traits of the Faxon fir in the subalpine coniferous forest of Southwest China classifier and random forest. Ecol. Indic. Volume 159:111636. doi: 10.1016/j.ecolind.2024.111636
Pan, X., Wang, Z., Gao, Y., Dang, X., and Han, Y. (2022). Detailed and automated classification of land use/land cover using machine learning algorithms in Google earth engine. Geocarto Int. 37, 5415–5432. doi: 10.1080/10106049.2021.1917005
Pham-Duc, B., Nguyen, H., Phan, H., and Tran-Anh, Q. (2023). Trends and applications of google earth engine in remote sensing and earth science research: a bibliometric analysis using scopus database. Earth Sci. Informatics 16, 2355–2371. doi: 10.1007/s12145-023-01035-2
Qiu, S., Lin, Y., Shang, R., Zhang, J., Ma, L., and Zhu, Z. (2019). Making Landsat time series consistent: evaluating and improving Landsat analysis ready data. Remote Sens. 11:51. doi: 10.3390/rs11010051
Reitz, W. (2006). A review of: “continuum scale simulation of engineering materials, fundamentals – microstructures – process applications.”. Mater. Manuf. Process. 850. doi: 10.1080/10426910500476788
Salazar, A., Baldi, G., Hirota, M., Syktus, J., and McAlpine, C. (2015). Land use and land cover change impacts on the regional climate of non-Amazonian South America: a review. Glob. Planet. Change 128, 103–119. doi: 10.1016/j.gloplacha.2015.02.009
Samie, A., Deng, X., Jia, S., and Chen, D. (2017). Scenario-based simulation on dynamics of land-use-land-cover change in Punjab province, Pakistan. Sustain. For. 9:1285. doi: 10.3390/su9081285
Sexton, J. O., Song, X. P., Huang, C., Channan, S., Baker, M. E., and Townshend, J. R. (2013). Urban growth of the Washington, D.C.-Baltimore, MD metropolitan region from 1984 to 2010 by annual, Landsat-based estimates of impervious cover. Remote Sens. Environ. 129, 42–53. doi: 10.1016/j.rse.2012.10.025
Shinwari, M. I., and Khan, M. A. (2000). Folk use of medicinal herbs of Margalla Hills National Park, Islamabad. J. Ethnopharmacol. 69, 45–56. doi: 10.1016/S0378-8741(99)00135-X
Siddique, M. A., Wang, Y., Xu, N., Ullah, N., and Zeng, P. (2021). The spatiotemporal implications of urbanization for urban heat islands in Beijing: a predictive approach based on CA–Markov modeling (2004–2050). Remote Sens. 13:4697. doi: 10.3390/rs13224697
Singh, S. K., Mustak, S., Srivastava, P. K., Szabó, S., and Islam, T. (2015). Predicting spatial and decadal LULC changes through cellular automata Markov chain models using earth observation datasets and geo-information. Environ. Process. 2, 61–78. doi: 10.1007/s40710-015-0062-x
Strobl, C., Malley, J., and Tutz, G. (2009). An introduction to recursive partitioning: rationale, application, and characteristics of classification and regression trees, bagging, and random forests. Psychol. Methods 14, 323–348. doi: 10.1037/a0016973
Tamiminia, H., Salehi, B., Mahdianpari, M., Quackenbush, L., Adeli, S., and Brisco, B. (2020). Google earth engine for geo-big data applications: a meta-analysis and systematic review. ISPRS J. Photogramm. Remote Sens. 164, 152–170. doi: 10.1016/j.isprsjprs.2020.04.001
Tian, H., Banger, K., Bo, T., and Dadhwal, V. K. (2014). History of land use in India during 1880-2010: large-scale land transformations reconstructed from satellite data and historical archives. Glob. Planet. Change 121, 78–88. doi: 10.1016/j.gloplacha.2014.07.005
Uddin, M. S., Mahalder, B., and Mahalder, D. (2023). Assessment of land use land cover changes and future predictions using CA-ANN simulation for Gazipur City Corporation, Bangladesh. Sustain. For. 15:12329. doi: 10.3390/su151612329
Ullah, S., Tahir, A. A., Akbar, T. A., Hassan, Q. K., Dewan, A., Khan, A. J., et al. (2019). Remote sensing-based quantification of the relationships between land use land cover changes and surface temperature over the lower Himalayan region. Sustain. For. 11:5492. doi: 10.3390/su11195492
Viera, A. J., and Garrett, J. M. (2005). Understanding interobserver agreement: the kappa statistic. Fam. Med. 37, 360–363.
Vitousek, P. M., Mooney, H. A., Lubchenco, J., and Melillo, J. M. (1997). Human domination of Earth’s ecosystems. Science 277, 494–499. doi: 10.1126/science.277.5325.494
Wang, R., Derdouri, A., and Murayama, Y. (2018). Spatiotemporal simulation of future land use/cover change scenarios in the Tokyo metropolitan area. Sustain. For. 10:2056. doi: 10.3390/su10062056
Wang, J., and Maduako, I. N. (2018). Spatio-temporal urban growth dynamics of Lagos metropolitan region of Nigeria based on hybrid methods for LULC modeling and prediction. Eur. J. Remote Sens. 51, 251–265. doi: 10.1080/22797254.2017.1419831
Wang, Q., Wang, L., Li, Z., Tong, X., and Atkinson, P. M. (2020). Spatial-spectral radial basis function-based interpolation for Landsat ETM+ SLC-off image gap filling. IEEE Trans. Geosci. Remote Sens. 59, 7901–7917. doi: 10.1109/TGRS.2020.3038878
Wang, C., Yu, M., and Gao, Q. (2017). Continued reforestation and urban expansion in the new century of a Tropical Island in the Caribbean. Remote Sens. 9:731. doi: 10.3390/rs9070731
Wang, W., Zhang, C., Allen, J. M., Li, W., Boyer, M. A., Segerson, K., et al. (2016). Analysis and prediction of land use changes related to invasive species and major driving forces in the state of Connecticut. Land 5:25. doi: 10.3390/land5030025
Wang, S. Q., Zheng, X. Q., and Zang, X. B. (2012). Accuracy assessments of land use change simulation based on Markov-cellular automata model. Procedia Environ. Sci. 13, 1238–1245. doi: 10.1016/j.proenv.2012.01.117
Wu, H., Lin, A., Xing, X., Song, D., and Li, Y. (2021). Identifying core driving factors of urban land use change from global land cover products and POI data using the random forest method. Int. J. Appl. Earth Obs. Geoinf. 103:102475. doi: 10.1016/j.jag.2021.102475
Xiao, X., Zhang, Q., Braswell, B., Urbanski, S., Boles, S., Wofsy, S., et al. (2004). Modeling gross primary production of temperate deciduous broadleaf forest using satellite images and climate data. Remote Sens. Environ. 91, 256–270. doi: 10.1016/j.rse.2004.03.010
Yohannes, A. W., Cotter, M., Kelboro, G., and Dessalegn, W. (2018). Land use and land cover changes and their effects on the landscape of Abaya-Chamo basin, southern Ethiopia. Land 7:2. doi: 10.3390/land7010002
Keywords: LULC, random forest, Markov chain model, Islamabad, land change modeler
Citation: Badshah MT, Hussain K, Rehman AU, Mehmood K, Muhammad B, Wiarta R, Silamon RF, Khan MA and Meng J (2024) The role of random forest and Markov chain models in understanding metropolitan urban growth trajectory. Front. For. Glob. Change. 7:1345047. doi: 10.3389/ffgc.2024.1345047
Edited by:
Randall Morin, Northern Research Station, Forest Service (USDA), United StatesReviewed by:
Ahmed Elbeltagi, Mansoura University, EgyptCopyright © 2024 Badshah, Hussain, Rehman, Mehmood, Muhammad, Wiarta, Silamon, Khan and Meng. This is an open-access article distributed under the terms of the Creative Commons Attribution License (CC BY). The use, distribution or reproduction in other forums is permitted, provided the original author(s) and the copyright owner(s) are credited and that the original publication in this journal is cited, in accordance with accepted academic practice. No use, distribution or reproduction is permitted which does not comply with these terms.
*Correspondence: Jinghui Meng, am1lbmdAYmpmdS5lZHUuY24=
Disclaimer: All claims expressed in this article are solely those of the authors and do not necessarily represent those of their affiliated organizations, or those of the publisher, the editors and the reviewers. Any product that may be evaluated in this article or claim that may be made by its manufacturer is not guaranteed or endorsed by the publisher.
Research integrity at Frontiers
Learn more about the work of our research integrity team to safeguard the quality of each article we publish.