 Anaïs Saenger
 Frédéric André
 Mathieu Jonard
 Manuel Nicolas
 Quentin Ponette
- 1UCLouvain-ELI, Earth and Life Institute, Université Catholique de Louvain, Louvain-la-Neuve, Belgium
- 2Office National des Forêts, Département Recherche-Développement-Innovation, Fontainebleau, France
The temporal change of soil chemistry in the forest floor and mineral soil down to a depth of 40 cm was assessed for the 102 permanent plots of the French Network for the Monitoring of Forest Ecosystems (RENECOFOR), over a 15-year period (from 1993–1995 to 2007–2012). In examining the separate and joint evolutions of a large set of parameters, many significant changes were detected reflecting the fact that French forest soils were not in a steady state. A significant increase in soil organic carbon (SOC) stocks was found, mainly in the surface soil (13.0% increase over the forest floor and the 0–10 cm layer). Conversely, the relative increase of the total nitrogen (Ntot) stocks was lower in the surface soil (4.8% increase), and a general and sharp decline of Ntot was detected between 10 and 40 cm depth (12.0% decrease). These results led to a substantial raise of C/N ratio over the whole soil profile. Another major finding is the difference in soil acidification recovery depending on the initial trophic level. In highly acidified contexts (top soil pH H2O < 4.5), increased soil acidification (pH and base saturation decrease, exchangeable Al increase) over the profile was observed while exchangeable base cation (Ca, Mg, K) pools increased. On the other hand, less acidic soils saw their global buffer capacity enhanced. These observations contrast with what is measured in other European inventories. While a previous study carried out on the same plots and over the same period highlighted SOC as a major driver of soil evolution in the top mineral soil, the possible mechanisms behind the large N decrease in the lower mineral soil remain to be confirmed.
1 Introduction
Over the last decades, the magnitude of human-induced environmental changes has raised serious concerns about the evolution of soils, and their capacity to ensure the long-term provision of ecosystem services, including water and nutrient cycling regulation, support for biomass production, carbon sequestration and habitat for soil fauna and micro-organisms (Adhikari and Hartemink, 2016; Pereira et al., 2018). For forests, atmospheric deposition of sulfur (S) and nitrogen (N) pollutants, together with climate change, are two main interacting drivers of changes (Hyvönen et al., 2007; de Vries et al., 2014; Wang et al., 2022), with complex feedbacks on ecosystem functioning. As N is a major nutrient for both plants and microbes, any modification in its supply is expected to steer ecosystem patterns and functions onto trajectories of change. Nitrogen deposition has indeed the potential to increase ecosystem C sequestration through increased productivity (Bontemps et al., 2011; Ferretti et al., 2014; Gentilesca et al., 2018; Etzold et al., 2020), increased soil C inputs as well as soil organic matter stabilization and reduced decomposition (Berg and Matzner, 1997; Janssens et al., 2010; Whittinghill et al., 2012; Maaroufi et al., 2019; Mayer et al., 2020). This potential is however strongly dependent on the N status of the site, as well as on possible limitations related to climate, water or nutrient availability (Kint et al., 2012; Mausolf et al., 2020). External N inputs can also affect the acid–base relationships of the N cycle, resulting in contrasting impacts on the net soil acidification and leaching of cations depending on the form in which N is deposited, the associated cation(s) or anion(s) load, as well as on the initial acid–base status of soil (Reuss and Johnson, 1986; Erisman and De Vries, 2000). Aside the form of N deposition, its intensity and duration are also critical as surpassing ecosystem retention capacity will lead to N saturation with adverse effects on biodiversity, seepage water quality and tree growth and vitality (Aber et al., 1998; Veresoglou et al., 2014; de Vries and Schulte-Uebbing, 2019; Toïgo et al., 2020). Detecting changes in soil properties and functions is therefore essential to correctly assess their consequences in terms of provision of ecosystem services and long-term soil fertility.
This led to the implementation of various monitoring plans, such as the International Co-operative Program on Assessment and Monitoring of Air Pollution Effects on Forests (ICP Forests), which comprises a network of intensively monitored forest sites (level II plots) distributed across Europe (de Vries et al., 2003; Lorenz and Fischer, 2013; Schwärzel et al., 2022). A fundamental requirement of those networks is to adopt harmonized and standardized methods framed by quality insurance and quality control measures giving rise to high-quality monitoring data (Ferretti et al., 2021). Such a robust methodological framework is notably essential to control the sources of variability involved at each step of the monitoring process, from sampling to analysis, and to provide reliable estimates of temporal changes. For forest soils, sampling is particularly challenging, due to the considerable vertical and lateral heterogeneity associated with forest sites (Cools and De Vos, 2013; Jandl et al., 2014).
While changes in forest soil properties are being increasingly documented, a wide diversity of responses has been reported, depending notably on soil type (Vanguelova et al., 2010; Cools and De Vos, 2011; Schmitz et al., 2019; Hazlett et al., 2020), soil layer depth (Cools and De Vos, 2011; Ahrends et al., 2022; Clesse et al., 2022), species composition (Trum et al., 2011; Cremer and Prietzel, 2017; Rehschuh et al., 2021; Ahrends et al., 2022; Clesse et al., 2022), forest management (Knoepp and Swank, 1997), topographic location and hydrology (Fraser et al., 2019), as well as N and S deposition levels and trends (Kirk et al., 2010; Lawrence et al., 2015; Schmitz et al., 2019). This strongly calls for further investigations on a wider range of situations in terms of initial conditions, including land-use legacies, and combinations of drivers (Perring et al., 2016). In addition, reliable estimates of soil changes are still highly needed to serve as benchmark values for comparison with model predictions, which highlights the need to combine monitoring and modeling approaches for a better understanding of the underlying processes (De Vos et al., 2015). Even if the uncertainties associated with measured changes may be large, they can be precisely quantified and reported consistently over time, in contrast with most model predictions (Canham et al., 2003).
On the other hand, it seems that the potential of those monitoring networks for assessing environmental changes is still largely under-exploited due to the frequent oversight of the interrelationships between changes. Up to now, most reports focused on responses to specific drivers by looking at dedicated indicators of changes being related to C sequestration (Grüneberg et al., 2013; Frey et al., 2014; Jonard et al., 2017; Bowden et al., 2019), soil acidification (Kirk et al., 2010; Cools and De Vos, 2011; Ahrends et al., 2022; Seaton et al., 2023) or soil eutrophication (Boxman et al., 2008; Iost et al., 2012; Verstraeten et al., 2017; Johnson et al., 2018). Surprisingly, only few studies consistently addressed the simultaneous change of diverse soil parameters (Clesse et al., 2022; Thai et al., 2023), with most of them consisting mostly of separate reports of change for the individual parameters (Reynolds et al., 2013; Jandl et al., 2022).
Using an integrated approach of soil changes rather than independently focusing on few parameters presents a series of key advantages. First, such an approach gives the opportunity to further assess the consistency of changes, by checking whether the correlations between temporal changes in soil parameters agree with expected evolutions based on spatial correlations or theory. Second, it allows to analyze the response to specific drivers or processes by looking simultaneously at different, complementary, indicators. For example, considering acidification, this would mean investigating not only soil pH but also base saturation (BS) or targeted components of soil Acid Neutralizing Capacity (ANC). Third, using a common framework including simultaneously all changes makes it possible to investigate the causal relationships, interactions and hierarchy between the observed changes and associated processes. While helping in understanding, it also contributes to rule out some flawed hypothesis or conclusion that could otherwise be pointed out if only one single change was considered in isolation from the others. For example, whereas soil organic carbon (SOC) is known to impact many soil properties (Murphy, 2015; Solly et al., 2020), its change is rarely investigated together with other soil changes. In other respects, pH change in many monitoring programs is most often analyzed in relation to changes in external drivers such as atmospheric deposition, while it might also arise from modifications in the properties of the soil itself, such as notably SOC change (Ritchie and Dolling, 1985; Rukshana et al., 2011). Finally, combining a whole set of parameters into a single analysis offers the opportunity to detect contrasting trends between parameters, which might point out specific processes and enable to predict changes in soil trajectory. For example, contrasting patterns between C and N variations might suggest specific mechanisms, with implications on SOC sequestration (Knorr et al., 2005; Su et al., 2022).
The RENECOFOR network was created in 1992 as the French part of the ICP Forests intensive (Level II) monitoring network. The strength of its soil dataset lies in (i) the large number of monitored plots (102) covering a vast panel of ecological contexts, (ii) the strict comparability of data (analyses carried out on the same plots and with identical methods at each campaign) and (iii) the nested sampling design allowing careful control of the spatial heterogeneity at plot scale. Using the soil data from two sampling campaigns (1993–1995 to, 2007–2012, average time span between campaigns = 15 years) carried out within the RENECOFOR network, the specific objectives of our research were therefore to:
i. detect and quantify the temporal changes of a wide range of soil chemical parameters over the monitoring period;
ii. analyze the interrelationships between the temporal changes in these various parameters;
iii. characterize the patterns of change as a function of depth (holorganic horizons; 0–10, 10–20, and 20–40 cm mineral soil layers).
We hypothesized that those changes were driven by SOC sequestration (Jonard et al., 2017), as well as by the recent decreased trend in inorganic N inputs after the historic enhanced N deposition, especially since the 1950’s (Waldner et al., 2014; Engardt et al., 2017). While we report the specific evolution of each parameter, our main focus is on how the changes are interrelated and vary across the soil profile.
2 Materials and methods
2.1 Soil sampling
Soil sampling was carried out in the French Level II forest monitoring plots (RENECOFOR network). The 102 plots are distributed over the French territory excluding overseas territories, and cover a wide range of climates, soil types and tree species (Figure 1; Table 1). Soil sampling was first conducted between 1993 and 1995, and then repeated between 2007 and 2012. Within the 0.5 ha central zone of each plot, the individual forest floor horizons (litter (Ol), fragmented (Of), and humic (Oh) horizons) and three mineral soil layers (0–10 cm, 10–20 cm and 20–40 cm) were sampled separately on 5 subplots of 13.5 m × 13.5 m each, located at the center and in the four corners (Figure 2). For each subplot, one composite sample per horizon or layer was obtained from five individual sampling points selected among the 16 intersections of a systematic grid (4.5 × 4.5 m), to account for local site variability while avoiding disturbed areas (logging residues, skidder tracks) and proximity to living trees. For the forest floor, the three horizons were collected separately, using a 30 cm × 30 cm frame after discarding the living material (other than fine roots), the branches of a diameter greater than 0.5 cm and the fresh fruits. Three underlying mineral soil layers based on soil depth (0–10, 10–20, 20–40 cm) were also sampled separately by digging a small pit over an approximately 50 cm × 50 cm area. For each mineral layer, an undisturbed soil sample was first taken with a Kopecky cylinder (250 cm3, h = 5 cm, Ø = 8 cm) to measure bulk density, and the remaining soil was then sampled for chemical analyses. The same protocol was followed for both soil surveys, except that the subplots were moved by 1.5 m in a fixed direction per plot during the second campaign to avoid any possible soil disturbance resulting from the previous sampling. For a given plot, the soil was sampled during the same season for both surveys. A more comprehensive description of the sampling grid soil is provided in the guidebook of Ulrich et al. (2009). In addition to this nested sampling design, two soil pits were opened per plot during the first survey to characterize the soil horizons down to a depth of 1 meter and to estimate the volumetric coarse fragment content (see below).
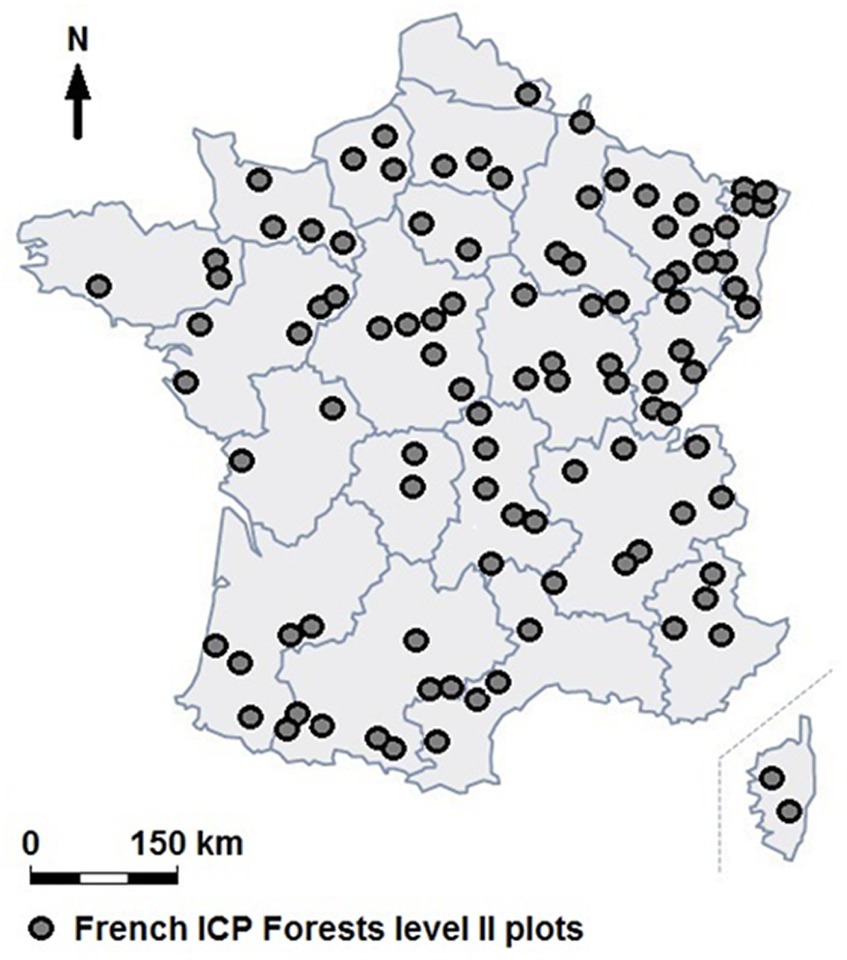
Figure 1. Location of the 102 French ICP Forests level II plots.

Table 1. Soil types, altitude, ranges for the main climatic variables and number of RENECOFOR plots by main tree species.
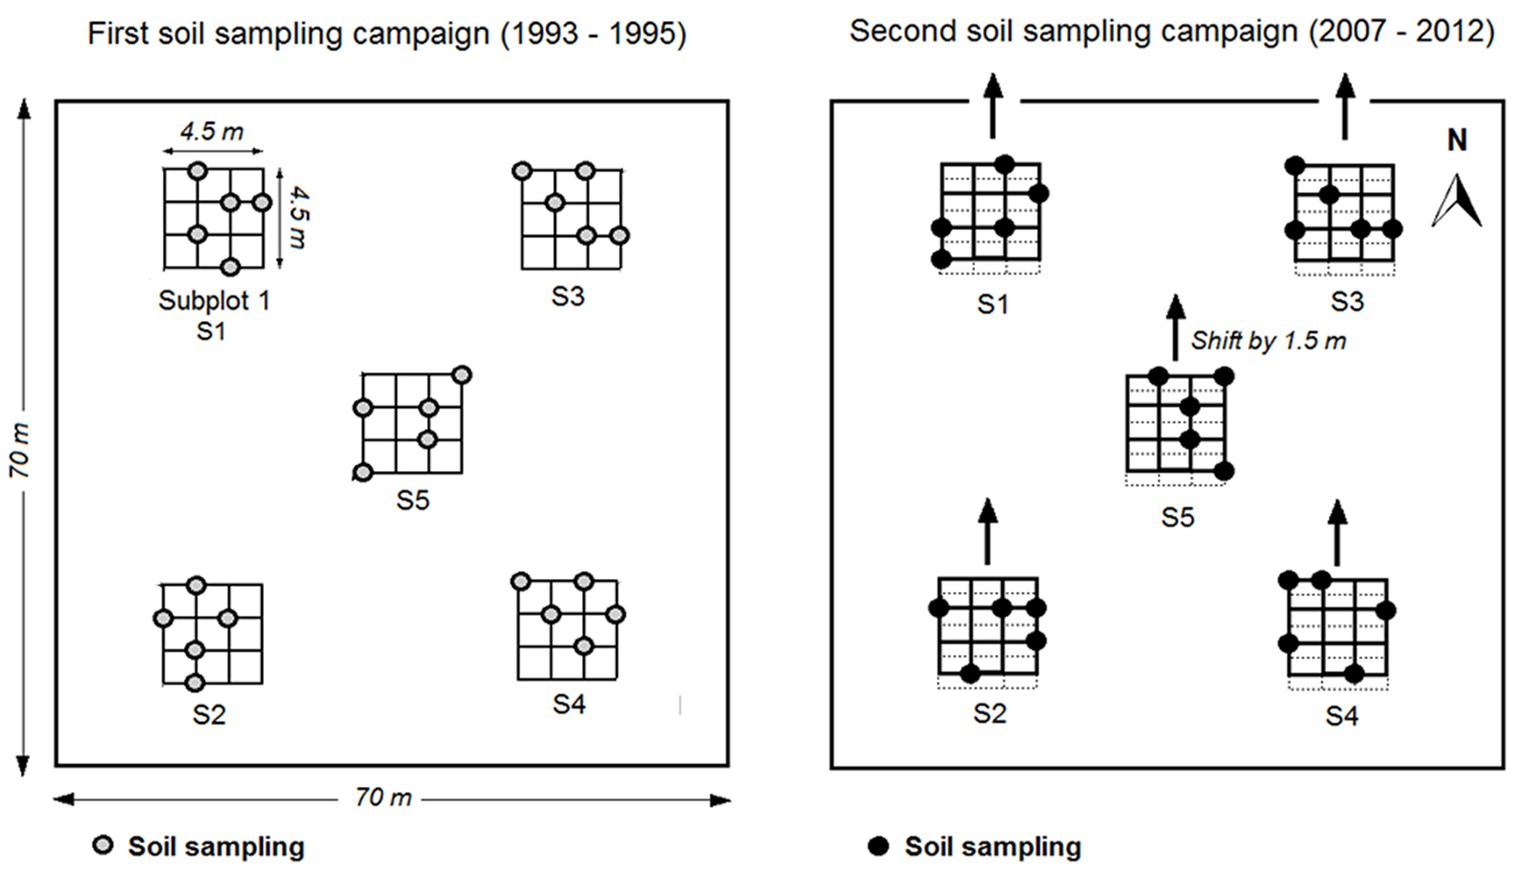
Figure 2. Soil sampling design. The arrows in the right panel indicate the direction of the 1.5 m shift (here toward the North) between the first and the second campaigns.
2.2 Soil sample processing and data quality control
All samples for chemical analysis were first oven-dried at 35°C for 24 h. For the forest floor, the dry to fresh mass ratio was determined on subsamples oven-dried at 105°C until constant weight, and the chemical analyses were performed after grinding. For the mineral soil layers, all samples were passed through a 2-mm sieve and those for fine earth bulk density measurements were further oven-dried at 105°C before being weighed.
All chemical analyses were performed according to French and international standards by one single reference laboratory (Laboratory of Soil Analyses, INRAe Arras, France), using the same methods for both campaigns. This laboratory is routinely involved in ring test analyses, and was selected to assess the uncertainty of SOC concentrations by multi-laboratory analysis in the frame of the BioSoil project (De Vos et al., 2015). Soil pH was determined in the mineral layers according to NF ISO 10390 (2004) using a glass electrode in a 1:5 (V/V) suspension of soil in deionized water (pH H2O), and in a solution of 0.01 mol.L−1 calcium chloride (pH CaCl2). SOC content of the forest floor and 0–10 cm layers was determined by dry combustion after decarbonation according to the Dumas method (NF ISO 10694, 1995). For the 10–20 cm and 20–40 cm layers, SOC was determined by sulfochromic oxidation at a temperature of 30°C after decarbonation according to the Anne method (variant of the Walkley-Black method; NF X31-109, 1993). Total nitrogen (Ntot) of the forest floor and 0–10 cm layers was determined by dry combustion according to NF ISO 13878 (1998), while Ntot of 10–20 cm and 20–40 cm layers was measured according to the Kjeldahl method (NF ISO 11261, 1995). Total K, Ca, and Mg were extracted from the forest floor layers by hydrofluoric and perchloric acid according to NF ISO 14869-1 (2001), then measured by flame atomic absorption spectroscopy (FAAS) for Ca and Mg, and by flame atomic emission spectroscopy (FAES) for K.
Extractable phosphorus (P) in the mineral soil layers was quantified either by the Dyer method for samples with pH CaCl2 < 6.5 (NF X31-160, 1993), or by the Joret-Hébert procedure (NF X31-161, 1993) for samples with a pH CaCl2 > 6.5. The Dyer method involves a solution of citric acid monohydrate 20 g.L−1 and a 1:5 ratio (w/v), while P is extracted with a solution of ammonium oxalate 0.1 mol.L−1 using a 1/25 ratio (w/v) with the Joret-Hébert method. In both cases, P is determined by colorimetry. Exchangeable cations (K, Ca, Mg, Al) were extracted with a solution of barium chloride (0.1 mol.L−1) in a 1:10 mass/volume ratio according to NF ISO 11260 (1994), then measured by FAAS. Exchangeable Al was measured either by titrimetry (1st campaign) or ICP (2nd campaign), on all samples with a pH CaCl2 < 7.
Values below the Limit of Quantification (LOQ) were set to either LQ or LQ/2, the latter being used when the parameter was included in sums or ratios. As in practice exchangeable Al concentrations in soils with pH CaCl2 > 6.5 were generally below the LOQ, the corresponding values were set to 0 for all those samples.
Carbonated soil samples were excluded from temporal change analysis of exchangeable Ca and Mg, since BaCl2 extraction is known to partly dissolve the carbonates (Dohrmann and Kaufhold, 2009; Nel et al., 2023). Similarly, soil samples involving different analytical methods between campaigns regarding extractable P (Dyer vs. Joret-Hébert procedures) were not considered when analyzing changes in P.
Finally, the whole data set was systematically checked for possible outliers. One individual measurement was considered as outlier and the corresponding (subplot × layer) excluded from further analyses if the two following conditions were met simultaneously: (i) z-score of the individual measurement (calculated based on the 10 individual measurements of a plot × layer combination across the two campaigns) beyond ±2.58 standard deviations and (ii) subplot value beyond the ±2.58 residual standard deviations confidence interval associated with the regression line between the two campaigns.
2.3 Calculation of ratios, sums, and stocks
Effective cation exchange capacity (ECEC) and base saturation (BS) were calculated as follows:
As mentioned above for Ca and Mg, carbonated soil samples were not considered when comparing ECEC and BS among both soil campaigns as extraction with BaCl2 causes partial dissolution of carbonates, thereby giving rise to overestimation of these two quantities.
For the forest floor, the stocks of elements were calculated by multiplying their concentration by the dry mass of the layer, expressed per unit area for each plot at each sampling campaign. For the mineral layers, the stocks of SOC, Ntot, extractable P and exchangeable cations were calculated by multiplying the soil content of the element (Cx) by the soil bulk density (BD, in g.cm−3) and by the thickness of the layer (t, in cm), corrected for the fraction of coarse elements (CE) larger than 2 mm, estimated by visual observation of soil profiles, as follows:
As bulk density measurements of the two soil surveys were not strictly comparable due to a change in the sieving technique (mostly manual for the first soil survey vs mechanical for the second), the use of a campaign-specific BD would bias the comparison of stocks. We therefore compared the BD on a subset of 260 soil samples covering the diversity of soil types and the different soil layers that were sieved mechanically at both soil surveys, and found no significant differences between the first (1.031 g.cm−3) and second (1.027 g.cm−3) survey (p-value of the paired t-test = 0.71). Based on this, we assumed there was no change in BD and we used BD values of the first campaign (the most complete) as a reference for all stock calculations.
2.4 Statistical analyses
Temporal changes of soil chemical parameters between the sampling campaigns were assessed for each depth individually by linear mixed models accounting for the correlation structure of the data set. These models included the sampling campaign as a fixed effect and accounted for the inter-plot variability with a random factor:
where is the soil property measure, is the parameter estimating the mean value of the soil property at each soil survey s, is the random factor accounting for the plot effect with mean value zero and variance and is the residual term with mean value zero and variance .
A change was considered as significant when the p value associated with the fixed effect was lower than 0.05.
Estimation of model parameters was performed using the method of Restricted Maximum Likelihood (REML). The linearity, homoscedasticity (Levene test), normality [skewness and kurtosis coefficients ranging between −2 and 2 to accept the normality of the distribution, Miller (1986)], and independence of residuals have been checked for all models. All chemical parameters (except for exchangeable Al) were not complying with Gaussian distribution. Data were therefore log-transformed before performing statistical tests.
When comparing large datasets, minor changes are sufficient to generate a significant effect (Lourel et al., 2011). To properly interpret the P levels of the fixed effect, we therefore calculated the effect size with the following indices: Eta2 (Cohen, 1973), Cohen’s d (Cohen, 1988), Pearson’s correlation coefficient r (Rosenthal et al., 2000). Effect sizes were classified as small (Eta2 < 4%, Cohen’s d < 0.40, r < 0.20), medium (Eta2 4–16%, Cohen’s d 0.40–0.87, r 0.20–0.40) or high (Eta2 > 16%, Cohen’s d > 0.87, r > 0.40).
To study the relationships between the changes in the various chemical parameters, principal component analysis (PCA) and Spearman rank correlation were performed. PCA were performed using centered-reduced data at plot scale (individual sub-plot values minus plot mean calculated over the two soil surveys) so that inter-plot variability has been removed, allowing to better highlight the temporal changes.
Finally, for illustrative purposes, we separated the plots into three classes of trophic levels, based on the mean pH H2O of the 0–10 cm mineral soil layer calculated over the two soil surveys: highly acidic soils with pH < 4.5, intermediate soils with pH between 4.5 and 5.5, and low-acid soils with pH > 5.5. A linear mixed model including the interaction between ‘campaign’ and ‘soil trophic level’ was tested first. In case of a significant (p < 0.05) interaction, a linear mixed model similar to Equation (4) was then run separately for each trophic level to test for the campaign effect.
All statistical analyses were performed using the R version 3.0.2 software (ade4 package, Dray and Dufour (2007) and nlme package, Pinheiro et al., 2013; R Core Team, 2013).
3 Results
3.1 Changes in SOC, N, C/N ratio, and total base cations in the forest floor
The temporal change of the main chemical parameters of the forest floor between the two sampling campaigns is presented in Table 2. We noted a significant 11.2% increase of SOC concentrations, while Ntot concentrations did not change significantly. Consequently, the C/N ratio increased sharply by 8.1% or 2.6 units. Total calcium (Catot) and total magnesium (Mgtot) concentrations increased significantly between the two campaigns with, respectively, 8.3 and 10.9% increase. Total potassium (Ktot) concentrations did not display any significant change. As total litter mass did not change significantly over time (data not shown), the changes in stocks reflected the changes in concentrations.
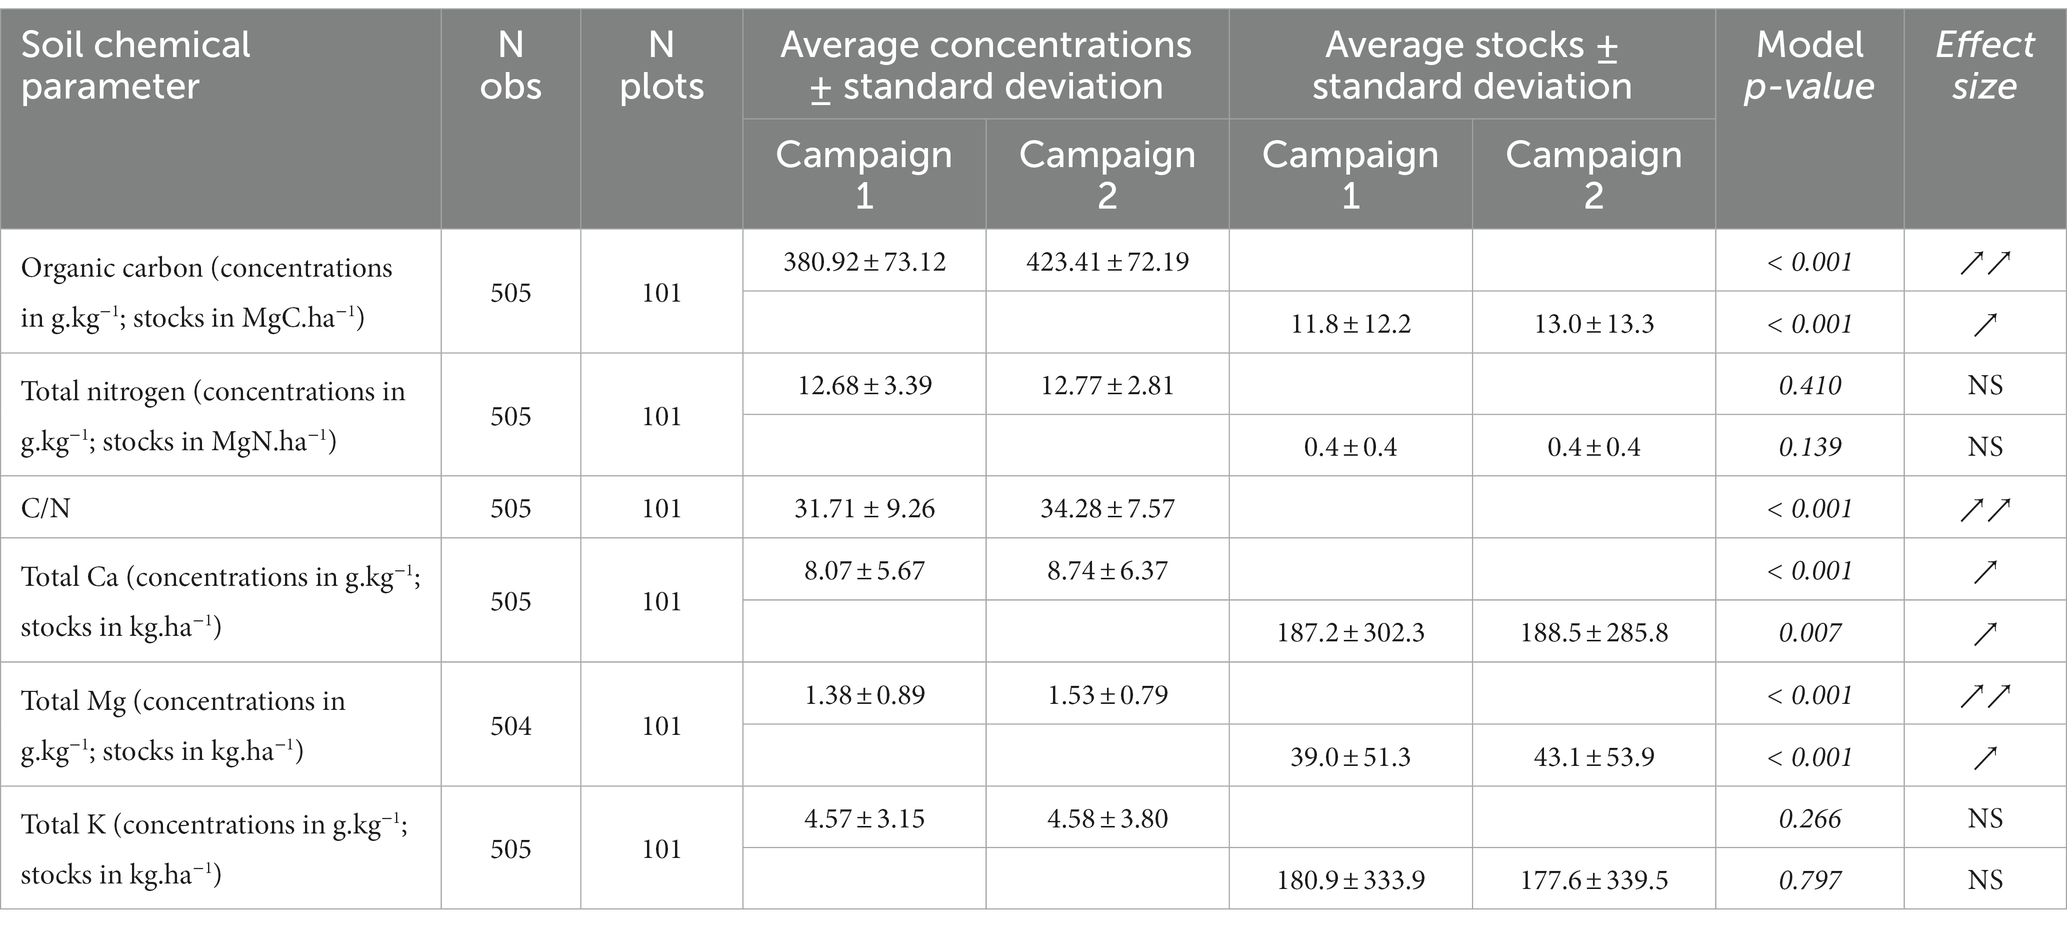
Table 2. Average concentrations and stocks of soil chemical parameters in the forest floor for both sampling campaigns, mixed model parameters and effect size (NS, ↗ and ↘ symbols indicate, respectively, non-significant, positive and negative changes among campaigns; mentions of one, two or three symbols correspond, respectively, to low, medium and high effect sizes).
3.2 Evolution of the chemical parameters in the mineral soil
3.2.1 Evolution of SOC, Ntot, C/N ratio, and P
Similarly as aforementioned for the forest floor, a significant increase of SOC stocks between the two sampling campaigns was also observed in the mineral soil when considering all investigated layers together (average stocks rising from 69.1 ± 27.9 to 73.5 ± 29.9 MgC.ha−1 for the full 0–40 cm depth, average 6.4% increase; see Table 3). SOC accumulation over the investigated depth was mainly driven by the 0–10 cm layer (mean SOC stock increase of 14.1%), while no significant change was found for the 10–20 cm layer and SOC tended to decrease slightly in the 20–40 cm layer (SOC stocks decreasing by 1.4%). In contrast to SOC, Ntot stocks significantly decreased over the 0–40 cm layer though to a limited extent (4.8% decrease). Ntot accumulation was proportionally lower than SOC accumulation in the 0–10 cm layer (from 1.7 ± 0.7 to 1.8 ± 0.8 MgN.ha−1, 5.9% increase). Conversely, N stocks significantly decreased in both the 10–20 cm (from 1.1 ± 0.6 to 1.0 ± 0.6 MgN.ha−1, 9.1% decrease) and the 20–40 cm (from 1.4 ± 0.8 1 to 1.2 ± 0.8 MgN.ha−1, 14.3% decrease) layers. As a result, the C/N ratio increased throughout the profile by 7.7%, 16.2%, and 18.3% in the 0–10, 10–20, and 20–40 cm layers, respectively. In other respects, the mean C/N values were fairly homogeneous over the whole soil profile at the second inventory, while they gradually decreased with depth at the first inventory.
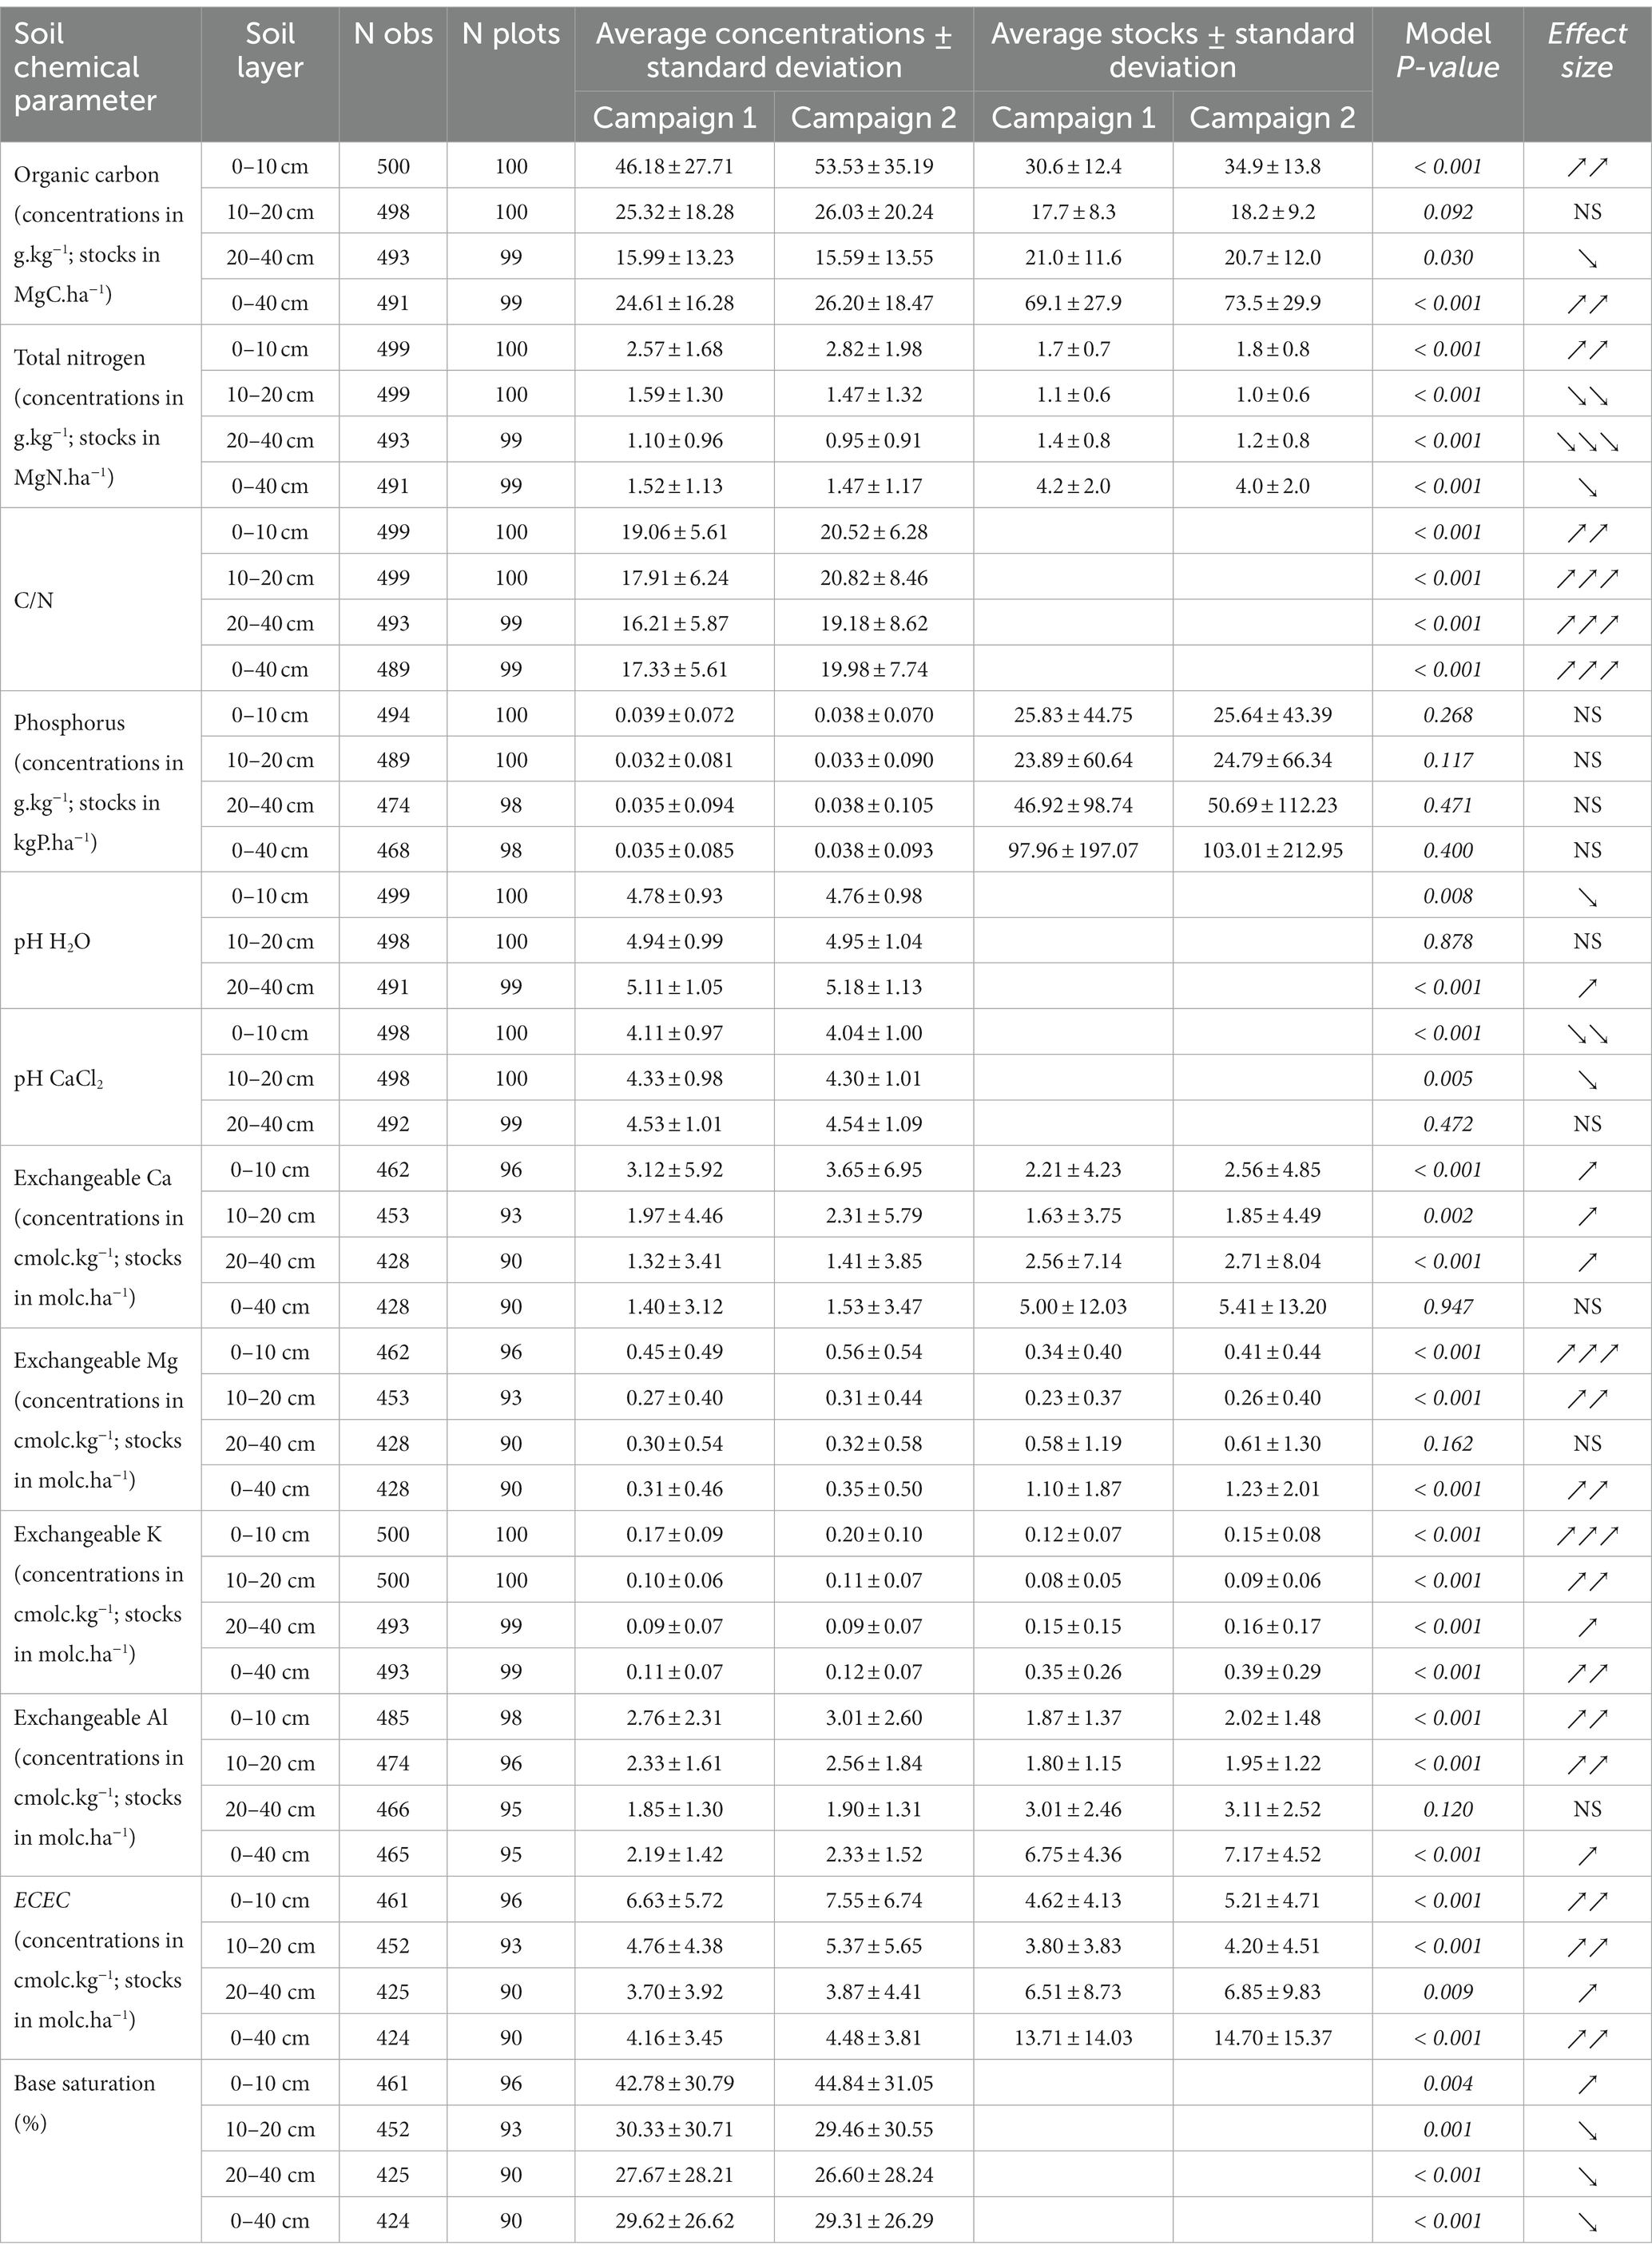
Table 3. Average concentrations and stocks (see Equation (3)) of soil chemical parameters in the mineral soil layers for both sampling campaigns, mixed model parameters and effect size (NS, ↗ and ↘ symbols indicate, respectively, non-significant, positive and negative changes among campaigns; mentions of one, two or three symbols correspond, respectively, to low, medium and high effect sizes).
The extractable P did not exhibit any significant changes, neither in the different soil layers studied nor over the entire soil profile.
3.2.2 Evolution of soil pH, exchangeable cations, and base saturation
In the top mineral soil layers, pH significantly decreased between the two soil campaigns, although to a lesser extent for pH H2O (0.4% decrease), compared to pH CaCl2 (1.7% decrease; see Table 3). Though significant increasing (pH H2O for the 20–40 cm) or decreasing (pH CaCl2 for the 10–20 cm) trends were observed in the lower soil layers, they were always associated with a small effect size.
ECEC significantly increased in all mineral soil layers, with a medium effect size, except in the 20–40 cm where it was low. The percentage increase amounted to 12.8% and 10.5% in the 0–10 and 10–20 cm layers, respectively.
The ECEC increase in the two upper mineral soil layers was associated with a significant increase of all exchangeable cations (K, Ca, Mg, Al). Yet, for each layer, changes in exchangeable Ca were characterized by low effect sizes (Table 3).
The change in base saturation (BS, see Equation (2)) was significant in all soil layers, though with a low effect size (Table 3). BS increased in the surface layer (4.8% increase) but decreased in all underlying layers (10–20 cm: 2.9% decrease; 20–40 cm: 3.9% decrease). Overall, a general BS decline of 1.0% was observed throughout the soil profile.
3.2.3 Joint evolution of the chemical parameters in the mineral soil layers
For each depth increment, the two first factorial axes of the PCAs (Figure 3) accounted for a large part of the total variance, though decreasing with depth, with 63.15%, 54.54%, and 49.30% for the 0–10, 10–20 and 20–40 cm layers, respectively. The distance between the centroids associated to each sampling campaign strongly decreased with depth. In addition, the trajectories with respect to the two PCAs axes differed according to the soil layer. In the 0–10 cm, there was a general shift along the first PCA axis, toward enrichment in SOC, Ntot and exchangeable cations (ECEC, K, Mg), as well as a limited upward trend along the second axis reflecting an increased acidity. In the 10–20 cm layer, the soil evolution appeared to be mainly driven by an increased acidification, as shown by the upward shift along the second PCA axis (increased exchangeable Al concentrations, decrease in pH). Regarding the 20–40 cm layer, the shift of soil properties between campaigns also reflected a change in soil acid–base status toward a higher acidity for the second campaign, even if this change was quite limited.
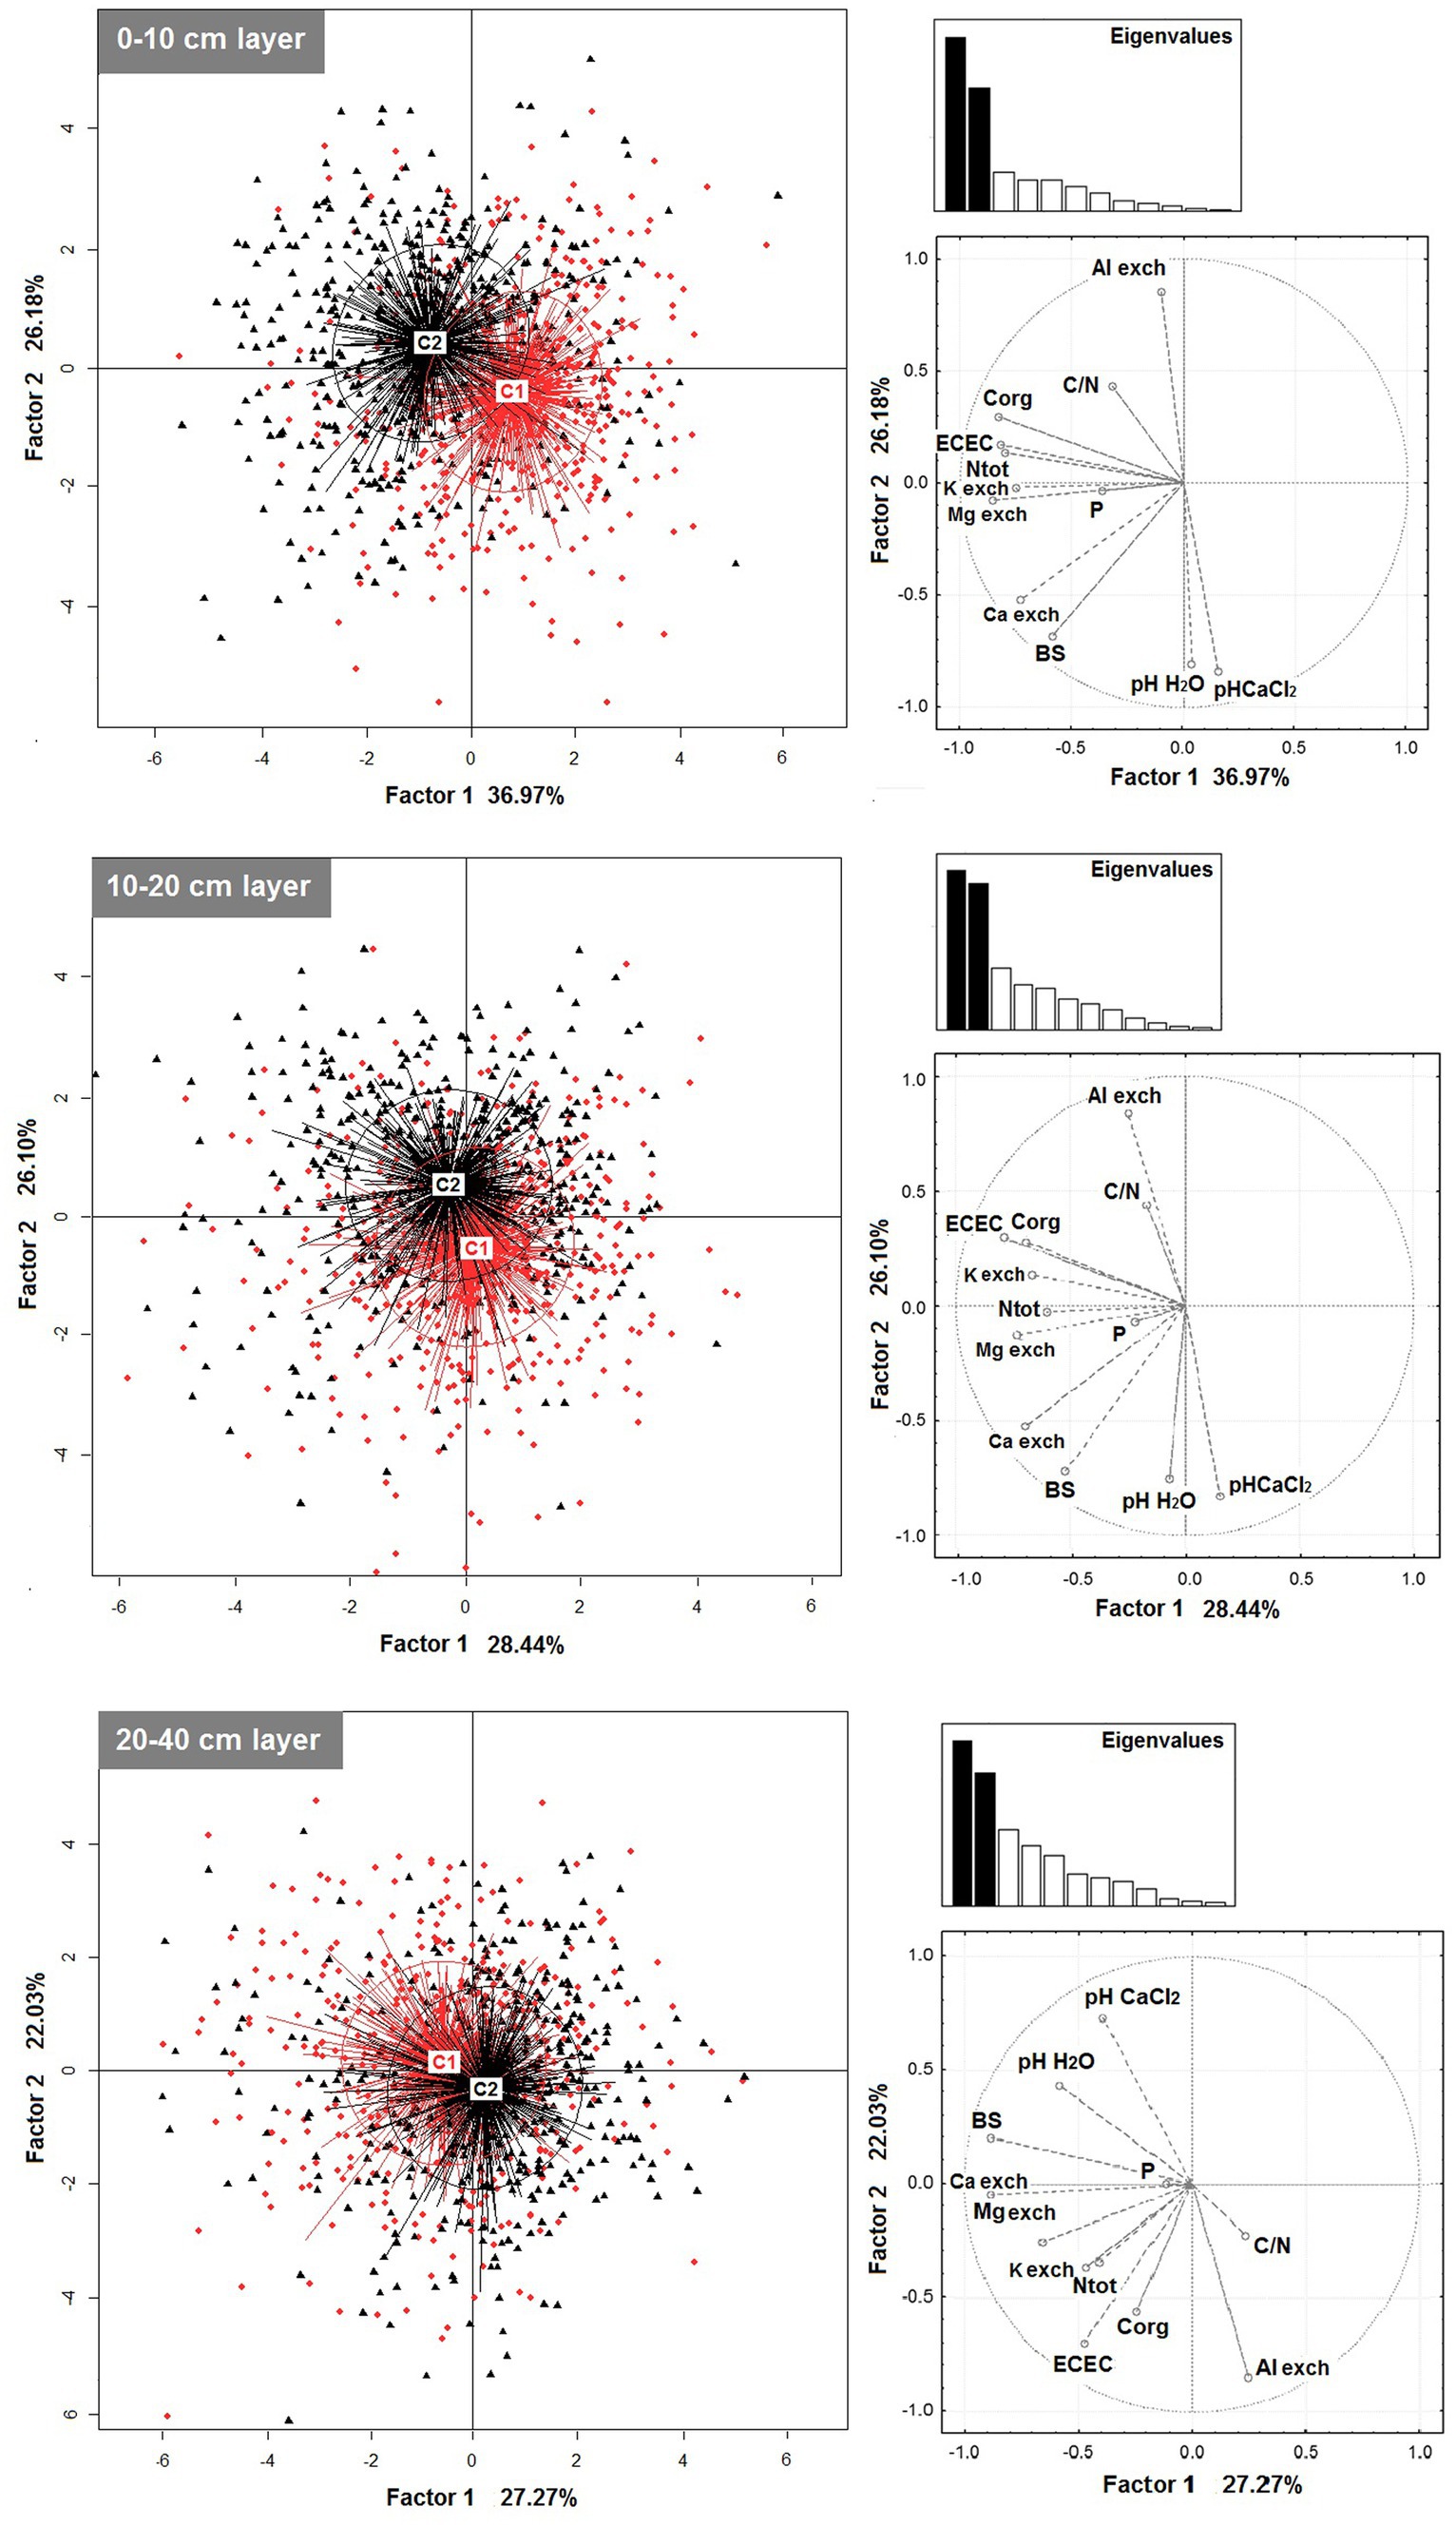
Figure 3. Principal Component Analysis (PCA) of normalized data according to soil layers (mineral soil only). The left plots show the projection of the subplot data clustered by campaign on the first two components. The right plots show the projection of variables on the same components.
Many changes in soil parameters between the two campaigns were significantly correlated to each other, and most of them were observed in the three mineral soil layers, though with varying strengths in some cases (see Supplementary material S1 for Spearman rank correlation matrices for soil parameter changes in each layer). In all soil layers, there was an inverse correlation between change in pH H2O or pH CaCl2 and change in exchangeable Al, while the correlation between both pH changes was always positive. The change in SOC was positively related to the change in Ntot as well as in ECEC for all layers, while it was negatively related to change in pH CaCl2. There was a positive correlation between the change in ECEC and the change in all exchangeable base cations (K, Ca, Mg) throughout the soil profile; by contrast, the correlation between the change in ECEC and the change in exchangeable Al was only significant in the 10–20 and 20–40 cm layers. Finally, for each layer, the change in BS was positively correlated with the change of pHs (H2O, CaCl2) and of all exchangeable base cations, but negatively related to changes in exchangeable Al.
3.3 Contrasted evolutions for different soil trophic levels
Aside the overall temporal evolution of soil parameters presented above for all soil types together, contrasted change patterns were found among the three considered different classes of trophic levels (Figure 4 Supplementary material S2). Highly acidic soils (pH H2O < 4.5), corresponding to nearly 50% of the plots, exhibited indices of further acidification process with a significant decrease in soil pHs (1.9 and 2.9% decrease for pH H2O and pH CaCl2, respectively) and an increase in exchangeable Al concentrations (10.1% increase) especially pronounced in the 0–10 cm soil layer and tending to weaken with increasing depth. Nevertheless, aside these acidification indices and the general decrease of BS, these soils also exhibited increasing exchangeable Ca (2.7% increase), Mg (12.5% increase) and K (12.5% increase) concentrations over the whole profile, though not significantly for the former element. In contrast, low-acid soils (pH H2O > 5.5) presented unchanged or increasing (pH H2O in the 20–40 cm layer: 2.4% increase) pHs between the two campaigns, no significant change in BS, stable or decreasing (20–40 cm layer) exchangeable Al stocks and a general increase in exchangeable Ca, especially for the 0–40 cm layers (14.1% increase on average). Soils with initial pH H2O ranging between 4.5 and 5.5 showed intermediate change patterns for these properties. Another noticeable difference among trophic levels is the particularly sharp decrease of total nitrogen in the 10–40 cm soil layers of the highly acidic soils (21.5% decrease on average) compared with the corresponding lower reduction for low-acidic soils (6.4% decrease on average, significant for the 20–40 cm layer only), while changes of Ntot stocks in the upper mineral layer and the forest floor were weaker and close for all trophic levels.
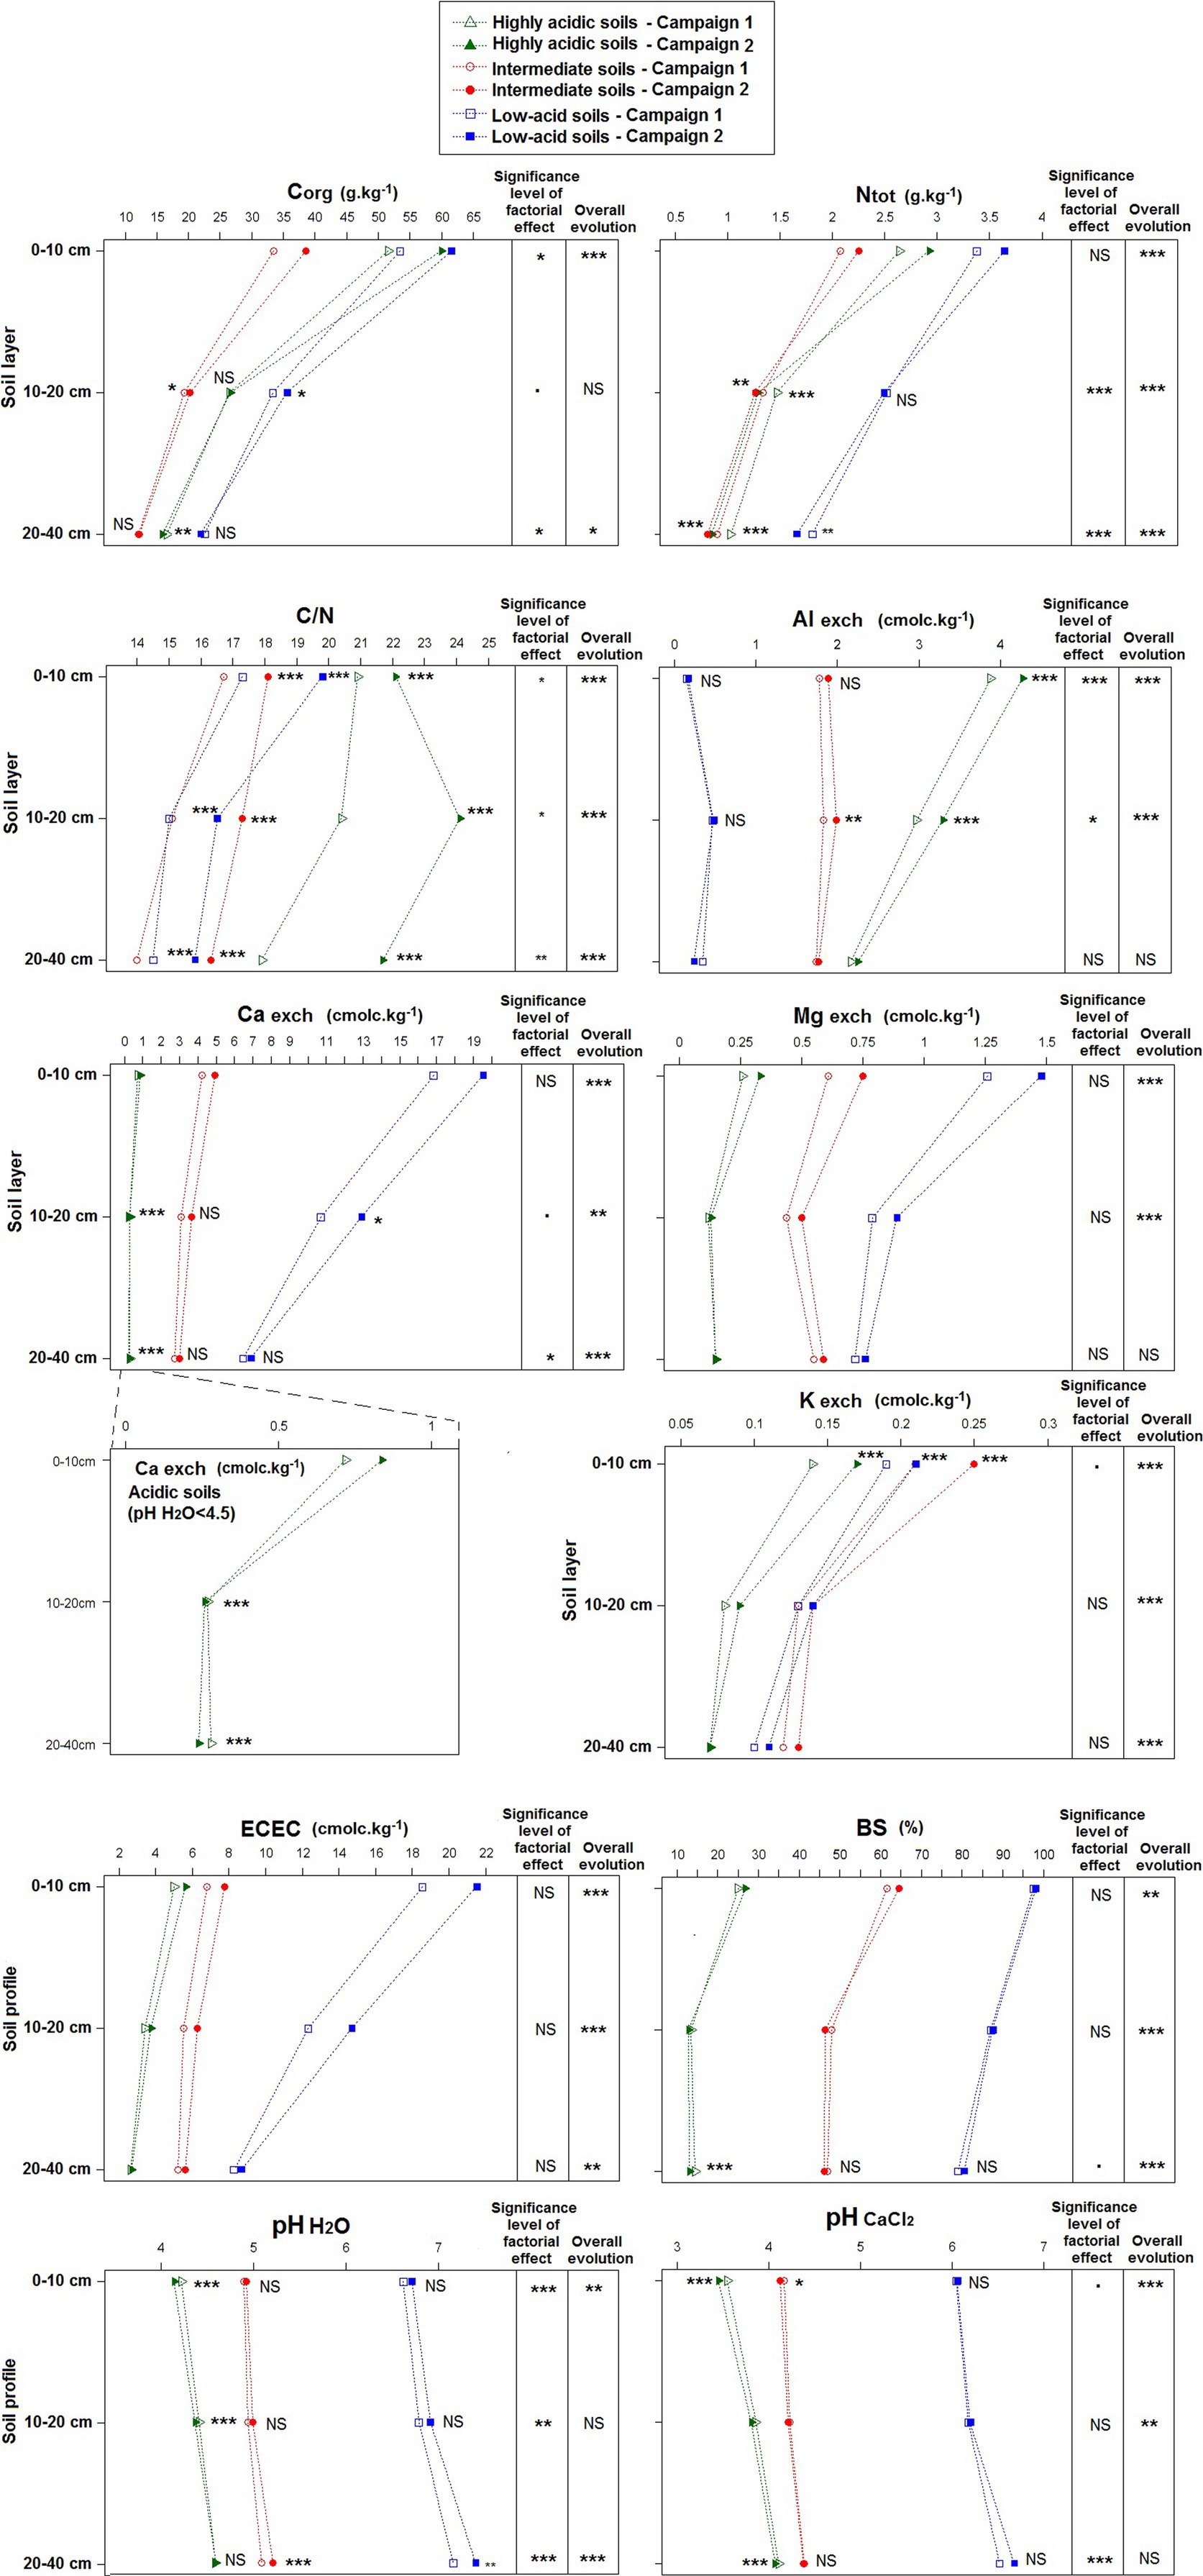
Figure 4. Evolution of the soil chemical parameters in the different mineral soil layers (0 to 40 cm) according to the trophic levels for highly acidic soils (pH H2O < 4.5, green), intermediate soils (pH H2O 4.5–5.5, red) and low-acid soils (pH H2O > 5.5, blue) between the first (open symbol) and the second (closed symbol) campaigns. The overall evolution refers to the significance of the campaign effect over the whole data set [Table 3; Equation (4)]. The factorial effect refers to the interaction between campaign and the trophic level; when significant, a linear mixed model was run separately for each trophic level to test for the campaign effect (Supplementary material S2). Statistical significance levels are indicated as follows: *<0.10; *<0.05; **<0.01; ***<0.001; NS, non-significant.
For organic carbon, SOC stocks increased significantly in the 0–10 cm mineral layer with similar relative amplitude for all soil types (14.3% increase on average). SOC relative change decreased as moving down in the profile to become significantly negative in the 20–40 cm layer of the highly acidic soils (4.2% decrease) and non-significant for the two other trophic levels. Regarding the forest floor, substantial increase of SOC stock (12.3% increase) was observed for highly acidic soils while the amplitude of the differences among campaigns decreased with increasing trophic level and was found to be non-significant for low-acidic soils. As a result of these patterns for Ntot and SOC, the C/N ratio rose significantly among campaigns in all cases, though with increasing differences from the forest floor (4.8% increase) to the lowest mineral soil layer (21.2% increase) for the more acidic soils and inversely for the lowest ones (forest floor: 14.9% increase, 20–40 cm layer: 9.0% increase). Considering the whole profile, the average temporal increase of the C/N ratio raised with soil acidity.
4 Discussion
4.1 Overall consistency of detected trends and major soil changes
Significant changes were detected for many chemical parameters during t15-year monitoring period, illustrating the potential of such network to highlight even small changes in soil properties while the risk of detecting “false” trends was limited by accounting for effect size (Sullivan and Feinn, 2012). The correlations between temporal changes in soil parameters were in agreement with well established relationships between soil parameters (positive relationship between ECEC and SOC, pH correlated negatively with exchangeable Al and positively with exchangeable Ca and Mg), which supports the observed trends. The observed trends were also in agreement with the reported evolution of key potential drivers (see below).
The relative or absolute change strongly differed according to the parameter or the soil layer. As expected and also reported by other authors (e.g., Lawrence et al., 2015; Berger et al., 2016; Fraser et al., 2019), the change in the soil chemical properties tended to decrease with depth, with no or only limited effect in the 20–40 cm layer except for total N and the C/N ratio. However, when integrated over the whole soil profile (0–40 cm), the changes in some parameters including increase in C stocks, C/N ratio, ECEC as well as exchangeable K and Mg, were strong enough to be significant and associated to at least a medium size effect.
The mixed models together with the PCAs results showed contrasting evolution patterns between the top mineral 0–10 cm layer and the underlying 10–20 cm and 20–40 cm layers. For the topsoil, results from both analyses showed an increase in SOC, exchangeable cations (ECEC, base cations), acidity (lower pH, higher exchangeable Al) and total N contents. For the underlying layers, the dominant temporal change was an acidification trend (increase in exchangeable Al, decrease in pH) when considering the PCA results, while the mixed-models highlighted a decrease in Ntot, a moderate increase in all exchangeable cations (including Al) and no or little change in SOC. As the increase in ECEC could not be ascribed to SOC changes in these deep layers, the additional exchangeable base cations and Al should have replaced exchangeable sites occupied by a cation not accounted for in the calculation of ECEC. We hypothesize that this could be NH4+, which could also explain the observed decrease of Ntot.
4.2 Major drivers of soil change
The evolution of soils may be ascribed to change in inputs and outputs of elements under solid, liquid and gaseous forms associated with a range of processes. In the following section we will show how the reported recent change in two major element fluxes, namely, increase in C sequestration (Jonard et al., 2017) and reduced inorganic N inputs (Waldner et al., 2014), contributed to the observed changes in soil chemistry within such a short time span.
4.2.1 SOC sequestration as a major driver of soil evolution in the top mineral soil
During the 15-year monitoring period, the SOC stocks significantly increased in the forest floor (+1.2 MgC) and in the 0–10 cm mineral soil layer (+4.3 MgC), which resulted in an overall sequestration rate of 0.35 MgC ha−1 yr.−1 for the whole soil profile (Jonard et al., 2017). As the reasons of the SOC changes have been discussed in detail by Jonard et al. (2017), the present discussion will focus on the consequences those changes had on the overall soil properties of the top mineral soil layer. First, the increase in ECEC may be ascribed to the additional exchange sites resulting from the pH-dependent charge brought by SOM (Helling et al., 1964; Sparks et al., 2024). The ratio between the change in ECEC and the extra SOC concentrations amounts to ca 0.12 cmolc g−1C in the 0–10 cm layer, which is lower than corresponding values reported in literature ranging between 0.2 and 0.8 cmolc g−1C and averaging around 0.47 cmolc g−1C (Skyllberg et al., 2001; Gruba and Mulder, 2015). Nevertheless, these literature values refer to total cation exchange capacity, determined by adding the total titratable acidity to the sum of exchangeable base cations, while our ECEC values consider the latter component and only the part of total titratable acidity associated with exchangeable Al [see Equation (1)]. The relative rise in exchangeable base cations and Al accompanying the ECEC increase is governed by selectivity coefficients relating the composition of the solution and the exchanger (Bourg and Sposito, 2011). On average, exchangeable K and Mg were the two cations mostly associated to the increase in ECEC, while the change in exchangeable Al appeared to be independent from change in ECEC and Ca showing an intermediate status (Figure 3). Second, the increase in SOC may also have contributed to the limited, yet significant, pH decrease (Table 3) with the latter driving the increase in exchangeable Al through solubilization of Al oxyhydroxides and Al-bearing minerals (Johnson et al., 1981) and/or complexation with organic matter (Berggren and Mulder, 1995; Van Hees et al., 2001; Li and Johnson, 2016). Consequently, the lack of correlation between change in exchange Al and change in ECEC could be explained by the additional complexation due to the increase in SOC. Finally, as expected from the elementary composition of organic matter (Kirkby et al., 2011; Tipping et al., 2016), the increase in SOC was also associated with a rise in total N, though to a lesser extent. The resulting increased C/N ratio in the surface layers (forest floor and 0–10 cm depth) may reflect an accumulation of poorly decomposed (rich in C) OM during the monitoring period. According to Grüneberg et al. (2014), the raise of C/N ratio of organic layers and topsoil observed in Germany for the poorest soils may be attributed to a reduction of mineralization, due to changes in soil microbial community composition and to organic matter stabilization (Berg and Matzner, 1997; Janssens et al., 2010; Maaroufi et al., 2019), and to the accumulation of SOC subsequent to the high atmospheric N deposition (de Vries et al., 2009).
4.2.2 Reduction of total nitrogen in the mineral soil and general increase in C/N ratio
In the forest floor and the top mineral soil layer, the increase of total N stocks was concomitant with the raise of SOC stocks, but was proportionally lower. By contrast, the changes in SOC and total N stocks were decoupled in the lower soil layers, with no (10–20 cm) or a limited (20–40 cm) change in SOC and a strong decrease in total N. Those changes resulted in a significant increase in C/N ratio in all soil layers. Also, when integrated over the 0–40 cm layer, there was a significant decrease of total N storage (Table 3). When compared with studies using a resampling approach during a similar time period, our results agree with those of Steffens et al. (2022), but conflict with studies that either did not detect any change (e.g., Fraser et al., 2019; Clesse et al., 2022), or reported a net N accumulation (Ross et al., 2021). On the other hand, our results are supported by the study of Clesse (2023). Using an input–output budget approach for a series of stands including some of our plots over the two last decades, this author observed a large majority (12 out of 14) of negative N budgets for nitrogen, with budget balances ranging from −26.4 to +1.3 kgN.ha−1.yr.−1 (average of −8.0 kgN.ha−1.yr.−1). Our estimated loss of 0.2 ± 0.06 MgN.ha−1 down to 40 cm depth between the two soil surveys (see Table 3) corresponds to an average annual decrease of 13 ± 4.3 kgN.ha−1.yr.−1, which is consistent with Clesse’s input–output nitrogen budgets.
The reduction of soil total N observed in our case is compatible with the temporal pattern of atmospheric N deposition over Europe and eastern North America, characterized by an historical increase since the 1950s till the mid-1980s, followed by a decline since the 1990s (Engardt et al., 2017; Feng et al., 2021). Based on measurements carried out over the French territory, open field N deposition averaged around 10.7 and 7.2 kgN.ha−1 yr.−1 for the periods of the first (1993–1995) and the second (2007–2012) soil campaigns, respectively. Corresponding average values for N deposition under forest amount to 9.4 and 7.2 kgN.ha−1 yr.−1 (Pascaud et al., 2016; IGN, 2020). Though large variations around these averages are observed depending notably on the region and on the stand species and structure, these values indicate a decrease of annual deposition under forest around 2.2 kgN.ha−1 between both periods (i.e., a reduction by 0.15 kgN.ha−1.yr.−1), which cannot explain alone the average loss of 13 kgN.ha−1.yr.−1 over the soil profile mentioned above. Assuming a sustained elevated forest productivity under the combined effects of CO2 fertilization, climate change and improved N availability (Norby et al., 2005; Solberg et al., 2009; Bontemps et al., 2011), the related high N vegetation uptake might also partly explain the depletion of soil Ntot. Irrespective of whether forest productivity was sustained or not (Kint et al., 2012; Etzold et al., 2020), the depletion of Ntot could also result from the nitrification of NH4+ previously accumulated on the exchange complex followed by nitrate leaching. It is interesting to note that the uptake of NH4+ by vegetation and nitrification are two processes associated with a release of protons in the soil solution (van Breemen et al., 1983; Bolan et al., 1991), which contributes to the mobilization of aluminum and base cations from the solid pools. The occurrence of such processes could therefore explain the observed increase in exchangeable cations despite no change (10–20 cm layer) or a decrease (20–40 cm layer) in SOC. It also corroborates the presence on the exchange complex of cations not considered in ECEC computation, such as NH4+, as already postulated above.
In addition to the above hypotheses, the relative development of the shrub layers (Archaux et al., 2009; Boulanger, 2010) in the fenced plots protected from ungulates, and the associated N uptake and immobilization in woody biomass, may also have contributed to this decrease in N stocks.
Finally, the complexity associated with the biogeochemical cycle of this nutrient is highlighted by several studies which reported inexplicably large changes in soil N (e.g., Knoepp and Swank, 1997; Johnson and Todd, 1998; Trettin et al., 1999); this makes its thorough characterization and understanding particularly challenging.
4.3 Specific evolutions according to the initial soil trophic level
Contrasting changes of soil properties as a function of the soil trophic level have been observed by several authors (Kirk et al., 2010; Vanguelova et al., 2010; Cools and De Vos, 2011; Jandl et al., 2012; Hazlett et al., 2020). For all these works, the soil resampling interval covered the period of strong reduction of N and S atmospheric deposition. The comparison of soil types mainly focused on the variations of soil pH over that period, showing generally a more pronounced increase of pH for the acidic soils (pH < 5.5) than for soils with intermediate (pH 5.5–7.0) or high (pH > 7.0) values for which smaller changes, corresponding even sometimes to a pH decrease, were found. Such results suggest that recovery from acidification following the decline in acidic deposition would primarily occur for acidic soils in which the dissolution of aluminosilicates is the main process involved in acid neutralization, than for soils in which cation exchange or carbonate dissolution is the dominant acid buffering mechanism. Yet, these findings differ from our observations of decreasing pH values for the highly acidic soils (especially in the upper mineral soil layer) and of pH stagnation or increase for the intermediate and low-acidic soils (Figure 4; Supplementary material S2). The reasons for the divergences between our results and those of the above works are not straightforward. Investigating changes in forest soil properties at the European level, Cools and De Vos (2011) hypothesized that the observed contrasting temporal trend of soil pH among trophic levels could be due to the spatial patterns of soil types and atmospheric deposition. Indeed, the soils with relatively high pH are better represented in the southern part of Europe and mainly rely on atmospheric deposition for the supply of base cations, which also decreased in parallel with N deposition; in contrast, more acidic soils are mainly located in northwest and northern Europe, and mostly rely on weathering as a source of base cations (Draaijers et al., 1997). Kirk et al. (2010) indicated that pH increase following a decline in acidic deposition is more likely for soils with pH lower than 5.5, in which the dissolution of aluminosilicate minerals is the main weathering mechanism for increasing soil pH, than for soils in which carbonate dissolution (pH ≥ 7) or cation exchange (pH between 5.5 and 7) is the dominating buffering process. In our study, the SOC increase in the top mineral soil associated with the pronounced rise of exchangeable Al for the highly acidic soils would favor complexation of this element with organic acids, which is accompanied with the liberation of protons and would lead to a decrease of pH in these acid soils (Nissinen et al., 1999). Moreover, the nitrification of NH4+ postulated above as a potential explanation for Ntot depletion, which is especially pronounced for highly acidic soils, would also give rise to a further decrease of soil pH in these contexts. Besides, the influence of other factors superimposing on that of the soil trophic level on the evolution of the pH, such as notably the effect of the species composition (Ahrends et al., 2022; Clesse et al., 2022), might also at least partly explain the differences between our results and findings of previous studies. Nevertheless, within the RENECOFOR plots, deciduous species are more frequently associated with eutrophic soils while conifers are mainly found on intermediate and acidic soils, with only few exceptions to this general pattern (Table 1). Therefore, the effect of species can hardly be distinguished from that of the soil trophic level. In addition, as already highlighted by Jonard et al. (2017) when analyzing SOC changes, coniferous stands are on average 30 years younger than deciduous ones within the network, so the effect of age also overlaps with that of species. In other respects, the larger amplitude of the increase of SOC stocks observed in the forest floor of the highly acidic soils compared with the two other soil types (Supplementary material S2) would arise from a reduced decomposition of organic matter in acidic contexts, which is corroborated by the much larger SOC pools at the more acid sites.
4.4 Expected long-term effects of the detected changes
While many significant changes were detected, some of them were of very limited amplitude with therefore few expected ecological consequences, except in contexts of nutrient limitation or imbalance for which the increase of the availability of the limiting nutrient or the alleviation of the disequilibrium might have substantial effects on ecosystem functioning. In contrast, the large changes observed in SOC and Ntot stocks are likely to have general consequences. The rise of SOC between 0 and 10 cm resulted in an increase in buffering capacity of soil. Yet, in the current context of global change, such an accumulation of SOC in the surface soil raises questions with regard to its biogeochemical stability. In interface position with the atmosphere and vegetation, the surface soil is more exposed to climate changes and land use changes than the deep mineral layers (Lozano-García et al., 2017). In the French forest soils, the accumulated SOC might be more vulnerable to climate and/or anthropogenic perturbations and be more quickly destabilized than the deep C pool (Soucémarianadin et al., 2018, 2019). However to date, the relative vulnerability of the surface vs deep C stocks to environmental changes remains an open question (Schmidt et al., 2011). Besides, the N decrease in the deep soil layers, particularly marked in the highly acidic soils, raises questions as to the consequences of such changes for tree nutrition. Nitrogen, considered until recently as being in excess in areas having been subject to elevated N deposition (Jonard et al., 2015), might now become limiting for tree growth (Etzold et al., 2020). Nevertheless, while the influence of N exceedance on forests has been widely studied, the response of the ecosystems to N deposition decline is still rather poorly documented and further research should be conducted in that direction (Schmitz et al., 2019).
Data availability statement
Publicly available datasets were analyzed in this study. This data can be found at: https://zenodo.org/record/8391353.
Author contributions
AS: Conceptualization, Formal analysis, Visualization, Writing – original draft, Writing – review & editing. FA: Writing – original draft, Writing – review & editing. MJ: Conceptualization, Supervision, Writing – review & editing. MN: Conceptualization, Funding acquisition, Supervision, Writing – review & editing. QP: Conceptualization, Supervision, Writing – review & editing.
Funding
The author(s) declare financial support was received for the research, authorship, and/or publication of this article. This work was supported by the National Forests Office, the Ministry of Agriculture, the Ministry of Ecology, and the ADEME in France, as well as the European Union.
Acknowledgments
The French Permanent Plot Network for the Monitoring of Forest Ecosystems (RENECOFOR) is part of the ICP Forests monitoring program under the UN Convention on Long Range Transboundary Air Pollution. We gratefully acknowledge all the site investigators, the persons in charge of the forest stations, the technicians, and the researchers who helped for collection and analysis of data.
Conflict of interest
The authors declare that the research was conducted in the absence of any commercial or financial relationships that could be construed as a potential conflict of interest.
Publisher’s note
All claims expressed in this article are solely those of the authors and do not necessarily represent those of their affiliated organizations, or those of the publisher, the editors and the reviewers. Any product that may be evaluated in this article, or claim that may be made by its manufacturer, is not guaranteed or endorsed by the publisher.
Supplementary material
The Supplementary material for this article can be found online at: https://www.frontiersin.org/articles/10.3389/ffgc.2024.1338239/full#supplementary-material
References
Aber, J., McDowell, W., Nadelhoffer, K., Magill, A., Berntson, G., Kamakea, M., et al. (1998). Nitrogen saturation in temperate forest ecosystems: hypotheses revisited. Bioscience 48, 921–934. doi: 10.2307/1313296
Adhikari, K., and Hartemink, A. E. (2016). Linking soils to ecosystem services—a global review. Geoderma 262, 101–111. doi: 10.1016/j.geoderma.2015.08.009
Ahrends, B., Fortmann, H., and Meesenburg, H. (2022). The influence of tree species on the recovery of Forest soils from acidification in Lower Saxony, Germany. Soil Syst 6:6020040. doi: 10.3390/soilsystems6020040
Archaux, F., Boulanger, V., Camaret, S., Corcket, E., Dupouey, J.-L., Forgeard, F., et al. (2009). RENECOFOR—Dix ans de suivi de la végétation forestière: aspects méthodologiques et évolution temporelle de la flore (1994/95–2005). Fontainebleau: Office National des Forêts, Direction Technique et Commerciale Bois.
Berg, B., and Matzner, E. (1997). Effect of N deposition on decomposition of plant litter and soil organic matter in forest systems. Environ. Rev. 5, 1–25. doi: 10.1139/a96-017
Berger, T. W., Türtscher, S., Berger, P., and Lindebner, L. (2016). A slight recovery of soils from acid rain over the last three decades is not reflected in the macro nutrition of beech (Fagus sylvatica) at 97 forest stands of the Vienna Woods. Environ. Pollut. 216, 624–635. doi: 10.1016/j.envpol.2016.06.024
Berggren, D., and Mulder, J. (1995). The role of organic matter in controlling aluminum solubility in acidic mineral soil horizons. Geochim. Cosmochim. Acta 59, 4167–4180. doi: 10.1016/0016-7037(95)94443-J
Bolan, N. S., Hedley, M. J., and White, R. E. (1991). Processes of soil acidification during nitrogen cycling with emphasis on legume based pastures. Plant and Soil 134, 53–63. doi: 10.1007/BF00010717
Bontemps, J. D., Hervé, J. C., Leban, J. M., and Dhôte, J. F. (2011). Nitrogen footprint in a long-term observation of forest growth over the twentieth century. Trees Struct Funct 25, 237–251. doi: 10.1007/s00468-010-0501-2
Boulanger, V. (2010). Pression d’herbivorie et dynamique des communautés végétales: influence à court et moyen termes des populations de cervidés sur la diversité des communautés végétales en forêt. PhD Thesis, Université Henri Poincaré, Vandoeuvre-lès-Nancy, France.
Bourg, L., and Sposito, G. (2011). “Ion exchange phenomena” in Handbook of soil sciences properties and processes. eds. P. M. Huang, Y. Li, and M. E. Sumner. 2nd ed (New York, NY: CRC Press / Taylor & Francis Group), 1–16.
Bowden, R. D., Wurzbacher, S. J., Washko, S. E., Wind, L., Rice, A. M., Coble, A. E., et al. (2019). Long-term nitrogen addition decreases organic matter decomposition and increases forest soil carbon. Soil Sci. Soc. Am. J. 83, S82–S95. doi: 10.2136/sssaj2018.08.0293
Boxman, A. W., Peters, R. C., and Roelofs, J. G. (2008). Long term changes in atmospheric N and S throughfall deposition and effects on soil solution chemistry in a scots pine forest in the Netherlands. Environ. Pollut. 156, 1252–1259. doi: 10.1016/j.envpol.2008.03.017
Canham, C. D., Cole, J. J., and Lauenroth, W. K. (2003). Models in ecosystem science. Princeton: Princeton University Press. doi: 10.2307/j.ctv1dwq0tq
Clesse, M. (2023). Etude multi-sites de la réponse de la fertilité chimique des écosystèmes forestiers dans un contexte de changements (dépôts atmosphériques et substitution d'essences). PhD Thesis, Université de Lorraine, Ecole Doctorale SIReNa "Sciences et Ingénierie des Ressources Naturelles", Nancy, France, Institut National de Recherche pour l'Agriculture, l'Alimentation et l'Environnement, UR 1138—Biogéochimie des Ecosystèmes Forestiers, Champenoux, France.
Clesse, M., Legout, A., Ranger, J., Zeller, B., and van der Heijden, G. (2022). Soil chemical fertility change over four decades in the Morvan Mountains and influence of tree species (Burgundy, France). For Ecosyst 9:100043. doi: 10.1016/j.fecs.2022.100043
Cohen, J. (1973). Eta-squared and partial eta-squared in fixed factor anova designs. Educ. Psychol. Meas. 33, 107–112. doi: 10.1177/001316447303300111
Cohen, J. (1988). Statistical power analysis for the behavioral sciences. Hillsdale, New Jersey: Lawrence Erlbaum Associates.
Cools, N., and De Vos, B. (2011). Availability and evaluation of European forest soil monitoring data in the study on the effects of air pollution on forests. iForest Biogeosci Forest 4, 205–211. doi: 10.3832/ifor0588-004
Cools, N., and De Vos, B. (2013). “Chapter 15—Forest soil: characterization, sampling, physical, and chemical analyses” in Developments in environmental science. eds. M. Ferretti and R. Fischer (Amsterdam: Elsevier), 267–300.
Cremer, M., and Prietzel, J. (2017). Soil acidity and exchangeable base cation stocks under pure and mixed stands of European beech, Douglas fir and Norway spruce. Plant and Soil 415, 393–405. doi: 10.1007/s11104-017-3177-1
De Vos, B., Cools, N., Ilvesniemi, H., Vesterdal, L., Vanguelova, E., and Carnicelli, S. (2015). Benchmark values for forest soil carbon stocks in Europe: results from a large scale forest soil survey. Geoderma 251-252, 33–46. doi: 10.1016/j.geoderma.2015.03.008
de Vries, W., Dobbertin, M. H., Solberg, S., van Dobben, H. F., and Schaub, M. (2014). Impacts of acid deposition, ozone exposure and weather conditions on forest ecosystems in Europe: an overview. Plant and Soil 380, 1–45. doi: 10.1007/s11104-014-2056-2
de Vries, W., and Schulte-Uebbing, L. (2019). “Impacts of nitrogen deposition on Forest ecosystem services and biodiversity” in Atlas of ecosystem services: Drivers, risks, and societal responses. eds. M. Schröter, A. Bonn, S. Klotz, R. Seppelt, and C. Baessler (Cham: Springer International Publishing), 183–189.
de Vries, W., Solberg, S., Dobbertin, M., Sterba, H., Laubhann, D., van Oijen, M., et al. (2009). The impact of nitrogen deposition on carbon sequestration by European forests and heathlands. For. Ecol. Manage. 258, 1814–1823. doi: 10.1016/j.foreco.2009.02.034
de Vries, W., Vel, E., Reinds, G. J., Deelstra, H., Klap, J. M., Leeters, E. E. J. M., et al. (2003). Intensive monitoring of forest ecosystems in Europe 1. Objectives, set-up and evaluation strategy. For. Ecol. Manage. 174, 77–95. doi: 10.1016/S0378-1127(02)00029-4
Dohrmann, R., and Kaufhold, S. (2009). Three new, quick CEC methods for determining the amounts of exchangeable calcium cations in calcareous clays. Clays Clay Miner. 57, 338–352. doi: 10.1346/CCMN.2009.0570306
Draaijers, G. P. J., Van Leeuwen, E. P., De Jong, P. G. H., and Erisman, J. W. (1997). Base-cation deposition in Europe—part II. Acid neutralization capacity and contribution to forest nutrition. Atmos. Environ. 31, 4159–4168. doi: 10.1016/S1352-2310(97)00253-7
Dray, S., and Dufour, A.-B. (2007). The ade4 package: implementing the duality diagram for ecologists. J. Stat. Softw. 22, 1–20. doi: 10.18637/jss.v022.i04
Engardt, M., Simpson, D., Schwikowski, M., and Granat, L. (2017). Deposition of Sulphur and nitrogen in Europe 1900–2050. Model calculations and comparison to historical observations. Tellus B Chem. Phys. Meteorol. 69:1328945. doi: 10.1080/16000889.2017.1328945
Erisman, J. W., and De Vries, W. (2000). Nitrogen deposition and effects on European forests. Environ. Rev. 8, 65–93. doi: 10.1139/a00-006
Etzold, S., Ferretti, M., Reinds, G. J., Solberg, S., Gessler, A., Waldner, P., et al. (2020). Nitrogen deposition is the most important environmental driver of growth of pure, even-aged and managed European forests. For. Ecol. Manage. 458:117762. doi: 10.1016/j.foreco.2019.117762
Feng, J., Vet, R., Cole, A., Zhang, L., Cheng, I., O'Brien, J., et al. (2021). Inorganic chemical components in precipitation in the eastern U.S. and eastern Canada during 1989–2016: temporal and regional trends of wet concentration and wet deposition from the NADP and CAPMoN measurements. Atmos. Environ. 254:118367. doi: 10.1016/j.atmosenv.2021.118367
Ferretti, M., König, N., Granke, O., and Nicolas, M. (2021). “Part III: Quality assurance within the ICP forests monitoring programme” in Manual on methods and criteria for harmonized sampling, assessment, monitoring and analysis of the effects of air pollution on forests (Eberswalde, Germany: Thünen Institute of Forest Ecosystems)
Ferretti, M., Marchetto, A., Arisci, S., Bussotti, F., Calderisi, M., Carnicelli, S., et al. (2014). On the tracks of nitrogen deposition effects on temperate forests at their southern European range—an observational study from Italy. Glob. Chang. Biol. 20, 3423–3438. doi: 10.1111/gcb.12552
Fraser, O. L., Bailey, S. W., and Ducey, M. J. (2019). Decadal change in soil chemistry of northern hardwood forests on the White Mountain National Forest, New Hampshire, USA. Soil Sci. Soc. Am. J. 83, S96–S104. doi: 10.2136/sssaj2018.08.0301
Frey, S. D., Ollinger, S., Nadelhoffer, K., Bowden, R., Brzostek, E., Burton, A., et al. (2014). Chronic nitrogen additions suppress decomposition and sequester soil carbon in temperate forests. Biogeochemistry 121, 305–316. doi: 10.1007/s10533-014-0004-0
Gentilesca, T., Rita, A., Brunetti, M., Giammarchi, F., Leonardi, S., Magnani, F., et al. (2018). Nitrogen deposition outweighs climatic variability in driving annual growth rate of canopy beech trees: evidence from long-term growth reconstruction across a geographic gradient. Glob. Chang. Biol. 24, 2898–2912. doi: 10.1111/gcb.14142
Gruba, P., and Mulder, J. (2015). Tree species affect cation exchange capacity (CEC) and cation binding properties of organic matter in acid forest soils. Sci. Total Environ. 511, 655–662. doi: 10.1016/j.scitotenv.2015.01.013
Grüneberg, E., Schöning, I., Hessenmöller, D., Schulze, E. D., and Weisser, W. W. (2013). Organic layer and clay content control soil organic carbon stocks in density fractions of differently managed German beech forests. For. Ecol. Manage. 303, 1–10. doi: 10.1016/j.foreco.2013.03.014
Grüneberg, E., Ziche, D., and Wellbrock, N. (2014). Organic carbon stocks and sequestration rates of forest soils in Germany. Glob. Chang. Biol. 20, 2644–2662. doi: 10.1111/gcb.12558
Hazlett, P., Emilson, C., Lawrence, G., Fernandez, I., Ouimet, R., and Bailey, S. (2020). Reversal of forest soil acidification in the northeastern United States and eastern Canada: site and soil factors contributing to recovery. Soil Syst 4, 1–22. doi: 10.3390/soilsystems4030054
Helling, C. S., Chesters, G., and Corey, R. B. (1964). Contribution of organic matter and clay to soil cation-exchange capacity as affected by the pH of the saturating solution. Soil Sci. Soc. Am. J. 28, 517–520. doi: 10.2136/sssaj1964.03615995002800040020x
Hyvönen, R., Ågren, G. I., Linder, S., Persson, T., Cotrufo, M. F., Ekblad, A., et al. (2007). The likely impact of elevated [CO2], nitrogen deposition, increased temperature and management on carbon sequestration in temperate and boreal forest ecosystems: a literature review. New Phytol. 173, 463–480. doi: 10.1111/j.1469-8137.2007.01967.x
IGN (2020). Indicators of sustainable management in France. Available at: https://foret.ign.fr/IGD/en/indicateurs/2.1 (Accessed 12 January 2024).
Iost, S., Rautio, P., and Lindroos, A.-J. (2012). Spatio-temporal trends in soil solution Bc/Al and N in relation to critical limits in European Forest soils. Water Air Soil Pollut. 223, 1467–1479. doi: 10.1007/s11270-011-0958-7
Jandl, R., Leitgeb, E., and Englisch, M. (2022). Decadal changes of organic carbon, nitrogen, and acidity of Austrian Forest soils. Soil Syst 6:10028. doi: 10.3390/soilsystems6010028
Jandl, R., Rodeghiero, M., Martinez, C., Cotrufo, M. F., Bampa, F., van Wesemael, B., et al. (2014). Current status, uncertainty and future needs in soil organic carbon monitoring. Sci. Total Environ. 468-469, 376–383. doi: 10.1016/j.scitotenv.2013.08.026
Jandl, R., Smidt, S., Mutsch, F., Fürst, A., Zechmeister, H., Bauer, H., et al. (2012). Acidification and nitrogen eutrophication of austrian forest soils. Appl. Environ. Soil Sci. 602, 1–9. doi: 10.1155/2012/632602
Janssens, I. A., Dieleman, W., Luyssaert, S., Subke, J. A., Reichstein, M., Ceulemans, R., et al. (2010). Reduction of forest soil respiration in response to nitrogen deposition. Nat. Geosci. 3, 315–322. doi: 10.1038/ngeo844
Johnson, N. M., Driscoll, C. T., Eaton, J. S., Likens, G. E., and McDowell, W. H. (1981). 'Acid rain', dissolved aluminum and chemical weathering at the Hubbard brook experimental Forest, New Hampshire. Geochim. Cosmochim. Acta 45, 1421–1437. doi: 10.1016/0016-7037(81)90276-3
Johnson, J., Graf Pannatier, E., Carnicelli, S., Cecchini, G., Clarke, N., Cools, N., et al. (2018). The response of soil solution chemistry in European forests to decreasing acid deposition. Glob. Chang. Biol. 24, 3603–3619. doi: 10.1111/gcb.14156
Johnson, D. W., and Todd, D. E. (1998). Harvesting effects on long-term changes in nutrient pools of mixed oak forest. Soil Sci. Soc. Am. J. 62, 1725–1735. doi: 10.2136/sssaj1998.03615995006200060034x
Jonard, M., Fürst, A., Verstraeten, A., Thimonier, A., Timmermann, V., Potočić, N., et al. (2015). Tree mineral nutrition is deteriorating in Europe. Glob. Chang. Biol. 21, 418–430. doi: 10.1111/gcb.12657
Jonard, M., Nicolas, M., Coomes, D. A., Caignet, I., Saenger, A., and Ponette, Q. (2017). Forest soils in France are sequestering substantial amounts of carbon. Sci. Total Environ. 574, 616–628. doi: 10.1016/j.scitotenv.2016.09.028
Kint, V., Aertsen, W., Campioli, M., Vansteenkiste, D., Delcloo, A., and Muys, B. (2012). Radial growth change of temperate tree species in response to altered regional climate and air quality in the period 1901-2008. Clim. Change 115, 343–363. doi: 10.1007/s10584-012-0465-x
Kirk, G. J. D., Bellamy, P. H., and Lark, R. M. (2010). Changes in soil pH across England and Wales in response to decreased acid deposition. Glob. Chang. Biol. 16, 3111–3119. doi: 10.1111/j.1365-2486.2009.02135.x
Kirkby, C. A., Kirkegaard, J. A., Richardson, A. E., Wade, L. J., Blanchard, C., and Batten, G. (2011). Stable soil organic matter: a comparison of C:N:P:S ratios in Australian and other world soils. Geoderma 163, 197–208. doi: 10.1016/j.geoderma.2011.04.010
Knoepp, J. D., and Swank, W. T. (1997). Forest management effects on surface soil carbon and nitrogen. Soil Sci. Soc. Am. J. 61, 928–935. doi: 10.2136/sssaj1997.03615995006100030031x
Knorr, M., Frey, S. D., and Curtis, P. S. (2005). Nitrogen additions and litter decomposition: a Meta-analysis. Ecology 86, 3252–3257. doi: 10.1890/05-0150
Lawrence, G. B., Hazlett, P. W., Fernandez, I. J., Ouimet, R., Bailey, S. W., Shortle, W. C., et al. (2015). Declining acidic deposition begins reversal of Forest-soil acidification in the northeastern U.S. and eastern Canada. Environ. Sci. Technol. 49, 13103–13111. doi: 10.1021/acs.est.5b02904
Li, W., and Johnson, C. E. (2016). Relationships among pH, aluminum solubility and aluminum complexation with organic matter in acid forest soils of the northeastern United States. Geoderma 271, 234–242. doi: 10.1016/j.geoderma.2016.02.030
Lorenz, M., and Fischer, R. (2013). “Pan-European Forest monitoring. An overview” in Developments in environmental science. ed. M. Ferretti and R. Fischer (Amsterdam: Elsevier), 19–32.
Lourel, M., Gueguen, N., Pascual, A., and Mouda, F. (2011). The Effect-Size: A Simple Methodology for Determining and Evaluating the “Effect-Size”. Psychology. 2, 631–632. doi: 10.4236/psych.2011.26096
Lozano-García, B., Muñoz-Rojas, M., and Parras-Alcántara, L. (2017). Climate and land use changes effects on soil organic carbon stocks in a Mediterranean semi-natural area. Sci. Total Environ. 579, 1249–1259. doi: 10.1016/j.scitotenv.2016.11.111
Maaroufi, N. I., Nordin, A., Palmqvist, K., Hasselquist, N. J., Forsmark, B., Rosenstock, N. P., et al. (2019). Anthropogenic nitrogen enrichment enhances soil carbon accumulation by impacting saprotrophs rather than ectomycorrhizal fungal activity. Glob. Chang. Biol. 25, 2900–2914. doi: 10.1111/gcb.14722
Mausolf, K., Härdtle, W., Hertel, D., Leuschner, C., and Fichtner, A. (2020). Impacts of multiple environmental change drivers on growth of European beech (Fagus sylvatica): Forest history matters. Ecosystems 23, 529–540. doi: 10.1007/s10021-019-00419-0
Mayer, M., Prescott, C. E., Abaker, W. E. A., Augusto, L., Cécillon, L., Ferreira, G. W. D., et al. (2020). Influence of forest management activities on soil organic carbon stocks: a knowledge synthesis. For. Ecol. Manage. 466:118127. doi: 10.1016/j.foreco.2020.118127
Miller, R. G. (1986). Beyond ANOVA, basics of applied statistics. New York: Wiley series in probability and mathematical statistics. Applied probability and statistics.
Murphy, B. (2015). "Key soil functional properties affected by soil organic matter—Evidence from published literature", in: IOP Conference Series: Earth and Environmental Science.
Nel, T., Bruneel, Y., and Smolders, E. (2023). Comparison of five methods to determine the cation exchange capacity of soil. J. Plant Nutr. Soil Sci. 186, 311–320. doi: 10.1002/jpln.202200378
NF ISO 10694 (1995). Soil quality—determination of organic and total carbon after dry combustion (elementary analysis). Paris: AFNOR.
NF ISO 11260 (1994). Soil quality—determination of effective cation exchange capacity and base saturation level using barium chloride solution. Paris: AFNOR.
NF ISO 11261 (1995). Soil quality—determination of total nitrogen—modified kjeldahl method. Paris: AFNOR.
NF ISO 13878 (1998). Soil quality—determination of total nitrogen content by dry combustion (elemental analysis). Paris: AFNOR.
NF ISO 14869-1 (2001). Soil quality—dissolution for the determination of total element contents—part 1: Dissolution with hydrofluoric and perchloric acids. Paris: AFNOR.
NF X31-109 (1993). Soil quality—chemical methods—determination of organic carbon by sulfochromic oxydation. Paris: AFNOR.
NF X31-160 (1993). Soil quality—determination of phosphorus soluble in a 20 G.L-1 monohydric citric acid solution—dyer method. Paris: AFNOR.
NF X31-161 (1993). Soil quality—determination of phosphorous soluble in a 0,1 Mol.L-1 ammonium oxalate solution—Joret-hebert method. Paris: AFNOR.
Nissinen, A., Ilvesniemi, H., and Tanskanen, N. (1999). Equilibria of weak acids and organic Al complexes explain activity of H+ and Al3+ in a salt extract of exchangeable cations. Eur. J. Soil Sci. 50, 675–686. doi: 10.1046/j.1365-2389.1999.00265.x
Norby, R. J., DeLucia, E. H., Gielen, B., Calfapietra, C., Giardina, C. P., King, J. S., et al. (2005). Forest response to elevated CO2 is conserved across a broad range of productivity. PNAS 102, 18052–18056. doi: 10.1073/pnas.0509478102
Pascaud, A., Sauvage, S., Coddeville, P., Nicolas, M., Croisé, L., Mezdour, A., et al. (2016). Contrasted spatial and long-term trends in precipitation chemistry and deposition fluxes at rural stations in France. Atmos. Environ. 146, 28–43. doi: 10.1016/j.atmosenv.2016.05.019
Pereira, P., Bogunovic, I., Muñoz-Rojas, M., and Brevik, E. C. (2018). Soil ecosystem services, sustainability, valuation and management. Curr Opin Environ Sci Health 5, 7–13. doi: 10.1016/j.coesh.2017.12.003
Perring, M. P., De Frenne, P., Baeten, L., Maes, S. L., Depauw, L., Blondeel, H., et al. (2016). Global environmental change effects on ecosystems: the importance of land-use legacies. Glob. Chang. Biol. 22, 1361–1371. doi: 10.1111/gcb.13146
Pinheiro, J., Bates, D., Debroy, S., and Sarkar, D.R Core Team (2013). “nlme: Linear and Nonlinear Mixed Effects Models. R package version 3.1–113 ”. Available at: https://CRAN.R-project.org/package=nlme.
R Core Team (2013). "R: A language and environment for statistical computing. R foundation for statistical computing ". (Vienna, Austria). Available at: https://www.R-project.org/
Rehschuh, S., Jonard, M., Wiesmeier, M., Rennenberg, H., and Dannenmann, M. (2021). Impact of European beech Forest diversification on soil organic carbon and Total nitrogen stocks–a Meta-analysis. Front For Glob Change 4:606669. doi: 10.3389/ffgc.2021.606669
Reuss, J. O., and Johnson, D. W. (1986). Acid deposition and the acidification of soils and waters. Springer New York.
Reynolds, B., Chamberlain, P. M., Poskit, J., Woods, C., Scot, W. A., Rowe, E. C., et al. (2013). Countryside survey: national "soil change" 1978-2007 for topsoils in Great Britain—acidity, carbon, and total nitrogen status. Vadose Zone J. 12, 1–15. doi: 10.2136/vzj2012.0114
Ritchie, G. S. P., and Dolling, P. J. (1985). The role of organic matter in soil acidification. Aust. J. Soil. Res. 23, 569–576. doi: 10.1071/SR9850569
Rosenthal, R., Rosnow, R. L., and Rubin, D. B. (2000). Contrasts and effect sizes in behavioral research—a correlational approach. Cambridge: Cambridge University Press.
Ross, D. S., Bailey, S. W., Villars, T. R., Quintana, A., Wilmot, S., Shanley, J. B., et al. (2021). Long-term monitoring of Vermont’s forest soils: early trends and efforts to address innate variability. Environ. Monit. Assess. 193:776. doi: 10.1007/s10661-021-09550-9
Rukshana, F., Butterly, C. R., Baldock, J. A., and Tang, C. (2011). Model organic compounds differ in their effects on pH changes of two soils differing in initial pH. Biol. Fertil. Soils 47, 51–62. doi: 10.1007/s00374-010-0498-0
Schmidt, M. W. I., Torn, M. S., Abiven, S., Dittmar, T., Guggenberger, G., Janssens, I. A., et al. (2011). Persistence of soil organic matter as an ecosystem property. Nature 478, 49–56. doi: 10.1038/nature10386
Schmitz, A., Sanders, T. G. M., Bolte, A., Bussotti, F., Dirnböck, T., Johnson, J., et al. (2019). Responses of forest ecosystems in Europe to decreasing nitrogen deposition. Environ. Pollut. 244, 980–994. doi: 10.1016/j.envpol.2018.09.101
Schwärzel, K., Seidling, W., Hansen, K., Strich, S., and Lorenz, M. (2022). “Part I: Objectives, strategy and implementation of ICP forests” in Manual on methods and criteria for harmonized sampling, assessment, monitoring and analysis of the effects of air pollution on forests. (ed.) U.I.F.P.C. Centre (Eberswalde, Germany: Thünen Institute of Forest Ecosystems)
Seaton, F. M., Robinson, D. A., Monteith, D., Lebron, I., Bürkner, P., Tomlinson, S., et al. (2023). Fifty years of reduction in Sulphur deposition drives recovery in soil pH and plant communities. J. Ecol. 111, 464–478. doi: 10.1111/1365-2745.14039
Skyllberg, U., Raulund-Rasmussen, K., and Borggaard, O. K. (2001). pH buffering in acidic soils developed under Picea abies and Quercus robur – effects of soil organic matter, adsorbed cations and soil solution ionic strength. Biogeochemistry 56, 51–74. doi: 10.1023/A:1011988613449
Solberg, S., Dobbertin, M., Reinds, G. J., Lange, H., Andreassen, K., Fernandez, P. G., et al. (2009). Analyses of the impact of changes in atmospheric deposition and climate on forest growth in European monitoring plots: a stand growth approach. For. Ecol. Manage. 258, 1735–1750. doi: 10.1016/j.foreco.2008.09.057
Solly, E. F., Weber, V., Zimmermann, S., Walthert, L., Hagedorn, F., and Schmidt, M. W. I. (2020). A critical evaluation of the relationship between the effective cation exchange capacity and soil organic carbon content in Swiss Forest soils. Front For Glob Change 3:98. doi: 10.3389/ffgc.2020.00098
Soucémarianadin, L., Cécillon, L., Chenu, C., Baudin, F., Nicolas, M., Girardin, C., et al. (2019). Heterogeneity of the chemical composition and thermal stability of particulate organic matter in French forest soils. Geoderma 342, 65–74. doi: 10.1016/j.geoderma.2019.02.008
Soucémarianadin, L. N., Cécillon, L., Guenet, B., Chenu, C., Baudin, F., Nicolas, M., et al. (2018). Environmental factors controlling soil organic carbon stability in French forest soils. Plant and Soil 426, 267–286. doi: 10.1007/s11104-018-3613-x
Sparks, D. L., Singh, B., and Siebecker, M. G. (2024). “Chapter 3—chemistry of soil organic matter” in Environmental soil chemistry. eds. D. L. Sparks, B. Singh, and M. G. Siebecker. 3rd ed (Boston: Academic Press), 105–167.
Steffens, C., Beer, C., Schelfhout, S., De Schrijver, A., Pfeiffer, E. M., and Vesterdal, L. (2022). Do tree species affect decadal changes in soil organic carbon and total nitrogen stocks in Danish common garden experiments? Eur. J. Soil Sci. 73:13206. doi: 10.1111/ejss.13206
Su, Y., Ma, X., Gong, Y., Ahmed, Z., Han, W., Li, K., et al. (2022). Global patterns and drivers of litter decomposition under nitrogen enrichment: a Meta-analysis. Front For Glob Change 5:95774. doi: 10.3389/ffgc.2022.895774
Sullivan, G. M., and Feinn, R. (2012). Using effect size—or why the P value is not enough. J. Grad. Med. Educ. 4, 279–282. doi: 10.4300/JGME-D-12-00156.1
Thai, S., Pavlů, L., Tejnecký, V., Chovancová, S., Hin, L., Thet, B., et al. (2023). Temporal changes in soil chemical compositions in acidified mountain forest soils of Czech Republic. Eur. J. For. Res. 142, 883–897. doi: 10.1007/s10342-023-01564-x
Tipping, E., Somerville, C. J., and Luster, J. (2016). The C:N:P:S stoichiometry of soil organic matter. Biogeochemistry 130, 117–131. doi: 10.1007/s10533-016-0247-z
Toïgo, M., Nicolas, M., Jonard, M., Croisé, L., Nageleisen, L. M., and Jactel, H. (2020). Temporal trends in tree defoliation and response to multiple biotic and abiotic stresses. For. Ecol. Manage. 477:118476. doi: 10.1016/j.foreco.2020.118476
Trettin, C. C., Johnson, D. W., and Todd, D. E. Jr. (1999). Forest nutrient and carbon pools at Walker branch watershed: changes during a 21-year period. Soil Sci. Soc. Am. J. 63, 1436–1448. doi: 10.2136/sssaj1999.6351436x
Trum, F., Titeux, H., Ranger, J., and Delvaux, B. (2011). Influence of tree species on carbon and nitrogen transformation patterns in forest floor profiles. Ann. For. Sci. 68, 837–847. doi: 10.1007/s13595-011-0080-4
Ulrich, E., Croisé, L., Lanier, A., Brêthes, A., and Cecchini, S. (2009). RENECOFOR—Manuel de référence n° 4 pour l’échantillonnage des sols et des litières en grappes et la préparation des échantillons. 3rd Edn Fontainebleau: Office National des Forêts, Département Recherche.
van Breemen, N., Mulder, J., and Driscoll, C. T. (1983). Acidification and alkalinization of soils. Plant and Soil 75, 283–308. doi: 10.1007/BF02369968
Van Hees, P., Lundström, U., Danielsson, R., and Nyberg, L. (2001). Controlling mechanisms of aluminium in soil solution—an evaluation of 180 podzolic forest soils. Chemosphere 45, 1091–1101. doi: 10.1016/S0045-6535(00)00515-4
Vanguelova, E. I., Benham, S., Pitman, R., Moffat, A. J., Broadmeadow, M., Nisbet, T., et al. (2010). Chemical fluxes in time through forest ecosystems in the UK—soil response to pollution recovery. Environ. Pollut. 158, 1857–1869. doi: 10.1016/j.envpol.2009.10.044
Veresoglou, S. D., Peñuelas, J., Fischer, R., Rautio, P., Sardans, J., Merilä, P., et al. (2014). Exploring continental-scale stand health—N:P ratio relationships for European forests. New Phytol. 202, 422–430. doi: 10.1111/nph.12665
Verstraeten, A., Neirynck, J., Cools, N., Roskams, P., Louette, G., De Neve, S., et al. (2017). Multiple nitrogen saturation indicators yield contradicting conclusions on improving nitrogen status of temperate forests. Ecol. Indic. 82, 451–462. doi: 10.1016/j.ecolind.2017.07.034
Waldner, P., Marchetto, A., Thimonier, A., Schmitt, M., Rogora, M., Granke, O., et al. (2014). Detection of temporal trends in atmospheric deposition of inorganic nitrogen and sulphate to forests in Europe. Atmos. Environ. 95, 363–374. doi: 10.1016/j.atmosenv.2014.06.054
Wang, Y. R., Buchmann, N., Hessen, D. O., Stordal, F., Erisman, J. W., Vollsnes, A. V., et al. (2022). Disentangling effects of natural and anthropogenic drivers on forest net ecosystem production. Sci. Total Environ. 839:156326. doi: 10.1016/j.scitotenv.2022.156326
Keywords: forest monitoring, soil survey, soil chemistry, soil acidification, trend analysis, carbon stocks, total nitrogen stocks, C/N ratio
Citation: Saenger A, André F, Jonard M, Nicolas M and Ponette Q (2024) Carbon sequestration and nitrogen loss drive the evolution of French forest soils. Front. For. Glob. Change. 7:1338239. doi: 10.3389/ffgc.2024.1338239
Edited by:
Andreas Schindlbacher, Austrian Research Centre for Forests (BFW), AustriaReviewed by:
Nicole Wellbrock, Thuenen Institute of Forest Ecology, GermanyTimo Domisch, Natural Resources Institute Finland (Luke), Finland
Copyright © 2024 Saenger, André, Jonard, Nicolas and Ponette. This is an open-access article distributed under the terms of the Creative Commons Attribution License (CC BY). The use, distribution or reproduction in other forums is permitted, provided the original author(s) and the copyright owner(s) are credited and that the original publication in this journal is cited, in accordance with accepted academic practice. No use, distribution or reproduction is permitted which does not comply with these terms.
*Correspondence: Frédéric André, ZnJlZGVyaWMuYW5kcmVAdWNsb3V2YWluLmJl