 Julia Drewer1*
 Ribka Sionita Tarigan2
 Lindsay F. Banin1
 Stella White1Elizabeth Raine1Sarah H. Luke3,4
 Edgar C. Turner4
 Ute Skiba1
 Nicholas J. Cowan1
 Jassica Prajna Dewi2
 Andreas Dwi Advento2
 Anak Agung Ketut Aryawan2Jean-Pierre Caliman2Pujianto2
- 1UK Centre for Ecology & Hydrology, Bush Estate, Penicuik, United Kingdom
- 2SMART Research Institute, R&D Division of PT, Sinar Mas Agro Resources and Technology Tbk, Pekan Baru, Indonesia
- 3School of Biosciences, University of Nottingham, Sutton Bonington Campus, Loughborough, United Kingdom
- 4Department of Zoology, University of Cambridge, Cambridge, United Kingdom
Oil palm (OP) plantations have replaced large areas of forest in the tropical landscape of Southeast Asia and are major emitters of greenhouse gases (GHGs). To move towards more environmentally friendly plantation management, a hopeful approach is to implement strategies to increase vegetation complexity. These options include relaxed management of understory vegetation to increase complexity in productive plantations, passive restoration of forest areas around rivers by leaving mature oil palm during replanting, and active forest restoration along river margins with planting of forest trees. These practices have the potential to deliver a range of benefits such as soil protection, reduced erosion and sedimentation in rivers, pest control and support for biodiversity, but little is known about their impact on greenhouse gas fluxes. The aim of this study was to assess the impact of improved understory growth management and the use of riparian forestry on GHG fluxes in OP plantations, making use of two long-term experiments (the Biodiversity and Ecosystem Function in Tropical Agriculture Understory Vegetation (BEFTA UV) Project; the Riparian Ecosystem Restoration in Tropical Agriculture (RERTA) Project) in Riau Province, Sumatra, Indonesia. We measured nitrous oxide (N2O), methane (CH4) and ecosystem respiration (CO2) from mature OP sites with different levels of understory vegetation and different riparian buffer restoration treatments using the static chamber method. We used linear mixed effects models to test for treatment effects, whilst accounting for soil moisture and experimental design factors (time and space). The understory vegetation treatments (normal, reduced and enhanced complexity of understory) had no effect on N2O and CH4 flux. Regarding differences in ecosystem respiration, effects attributable to the understory vegetation treatments were not strong. For the riparian restoration treatments, the fixed effects variables in the models explained little variation in the fluxes of all GHGs. Therefore, given the proven benefits of more complex understory vegetation for supporting biodiversity and healthy ecosystem functioning, plus the potential for restored riparian buffers to support biodiversity and services and to reduce GHG emissions over time, our findings reinforce the concept that these features bring environmental benefits in OP landscapes, with no measurable effects on GHG emissions.
1 Introduction
Land-use conversion to agriculture has profound impacts on the environment, particularly through the loss of structural complexity and high inputs of fertilisers, herbicides and pesticides in monoculture systems impacting biodiversity and ecosystem processes (Sala et al., 2000). In tropical agriculture, oil palm (Elaeis guineensis) is one of the most important crops, the dominant source of vegetable oil worldwide, and a major source of biofuel (Corley, 2009). Oil palm plantations have replaced large areas of forest in the tropical landscape of Southeast Asia, are important global sources of the greenhouse gases (GHGs) carbon dioxide (CO2), nitrous oxide (N2O), and methane (CH4) (Meijaard et al., 2020) and their expansion has had widespread negative effects on biodiversity (Fitzherbert et al., 2008; Foster et al., 2011; Savilaakso et al., 2014). Increases in N2O are largely due to the use of fertilisers in plantations (Pardon et al., 2016, 2017; Skiba et al., 2020; Mori, 2022), while release of CH4 is due to compaction of the soil, creating, for example, waterlogged conditions (Teh et al., 2005; Kaupper et al., 2019; Lang et al., 2020). Furthermore, disturbance of the soil when converting land to plantations can result in large CO2 emissions (Yashiro et al., 2008; Sakata et al., 2015). However, long-term measurements of GHGs, especially N2O and CH4 fluxes, from established OP plantations on mineral soil are still scarce (Skiba et al., 2020; Drewer et al., 2021b).
Key management options for reducing GHG emissions from established plantations include improving the efficiency of nutrient inputs (e.g., using different fertiliser types to improve nitrogen use efficiency) to the system and increasing vegetation complexity (e.g., allowing understory to grow rather than having bare soil). However, research on the effects of altering plantation vegetation complexity on GHG emissions is much more limited, despite there being huge potential for reducing emissions. An increasingly wide range of vegetation management options are being trialed within established oil palm plantation ecosystems in order to support higher levels of biodiversity and healthier ecosystem functioning (Luke et al., 2020; Nobilly et al., 2022). These include more relaxed management of understory vegetation, through reduction of herbicide use and manual cutting, allowing understory vegetation complexity to increase within productive plantations, and active forest restoration using enrichment planting, especially along river margins (Cole et al., 2020) or the development of tree islands within the plantations (Zemp et al., 2023). There is a growing body of evidence of the benefits of these strategies for biodiversity conservation (Ashton-Butt et al., 2018; Luke et al., 2019a) and for levels of several ecosystem functions (Dislich et al., 2017), but there has been little consideration of the effects of these biodiversity-friendly management options on GHG fluxes, and their potential for providing win-wins for both conservation and emission reductions.
Reducing the use of herbicides and cutting of understory vegetation in OP plantations has substantial potential to reduce GHG emissions via several potential mechanisms. First, additional vegetation growth allows sequestration of carbon within the understory biomass (Luke et al., 2019a). Second, less-intensive management, including the reduced use of herbicides, can reduce rates of decomposition of soil organic carbon (SOC) (Hennings et al., 2022). Third, a large understory biomass can potentially increase plant N uptake, effectively reducing N2O emissions and leaching (Zheng et al., 2016). Fourth, soil CO2 respiration rates may increase due to a larger C translocation into the rhizosphere. In contrast, high SOC decomposition rates can be stimulated by herbicide application (especially in combination with fertilisers) and may result in high GHG emissions when these conventional methods are used (Hennings et al., 2022). In contrast, methane (CH4) emissions could increase or decrease with relaxed understory management, depending on the soil physical properties, carbon content, and soil moisture changes (Hassler et al., 2015). Despite the substantial potential for emission benefits, it is not yet known how changes in understory vegetation management in OP plantations affect GHG fluxes.
Restoration of forest areas is another highly promising option for improving GHG balances within OP plantations. Another common approach, because of the numerous co-benefits for biodiversity and water quality, plus legal requirements in many OP growing regions, is the maintenance or restoration of riparian buffers. Riparian buffers are non-production areas situated between agricultural land and freshwater bodies (Cole et al., 2020). These can be specifically established buffers or fragments of existing forest that were not cleared during the establishment of agricultural areas. In OP plantations, buffers are typically either natural remnant forest fragments, or passively or actively restored vegetation, which could comprise understory vegetation, mature palms, or re-planted trees. Similar to the substantial emissions-benefits that reduced understory management could bring, these strips of more complex vegetation within the landscape also have the capacity to sequester large amounts of carbon, protect soil organic carbon, and increase N uptake, thereby reducing N2O emissions (Zheng et al., 2016; Luke et al., 2019a; Hennings et al., 2022). However, the GHG fluxes of different types of riparian buffers in OP have not yet been assessed, and it is not yet known which riparian restoration strategies provide the best emissions benefits.
The aim of this study is to assess the impact of alternative ecological management and riparian restoration options in mineral soil OP plantations on GHG fluxes. We present GHG fluxes from two long-term experiments as part of “The Biodiversity and Ecosystem Function in Tropical Agriculture” (BEFTA) Programme, based in Sumatra, Indonesia.1 We investigated whether the observed ecological benefits of alternative management and restoration options, such as allowing the regrowth of understory in plantations and planting native tree species in riparian buffers, may be associated with an additional or reduced GHG burden.
2 Site descriptions and methods
2.1 Site description of the BEFTA UV project and RERTA project
Research was conducted in mature oil palm plantations at Ujung Tanjung Estate for BEFTA and Kandista Sari Estate for RERTA, Riau Province (No 55.559, E101 11.619), Sumatra, in collaboration with Sinar Mas Agro Resources and Technology Research Institute (SMARTRI). These OP plantations were established in the late 1980s and early 1990s. The region has an average annual temperature of 26.0°C and an annual rainfall of 2511 mm.2 The plantations are owned and managed by PT Ivo Mas Tunggal (a subsidiary company of Golden Agri Resources, GAR), and run with technical advice and input from SMARTRI, which is the research and development centre for upstream activities of GAR.
2.1.1 BEFTA UV project
This project was established as part of the BEFTA Programme (Luke et al., 2020), which is a collaborative research project run by the University of Cambridge, UK and SMARTRI, Indonesia. To test the impact of habitat complexity (varied levels of understory vegetation) on GHG fluxes in a mature, productive oil palm plantation (planted between 1987 and 1993 in Unjung Tanjung), we sampled from within 18 × 2.25 ha sized treatments. These 18 plots were split across 6 replicate blocks each containing three plots, with a plot in each block being managed using the following understory vegetation treatments (Figure 1): (1) normal complexity, representing standard industry practice and including an intermediate level of herbicide spraying of the understory plants, around palms and along access paths; (2) reduced complexity, representing highly-destructive management and including the spraying of all understory vegetation with herbicides over the whole area; (3) enhanced complexity, representing a conservation treatment, including no herbicide input and limited understory cutting (Luke et al., 2020). For the “normal” treatment (1), vegetation was cleared using herbicide inside the weeding circle (representing the fertilised zone in an OP plantation in a radius of 1.5 m around each palm stem) and not outside (representing the non-fertilised zone in an OP plantation), except along access paths. For the “reduced” treatment (2) herbicide was used to clear vegetation both inside and outside of the weeding circle. Treatment (3) “enhanced” did not receive herbicides, and instead vegetation in the weeding circle was cleared manually (more details in Luke et al., 2020). As the plantation was mature and due to be replanted (end of the lifetime of the plantation), N fertiliser had not been applied since October 2017, before the study began. We therefore were able to compare the treatments without the confounding effects of additional N input to any of the plots. We took measurements in each of the 3 treatments of the BEFTA experiments using a subset of 3 replicated blocks with 6 locations in each plot, resulting in 54 sampling points. Half of our measurements took place within the weeding circles (1.5 m diameter around the palm) and the other half between palms at each plot which we refer to as “inside” and “outside” weeding circles from now on. Despite the plots not receiving N fertiliser during the duration of our sampling period, the management (herbicide application and manual weeding) was still applied inside the circles, hence was different from outside the circles. This study was conducted for 12 months from October 2018 until September 2019, with monthly measurements resulting in 12 measurement occasions.
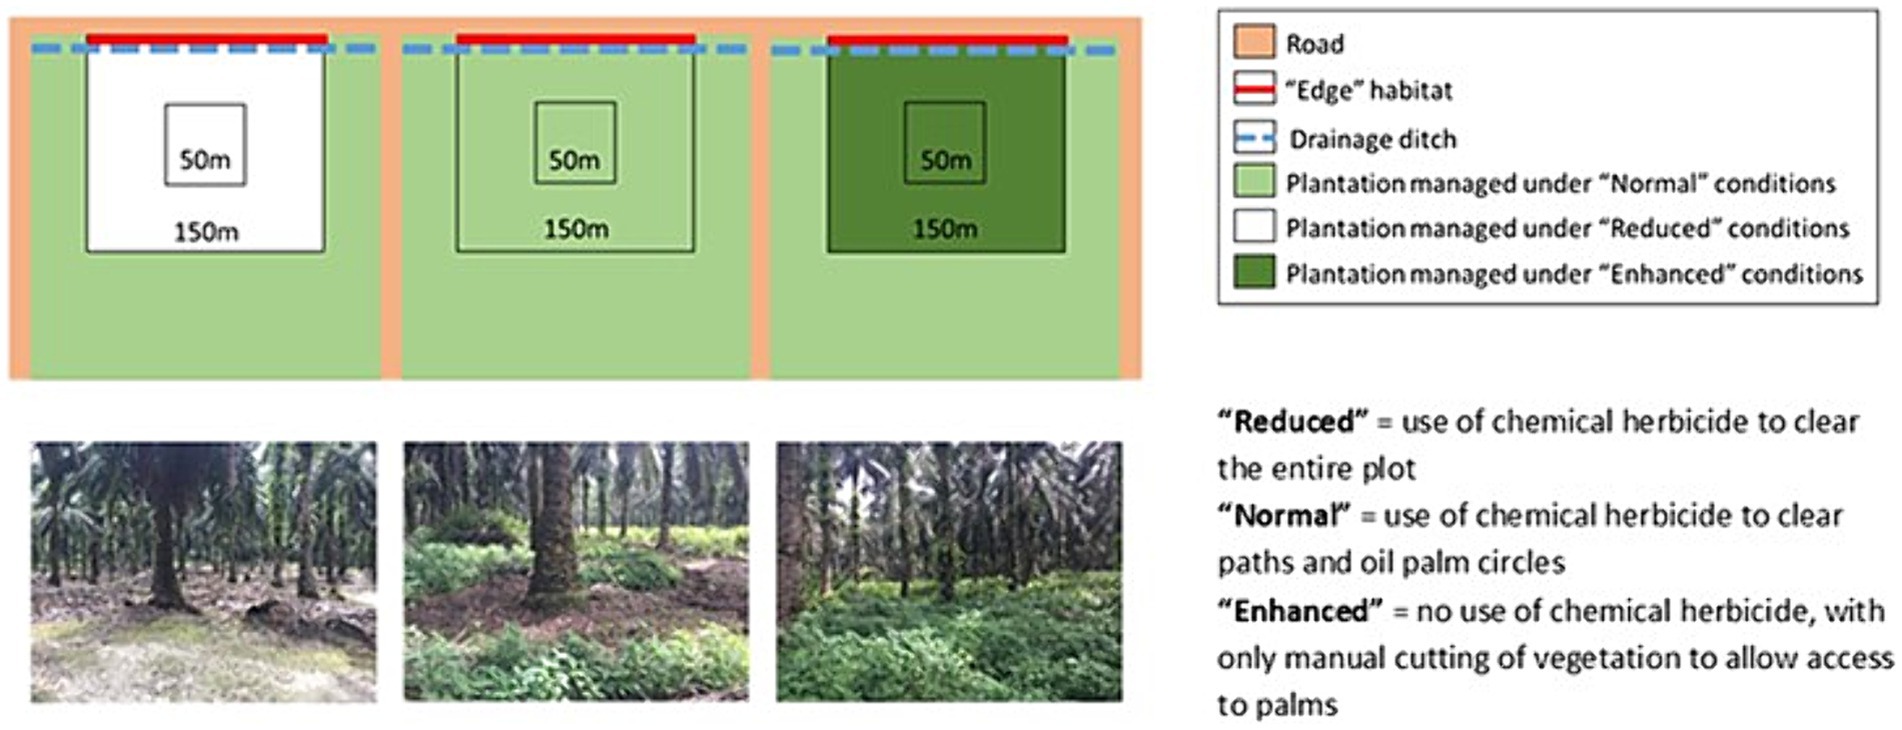
Figure 1. Experimental setup of the Biodiversity and Ecosystem Function in Tropical Agriculture Understory Vegetation (BEFTA UV) Project as described in Luke et al. (2020).
2.1.2 RERTA
The RERTA Project is experimentally investigating different management options in riparian buffer areas along natural rivers in mature plantations (planted between 1992 and 1993 in Kandista Sari). It includes four alternative buffer treatments, each with width 50 m on each side of the river, and 400 m length along the river. We carried out measurements for 4 months from January 2019 before different buffer treatments were implemented (pre-treatment). At this time the entire site was a 26–27 years-old mature oil palm plantation. Experimental riparian buffer treatments were planted in September 2019. We then continued measurements at the same locations for 2 years from October 2019 (post-treatment).
The four different experimental buffer treatments are (with status at the time of sampling from October 2019 shown in parentheses):
• No buffer [=Immature OP (IOP)]. Re-planted immature oil palm to the river’s edge, therefore acting as a control treatment with no restoration.
• Mature palm-only buffer [=Mature OP (MOP)]. Mature palms left in place in the buffer area after re-planting and allowed natural vegetation regrowth.
• Mature palm and enrichment planting buffer [=Mature OP with immature native trees (MOP + NT)]. Mature palms left in place in the buffer area after re-planting, and enrichment planting carried out with a mix of six native tree species.
• Enrichment planting only buffer [=Immature native trees (NT)]. All mature palms removed from the buffer during re-planting, and enrichment planting carried out with a mix of six native tree species.
Within each buffer treatment, six sampling points were established, three on each side of the river. Four further sampling points, two on each side of the river, were established in the surrounding OP plantation at the same position along the river as those within the buffer treatments. This resulted in ten sampling points per treatment, giving a total of 40 sampling points overall—six in each buffer treatment and 16 in the surrounding OP plantation (Figure 2). This allowed us to address spatial variability as well as the effects of the different treatments. Fertilisation in the mature OP (prior to establishing the treatments) had stopped 1 year before we started our pre-treatment “before” measurements. Once treatments were established, only the riparian buffer IOP received empty fruit bunches (EFB); and only the surrounding OP plantation, once replanted, received mineral fertiliser at industry recommended frequency and rates. The intention of this study was not to capture individual fertiliser events, but to investigate the differences in GHG fluxes related to establishment and early growth of the buffer treatments.
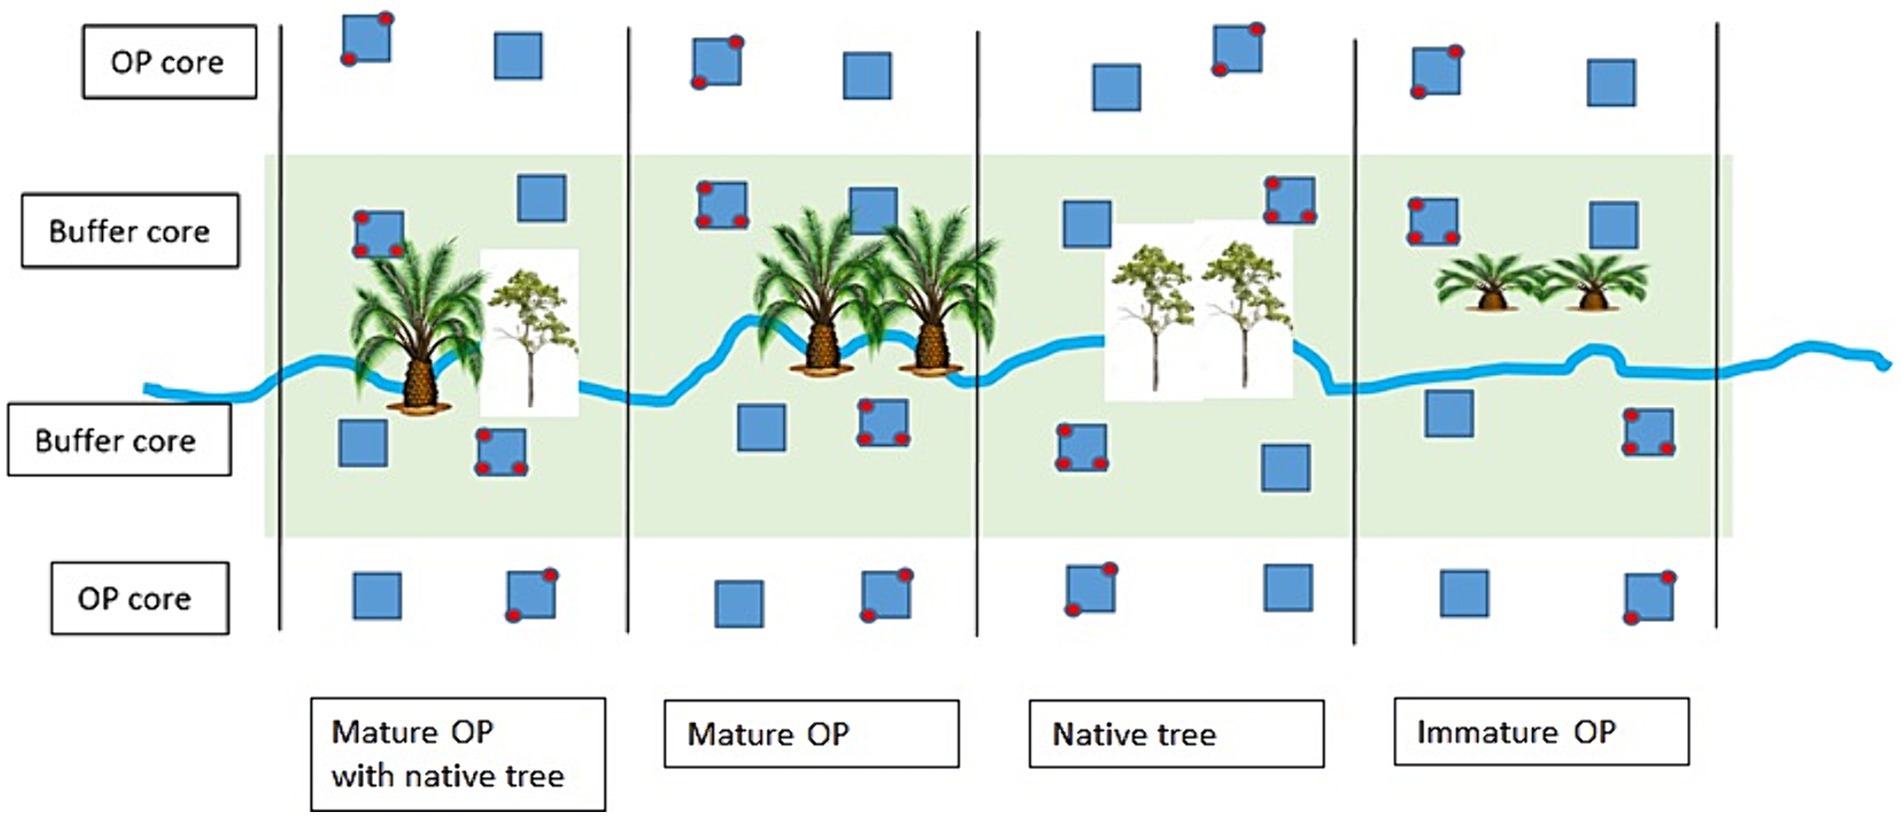
Figure 2. Locations of flux chambers in the Riparian Ecosystem Restoration in Tropical Agriculture (RERTA) Project plots and in the main plantation as described above. Blue squares are 25 x 25 m vegetation sampling plots. Chamber locations are red circles (n = 40). Large palm icons indicate mature palms that have been left within the riparian buffer; small palm icons indicate replanted oil palms both beyond the buffer, and also within the control riparian buffer treatment; and tree icons represent where native tree seedlings have been planted within the riparian buffer.
2.2 Methods
2.2.1 Field sampling of greenhouse gases
At each sampling point, we set up collars which remained in place throughout the study. Using static chambers of opaque PVC with 40 cm diameter and ~20 L volume affixed to these collars, we measured the GHGs N2O, CH4 and ecosystem respiration CO2, following UKCEH’s well-established measurement protocol (Drewer et al., 2017a,b). The collars (~7 cm deep) were installed in each of the sampling points described above, with 54 in BEFTA UV and 40 in RERTA.
Air samples were drawn from the sealed chamber 4 times during the 45 min incubation period and transferred to 20 mL glass vials using the double-needle technique (Drewer et al., 2017a, 2021a,b), where they are stable for at least 6 months (as affirmed by an in-house storage test), and sent to UKCEH Edinburgh for analysis using gas chromatography. Samples and three sets of four certified standard concentrations (CO2, N2O, CH4 in N2 with 20% O2) were analysed using a gas chromatograph (Agilent GC7890B with headspace autosampler 7697A; Agilent, Santa Clara, California) with micro electron capture detector (μECD) for N2O analysis and flame ionization detector (FID) for CH4 and CO2 analysis. These detectors were set up in parallel, allowing the analysis of the three GHGs at the same time. The limit of detection was 5 ppb for N2O, 40 ppb for CH4 and 5 ppm for CO2. Peak integration was carried out with OpenLab© Software Suite (Agilent, Santa Clara, California) (Drewer et al., 2020b).
2.2.2 Measurement of ancillary variables
Rainfall was measured using an ombrometer which was a manual rain gauge from Pusat Penelitian Kelapa Sawit (PPKS, Indonesia). The rain gauge tube material was stainless steel, the funnel size 11.3 cm (diameter) with an area of 100 cm2. The collector tube had a capacity of 2 ± 0.25 L or equivalent to rainfall 200 ± 25 mm. The rain measuring cup material was glass Pyrex with a holding capacity of 250 ± 5 mL or equivalent to a rainfall height of 25 0.5 mm. The height of the ombrometer mouth from the ground was 1.2 m and it was installed horizontally using a water pass.
At the time each GHG sample was taken, volumetric soil moisture content was measured at a depth of 7 cm with a handheld Theta probe HH2 moisture meter (Delta T-Devices, Cambridge, United Kingdom), horizontally inserted at four points around each chamber. Soil samples at four different depths (Supplementary Tables S1, S2) were collected from the BEFTA UV Project plots in September 2016 and from the RERTA Project plots in September 2019, and these were used to analyse soil pH, soil organic carbon, and total soil N. Soil pH was measured using a 1:1 soil to liquid ratio (Potentiometric method in a 1 M KCl and H2O soil extract [1:1 w/v ratio)], soil organic carbon was analysed using the Walkley and Black method (Titration) and total soil N was analysed using the Kjeldahl method (digestion with concentrated acid (H2SO4) and the aid of a mixed catalyst (Se + NaSO4/K2SO4 + CuSO4) measured by a FIA (Flow Injection Analyzer—FOSS 5000 Analyzer) in a spectrophotometer through NH3 gas diffusion) and flow injection analyser (FIA star analyser) (Houba, 1988).
2.3 Data analysis
2.3.1 Flux calculations
The flux F (μg m−2 s−1) for each chamber at each measurement occasion was calculated according to Eq. 1:
Where dC/dt is the concentration (C, μmol mol−1) change over time (t, in s), which was calculated by linear regression, ρ is the density of air (mol m−3), V (m3) is the air volume in the chamber and A (m2) is the surface area in the chamber (Levy et al., 2012). Fluxes were then converted into μg m−2 h−1.
Data were screened for outliers (see supporting information in Drewer et al., 2020a).
2.3.2 Statistical analyses
We used linear mixed effects models to test for the effect of experimental treatments and other variables on the fluxes of CO2, N2O and CH4 using the glmmTMB package (Brooks et al., 2017), producing a separate model for each greenhouse gas and experiment. In the case of the BEFTA UV Project, we included soil moisture as a continuous fixed effect and interacting fixed factors for treatment and inside versus outside the weeding circle. We included the monthly measurement period and block as random effects to account for likely correlations in time and space. For RERTA, we included soil moisture and treatment as fixed effects and monthly measurement period as a random effect. In order to meet modelling assumptions, we transformed N2O gas fluxes in both the BEFTA UV and RERTA analyses, following ln(y + constant), where the constant was the minimum for the dataset, to ensure all values were positive and non-zero. We calculated the marginal and conditional R2 values to assess the contribution of fixed effects and random effects to variation explained in the models and calculated the intra-class correlation coefficients to assess the variation explained by each random effect term, using the performance package (Brooks et al., 2017). We compared GHG fluxes amongst treatments using the ggeffects and emmeans packages (Lüdecke, 2018). Validity of modelling assumptions were checked using the DHARMa package (Hartig, 2020). The statistical modelling was conducted separately for RERTA data collected prior to the establishment of the buffer treatments and for data collected after the establishment of the treatments, to check for any spatial differences that were not attributable to the treatments themselves. All data analyses were conducted in R version 4.3.1 (R Core Team, 2023).
3 Results
3.1 BEFTA UV project
3.1.1 Ancillary environmental parameters
Rainfall was highest in the first two months of the measurement period, with 240 mm in October 2018, 180 mm in November 2018, and 120 mm in December at the end of the rainy season (Figure 3). Soil pH in the circles in the top 0–5 cm of all treatments was around 4.2 and similar outside the circles (windrow and harvesting path) (Supplementary Table S1). Soil organic carbon decreased with depth for all treatments and was around 4% in the top 0–5 cm inside the circles. Variability of total soil N content was high and no distinct differences between treatments could be established taking this high variability into account (Supplementary Table S1).
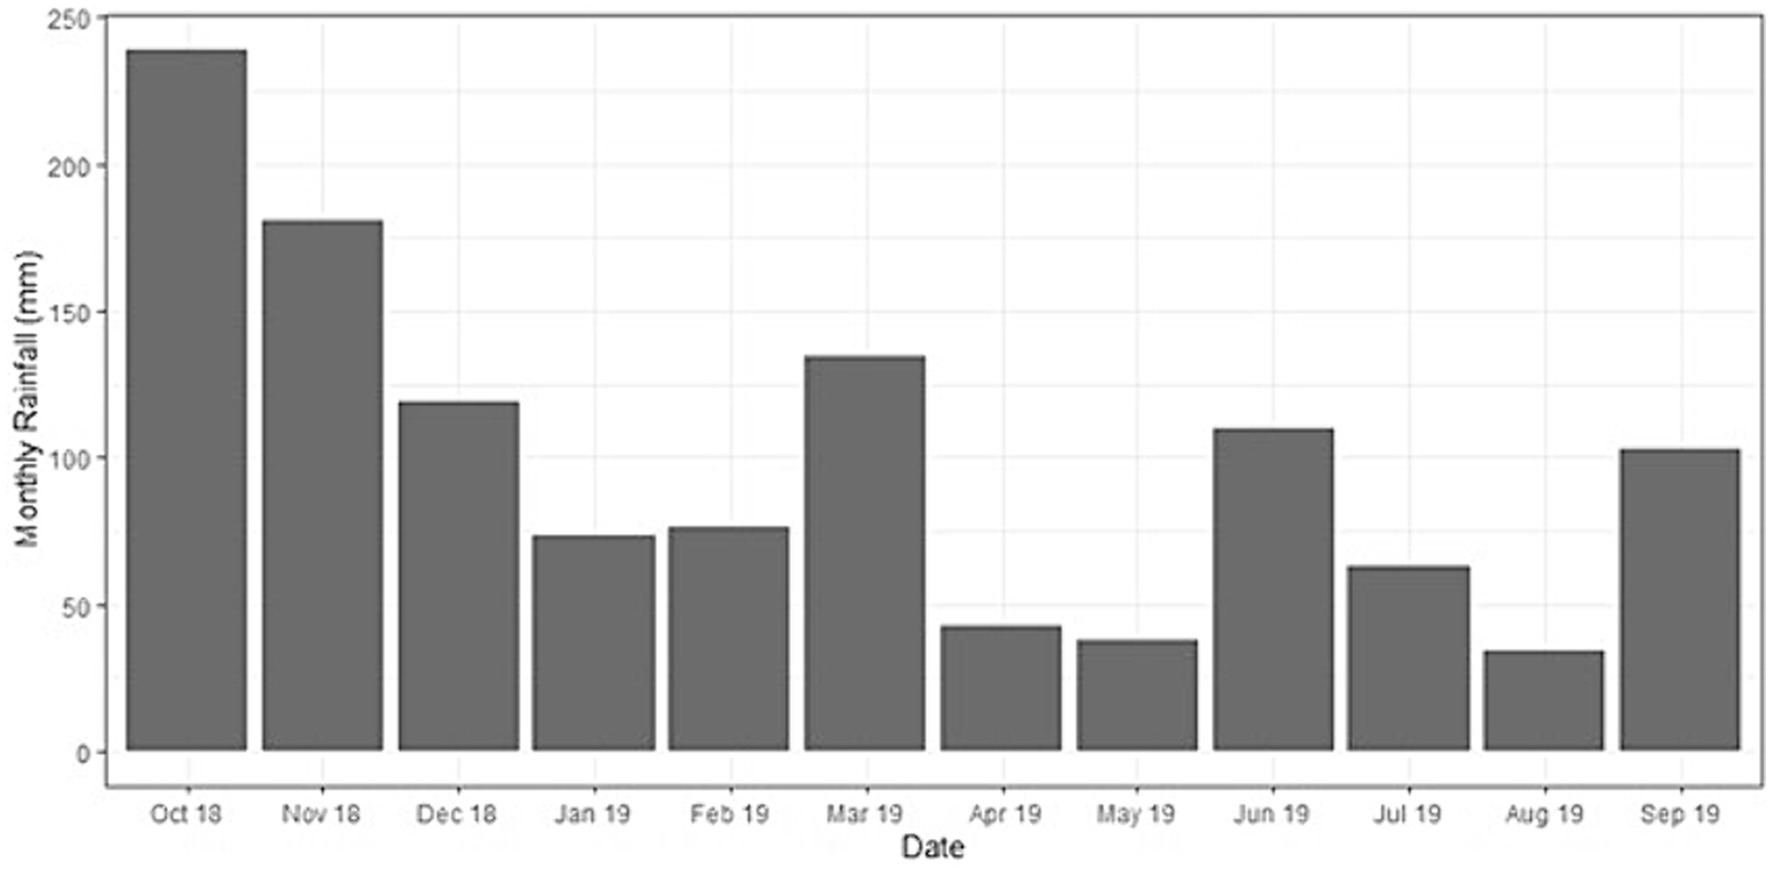
Figure 3. Monthly cumulative rainfall for Ujung Tanjung Estate during our sampling period within the Biodiversity and Ecosystem Function in Tropical Agriculture Understory Vegetation (BEFTA UV) Project plots.
3.1.2 Greenhouse gas fluxes
3.1.2.1 Nitrous oxide
Mean (and standard deviation) N2O fluxes from monthly measurements over a 1 year period across the enhanced, normal and reduced treatments were 8.1 (±16.1), 6.5 (±14.1), and 7.6 (±16.5) μg N m−2 h−1, respectively (Table 1). There were no significant differences in N2O flux between treatments or between inside and outside of the circles. Soil moisture had no notable effect on N2O flux, but N2O flux on average declined over the course of the measurement period (Figure 4). The fixed effects terms in the mixed effects model (treatment, in versus out of circle and soil moisture) explained only 0.9% of variation in N2O flux while the random effects (time, block) explained 12.2 and 3% of variation, respectively. Together the results indicate that the vegetation treatments had no effect on N2O flux, but that other time-dependent factors were affecting fluxes.
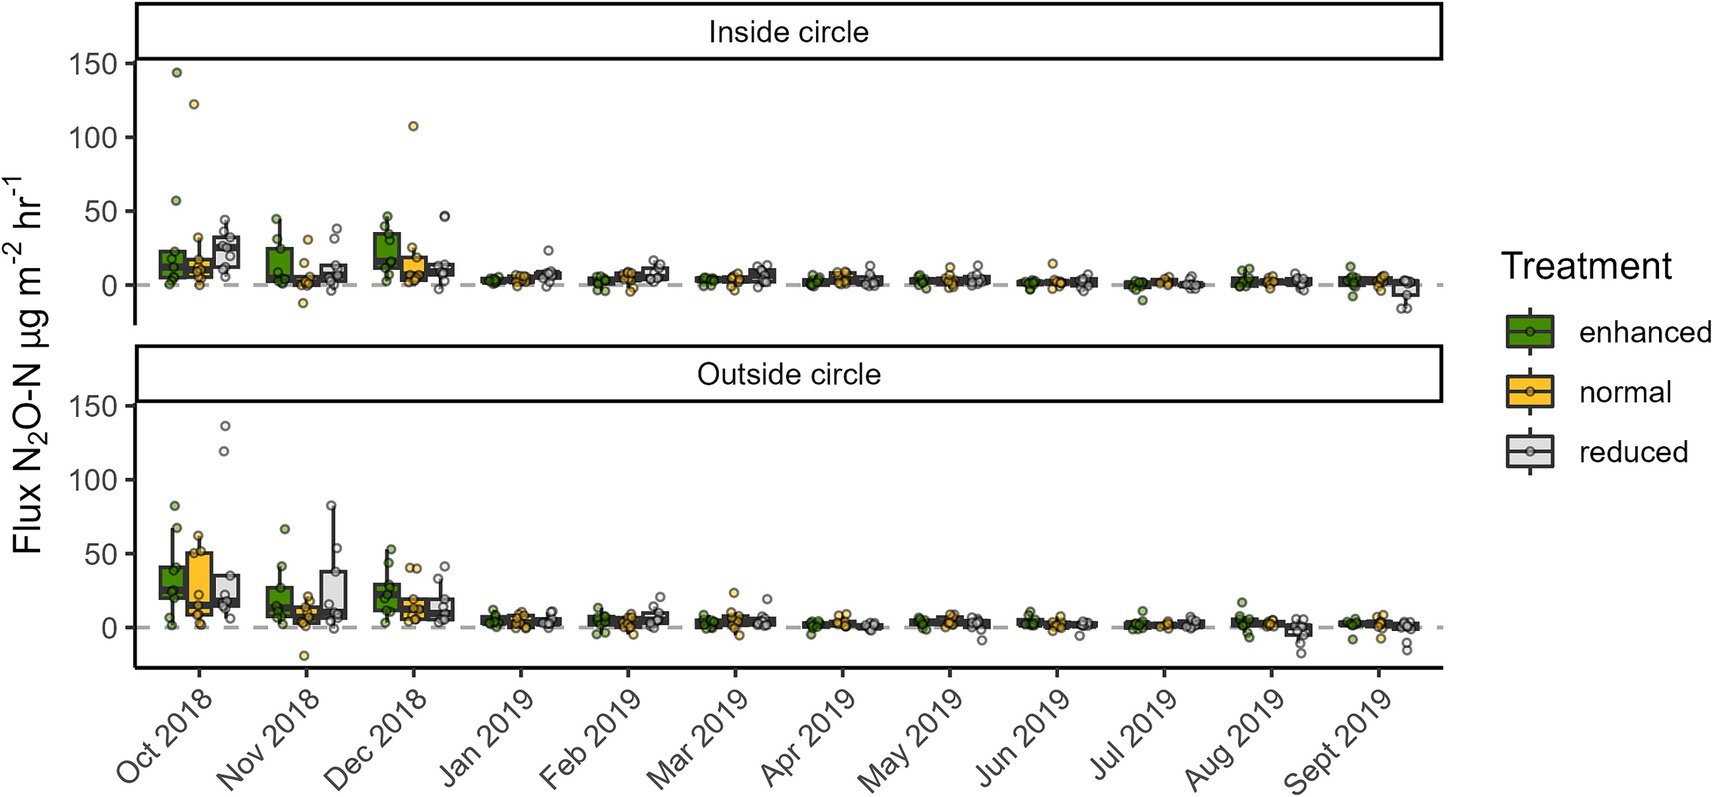
Figure 4. Nitrous oxide (N2O) fluxes from three different understory treatments (green = enhanced, yellow = normal, grey = reduced complexity) in the Biodiversity and Ecosystem Function in Tropical Agriculture Understory Vegetation (BEFTA UV) Project at Ujung Tanjung Estate. The ends of each box are the upper and lower quartiles, so the box spans the interquartile range. The median is marked by a horizontal line inside the box. The whiskers are the two lines outside the box that extend to the highest and lowest observations. Dots are individual measurements.
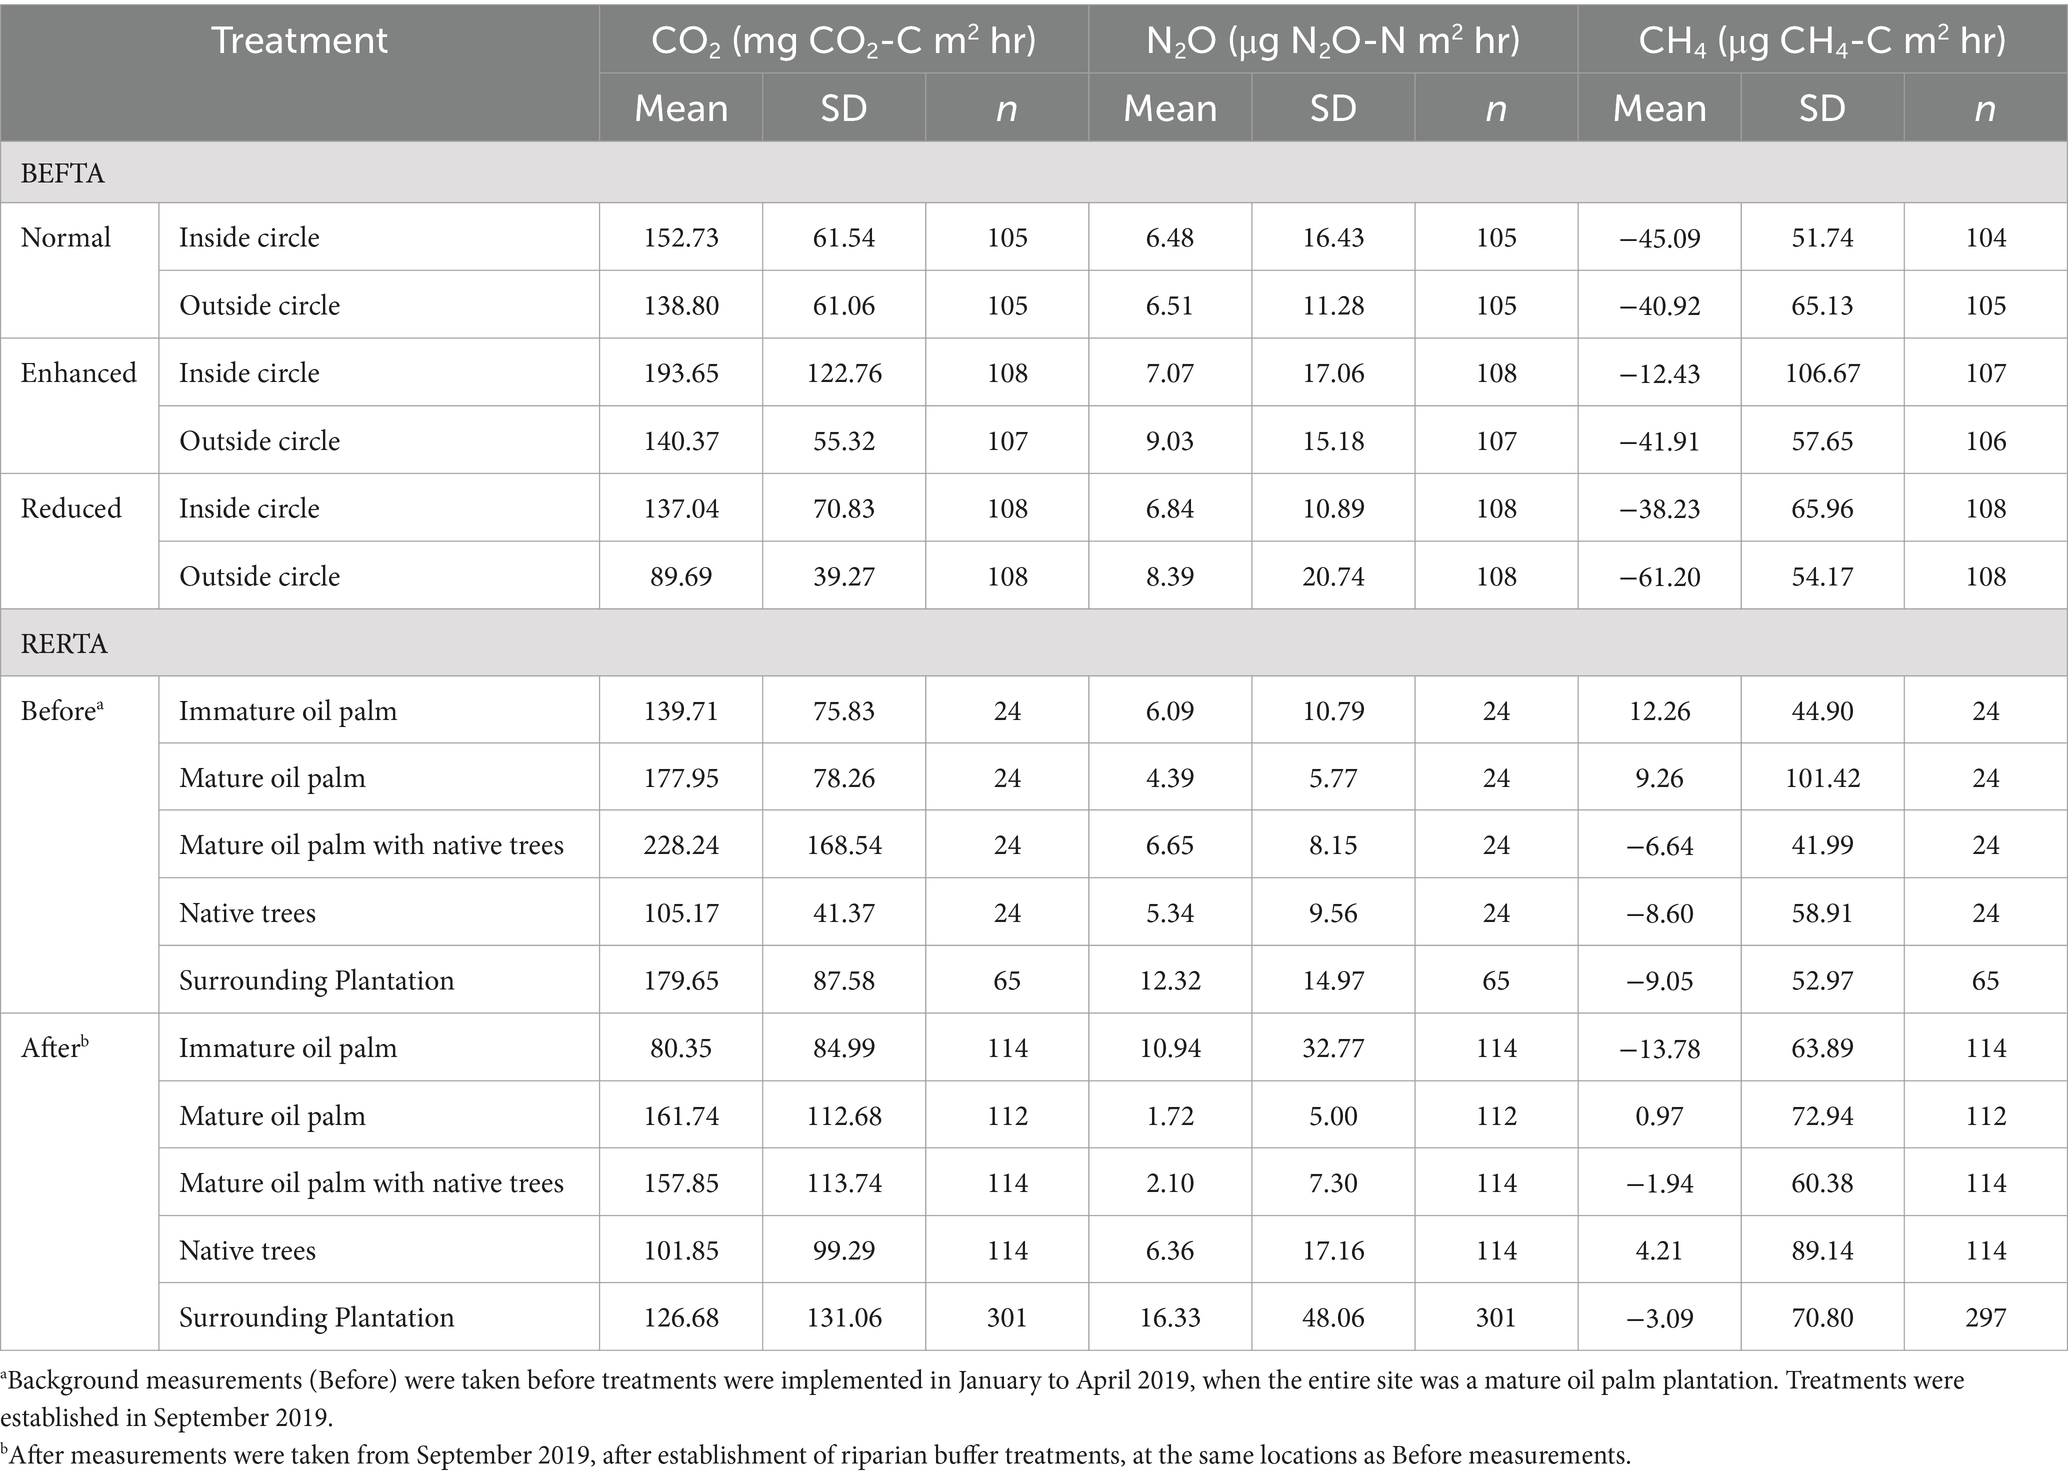
Table 1. Summary of mean greenhouse gas fluxes from the different treatments in the BEFTA Understory Vegetation Project and Riparian Ecosystem Restoration in Tropical Agriculture (RERTA).
3.1.2.2 Methane
Methane (CH4) fluxes were generally small and fluctuated around zero (small uptake as well as low positive emissions) with the majority being negative fluxes (=methane uptake) across all treatments (Figure 5). Mean (standard deviation) CH4 fluxes across the enhanced, normal and reduced treatments were −27.1 (±86.9), −43.0 (±58.8), and −49.7 (±61.3) μg CH4-C m−2 h−1, respectively (Table 1). The fixed effects terms in the model (treatment, in versus out of circle and soil moisture) explained 13.5% of variation in CH4 flux while the random effects (time, block) explained 12.8 and 2.3% of variation, respectively. Soil moisture had a significant, positive effect on CH4 flux, and the measurements taken in the wetter months (Oct to Dec 2018) were associated with higher, positive fluxes (Figure 5), showing that time and environmental factors had a larger effect on CH4 fluxes than vegetation treatment effects. For measurements taken inside the circles close to oil palm stems, CH4 fluxes were significantly less negative in the enhanced treatment (−10.5 [95% CI −21.8–0.7], with a mean soil moisture of 28.39% using the mixed model approach) than the normal treatment (−44.3 [95% CI −55.7–−32.9]) but not the reduced treatment (−34.8 [95% CI −46.1–−23.4] μg CH4-C m−2 h−1). There were no significant differences amongst the vegetation treatments outside the circles. The fluxes were less negative in the enhanced treatment inside the circle, and all treatments (enhanced, normal, reduced) outside the circle had significantly lower (more negative) CH4 fluxes in comparison.
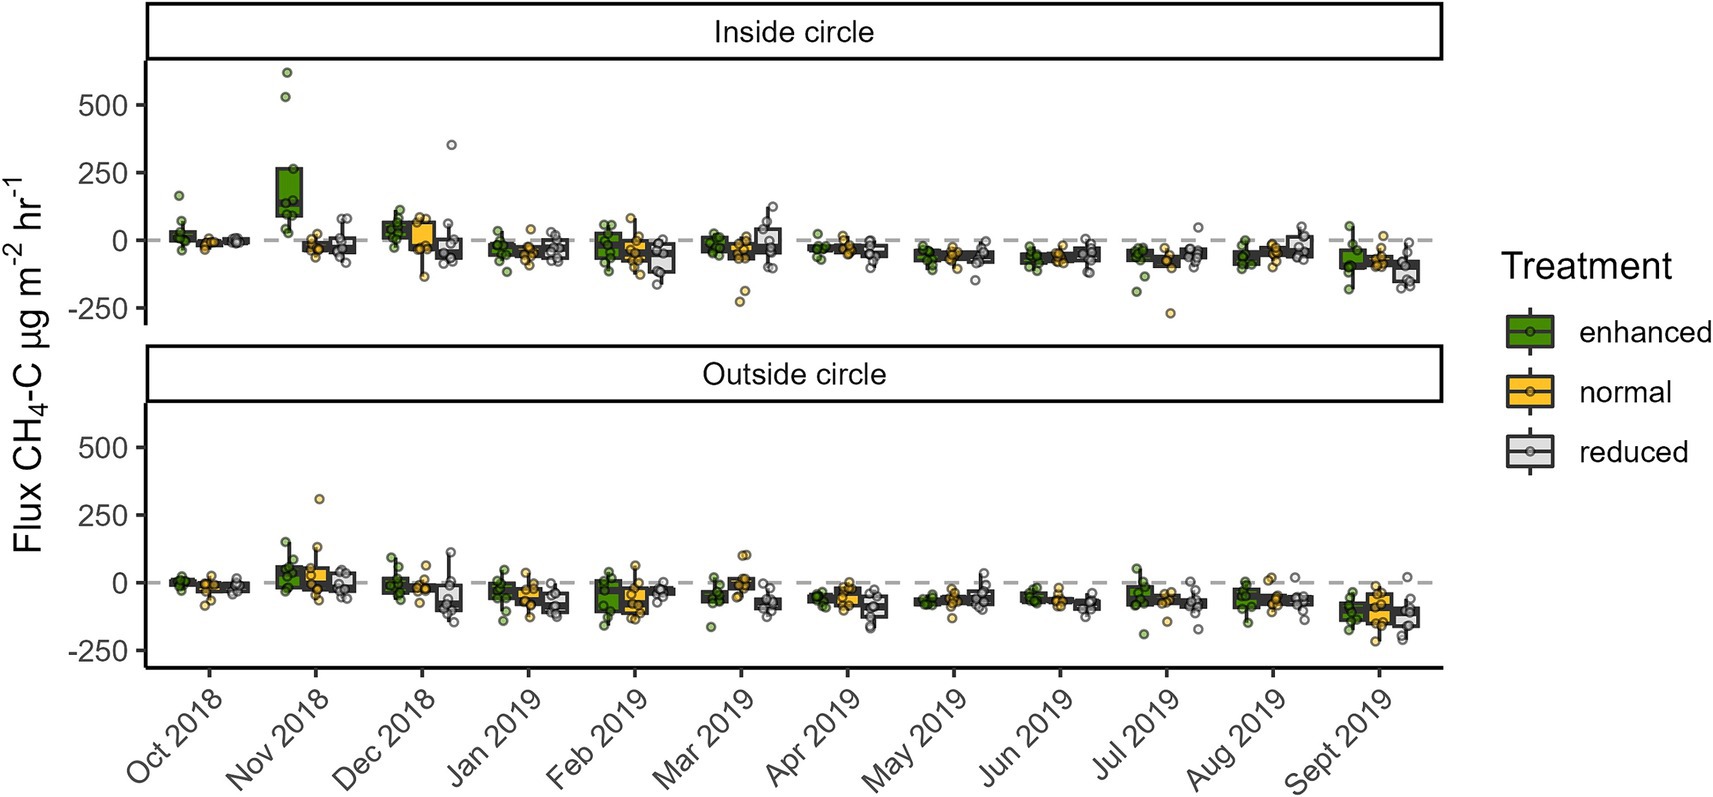
Figure 5. Methane (CH4) fluxes from three different understory treatments (green = enhanced, yellow = normal, grey = reduced complexity) in the Biodiversity and Ecosystem Function in Tropical Agriculture Understory Vegetation (BEFTA UV) Project at Ujung Tanjung Estate. The ends of each box are the upper and lower quartiles, so the box spans the interquartile range. The median is marked by a horizontal line inside the box. The whiskers are the two lines outside the box that extend to the highest and lowest observations. Dots are individual measurements.
3.1.2.3 Ecosystem respiration
Mean (standard deviation) ecosystem respiration CO2 fluxes across the enhanced, normal and reduced treatments were 167.1 (±98.8), 145.8 (±61.6), and 113.4 (±61.9) mg CO2-C m−2 h−1, respectively (Table 1). Soil moisture had a significant negative effect on CO2 flux, and soil moisture was higher in initial time periods (during the wet season months) and lower in later time periods (Figure 6). There was no significant difference in CO2 flux amongst treatments (enhanced, normal, reduced) inside the circle with estimated means [95% CIs] of 192.7 [147.2–238.1], 151.3 [105.8–196.8], and 135.2 [89.7–180.7] mg CO2-C m−2 h−1, respectively, at mean soil moisture (28.38%). Mean CO2 flux was highest in the enhanced treatment inside the circle (as above) and fluxes were significantly lower outside the circle in enhanced (140.7 [95.2–186.2]) and reduced (88.0 [42.5–133.6] mg CO2-C m−2 h−1) treatments. Mean CO2 flux inside the circle in the reduced treatment (135.2 [89.7–180.7] mg CO2-C m−2 h−1) was significantly higher than outside the circle (as above). The fixed effects terms in the model (treatment, in versus out of circle and soil moisture) explained 15.2% of variation in CO2 flux while the random effects (time, block) explained 20.6 and 19.2% of variation, respectively, showing stronger spatial and temporal effects than for N2O and CH4.
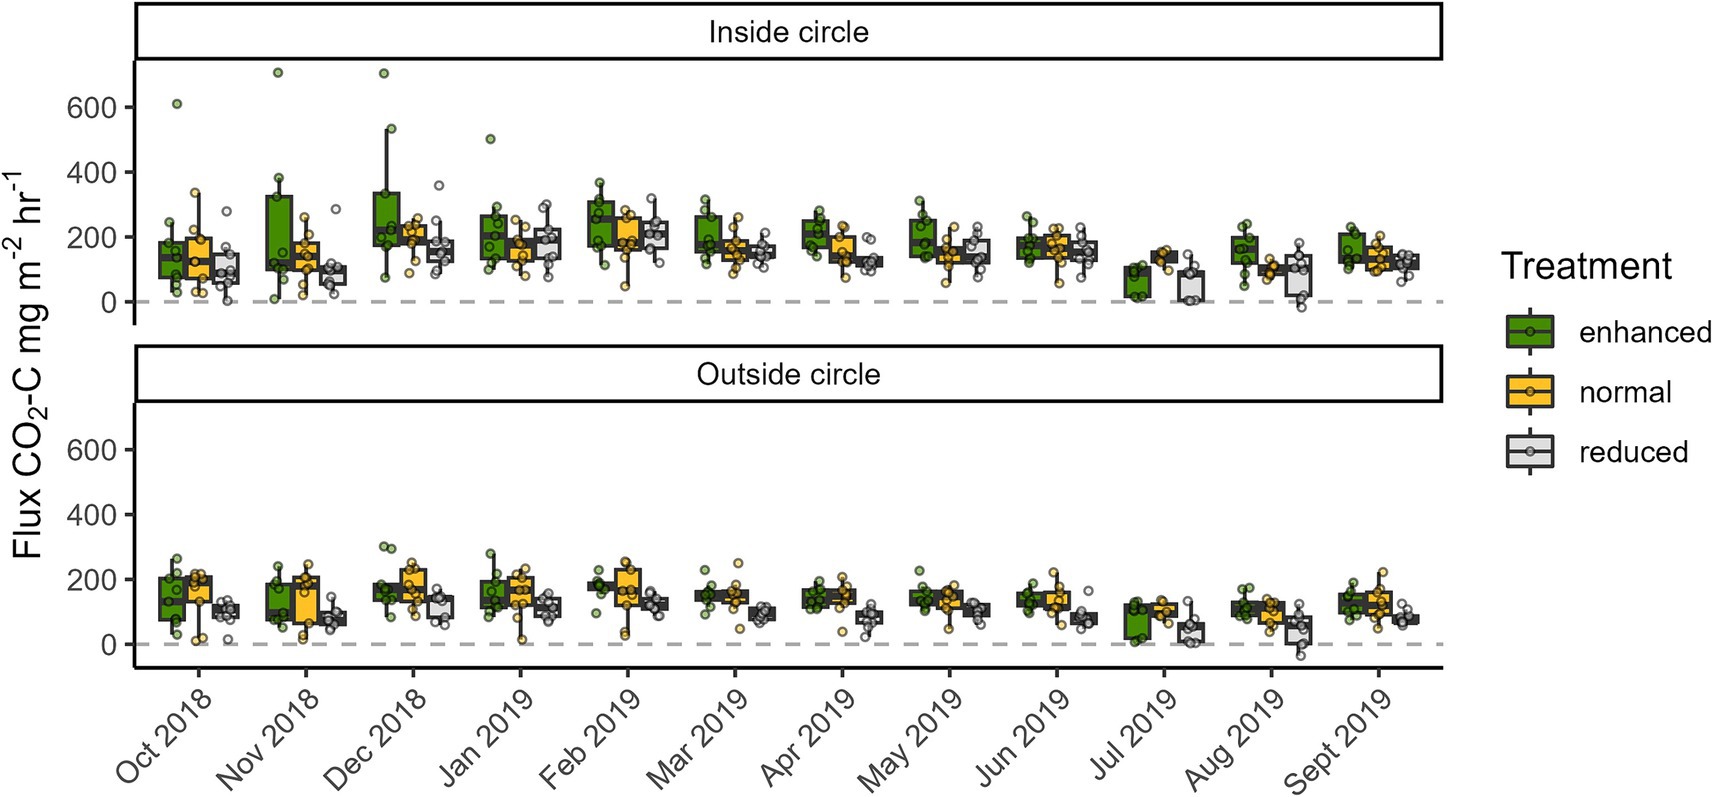
Figure 6. Carbon Dioxide/soil respiration (CO2) fluxes from three different understory treatments (green = enhanced, yellow = normal, grey = reduced complexity) in the Biodiversity and Ecosystem Function in Tropical Agriculture Understory Vegetation (BEFTA UV) Project at Ujung Tanjung Estate. The ends of each box are the upper and lower quartiles, so the box spans the interquartile range. The median is marked by a horizontal line inside the box. The whiskers are the two lines outside the box that extend to the highest and lowest observations. Dots are individual measurements.
3.2 RERTA project
3.2.1 Ancillary environmental parameters
Monthly cumulative rainfall over the duration of the measurement period identified July 2019, April, August and December 2020 as the driest months, with <50 mm of precipitation (Figure 7). The wettest month was November 2020, with 320 mm of rainfall.
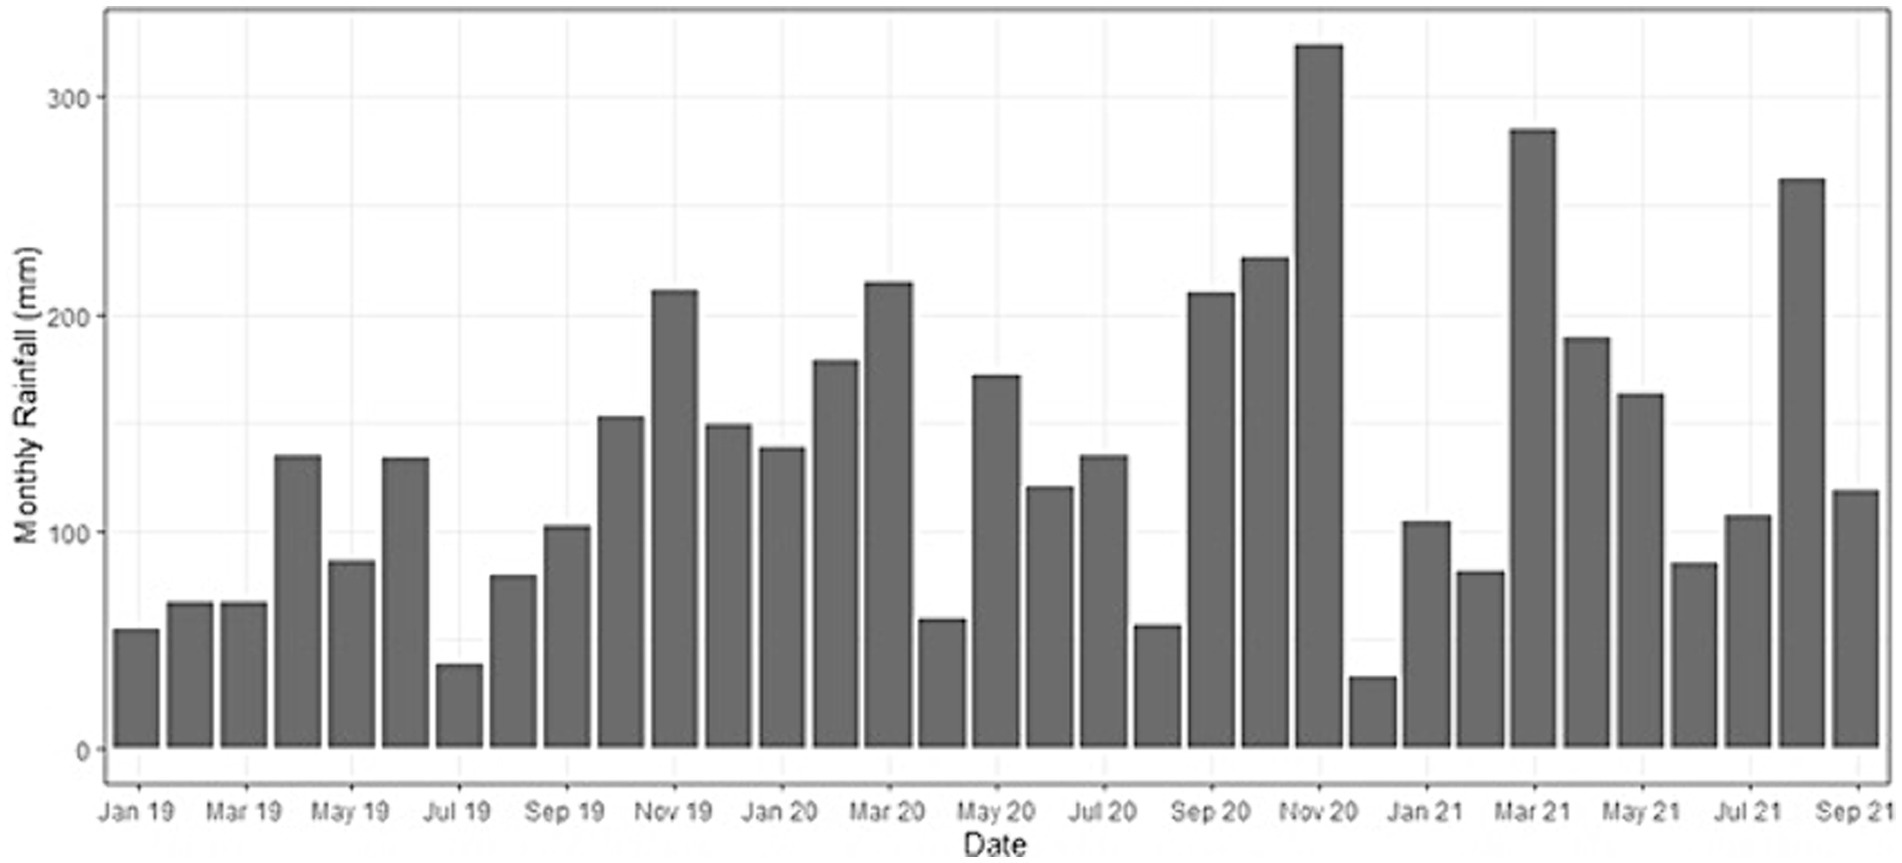
Figure 7. Monthly cumulative rainfall for Kandista Sari Estate during our sampling period within the Riparian Ecosystem Restoration in Tropical Agriculture (RERTA) Project plots.
Soil samples at RERTA were taken just as the buffer treatments were established and there were no discernible differences for pH, soil organic carbon and soil N between the different plots that became treatments (Supplementary Table S2).
3.2.2 Greenhouse gas fluxes
3.2.2.1 Prior to establishing riparian buffer treatments
Before establishing the treatments, all sampling plots were mature OP. N2O fluxes were on average lower in the areas destined to be MOP buffer treatments post-treatment (−0.6 [95% CI –3.0–3.2]) compared with the areas to become plantation (8.6 [95% CI 4.8–13.5] μg N2O-N m−2 h−1). There was no difference amongst other buffer treatment areas (Table 1 and Figure 8). There was no difference in CH4 flux amongst sites prior to establishment of the vegetation treatments (Figure 9). Prior to vegetation treatments, ecosystem CO2 respiration rates were highest in the areas that were destined to be MOP+NT (225 [95% CI 187–264]) and areas that were due to be planted with NT had significantly lower CO2 fluxes (103 [95% CI 65–142]) than those that would be MOP+NT or plantation (181 [95% CI 158–204] mg CO2-C m−2 h−1) (Figure 10).
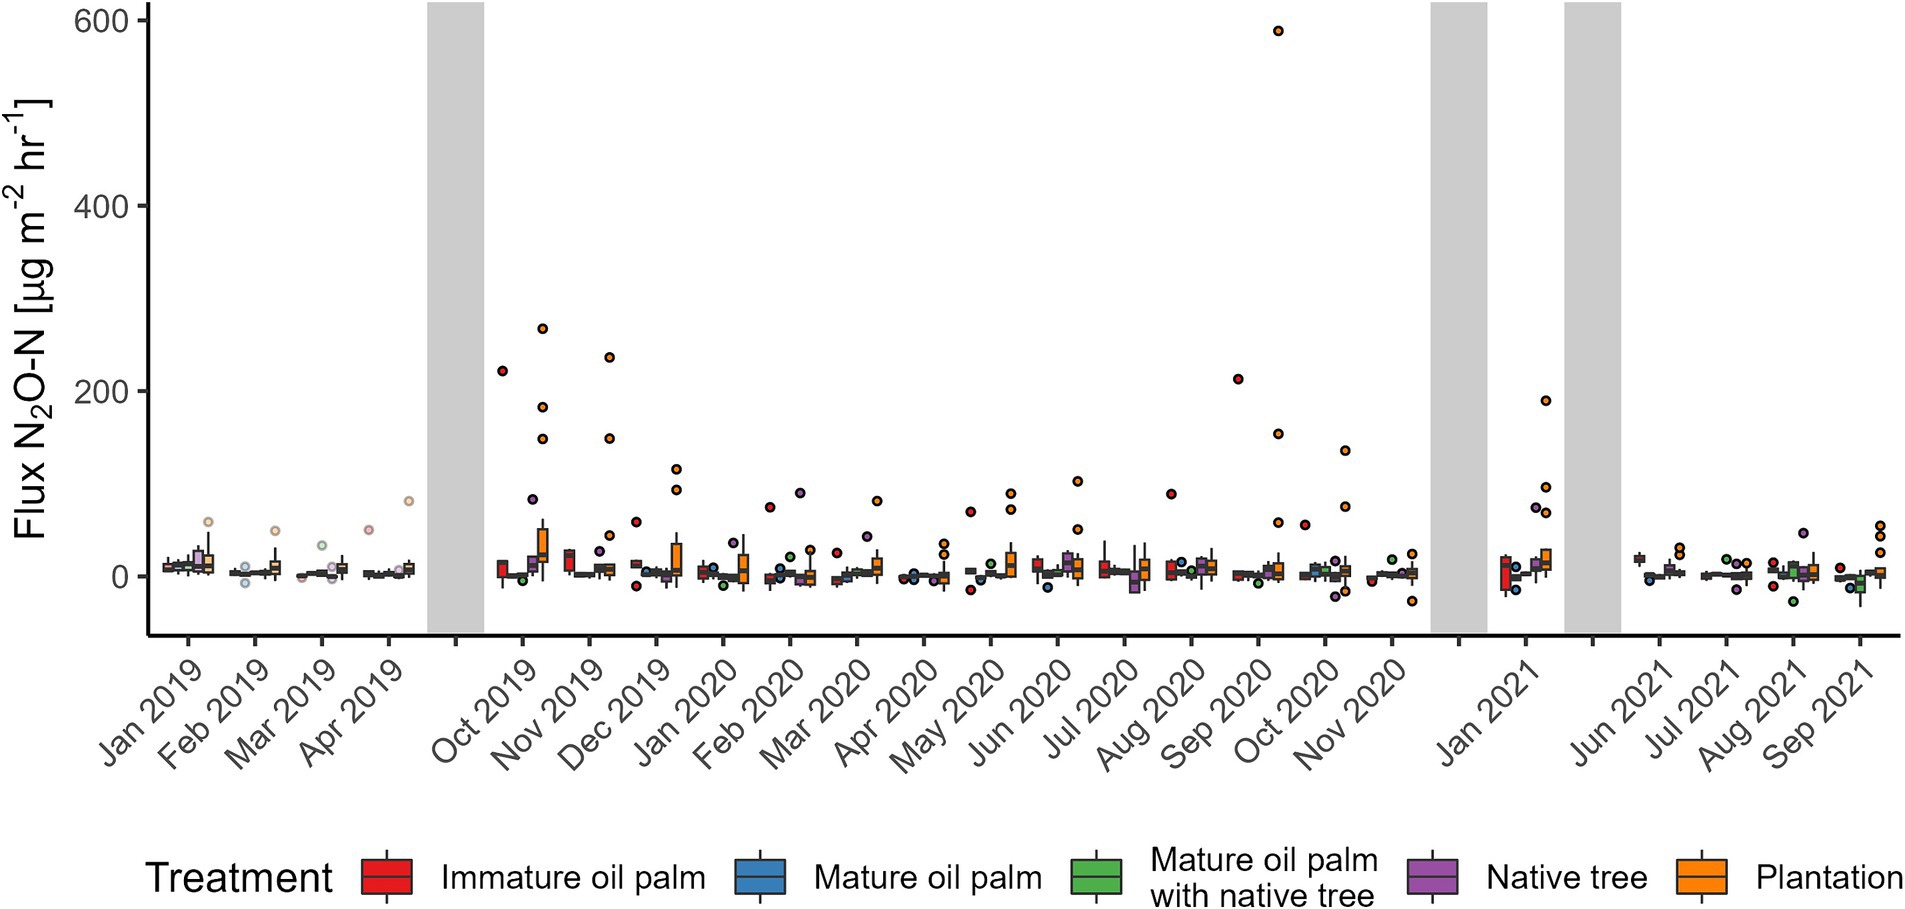
Figure 8. Nitrous oxide (N2O) fluxes from the Riparian Ecosystem Restoration in Tropical Agriculture (RERTA) Project at Kandista Sari Estate. The first 4 months (lighter shading) were before treatments were established and all plots were within mature oil palm. Colours indicate the positions of the later established treatments. Treatments were red = immature oil palm, blue = mature oil palm, green = mature oil palm with native trees, purple = native trees, and orange = surrounding plantation. The ends of each box are the upper and lower quartiles, so the box spans the interquartile range. The median is marked by a horizontal line inside the box. The whiskers are the two lines outside the box that extend to the highest and lowest observations. Dots are individual measurements. The grey shaded areas represent a gap in measurements, different lengths of gaps not represented by size.
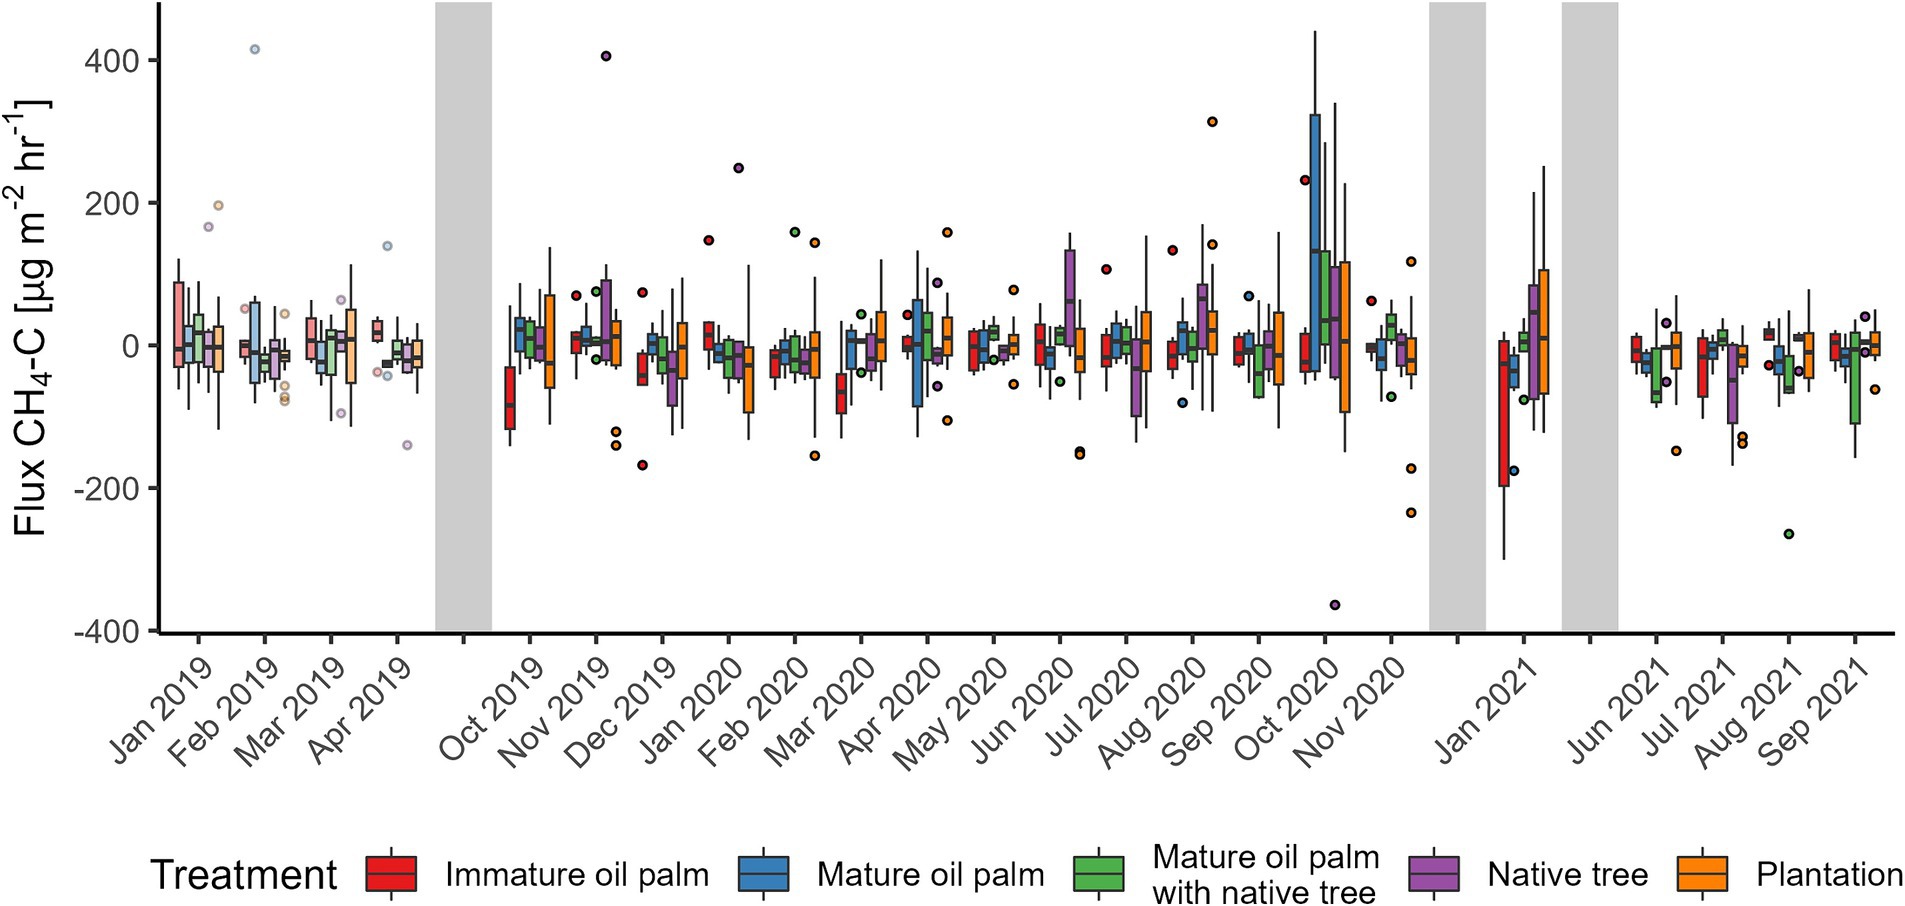
Figure 9. Methane (CH4) fluxes from the Riparian Ecosystem Restoration in Tropical Agriculture (RERTA) Project at Kandista Sari Estate. The first 4 months (lighter shading) were before treatments were established and all plots were within mature oil palm. Colours indicate the positions of the later established treatments. Treatments were red = immature oil palm, blue = mature oil palm, green = mature oil palm with native trees, purple = native trees, and orange = surrounding plantation. The ends of each box are the upper and lower quartiles, so the box spans the interquartile range. The median is marked by a horizontal line inside the box. The whiskers are the two lines outside the box that extend to the highest and lowest observations. Dots are individual measurements. The grey shaded areas represent a gap in measurements, different lengths of gaps not represented by size.
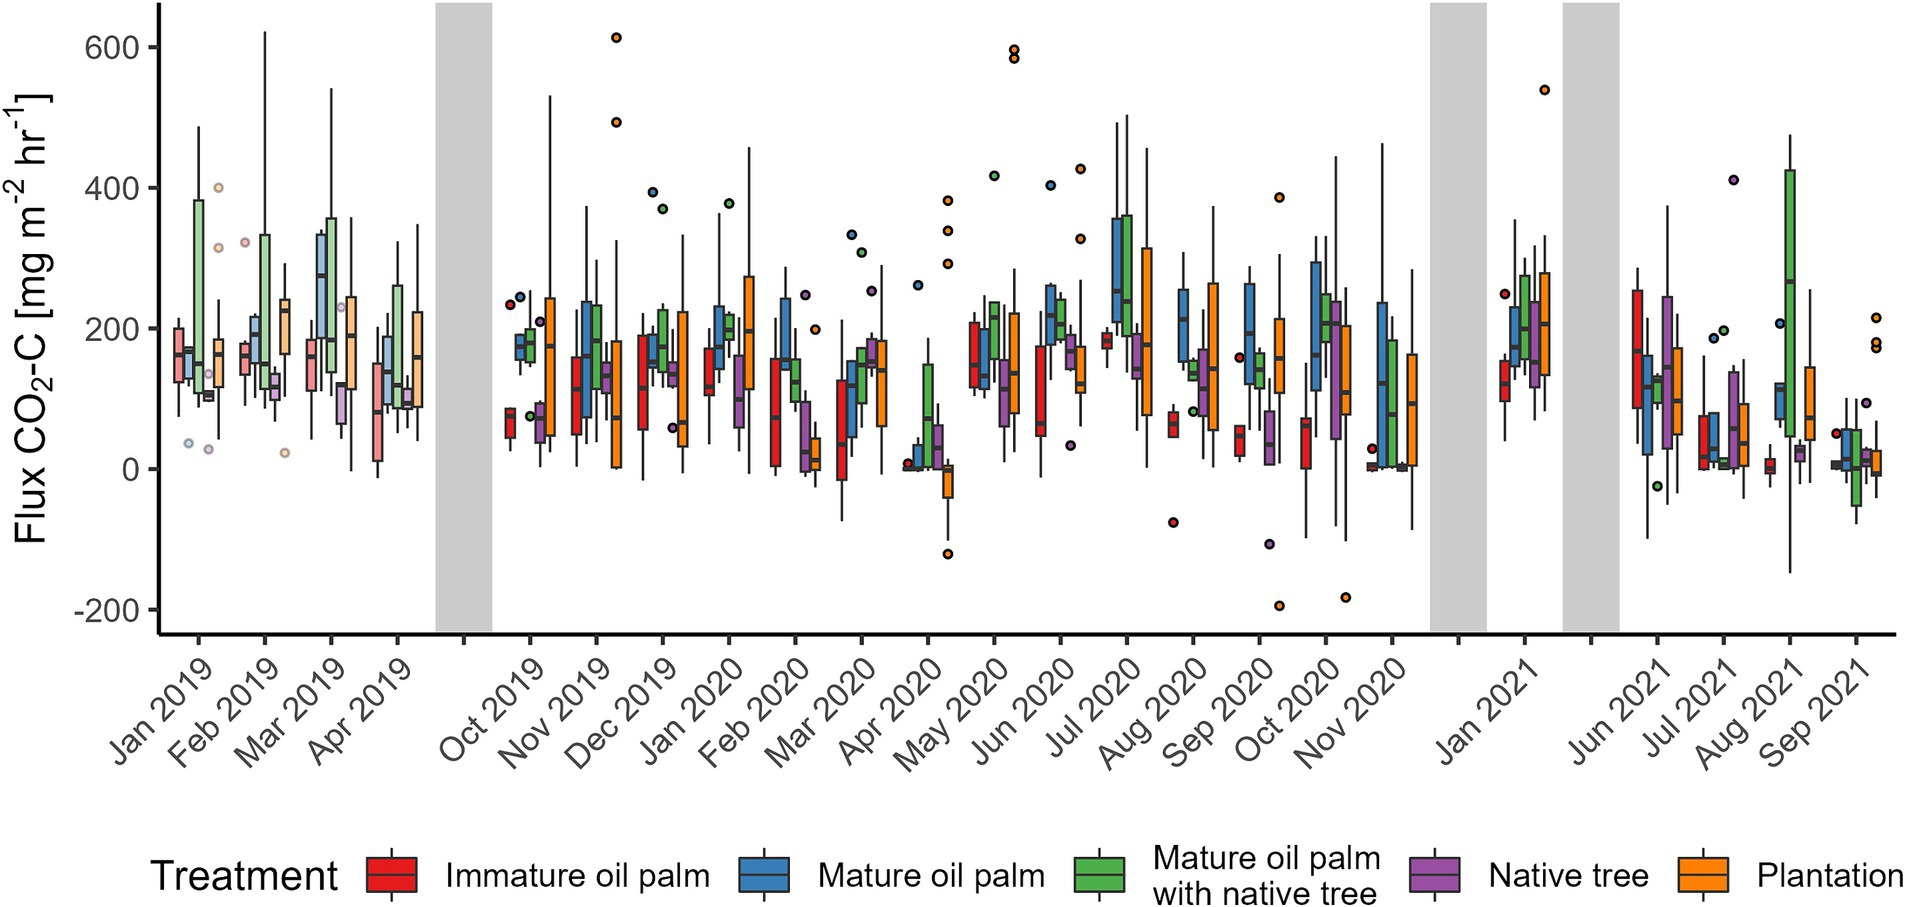
Figure 10. Carbon Dioxide/soil respiration (CO2) fluxes from the Riparian Ecosystem Restoration in Tropical Agriculture (RERTA) Project at Kandista Sari Estate. The first 4 months (lighter shading) were before treatments were established and all plots were within mature oil palm. Colours indicate the positions of the later established treatments. Treatments were red = immature oil palm, blue = mature oil palm, green = mature oil palm with native trees, purple = native trees, and orange = surrounding plantation. The ends of each box are the upper and lower quartiles, so the box spans the interquartile range. The median is marked by a horizontal line inside the box. The whiskers are the two lines outside the box that extend to the highest and lowest observations. Dots are individual measurements. The grey shaded areas represent a gap in measurements, different lengths of gaps not represented by size.
To help attribute any flux differences to riparian buffer treatments specifically, we first tested for differences in fluxes amongst sites prior to establishment of the riparian buffer treatments, when all sites had the same vegetation cover (mature OP) from data collected in the 4 months (January to April 2019). In the case of all GHG, the fixed effects variables in the models explained little variation in the fluxes (3, 7, and 15% in models for CH4, N2O, and CO2, respectively). The random factor of time accounted for very little variation in fluxes, apart from in the case of N2O (5.5%).
3.2.3 After establishments of buffer treatments
3.2.3.1 Nitrous oxide
In the two years following establishment of the riparian buffers (after October 2019) and replanting of the surrounding plantation, mean (standard deviation) N2O flux in the riparian buffer was 10.9 (±32.8), 1.7 (±5.0), 2.1 (±7.3), and 6.4 (±17.2) μg N2O-N m−2 h−1 for IOP, MOP, MOP+NT, and NT, respectively and 16.3 (±48.0) μg N2O-N m−2 h−1 for plantation. This was partly dominated by high fluxes from IOP and plantation in September 2020 (Figure 8). The model explained relatively little of the variation in N2O flux, with only 3.1% of variation being explained by the fixed effects terms and 3.8% by the time random effect. Soil moisture did not affect N2O flux in RERTA. N2O fluxes were significantly higher in plantation (8.8 [95% CI 6.0–11.7]) than MOP (1.4 [95% CI −2.2–5.5]); and MOP+NT (−1.8 [95% CI −5.0–1.9] μg N2O-N m−2 h−1), with the latter having the overall lowest N2O flux across treatments and plantation having the overall highest (estimates calculated at a mean soil moisture value of 21.14%). The differences between plantation and MOP after treatment were broadly consistent with differences detected prior to establishment of the experiment, so may not be attributable to the vegetation treatment.
3.2.3.2 Methane
Methane fluxes fluctuated around zero, between slight CH4 uptake and low positive emissions, across all treatments (Figure 9). Mean (standard deviation) CH4 flux in the riparian buffer was −13.8 (±63.9), 1.0 (±73.0), −2.0 (±60.4) and 4.2 (±89.1) μg CH4-C m−2 h−1 for IOP, MOP, MOP+NT, and NT, respectively, whilst in the plantation the average CH4 flux was −3.1 (±71.0) μg CH4-C m−2 h−1. We did not detect any effect of soil moisture or vegetation treatment on the flux of CH4 after the establishment of the experiments. Thus, the fixed effects terms in the model explained a negligible amount of the variation (0.5%) and the time random effect only accounted for 1.5% of variation.
3.2.3.3 Ecosystem respiration
Variability of CO2 ecosystem respiration across all treatments was high (Figure 10). Mean (standard deviation) CO2 flux in the riparian buffer was 80.4 (±85), 161.7 (±112.7), 158.0 (±113.7), and 101.9 (±99.3) mg CO2-C m−2 h−1 for IOP, MOP, MOP+NT, and NT, respectively, while it was 126.7 (±131.0) mg CO2-C m−2 h−1 for plantation. Our model showed that IOP had the lowest mean CO2 flux (81.9 [95% CI 62.4–101.4] mg CO2-C m−2 h−1) and this was significantly lower than the CO2 flux in plantation (127.6 [95% CI 115.5–139.6]), MOP (159.7 [95% CI 139.9–179.5]) and MOP with NT (155.8 [95% CI 136.1–175.5] mg CO2-C m−2 h−1). The areas with NT also had lower mean CO2 flux (102.5 [95% CI 83.2–121.8] mg CO2-C m−2 h−1) than MOP and MOP+NT. The generally higher CO2 fluxes in MOP+NT and generally lower CO2 fluxes in NT are consistent before and after the experiment was established. They may therefore reflect spatially-dependent environmental effects, rather than treatments per se. We found no effect of soil moisture on CO2 fluxes, but the time random effect explained 18.5% of variation, whilst the fixed effects terms accounted for 5.2% of variation.
In the case of all GHG, the fixed effects variables in the models explained little variation in the fluxes (3, 7, and 15% in models for CH4, N2O, and CO2, respectively). The random factor of time accounted for very little variation in fluxes, apart from N2O (5.5%) fluxes.
4 Discussion
Generally, understory vegetation and different riparian restoration planting options had little effect on all measured GHG fluxes. Results for the individual GHG are discussed below.
4.1 N2O
Measured N2O fluxes from the BEFTA UV Project plots were generally low (as low as <50 μg N2O-N m−2 h−1 for the first 3 months and then <20 μg N2O-N m−2 h−1), and this can be attributed to the fact fertiliser application had ceased in the treatment plots for 1 year prior to measurements. Similarly, N2O fluxes from the RERTA Project treatments were <75 μg N2O-N m−2 h−1. In RERTA, also the entire mature OP plantation was not fertilised for about 1 year prior to us starting our background measurements (first 4 months) which likely explains the very low N2O fluxes. After establishing the treatments, differences between riparian buffer and surrounding plantation became apparent, with higher N2O fluxes in the surrounding plantation (16.3 ± 48.1 μg N2O-N m−2 h−1) compared to between ~2 and 10 μg N2O-N m−2 h−1, likely due to chemical N fertiliser input in the plantation (Pardon et al., 2016, 2017; Skiba et al., 2020; Drewer et al., 2021b). The largest N2O fluxes in the buffer treatments were measured from the immature OP, which was the only buffer treatment receiving N input in form of empty fruit bunches (EFB), albeit at a lower N rate than from chemical fertilisers. Apart from adding nitrogen, EFB also add carbon to the soil which likely stimulated microbial activity and therefore mineralisation.
Plantations that are regularly fertilised can have fluxes in the order of several hundred μg N2O-N m−2 h−1 even outside of immediate fertilisation periods (Drewer et al., 2021b). Whilst our experiment was designed to compare N2O fluxes from the different treatments in the absence of nitrogen input via fertilisation, to better isolate the vegetation treatment effects, there are still a few points to consider. We found that there were notable differences in GHG fluxes over time in our study, which accounted for more variation than the treatment effects themselves. The higher N2O fluxes in the BEFTA UV Project during the first 3 months of sampling might have been due to a legacy effect of preceding fertiliser N application, a phenomenon that has previously been reported in the literature (Chen et al., 2023). In addition, there may be potential, complex interacting effects of presence/absence of vegetation when N fertilisers are applied. For example, vegetation treatment effects may be more apparent if vegetation modifies the fate of the chemicals, for example by taking up nitrogen. Hence it would be useful in future studies to consider the vegetation treatments in combination with N fertiliser application. In a fertilised plantation, up to 79% of N2O emissions can be expected from within the weeding circles, even though they make up only 18% of the plantation area (Chen et al., 2023). It has been previously reported that N fertilisation in oil palm plantations, which usually takes place during the wet season, can lead to higher soil N2O emissions (Aini et al., 2015; Hassler et al., 2017). Our first 3 months of measurements in the BEFTA UV Project coincided with the wet season and were closest in time to the last application of N, hence these two factors might have contributed to the highest measured N2O fluxes during our study period and the relatively large effect of time on N2O fluxes in the model results. Modelling of N2O fluxes is still recognised as a challenge in general, even in fertilised systems (Fuchs et al., 2020). Hence, the mixed model approach not revealing any significant differences of vegetation treatments or soil parameters on N2O fluxes in our case, where fluxes were low throughout, is not unusual.
4.2 CH4
Methane uptake rates in OP plantations are known to be lower in the wet season than in the dry season (Hassler et al., 2015) and CH4 oxidation is more prevalent than CH4 production in well drained tropical soils (Veldkamp et al., 2013). However, in our case for both the BEFTA UV Project and RERTA project, CH4 fluxes were generally low whether negative (small uptake rates) or positive (small positive emissions) as also reported elsewhere (Hassler et al., 2015; Dhandapani et al., 2021; Drewer et al., 2021b). In our study, vegetation treatments both as understory (BEFTA UV) and riparian restoration (RERTA) appear to have little impact on CH4 fluxes and our model could not identify any effect of vegetation type or soil moisture. However, we did measure the lowest uptake rates/positive emissions during the wetter periods. To draw firmer conclusions of treatment effects on CH4 fluxes, a much larger dataset might be needed as highlighted in a recent study, which utilized tens of thousands of individual measurements (Cowan et al., 2021). Nevertheless, as reported here, CH4 fluxes were generally low so changes in vegetation cover would not be expected to make a large difference in terms of CH4 fluxes from mineral soil. In tropical soils that are well-drained and have low N availability, methanotrophic activity (i.e. soil CH4 uptake) increases with higher soil mineral N content (Veldkamp et al., 2013; Hassler et al., 2015). There was a significant difference of CH4 fluxes being less negative inside the circles in the enhanced treatment in the BEFTA UV Project compared to the normal treatment. However, it is unlikely that the vegetation present in the weeding circles would have lowered methanotrophic activity.
4.3 Ecosystem respiration CO2
The variability of ecosystem CO2 fluxes was high in both BEFTA UV and RERTA. Soil organic carbon content was considerably lower in the RERTA plots than the BEFTA UV plots, likely due to soil disturbance during replanting operations. To draw meaningful conclusions on the changes in soil parameters, plots ought to be resampled a few years after treatment establishment, however, it is still important to assess the immediate effects, even if small. The pH was also lower in all RERTA plots compared to the BEFTA UVplots, likely for the same reasons. The spatial variation of soil organic matter can influence soil CO2 emissions in tropical ecosystems (Hassler et al., 2015). Hence, measuring immediate changes after industrial replanting on large areas is important, as the period of disturbance could potentially have a large pulse effect on soil CO2 fluxes.
4.4 Management zones (inside/outside weeding circles)
Even though we did not find differences in N2O fluxes from inside and outside the circles at the BEFTA UV plots, it is known that the circles are prone to compaction and increased soil bulk density due to repeated management activities such as weeding, pruning and harvesting in the palm circles. Furthermore, low microbial biomass and soil organic carbon as well as a low soil N cycling rate can be expected in these zones (Formaglio et al., 2021). Root biomass is also known to be higher within the circles (Dassou et al., 2021). In contrast, in areas outside the circles, such as frond-stacked areas, there can be a lower bulk density, larger amounts of soil organic matter, and higher microbial and fine root biomass, which are commonly associated with a higher soil N cycling rate (Formaglio et al., 2020; Dassou et al., 2021). While these different management zones have documented differences in soil properties (Formaglio et al., 2021), that in the past have been associated with driving spatial variability in GHG fluxes (Aini et al., 2015; Hassler et al., 2015, 2017), in our non-fertilised plots, these differences could not be identified. Hence, it is likely that these spatial differences in GHG fluxes associated with management zones are more pronounced in the presence of additional N-fertiliser.
In summary, no clear negative effects in terms of GHGs fluxes were observed from a range of ecological management options, such as increasing understory complexity (BEFTA UV Project) and establishing riparian buffers using different strategies (RERTA Project). Although no substantial decreases in emissions have yet been observed, it is likely that differences could develop over time, particularly within the riparian buffer treatments as they grow more complex. It is likely that lower N2O emissions from areas with buffer treatments could potentially offset large N2O fluxes related to N fertilisation rates in surrounding plantation areas and hence lower the GHG footprint of the plantation as a whole (Pardon et al., 2016; Meijide et al., 2020; Skiba et al., 2020; Drewer et al., 2021b; Chen et al., 2023). Given the proven benefits of more complex understory vegetation for biodiversity and healthy ecosystem functioning (Ashton-Butt et al., 2018; Luke et al., 2019a; Pashkevich et al., 2022), plus the potential for restored riparian buffers to support a range of species and services (Luke et al., 2019b), and to increase their capacity for GHG emissions reductions over time, our findings therefore support the view that these features bring environmental benefits in oil palm landscapes. We recommend that future investigations of GHG emissions from plantations consider the longer-term impact of management activities, and either return to sites such as those in this study, or design experimentation that investigates emission over several years.
Data availability statement
The datasets presented in this study can be found in online repositories. The names of the repository/repositories and accession number(s) can be found below: JD, SW, RT, and Pujianto, Nitrous oxide and methane fluxes from different riparian restoration treatments in oil palm plantations in Riau, Indonesia 2019–2021, 2021, NERC Environmental Information Data Centre. https://doi.org/10.5285/f587847a-7505-4fd8-99db-b99cc0285f9f. JD, SW, RT, Pujianto, Nitrous oxide and methane fluxes from different understory treatments in oil palm plantations in Riau, Indonesia 2018–2019, 2020, NERC Environmental Information Data Centre. https://doi.org/10.5285/378f028d-ab04-4fa5-a5ca-61f78ea0adb0.
Author contributions
JD: Conceptualization, Data curation, Funding acquisition, Investigation, Methodology, Project administration, Resources, Writing – original draft. RT: Investigation, Writing – review & editing. LB: Formal analysis, Investigation, Writing – review & editing. SW: Data curation, Formal analysis, Investigation, Writing – review & editing. ER: Visualization, Writing – review & editing. SL: Writing – review & editing. ET: Writing – review & editing. US: Funding acquisition, Writing – review & editing. NC: Visualization, Writing – review & editing. JD: Supervision, Writing – review & editing. ADA: Supervision, Writing – review & editing. AKA: Supervision, Writing – review & editing. J-PC: Resources, Writing – review & editing. P: Resources, Writing – review & editing.
Funding
The author(s) declare financial support was received for the research, authorship, and/or publication of this article. This work was funded by the UK Natural Environment Research Council (NERC) under the International Opportunities Fund (Agricultural Practices for Greenhouse gas Regulation in Oil palm (AP-GRO), Grant Ref: NE/R005214/1) and Sustainable Use of Natural Resources to Improve Hu-man Health and Support Economic Development (SUNRISE) Programme (Grant Ref: NE/R000131/1) for UKCEH as well as NERC National Capability Science: International award “Options for Net Zero Plus and Climate Change Adaptation” (Grant Ref: NE/X006247/1). Set-up of the BEFTA UV and RERTA projects was funded by The Isaac Newton Trust Cambridge, Golden Agri Resources, ICOPE (the International Conference on Oil Palm and the Environment), and the Natural Environment Research Council (grant number NE/P00458X/1).
Acknowledgments
We would like to thank all our collaborators at SMARTRI and the managers in the Ujung Tanjung and Kandista Sari estates for their ongoing support with the project. We would like to thank Foreign Research Permit Division National Research and Innovation Agency (RISTEK) for permission to conduct this research under following permit numbers: 323/SIP/FRP/E5/Dit.KI/X/2018, 8B/TKPIPA/E5/Dit.KI/VIII/2019, 0/TKPIPA-VM/FRP/E5/Dit.KI/X/2020, and 22/SIP/IV/FR/1/2022. We also thank RISTEK for research permission that allowed the initial establishment of the BEFTA UV and RERTA projects (permit numbers 426/SIP/FRP/SM/XI/2012, 72/EXT/SIP/FRP/SM/IX/2013, 44/EXT/SIP/FRP/SM/IX/2014, 354/SIP/FRP/E5/Dit.KI/X/2016, 66/EXT/SIP/FRP/E5/Dit.KI/IX/2017, 45/EXT/SIP/FRP/E5/Dit.KI/X/2018, 431/E5/E5.4/SIP/2019, 53/E5/E5.4/SIP.EXT/2020).
Conflict of interest
All authors with a Sinar Mas Agro Resources and Technology Research Institute (SMARTRI) affiliation were employed by SMARTRI, the research division of Golden Agri Resources (GAR), while research was conducted. UKCEH as well as the University of Cambridge had a collaboration agreement with SMATRI that protects the intellectual property rights and data-use for all researchers involved in this study.
Publisher’s note
All claims expressed in this article are solely those of the authors and do not necessarily represent those of their affiliated organizations, or those of the publisher, the editors and the reviewers. Any product that may be evaluated in this article, or claim that may be made by its manufacturer, is not guaranteed or endorsed by the publisher.
Supplementary material
The Supplementary material for this article can be found online at: https://www.frontiersin.org/articles/10.3389/ffgc.2024.1324475/full#supplementary-material
Footnotes
References
Aini, F. K., Hergoualc’h, K., Smith, J. U., and Verchot, L. (2015). Nitrous oxide emissions along a gradient of tropical forest disturbance on mineral soils in Sumatra. Agric. Ecosyst. Environ. 214, 107–117. doi: 10.1016/j.agee.2015.08.022
Ashton-Butt, A., Aryawan, A.A.K., Hood, A.S.C., Naim, M., Purnomo, D., Suhardi, W, et al., (2018). Understory vegetation in oil palm plantations benefits soil biodiversity and decomposition rates. Frontiers in Forests and Global Change. 1, Lausanne, Switzerland Frontiers Media S.A
Brooks, M. E., Kristensen, K., Benthem, K. J., Magnusson, A., Berg, C. W., Nielsen, A., et al. (2017). glmmTMB balances speed and flexibility among packages for zero-inflated generalized linear mixed modeling. R J 9:378. doi: 10.32614/RJ-2017-066
Chen, G., Veldkamp, E., Damris, M., Irawan, B., Tjoa, A., and Corre, M. D. (2023). Large contribution of soil N2O emission to the global warming potential of a large-scale oil palm plantation despite changing from conventional to reduced management practices. Biogeosci. Discuss. 21, 513–529. doi: 10.5194/bg-21-513-2024,2024
Cole, L. J., Stockan, J., and Helliwell, R. (2020). Managing riparian buffer strips to optimise ecosystem services: a review. Agric. Ecosyst. Environ. 296:106891. doi: 10.1016/j.agee.2020.106891
Corley, R. H. V. (2009). How much palm oil do we need? Environ. Sci. Pol. 12, 134–139. doi: 10.1016/j.envsci.2008.10.011
Cowan, N., Maire, J., Krol, D., Cloy, J. M., Hargreaves, P., Murphy, R., et al. (2021). Agricultural soils: a sink or source of methane across the British Isles? Eur. J. Soil Sci. 72, 1842–1862. doi: 10.1111/ejss.13075
Dassou, O., Nodichao, L., Aholoukpè, H., Cakpo, Y., and Jourdan, C. (2021). Improving the methodology for root biomass estimation in monocotyledonous tree plantations: case of oil palm (Elaeis guineensis. Jacq) in West Africa. Plant Soil 465, 593–611. doi: 10.1007/s11104-021-04939-4
Dhandapani, S., Evers, S., Ritz, K., and Sjögersten, S. (2021). Nutrient and trace element concentrations influence greenhouse gas emissions from Malaysian tropical peatlands. Soil Use Manag. 37, 138–150. doi: 10.1111/sum.12669
Dislich, C., Keyel, A. C., Salecker, J., Kisel, Y., Meyer, K. M., Auliya, M., et al. (2017). A review of the ecosystem functions in oil palm plantations, using forests as a reference system. Biol. Rev. 92, 1539–1569. doi: 10.1111/brv.12295
Drewer, J., Anderson, M., Levy, P. E., Scholtes, B., Helfter, C., Parker, J., et al. (2017a). The impact of ploughing intensively managed temperate grasslands on N2O, CH4 and CO2 fluxes. Plant Soil 411, 193–208. doi: 10.1007/s11104-016-3023-x
Drewer, J., Kuling, H. J., Cowan, N. J., Majalap, N., Sentian, J., and Skiba, U. (2021a). Comparing soil nitrous oxide and methane fluxes from oil palm plantations and adjacent riparian forests in Malaysian Borneo. Front Forests Global Change 4:738303. doi: 10.3389/ffgc.2021.738303
Drewer, J., Leduning, M. M., Griffiths, R. I., Goodall, T., Levy, P. E., Cowan, N., et al. (2021b). Comparison of greenhouse gas fluxes from tropical forests and oil palm plantations on mineral soil. Biogeosciences 18, 1559–1575. doi: 10.5194/bg-18-1559-2021
Drewer, J., White, S., Sionita, R., and Pujianto, P. (2020a). Nitrous oxide and methane fluxes from different riparian restoration treatments in oil palm plantations in Riau, Indonesia 2018–2019 NERC Environmental Information Data Centre. doi: 10.5285/f587847a-7505-4fd8-99db-b99cc0285f9fb
Drewer, J., White, S., Sionita, R., and Pujianto, P. (2021c). Nitrous oxide and methane fluxes from different riparian restoration treatments in oil palm plantations in Riau, Indonesia 2019–2021 NERC EDS Environmental Information Data Centre.
Drewer, J., Yamulki, S., Leeson, S. R., Anderson, M., Perks, M. P., Skiba, U. M., et al. (2017b). Difference in soil methane (CH4) and nitrous oxide (N2O) fluxes from bioenergy crops SRC willow and SRF scots pine compared with adjacent arable and fallow in a temperate climate. Bioenergy Res. 10, 575–582. doi: 10.1007/s12155-017-9824-9
Drewer, J., Zhao, J., Leduning, M. M., Levy, P. E., Sentian, J., Gubry-Rangin, C., et al. (2020b). Linking nitrous oxide and nitric oxide fluxes to microbial communities in tropical Forest soils and oil palm plantations in Malaysia in laboratory incubations. Front Forests Global Change 3:4. doi: 10.3389/ffgc.2020.00004
Fitzherbert, E. B., Struebig, M. J., Morel, A., Danielsen, F., Brühl, C. A., Donald, P. F., et al. (2008). How will oil palm expansion affect biodiversity? Trends Ecol. Evol. 23, 538–545. doi: 10.1016/j.tree.2008.06.012
Formaglio, G., Veldkamp, E., Damris, M., Tjoa, A., and Corre, M. D. (2021). Mulching with pruned fronds promotes the internal soil N cycling and soil fertility in a large-scale oil palm plantation. Biogeochemistry 154, 63–80. doi: 10.1007/s10533-021-00798-4
Formaglio, G., Veldkamp, E., Duan, X., Tjoa, A., and Corre, M. D. (2020). Herbicide weed control increases nutrient leaching compared to mechanical weeding in a large-scale oil palm plantation. Biogeosciences 17, 5243–5262. doi: 10.5194/bg-17-5243-2020
Foster, W. A., Snaddon, J. L., Turner, E. C., Fayle, T. M., Cockerill, T. D., Ellwood, M. D., et al. (2011). Establishing the evidence base for maintaining biodiversity and ecosystem function in the oil palm landscapes of South East Asia. Philosophical Transactions of the Royal Society B: Biological Sciences. 366, 3277–3291.
Fuchs, K., Merbold, L., Buchmann, N., Bretscher, D., Brilli, L., Fitton, N., et al. (2020). Multimodel evaluation of nitrous oxide emissions from an intensively managed grassland. J. Geophys. Res. Biogeo. 125:e2019JG005261. doi: 10.1029/2019JG005261
Hartig, F. (2020). DHARMa: residual diagnostics for hierarchical (multi-level/mixed) regression models. R package version :3.
Hassler, E., Corre, M. D., Kurniawan, S., and Veldkamp, E. (2017). Soil nitrogen oxide fluxes from lowland forests converted to smallholder rubber and oil palm plantations in Sumatra, Indonesia. Biogeosciences 14, 2781–2798. doi: 10.5194/bg-14-2781-2017
Hassler, E., Corre, M. D., Tjoa, A., Damris, M., Utami, S. R., and Veldkamp, E. (2015). Soil fertility controls soil–atmosphere carbon dioxide and methane fluxes in a tropical landscape converted from lowland forest to rubber and oil palm plantations. Biogeosciences 12, 5831–5852. doi: 10.5194/bg-12-5831-2015
Hennings, N., Fricke, K. M., Damris, M., Dippold, M. A., and Kuzyakov, Y. (2022). Management extensification in oil palm plantations reduces SOC decomposition. Soil Biol. Biochem. 165:108535. doi: 10.1016/j.soilbio.2021.108535
Houba, V. J. G. , (1988). Soil and plant analysis: a series of syllabi. Wageningen agricultural university, Department of Soil Science and Plant Nutrition. 4th ed. Wageningen.
Kaupper, T., Hetz, S., Kolb, S., Yoon, S., Horn, M. A., and Ho, A. (2019). Deforestation for oil palm: impact on microbially mediated methane and nitrous oxide emissions, and soil bacterial communities. Biol. Fertil. Soils 56, 287–298. doi: 10.1007/s00374-019-01421-3
Lang, R., Goldberg, S. D., Blagodatsky, S., Piepho, H.-P., Hoyt, A. M., Harrison, R. D., et al. (2020). Mechanism of methane uptake in profiles of tropical soils converted from forest to rubber plantations. Soil Biol. Biochem. 145:107796. doi: 10.1016/j.soilbio.2020.107796
Levy, P. E., Burden, A., Cooper, M. D. A., Dinsmore, K. J., Drewer, J., Evans, C., et al. (2012). Methane emissions from soils: synthesis and analysis of a large UK data set. Glob. Chang. Biol. 18, 1657–1669. doi: 10.1111/j.1365-2486.2011.02616.x
Lüdecke, D. (2018). Ggeffects: tidy data frames of marginal effects from regression models. J Open Source Softw 3:772. doi: 10.21105/joss.00772
Luke, S. H., Advento, A. D., Aryawan, A. A. K., Adhy, D. N., Ashton-Butt, A., Barclay, H., et al. (2020). Managing oil palm plantations more sustainably: large-scale experiments within the biodiversity and ecosystem function in tropical agriculture (BEFTA) Programme. Front Forests Global Change 2:e75. doi: 10.3389/ffgc.2019.00075
Luke, S. H., Purnomo, D., Advento, A. D., Aryawan, A. A. K., Naim, M., Pikstein, R. N., et al. (2019a). Effects of understory vegetation management on plant communities in oil palm plantations in Sumatra, Indonesia. Front Forests Global Change 2:e33. doi: 10.3389/ffgc.2019.00033
Luke, S. H., Slade, E. M., Gray, C. L., Annammala, K. V., Drewer, J., Williamson, J., et al. (2019b). Riparian buffers in tropical agriculture: scientific support, effectiveness and directions for policy. J. Appl. Ecol. 56, 85–92. doi: 10.1111/1365-2664.13280
Meijaard, E., Brooks, T. M., Carlson, K. M., Slade, E. M., Garcia-Ulloa, J., Gaveau, D. L. A., et al. (2020). The environmental impacts of palm oil in context. Nature Plants 6, 1418–1426. doi: 10.1038/s41477-020-00813-w
Meijide, A., de la Rua, C., Guillaume, T., Röll, A., Hassler, E., Stiegler, C., et al. (2020). Measured greenhouse gas budgets challenge emission savings from palm-oil biodiesel. Nat. Commun. 11:1089. doi: 10.1038/s41467-020-14852-6
Mori, T. (2022). Effects of tropical forest conversion into oil palm plantations on nitrous oxide emissions: a meta-analysis. J. For. Res. 34, 865–869. doi: 10.1007/s11676-022-01493-2
Nobilly, F., Atikah, S. N., Yahya, M. S., Jusoh, S., Cun, G. S., Norhisham, A. R., et al. (2022). Rotational cattle grazing improves understory vegetation biodiversity and structural complexity in oil palm plantations. Weed Biol. Manag. 22, 13–26. doi: 10.1111/wbm.12246
Pardon, L., Bessou, C., Saint-Geours, N., Gabrielle, B., Khasanah, N., Caliman, J. P., et al. (2016). Quantifying nitrogen losses in oil palm plantations: models and challenges. Biogeosciences 13, 5433–5452. doi: 10.5194/bg-13-5433-2016
Pardon, L., Huth, N. I., Nelson, P. N., Banabas, M., Gabrielle, B., and Bessou, C. (2017). Yield and nitrogen losses in oil palm plantations: Main drivers and management trade-offs determined using simulation. Field Crop Res. 210, 20–32. doi: 10.1016/j.fcr.2017.05.016
Pashkevich, M. D., Luke, S. H., Aryawan, A. A. K., Waters, H. S., Caliman, J.-P., Dupérré, N., et al. (2022). Riparian buffers made of mature oil palms have inconsistent impacts on oil palm ecosystems. Ecol. Appl. 32:e2552. doi: 10.1002/eap.2552
R Core Team , (2023). R: a language and environment for statistical computing. R.C. Team (Ed.), R foundation for statistical computing, Vienna, Austria
Sakata, R., Shimada, S., Arai, H., Yoshioka, N., Yoshioka, R., Aoki, H., et al. (2015). Effect of soil types and nitrogen fertilizer on nitrous oxide and carbon dioxide emissions in oil palm plantations. Soil Sci. Plant Nutr. 61, 48–60. doi: 10.1080/00380768.2014.960355
Sala, O. E., Stuart Chapin, F., Armesto, J. J., Berlow, E., Bloomfield, J., Dirzo, R., et al. (2000). Global biodiversity scenarios for the year 2100. Science 287, 1770–1774. doi: 10.1126/science.287.5459.1770
Savilaakso, S., Garcia, C., Garcia-Ulloa, J., Ghazoul, J., Groom, M., Guariguata, M. R., et al. (2014). Systematic review of effects on biodiversity from oil palm production. Environ. Evid. 3:4. doi: 10.1186/2047-2382-3-4
Skiba, U., Hergoualc’h, K., Drewer, J., Meijide, A., and Knohl, A. (2020). Oil palm plantations are large sources of nitrous oxide, but where are the data to quantify the impact on global warming? Curr. Opin. Environ. Sustain. 47, 81–88. doi: 10.1016/j.cosust.2020.08.019
Teh, Y. A., Silver, W. L., and Conrad, M. E. (2005). Oxygen effects on methane production and oxidation in humid tropical forest soils. Glob. Chang. Biol. 11, 1283–1297. doi: 10.1111/j.1365-2486.2005.00983.x
Veldkamp, E., Koehler, B., and Corre, M. D. (2013). Indications of nitrogen-limited methane uptake in tropical forest soils. Biogeosciences 10, 5367–5379. doi: 10.5194/bg-10-5367-2013
Yashiro, Y., Kadir, W. R., Okuda, T., and Koizumi, H. (2008). The effects of logging on soil greenhouse gas (CO2, CH4, N2O) flux in a tropical rain forest, peninsular Malaysia. Agric. For. Meteorol. 148, 799–806. doi: 10.1016/j.agrformet.2008.01.010
Zemp, D. C., Guerrero-Ramirez, N., Brambach, F., Darras, K., Grass, I., Potapov, A., et al. (2023). Tree islands enhance biodiversity and functioning in oil palm landscapes. Nature 618, 316–321. doi: 10.1038/s41586-023-06086-5
Keywords: nitrous oxide, methane, ecosystem respiration, mineral soil, Sumatra, Indonesia, sustainable agriculture, vegetation experiment
Citation: Drewer J, Tarigan RS, Banin LF, White S, Raine E, Luke SH, Turner EC, Skiba U, Cowan NJ, Dewi JP, Advento AD, Aryawan AAK, Caliman J-P and Pujianto (2024) Restoring understory and riparian areas in oil palm plantations does not increase greenhouse gas fluxes. Front. For. Glob. Change. 7:1324475. doi: 10.3389/ffgc.2024.1324475
Edited by:
Nobuo Imai, Tokyo University of Agriculture, JapanReviewed by:
Ana Meijide, University of Göttingen, GermanyTaiki Mori, Forestry and Forest Products Research Institute, Japan
Copyright © 2024 Drewer, Tarigan, Banin, White, Raine, Luke, Turner, Skiba, Cowan, Dewi, Advento, Aryawan, Caliman and Pujianto. This is an open-access article distributed under the terms of the Creative Commons Attribution License (CC BY). The use, distribution or reproduction in other forums is permitted, provided the original author(s) and the copyright owner(s) are credited and that the original publication in this journal is cited, in accordance with accepted academic practice. No use, distribution or reproduction is permitted which does not comply with these terms.
*Correspondence: Julia Drewer, anVld0BjZWguYWMudWs=