- 1Wuwei Forestry Comprehensive Service Center, Wuwei, China
- 2Faculty of Ecology and Environment, Baotou Teachers’ College, Inner Mongolia University of Science and Technology, Baotou, China
- 3Key Laboratory of Eco-Hydrology of Inland River Basin, Northwest Institute of Eco-Environment and Resources, Chinese Academy of Sciences, Lanzhou, China
As a key ecological function area and a priority area for biodiversity conservation in China, Qilian Mountain National Park is facing a severe test of its ecological environment, and the study of its landscape ecological risk is of great significance to the construction and high-quality development of the Qilian Mountain National Park. In this research, based on land use data from six periods (i.e., year in 1995, 2000, 2005, 2010, 2015, and 2020) in the Qilian Mountain National Park, we divided the ecological risk plots, calculated the landscape pattern, and constructed the landscape ecological risk index to deeply explore the temporal and spatial heterogeneity of landscape ecological risk in Qilian Mountain National Park by using ArcGIS, Fragstats and GeoDa. The results showed that: Grassland is the predominant land use type, the area covered by woodland and grassland have exhibited a significant increase since 1995. Landscape fragmentation and disturbance indices exhibit fluctuations across different years, but showed an overall decreasing trend, and landscape stability was improved in the study area. There were obvious differences in the disturbance indices of different landscape types, with grassland and bare land having the highest values. Ecological risk in the study area is heterogeneous, with an overall low ecological risk and a shift to a lower risk level, and a decreasing trend in ecological risk, which is positively correlated spatially and mainly manifested as a “low-low” aggregation. Global warming and unreasonable human activities have exacerbated the ecological degradation of Qilian Mountain National Park, but a series of ecological restoration strategies after the establishment of the national park have gradually improved the regional ecological environment.
1 Introduction
Ecological risk refers to the potential negative impacts on ecosystem structure, function and stability resulting from external natural and anthropogenic activities, either in the present or future (Depietri, 2019; Zhang et al., 2020, 2023). Over the past few decades, ecosystem structure and function have experienced strong changes in response to global environmental change and intensified human activities, and ecological risks to various ecosystems have continued to increase (Wang et al., 2020; Xie et al., 2020). Landscape ecological risk, as an important part of ecological risk, is based on landscape ecology to construct the link between landscape patterns and ecological processes. Different from the traditional ecological assessment, landscape ecological risk assessment focuses more on the spatial and temporal heterogeneity of risk and scale effects (Han et al., 2022; Zhang et al., 2023). And it also provides a comprehensive characterization, dynamic patterns and spatial visualization of multisource risks (Suter et al., 2003; Peng et al., 2015; Wang et al., 2020).
In terms of previous research on landscape ecological risk assessment, there are both regions affected by climate change and human activities, such as administrative regions, coastal cities, and mining areas, as well as more environmentally fragile areas such as highlands, wetlands, and nature reserves (Mikhailov et al., 2015; Ersayin and Tagil, 2017; Lin et al., 2019; Zhang et al., 2020). Currently, landscape pattern index and source-sink risk are the methods for landscape ecological risk assessment, among which the method based on land-use and landscape indices is the most widely used (Ayre and Landis, 2012; Peng et al., 2015; Li et al., 2017; Wang et al., 2020). For example, Zhang et al. (2020) analyzed the temporal and spatial characteristics of landscape ecological risk during the urbanization process and discussed the regularities of landscape ecological risk changes in 48 coastal cities in China using ecological risk assessment based on land use data (Zhang et al., 2020). Wang et al. (2020) quantitatively assessed the landscape ecological risk of the Koshi River Basin using landscape type data and the landscape ecological risk model, and analyzed the temporal–spatial evolution characteristics of landscape ecological risk for the study period and for over different elevation and slope intervals, then explored the spatial clustering characteristics of landscape ecological risk using spatial autocorrelation analysis (Wang et al., 2020). Qi (2019) developed an evaluation index system to quantitatively assess the ecological risk by employing landscape pattern indices and investigated the evolutionary characteristics and patterns of ecological risk in various periods. However, this research failed to examine the variations of ecological risks among different landscape patterns and regions (Qi, 2019).
The Qilian Mountain National Park, as one of the 10 pilot national parks in China, is an important water source and biodiversity conservation priority area in Northwest China, and an important ecological barrier in the Silk Road Economic Belt. This region plays an important role in maintaining the ecological balance, guaranteeing runoff replenishment, and sustaining the sustainable development of the region (Shan et al., 2023). However, the ecological environment in some areas of the Qilian Mountain has deteriorated and ecological risks have increased under the influence of a variety of factors such as global climate change, overloaded grazing, man-made destruction, insufficient means of protection, etc. (Liu et al., 2023; Ma et al., 2023). The solution of the eco-environmental problems of Qilian Mountain is of great significance to the sustainable socio-economic development of the Hexi Corridor in the Northwest China, and to the regional or national ecological security (Li et al., 2021). Therefore, many scholars have carried out in-depth research on the ecological and environmental problems of Qilian Mountain National Park. Liu et al. (2023) found that the risk of desertification in Qilian Mountain National Park experienced three distinct phases from 2000 to 2020, characterized by a decline, an increase, and another decline. The primary cause of the increased risk of desertification in the region is the pressure-driven effect brought about by climate change and natural disasters (Liu et al., 2023). Ma et al. (2023) found that the NDVI of Qilian Mountain National Park showed an increasing trend over time from 2000 to 2020. However, gradual development in the study area was highlighted by anthropogenic disturbances and local development of related economies at the cost of ecological damage from 2010 to 2020 (Ma et al., 2023). Shan et al. (2023) found that the ecological carrying capacity of Qilian Mountain National Park decreased from 2000 to 2014 due to the destruction of ecological environment (Shan et al., 2023). Despite many studies have been reported on the ecological environment of the Qilian Mountain, there has been limited research on the spatial and temporal evolution of landscape ecological risk features.
In light of the current national development policy emphasizing the importance of “Lucid waters and lush mountains are invaluable assets,” there is significant theoretical significance in assessing the spatial and temporal heterogeneity as well as the evolutionary trends of ecological risks within the Qilian Mountain National Park. Therefore, this research aims to analyze the landscape ecological risk within the Qilian Mountain National Park by constructing an Ecological Risk Index (ERI) based on the landscape pattern indices (landscape fragmentation and disturbance indices) from 1995 to 2020 and reveal the temporal and spatial patterns of landscape ecological risk within the Qilian Mountain National Park. This study will provide scientific reference for the ecological protection and restoration of Qilian Mountain National Park.
2 Materials and methods
2.1 Study area
The Qilian Mountain National Park is located at the borders of Gansu and Qinghai provinces in China, on the northeastern edge of the Tibetan Plateau (93.51–103.90°E, 35.83–39.98°N), presenting one of the initial pilot regions established within the national park system of the country. With an average elevation surpassing 4,000 m, the area exemplifies the distinctive geological structure of the Kalidong graben within the Kunlun-Qinling geosyncline, belonging to the typical semi-arid alpine continental climate (Liu et al., 2023). The multi-year average annual precipitation in the study area ranges from 96.15 to 728.46 mm, with a spatial distribution trend gradually decreasing from east to west. The annual average temperature changes significantly with altitude, ranging from −14.97°C to 6.48°C, with the low-altitude areas being much warmer than the high-altitude areas. Additionally, the total solar radiation in the study area exceeds 5,000 MJ/m2. Due to strong vertical zonation and topographic relief, this region showcases a rich variety of ecosystems, including forests, grasslands, glaciers, and other natural landscapes (Figure 1).
2.2 Data sources
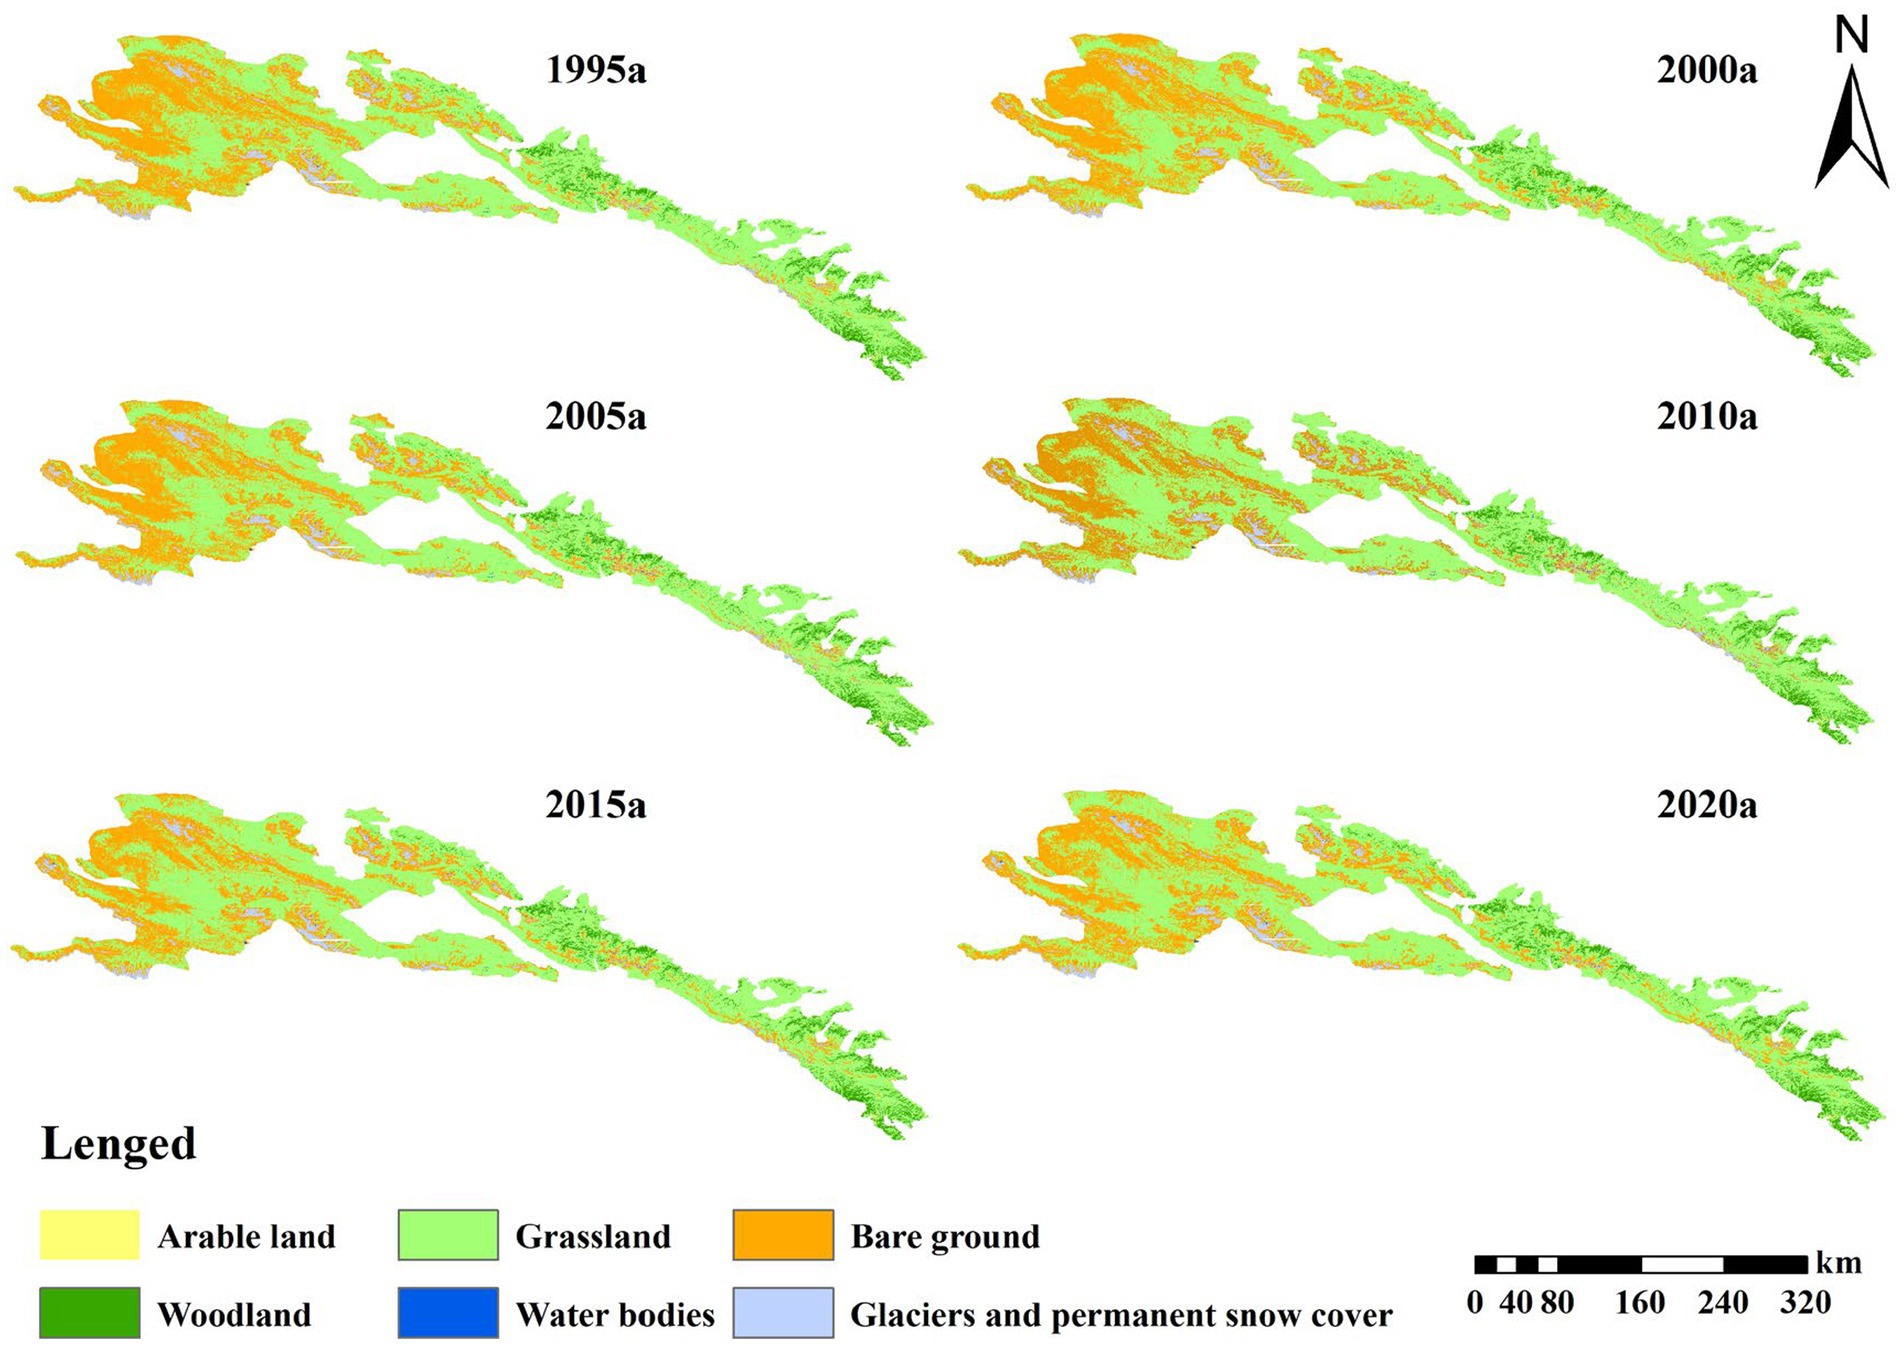
The land use data utilized in this research is derived from the annual China Land Cover Dataset (CLCD), which presents the first Landsat-based dataset developed by scholars at Wuhan University using Google Earth Engine (GEE) platform (Yang and Huang, 2021). The dataset possesses aspatial resolution 30 m. One advantage of this dataset is its continuous land use classification results spanning 30 years, updated until 2020, providing a high temporal resolution. In this research, the land use data at a spatial resolution of 30 m for six periods (i.e., 1995, 2000, 2005, 2010, 2015, and 2020) were selected. The land use types within the study area were extracted based on the boundary mask of the Qilian Mountain National Park. The land use types include arable land, forest, shrubland, grassland, water bodies, glaciers and permanent snow cover, bare ground, impervious surfaces, and wet-lands. Based on actual conditions of the Qilian Mountain National Park and the classification methods employed, the land use types within the study area were reclassified into six landscape elements: woodland, grassland, bare ground, arable land, water bodies, glaciers and permanent snow cover (Figure 1).
2.3 Methods
2.3.1 Segmentation of ecological risk regions
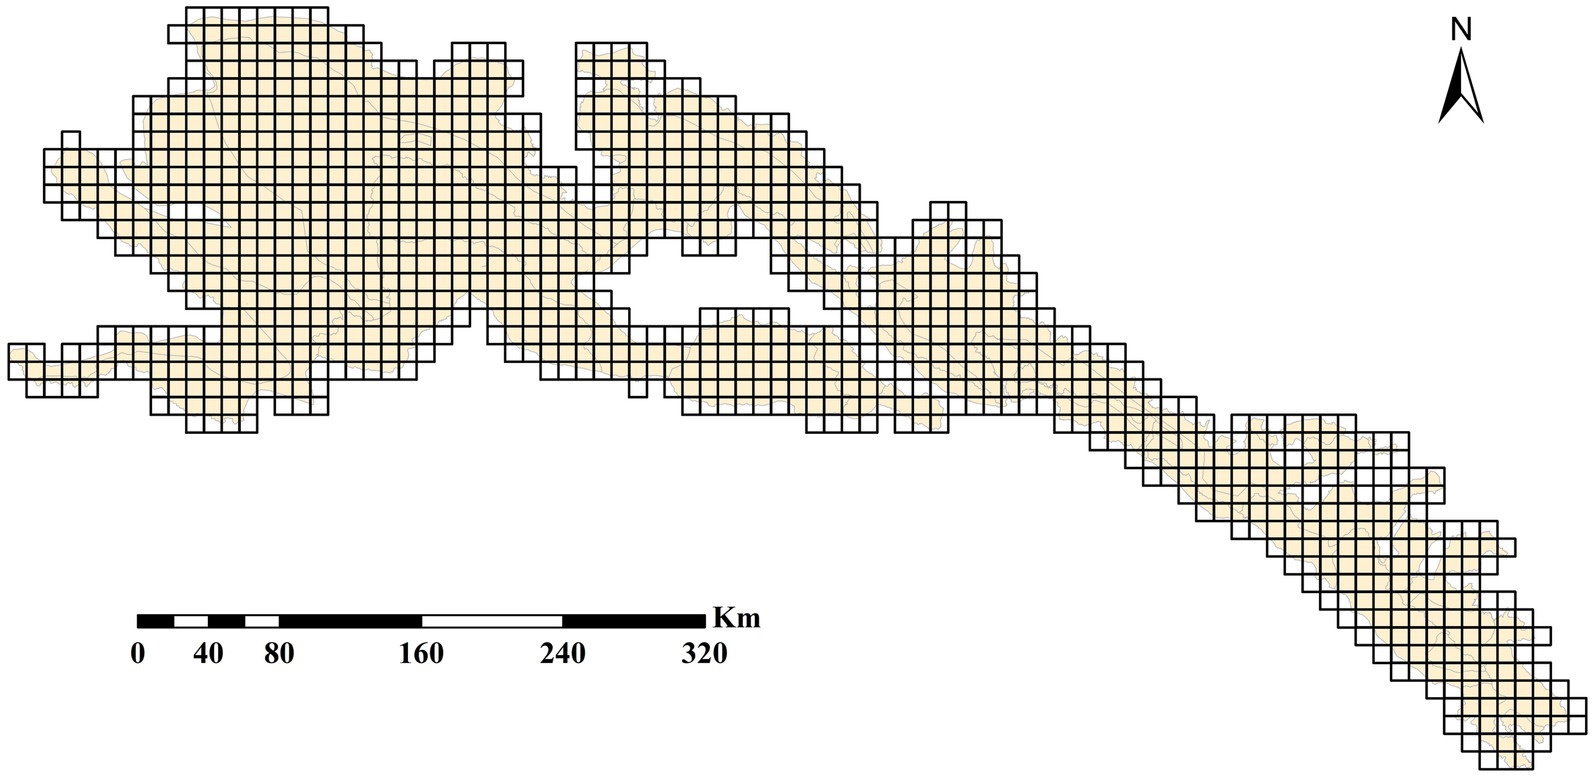
To investigate the regional heterogeneity of landscape ecological risk within the Qilian Mountain National Park, the study area needs to be divided into several ecological risk plots, each plots were calculated by landscape pattern index and ecological risk index. The size of ecological risk plots is usually determined according to the actual situation of the study area or by using the standard of 2–5 times of the average patch area of the landscape (Bartolo et al., 2012; Cui et al., 2018; Zhang et al., 2018). In this study, we divided the study area into 1,106 ecological risk plots, each of which is 10 km × 10 km, as shown in Figure 2.
2.3.2 Landscape pattern indices
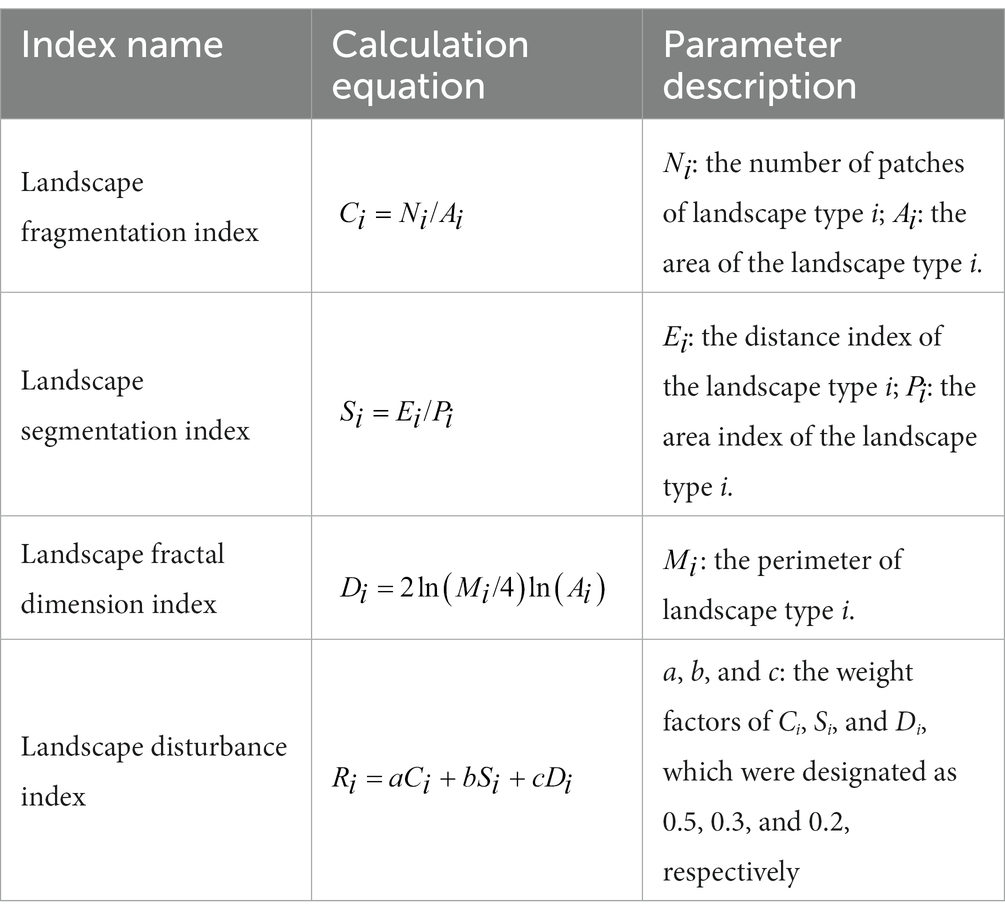
Landscape pattern indices serve as quantitative measures that integrate information on landscape structure and spatial characteristics, providing valuable insights into the features of landscape patterns (Gong et al., 2015; Fan et al., 2016; Corsi et al., 2020). These indices play a crucial role in understanding the stability, fragmentation, and heterogeneity of landscapes. At the patch level, metrics such as patch density and patch number are adopted to assess the landscape heterogeneity, providing an indication of the variety of patches within the landscape. The landscape segmentation index measures the degree of patch separation, indicating the level of isolation among patches. Fragmentation, which encompasses the spatial complexity and fragmentation of the landscape structure, is often characterized by combining patch number and segmentation index (Xie et al., 2013). The landscape fractal dimension index is applied to quantify the patch complexity of patch shape based on their perimeter and area dimensions, offering insights into the naturalness or irregularity of patch shapes within the landscape. The landscape disturbance is a fundamental concept in landscape ecology and captures the various risks posed by diverse sources of disturbance to ecological landscapes. In this research, the landscape disturbance index was calculated by incorporating the landscape fragmentation index, landscape segmentation index, and landscape fractal dimension index (Table 1).
2.3.3 Construction of landscape ERI
The landscape ERI was formulated to assess the ecological risk based on by leveraging the landscape pattern indices, which capture the variations in landscape structure within the selected study area. The landscape ERI is calculated using the following equation:
where, ERI is the ecological risk index for the sampling area, i is landscape type, Ai is the area of landscape type i in the n sample area, A is the total area of sample n, Ri is the landscape disturbance index of type i.
2.3.4 Spatial autocorrelation analysis
Spatial autocorrelation analysis is undertaken to examine the significant relationships between attribute values of a specific feature and those of neighboring features in space to the objective of such analysis is to uncover the spatial correlation patterns of attribute characteristics between spatial reference units and their adjacent units. It encompasses two key indicators: global spatial autocorrelation index and local spatial autocorrelation index (Bosso et al., 2017; Wang et al., 2020; Zhang et al., 2020). The former is commonly quantified using the Moran’s I, which enables the assessment of the spatial correlation of ecological risk across the entire study area. The value of Moran’s I is between −1 and 1, with a positive value indicating a positive spatial correlation. As the value of Moran’s I increases, the spatial correlation becomes more significant, providing valuable insights into the overall spatial pattern of ecological risk (Zhang et al., 2020). The latter, on the other hand, is visualized through the Local Indicators of Spatial Association (LISA) maps, thus depicting whether attribute values exhibit distinct patterns of high-high clustering and low-low clustering within the local areas.
3 Results
3.1 Changes in land use
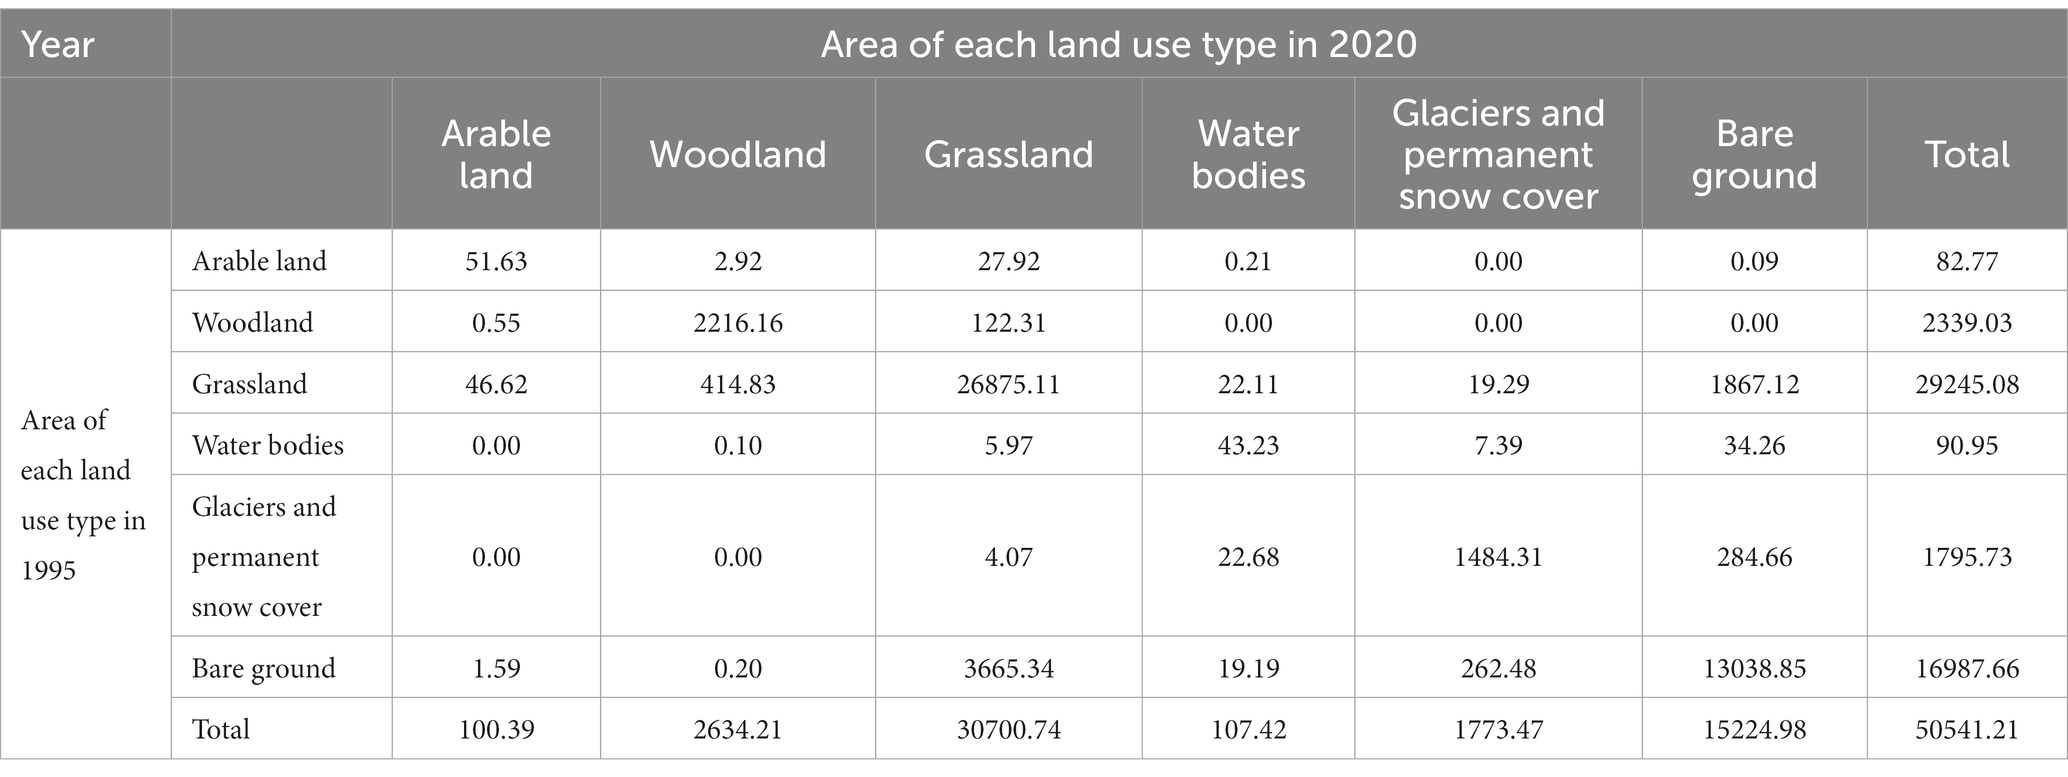
Through the analysis of land use types and areas for the six study periods, several observations can be made. Firstly, woodland is primarily concentrated in the central and eastern parts of the study area, bare land is predominantly located in the western region. The glaciers and permanent snow cover is mainly distributed in the high mountain areas of the western and southeastern regions. Water bodies occupy a relatively small area and are predominantly situated beneath mountains covered with ice and snow. Cultivated land is scattered and occupies a smaller area, primarily distributed in the marginal areas in the eastern and northern regions (Figure 3). Upon examining the land use transition matrix spanning from 1995 to 2020 (Table 2), notable observations could be made regarding the substantial increase in areas of grassland and woodland over the years, grassland has been converted mainly from bare ground, and woodland has been converted mainly from grassland. There has been a significant reduction in the area of bare ground, which has been converted mainly to grassland. Glacier and permanent snow cover has also decreased, mainly converting to bare ground. The areas of land use types transferred out in descending order was as follows: bare land, grassland, glaciers and permanent snow cover, forests, water bodies, and cultivated land. Conversely, that of land use transferred in was as follows: grassland, bare land, forests, glaciers and permanent snow cover, water bodies, and cultivated land. In this transformation process, there is a significant exchange of land use between bare ground and grassland, with a clear mutual conversion trend. The area of bare ground resulting from the conversion of ice and snow landscapes and grasslands in 2020 accounted for the highest proportion.
3.2 Analysis of landscape pattern index changes
The landscape pattern index for different land cover types in the Qilian Mountain National Park in 1995, 2000, 2005, 2010, 2015, and 2020 were calculated using Fragstats 4.2 software. Table 3 reveals noteworthy patters regarding the patch number and fragmentation of different land types. Arable land initially experienced a decrease in patch number and fragmentation, followed by an increase, although the subsequent increase in fragmentation was not significant, indicating an overall reduction in fragmentation. Conversely, forests, grasslands, water bodies, glaciers and permanent snow cover, and bare land exhibited fluctuations in patch number and fragmentation with periods of decrease, increase, and subsequent decrease. However, the overall trend indicates a decrease in the level of fragmentation.
It is evident that the disturbance index displays an overall decreasing trend. Significant differences in disturbance levels are observed among different landscape types within the study area, with grassland and bare land exhibiting the highest disturbance indices. When comparing the disturbance indices with those of the previous year, slight increases in disturbance are noticeable for cultivated land and grassland in 2015, for forests and glaciers and permanent snow cover in 2005 and 2010, for water bodies in 2005, and for bare land in 2010. These findings suggest a slight increase in external disturbances to various ecological landscapes during those specific years. Landscape fractal dimension index fluctuated across different years, but the overall trend showed a decrease, indicating a reduction in the complexity of patch shapes.
In summary, from 1995 to 2020, the patch number, fragmentation, and disturbance indices for different landscape patterns in the study area exhibited an overall decreasing trend. This indicates a reduction in landscape fragmentation and complexity of patch shapes, resulting in increased resistance to disturbances and enhanced landscape stability.
3.3 Analysis of changes in landscape ecological risk
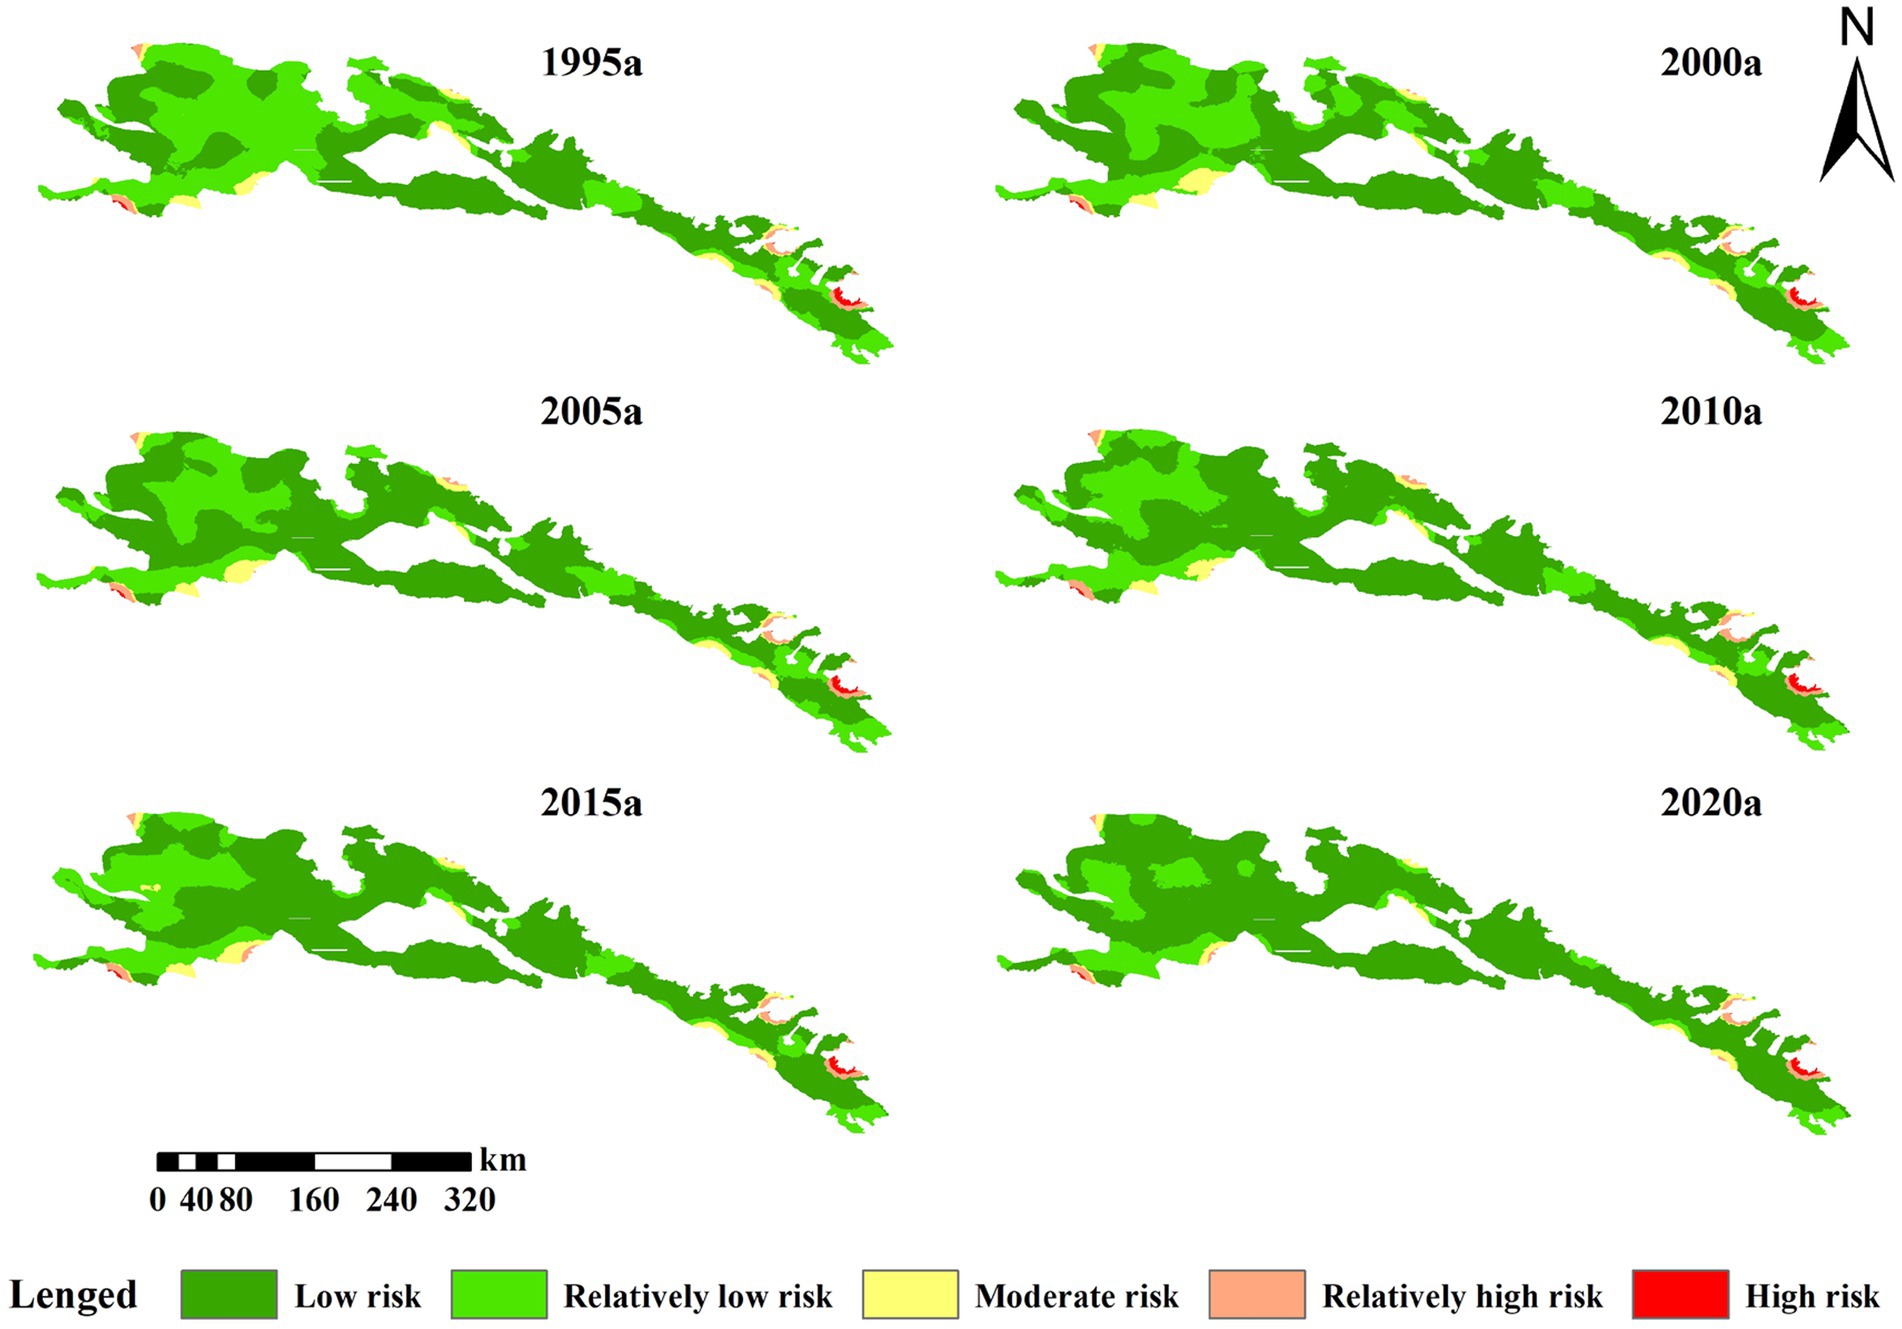
The study area was classified into low risk (ERI < 0.01), relatively low risk (ERI = 0.01–0.02), moderate risk (ERI = 0.02–0.04), relatively high risk (ERI = 0.04–0.08), and high risk (ERI > 0.08), using the natural break method and the landscape ERI (calculated from Equation 1). This classification allowed for the generation of an ecological risk level map and facilitated the assessment of changes in the area for each risk level.
With Figure 4 and Table 4, it becomes apparent that the study area is predominantly characterized by low risk, which are extensively distributed and exhibit a substantial annual increase in area. Notably, an expansion of low risk can be observed in the central and western regions of the study area in 2000 and 2010. Furthermore, from 2015 to 2020, a significant transfer from relatively low risk to low risk occurred on a large scale in the western region.
Relatively low risk zones also have a broad distribution, primarily concentrated in the western region. However, a gradual decrease was observed in the area of relatively low risk zones over the years, as revealed in Table 4. The transfer from relatively low risk to low risk zones has occurred gradually, with the most significant transfer taking place between 1995 and 2000 and between 2015 and 2020. The southern glaciers and permanent snow cover regions, bare land areas, and the northern border areas characterized by bare land, arable land, and forests are predominantly occupied by moderate risk zones. An increase in the area of moderate risk zones was observed in 2000, with notable growth in the southwestern region (Figure 4). The southeastern region experienced a transfer from moderate to relatively high risk. From 2005 to 2010, the area of moderate risk decreased in the southwestern region but increased in the northern region, transferring to relatively high risk. Areas characterized by high and relatively high ecological risks occupy a smaller area and are primarily located in the southwestern edge regions with glaciers and permanent snow cover and the forested regions in the eastern regions. The relatively high risk area experienced a great increase in area in 2010 (Figure 4). Nevertheless, the expansion of relatively high risk zones was effectively controlled in 2015 and 2020, resulting in a reduction in area. The area of high-risk zones fluctuated in different years but remained relatively stable overall.
Combining the aforementioned analysis with Table 5, it can be observed that from 1995 to 2020, the area of low-risk zones significantly increased, while the areas of other risk levels decreased. This overall trend indicates a transfer toward lower risk levels, with the most notable transition observed from relatively low-risk to low-risk zones. In conclusion, the ecological risk within the study area exhibited a consistent and significant decrease over time.
3.4 Spatial autocorrelation analysis
3.4.1 Global spatial autocorrelation analysis
The values of Moran’s I values were calculated using the GeoDa software to analyze the spatial distribution of landscape ecological risk from 1995 to 2020, as depicted in Figure 5. The Moran’s I provides insights into the average spatial clustering of similar ecological risk attributes within the study area. The figure reveals that the values of Moran’s I for all six periods were positive but relatively small, indicating the presence of spatial positive correlation, although not statistically significant. This suggests that areas with similar ecological risk levels tend to exhibit spatial clustering. Overall, the values of Moran’s I displayed a decreasing trend from 1995 to 2020, with a slight increase in 2015 but with minimal variation. This indicates a decrease in the spatial clustering of ecological risk within the study area. Notable, the most substantial decrease in the values of Moran’s I was found between 2015 and 2020.
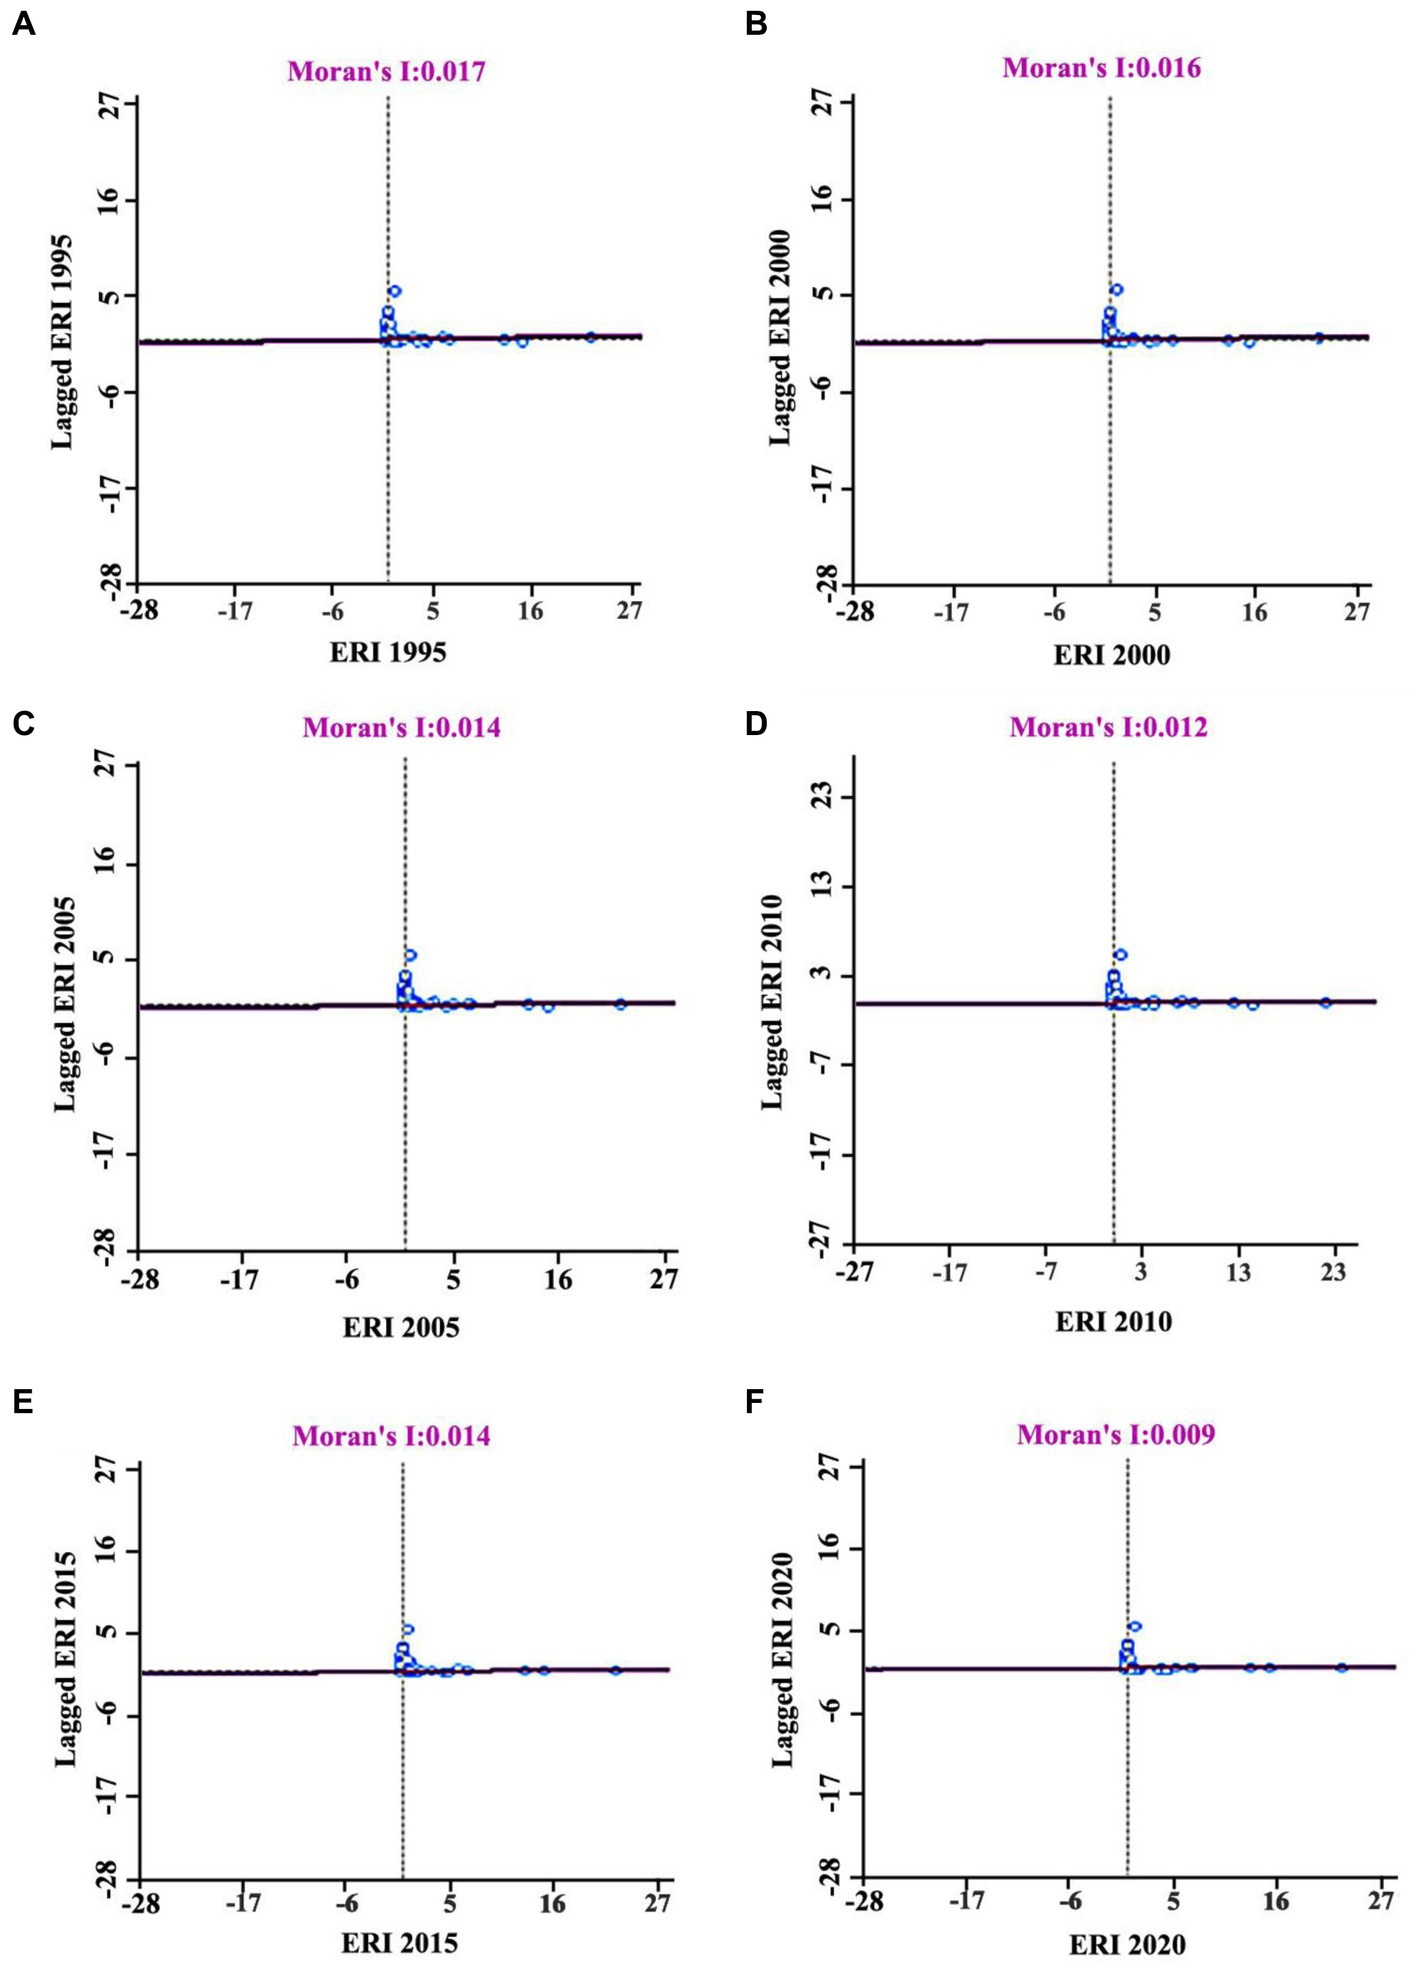
Figure 5. (A–F) Scatterplots of the Moran’s I of the Ecological Risk Index(ERI) in Qilian Mountain National Park from 1995 to 2020.
3.4.2 Local spatial autocorrelation analysis
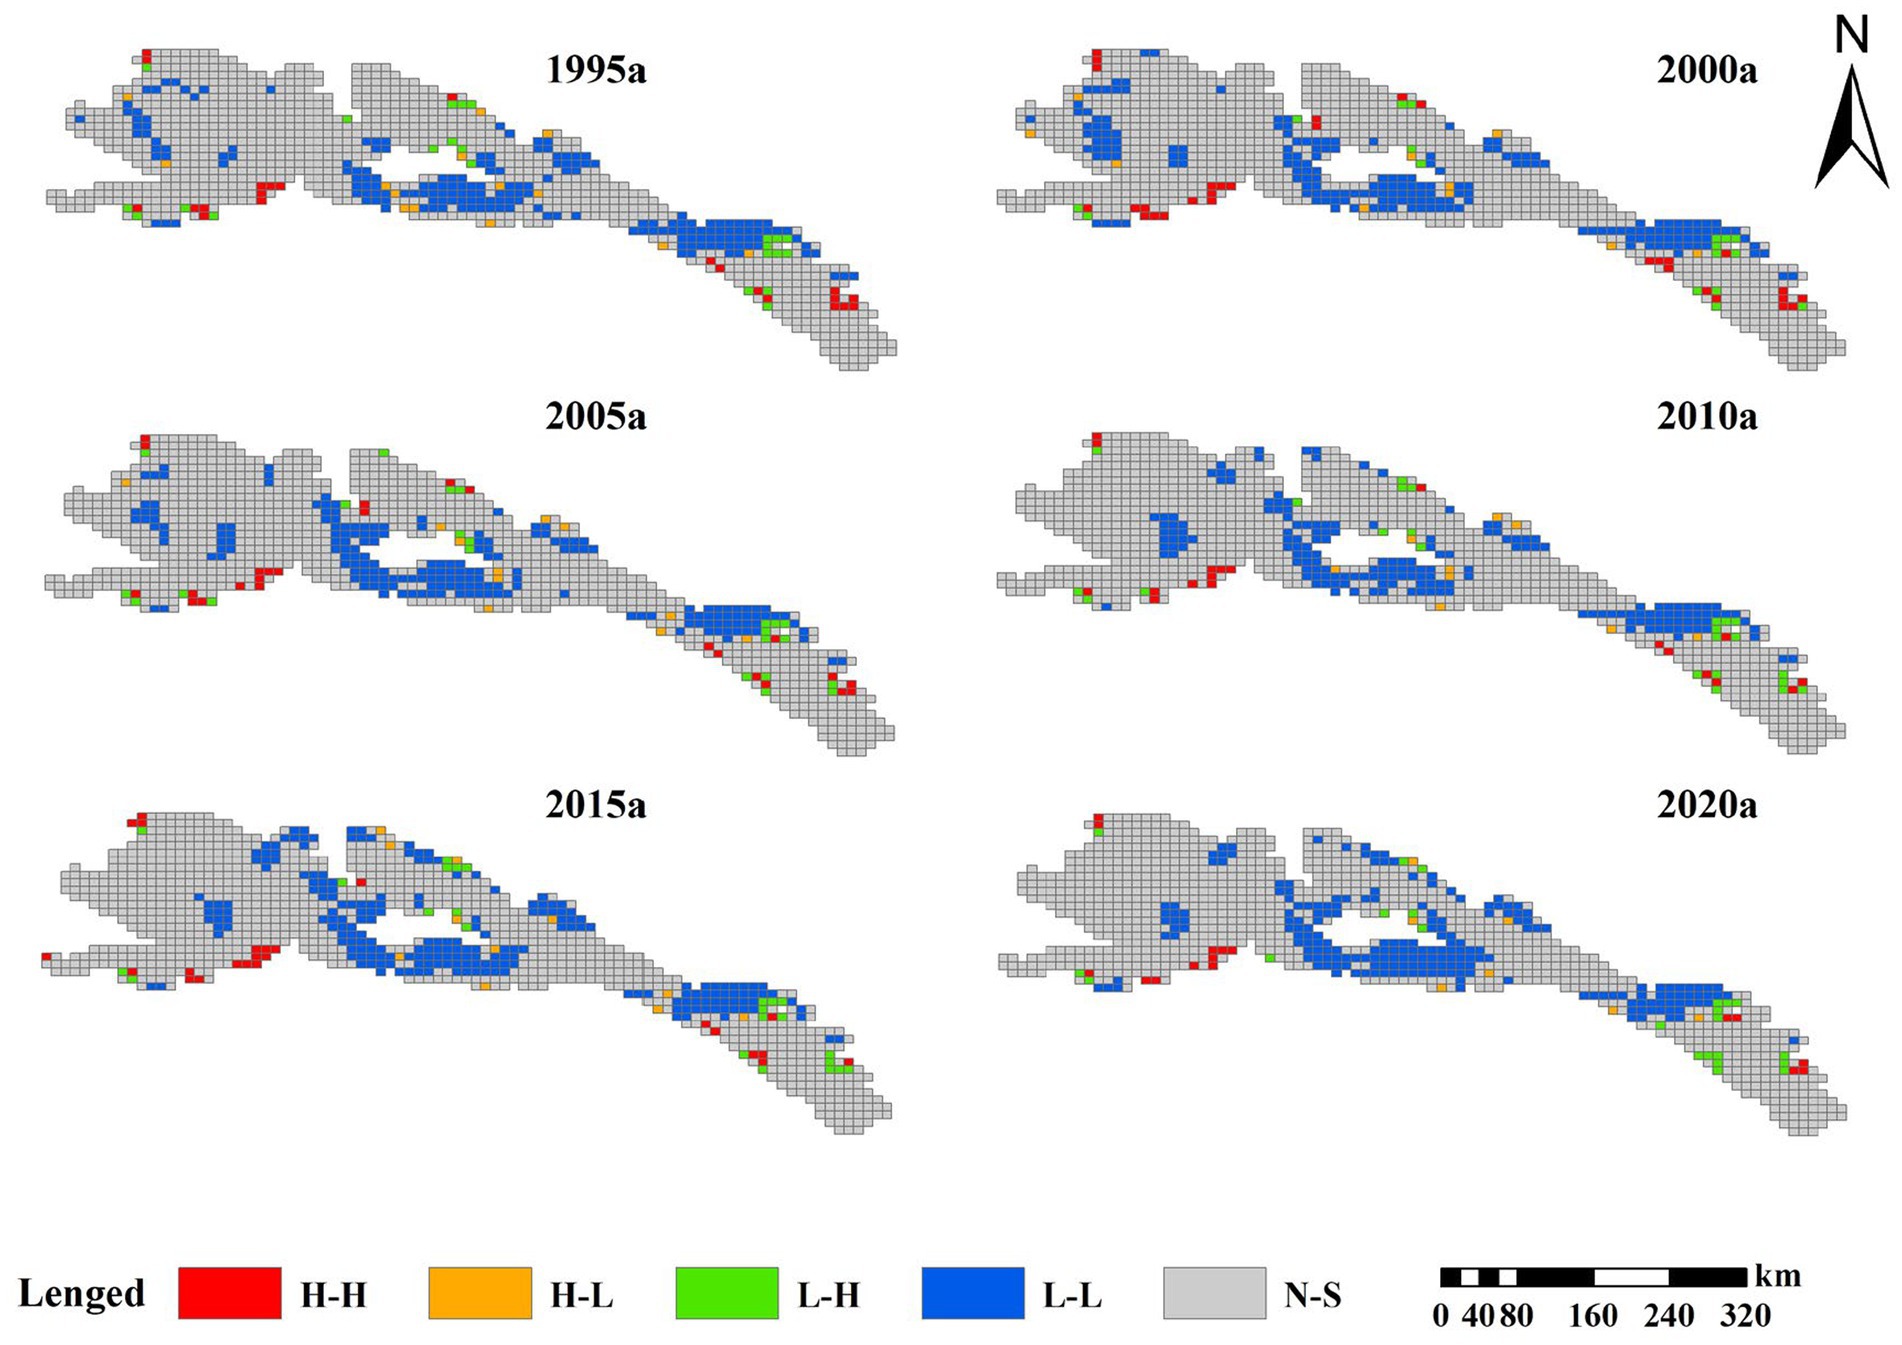
Local spatial autocorrelation analysis was performed using GeoDa software to generate LISA maps with a significance level of 0.05 for each period, as depicted in Figure 6. These LISA maps illustrate the spatial clustering patterns of ecological risk within the study area. Meanwhile, the Figure 6 reveals that the “high-high” clusters primarily appeared in the peripheral areas and regions characterized by elevated ecological risk. The number of clustering areas generally decreased over time, with exceptions observed in 2000 and 2015. Moreover, in 2020, the “high-high” clusters disappeared from the upper portion of the study area. Throughout the period spanning from 1995 to 2020, the study area mainly featured “low-low” clusters, indicating that areas with low ecological risk were surrounded by neighboring areas exhibiting similarly low ecological risk levels. Furthermore, in 2000, there was a notable increase in “low-low” clusters in the western and central regions. However, in 2005 and 2010, the number of “low-low” clusters decreased in the western region but increased in the central region. Nevertheless, the overall number of “low-low” clusters exhibited a decreasing trend but increased slightingly in 2015 and 2020, which was mainly concentrated in the central region. Considering the land use types and corresponding risk levels, it becomes apparent that the “low-low” cluster structure was primarily observed in grassland areas characterized by low ecological risk. Such observation indicates a higher level of internal landscape stability within these regions. Conversely, the “high-high” cluster structure was predominantly found in forested areas, water bodies, and glaciers and permanent snow cover, which were associated with medium to high ecological risk. This suggests lower internal landscape stability within these areas.
4 Discussion
The growing attention to the ecological environment by the government has led to increased research interest in landscape ecological risk within the academic community. Investigating landscape ecological risk allows for the evaluation and analysis of ecological risk heterogeneity from both temporal and spatial perspectives, providing valuable data for ecological conservation endeavors. The variations of Land use type reflect the regional environmental changes and directly affect ecosystem health (Cantarello et al., 2011). The study area is dominated by grassland and bare land, which are also the two land use types that have changed most significantly in the last 20 years. The expansion of grassland and woodland could be attributed to various ecological projects implemented by the government, such as the “Natural Forest Protection Project,” the “Return of Cultivated Land to Forests,” and the “Three North Protection Forest Project” (Mu et al., 2022; Liu et al., 2023; Xue et al., 2023). In addition, a series of ecological restoration policies after the establishment of the National Park Reserve in 2017, including land restoration in mining areas and the conversion of cultivated land back to forests and grasslands, have resulted in a significant transfer from bare land to grassland. Global warming has caused the melting of glaciers and permanent snow at altitudes above 4,000 m, and has also directly transformed glacial snow-covered areas into bare ground (Xiao et al., 2021; Liu et al., 2023). Meanwhile, 1867.12 km2 of grassland has been transformed into bare ground due to human unreasonable development and utilization, over-grazing and other factors (Peng et al., 2022).
Landscape fragmentation index, landscape fractal dimension index and landscape disturbance index in the study area showed a decreasing trend, increased disturbance resistance, significant improvement in landscape stability, gradual decrease in ecological risk, and high spatial similarity. From 1995 to 2015, the landscape pattern and ecological risk of the Qilian Mountain fluctuated mainly due to the climate warming, frequent occurrence of extreme weather events, and severe impacts of human activities such as mining and indiscriminate logging. Since the establishment of the Qilian Mountain National Park, significant grassland degradation due to the proliferation of wild animals in the region, and the population explosion of herbivorous animals, such as wild deer and rock sheep (Liu et al., 2023). However, a series of ecological protection and restoration measures have had a positive impact on mitigating and controlling ecological damage. As a result, the ecological risk level of the study area has been significantly reduced and the ecological environment has gradually gotten better during the period of 2015–2020. Yu et al. (2022) found that the landscape fragmentation index of woodland in Qilian Mountain increased significantly, and ecological risk increased due to indiscriminate logging, unorganized mining, etc. (Yu et al., 2022). The reason for the difference with the results of this study may be the inconsistency between the land use type classification standard and the ecological risk level classification standard. Meanwhile, the study period of Yu et al. (2022) is 2000–2018, Qilian Mountain National Park has just been established, and the effect produced by ecological measures has not yet appeared.
Although the ecological risk in the study area is dominated by low ecological risk zones, the area of the moderate risk zones has been significantly reduced in 2020. Some areas in the southern and northern regions have already transitioned to relatively low risk. The ecology of the study area is moving in a good direction, but which is still fragile, as found by Liu et al. (2023), the study area experienced the highest risk of desertification during the period of 2015–2020 (Liu et al., 2023), due to the rapid conversion of the snow/ice area to barren due to increased temperatures, and the risk of soil erosion in grassland areas with high topographic relief was exacerbated due to the increased erosive power of rainfall in the context of warming and humidification (Du et al., 2022; Zhang et al., 2022). In the future, Qilian Mountain National Park should be in line with the principle of appropriate to herd animals and forests, respect the self-repair of nature and so on, to strengthen ecological education, rodent and pest management, and rotational grazing. Comprehensive planning and integrated management of the Qilian Mountain National Park, and do our best to harmonize development with the natural environment.
5 Conclusion
Based on the analysis of land use data and the calculation of ERI using landscape pattern indices, the ecological risk in the Qilian Mountain National Park from 1995 to 2020 was analyzed and visualized. The main findings are as follows:
1. From 1995 to 2020, the study area was primarily characterized by grassland and bare land as the dominant land use types. Ecological engineering and a series of ecological restoration policies after the establishment of the National Park Reserve have resulted in a massive shift from bare land to grassland. However, as a result of global warming, glaciers and permanent snowpack continue to melt into bare land.
2. The landscape fragmentation and disturbance indices exhibited different patterns in different years, but the overall trend was decreasing from 1995 to 2020. This indicates an improvement in landscape stability in the study area. Among the different landscape types, grassland and bare land exhibited the highest disturbance indices.
3. The landscape ecological risk of Qilian Mountain National Park shows a decreasing trend, and the study area is primarily characterized by low ecological risk, while the high-risk areas are relatively small in proportion and mainly distributed in the eastern edge regions. Although the areas of moderate risk, relatively high risk, and high risk fluctuated from 1995 to 2000, effective ecological restoration and protection measures have led to a reduction in their areas and a continued expansion in the area occupied by low ecological risk zones by 2020. Meanwhile, there is a positive spatial correlation of ecological risk in the study area, and the landscape ecological risk mainly shows a “low-low” clustering structure.
Data availability statement
The raw data supporting the conclusions of this article will be made available by the authors, without undue reservation.
Author contributions
YL: Writing – original draft. QQ: Conceptualization, Writing – review & editing. DW: Data curation, Writing – review & editing. WA: Formal analysis, Writing – review & editing. XH: Conceptualization, Writing – review & editing. TY: Data curation, Writing – review & editing.
Funding
The author(s) declare financial support was received for the research, authorship, and/or publication of this article. This research was funded by National Natural Science Foundation of China (Youth Fund Project 41901009), Science and Technology Project of Gansu Forestry and Grassland Bureau (2019KJ0034), and Inner Mongolia Natural Science Youth Fund Project (2023QN04014).
Conflict of interest
The authors declare that the research was conducted in the absence of any commercial or financial relationships that could be construed as a potential conflict of interest.
Publisher’s note
All claims expressed in this article are solely those of the authors and do not necessarily represent those of their affiliated organizations, or those of the publisher, the editors and the reviewers. Any product that may be evaluated in this article, or claim that may be made by its manufacturer, is not guaranteed or endorsed by the publisher.
References
Ayre, K. K., and Landis, W. G. (2012). A Bayesian approach to landscape ecological risk assessment applied to the upper Grande ronde watershed, Oregon. Hum. Ecol. Risk Assess. Int. J. 18, 946–970. doi: 10.1080/10807039.2012.707925
Bartolo, R. E., van Dam, R. A., and Bayliss, P. (2012). Regional ecological risk assessment for Australia's tropical rivers: application of the relative risk model. Hum. Ecol. Risk Assess. Int. J. 18, 16–46. doi: 10.1080/10807039.2012.631467
Bosso, L., De Conno, C., and Russo, D. (2017). Modelling the risk posed by the Zebra mussel Dreissena polymorpha: Italy as a case study. Environ. Manag. 60, 304–313. doi: 10.1007/s00267-017-0882-8
Cantarello, E., Newton, A. C., and Hill, R. A. (2011). Potential effects of future land-use change on regional carbon stocks in the UK. Environ. Sci. Pol. 14, 40–52. doi: 10.1016/j.envsci.2010.10.001
Corsi, I., Bergami, E., and Grassi, G. (2020). Behavior and bio-interactions of anthropogenic particles in marine environment for a more realistic ecological risk assessment. Front. Environ. Sci. 8:60. doi: 10.3389/fenvs.2020.00060
Cui, L., Zhao, Y. H., Liu, J. C., Han, L., Ao, Y., and Yin, S. (2018). Landscape ecological risk assessment in Qinling Mountain. Geol. J. 53, 342–351. doi: 10.1002/gj.3115
Depietri, Y. (2019). The social–ecological dimension of vulnerability and risk to natural hazards. Sustain. Sci. 15, 587–604. doi: 10.1007/s11625-019-00710-y
Du, Q., Sun, Y., Guan, Q., Pan, N., Wang, Q., Ma, Y., et al. (2022). Vulnerability of grassland ecosystems to climate change in the Qilian Mountains, Northwest China. J. Hydrol. 612:128305. doi: 10.1016/j.jhydrol.2022.128305
Ersayin, K., and Tagil, S. (2017). Ecological sensitivity and risk assessment in the Kizilirmak Delta. Fresenius Environ. Bull. 26, 6508–6516.
Fan, J. H., Wang, Y., Zhou, Z., You, N. S., and Meng, J. J. (2016). Dynamic ecological risk assessment and management of land use in the middle reaches of the Heihe River based on landscape patterns and spatial statistics. Sustainability. 8:536. doi: 10.3390/su8060536
Gong, J., Yang, J. X., and Tang, W. W. (2015). Spatially explicit landscape-level ecological risks induced by land use and land cover change in a National Ecologically Representative Region in China. Int. J. Environ. Res. Public Health 12, 14192–14215. doi: 10.3390/ijerph121114192
Han, N., Yu, M., and Jia, P. (2022). Multi-scenario landscape ecological risk simulation for sustainable development goals: a case study on the central mountainous area of Hainan Island. Int. J. Environ. Res. Public Health 19:4030. doi: 10.3390/ijerph19074030
Li, W. F., Cao, Q. W., Lang, K., and Wu, J. S. (2017). Linking potential heat source and sink to urban Heat Island: heterogeneous effects of landscape pattern on land surface temperature. Sci. Total Environ. 586, 457–465. doi: 10.1016/j.scitotenv.2017.01.191
Li, Z. X., Qi, F., Li, Z. J., Wang, X. F., Juan, G., Zhang, B. J., et al. (2021). Reversing conflict between humans and the environment – the experience in the Qilian Mountains. Renew. Sustain. Energy Rev. 148:111333. doi: 10.1016/j.rser.2021.111333
Lin, Y. Y., Hu, X. S., Zheng, X. X., Hou, X. Y., Zhang, Z. X., Zhou, X. N., et al. (2019). Spatial variations in the relationships between road network and landscape ecological risks in the highest forest coverage region of China. Ecol. Indic. 96, 392–403. doi: 10.1016/j.ecolind.2018.09.016
Liu, Z., Si, J., Deng, Y., Jia, B., Li, X., He, X., et al. (2023). Assessment of land desertification and its drivers in semi-arid alpine mountains: a case study of the Qilian Mountains Region, Northwest China. Remote Sens. 15:3836. doi: 10.3390/rs15153836
Ma, L. B., Zhu, Z. H., Li, S. X., and Li, J. Y. (2023). Analysis of spatial and temporal changes in human interference in important ecological function areas in China: the Gansu section of Qilian Mountains National Park as an example. Environ. Monit. Assess. 195:1029. doi: 10.1007/s10661-023-11633-8
Mikhailov, V. G., Koryakov, A. G., and Mikhailov, G. S. (2015). Ecological risk management in coal mining and processing. J. Min. Sci. 51, 930–936. doi: 10.1134/S1062739115050101
Mu, H., Li, X., Ma, H., Du, X., Huang, J., Su, W., et al. (2022). Evaluation of the policy-driven ecological network in the three-north shelterbelt region of China. Landsc. Urban Plan. 218:104305. doi: 10.1016/j.landurbplan.2021.104305
Peng, J., Dang, W., Liu, Y., Zong, M., and Hu, X. (2015). Review on landscape ecological risk assessment. Acta Geograph. Sin. 70, 664–677. doi: 10.11821/dlxb201504013
Peng, Q., Wang, R., Jiang, Y., Zhang, W., Liu, C., and Zhou, L. (2022). Soil erosion in Qilian Mountains National Park: dynamics and driving mechanisms. J. Hydrol. Reg. Stud. 42:101144. doi: 10.1016/j.ejrh.2022.101144
Qi, R. B. (2019). Quantitative assessment of ecological risk based on landscape pattern index. Bull. Surv. Mapp. S1, 110–112. doi: 10.13474/j.cnki.11-2246.2019.0524
Shan, S. Y., Xu, H. J., Qi, X. L., Chen, T., and Wang, X. D. (2023). Evaluation and prediction of ecological carrying capacity in the Qilian Mountains National Park, China. J. Environ. Manag. 339:117856. doi: 10.1016/j.jenvman.2023.117856
Suter, G. W., Norton, S. B., and Barnthouse, L. W. (2003). The evolution of frameworks for ecological risk assessment from the red book ancestor. Hum. Ecol. Risk Assess. Int. J. 9, 1349–1360. doi: 10.1080/10807030390240391
Wang, B., Ding, M., Li, S., Liu, L., and Ai, J. (2020). Assessment of landscape ecological risk for a cross-border basin: a case study of the Koshi River basin, Central Himalayas. Ecol. Indic. 117:106621. doi: 10.1016/j.ecolind.2020.106621
Xiao, Y. F., Chen, W. Y., Wang, B. J., Tan, Y. R., Bing, D. H., Zhu, L., et al. (2021). Study on temporal and spatial change of land use and its relationship with climate factors in Qilian Mountains National Nature Reserve. Acta Agrestia Sin. 29, 2049–2057.
Xie, H., He, Y., Choi, Y., Chen, Q., and Cheng, H. (2020). Warning of negative effects of land-use changes on ecological security based on GIS. Sci. Total Environ. 704:135427. doi: 10.1016/j.scitotenv.2019.135427
Xie, H. L., Wang, P., and Huang, H. S. (2013). Ecological risk assessment of land use change in the Poyang Lake eco-economic zone, China. Int. J. Environ. Res. Public Health 10, 328–346. doi: 10.3390/ijerph10010328
Xue, J., Li, Z., Feng, Q., Li, Z., Gui, J., and Li, Y. (2023). Ecological conservation pattern based on ecosystem Services in the Qilian Mountains, Northwest China. Environ. Dev. 46:100834. doi: 10.1016/j.envdev.2023.100834
Yang, J., and Huang, X. (2021). The 30 m annual land cover dataset and its dynamics in China from 1990 to 2019. Earth Syst. Sci. Data 13, 3907–3925. doi: 10.5194/essd-13-3907-2021
Yu, H., Liu, X. L., Zhao, T. M., Zhang, M. Y., Nian, L. L., and Li, X. D. (2022). Landscape ecological risk assessment of Qilian Mountains National Park based on landscape pattern. Ecol. Sci. 41, 99–107. doi: 10.1002/gj.3115
Zhang, W., Chang, W. J., Zhu, Z. C., and Hui, Z. (2020). Landscape ecological risk assessment of Chinese coastal cities based on land use change. Appl. Geogr. 117:102174. doi: 10.1016/j.apgeog.2020.102174
Zhang, X., Dong, X., Xu, C., Wang, R., Lv, T., and Ranagalage, M. (2023). Landscape ecological risk assessment in the Dongjiangyuan region, China, from 1985 to 2020 using geospatial techniques. Geomat. Nat. Haz. Risk 14:2173662. doi: 10.1080/19475705.2023.2173662
Zhang, F., Yushanjiang, A., and Wang, D. F. (2018). Ecological risk assessment due to land use/cover changes (LUCC) in Jinghe County, Xinjiang, China from 1990 to 2014 based on landscape patterns and spatial statistics. Environ. Earth Sci. 77, 1–16. doi: 10.1007/s12665-018-7676-z
Zhang, S., Zhang, J., Liang, S., Liu, S., and Zhou, Y. (2022). A perception of the Nexus “resistance, recovery, resilience” of vegetations responded to extreme precipitation pulses in arid and semi-arid regions: a case study of the Qilian Mountains nature reserve, China. Sci. Total Environ. 843:157105. doi: 10.1016/j.scitotenv.2022.157105
Keywords: land use type, landscape pattern, ecological risk index, spatial autocorrelation, Qilian Mountain National Park
Citation: Li Y, Qin Q, Wang D, An W, He X and Yu T (2024) An analysis on the spatial heterogeneity characteristics of landscape ecological risk in Qilian Mountain National Park. Front. For. Glob. Change. 7:1308154. doi: 10.3389/ffgc.2024.1308154
Edited by:
Arun Jyoti Nath, Assam University, IndiaReviewed by:
Milica Kašanin, University of Belgrade, SerbiaLuigi Portoghesi, University of Tuscia, Italy
Copyright © 2024 Li, Qin, Wang, An, He and Yu. This is an open-access article distributed under the terms of the Creative Commons Attribution License (CC BY). The use, distribution or reproduction in other forums is permitted, provided the original author(s) and the copyright owner(s) are credited and that the original publication in this journal is cited, in accordance with accepted academic practice. No use, distribution or reproduction is permitted which does not comply with these terms.
*Correspondence: Xiaohui He, aGV4aWFvaHVpQG5pZWVyLmFjLmNu; Wanxiu An, Z3NnbGF3eEAxNjMuY29t
 Yanlong Li
 Qianqian Qin2
 Xiaohui He
