 Imran Md Jelas
 Mohd Asyraf Zulkifley
 Mardina Abdullah
 Martin Spraggon3
94% of researchers rate our articles as excellent or good
Learn more about the work of our research integrity team to safeguard the quality of each article we publish.
Find out more
SYSTEMATIC REVIEW article
Front. For. Glob. Change , 02 February 2024
Sec. Forest Management
Volume 7 - 2024 | https://doi.org/10.3389/ffgc.2024.1300060
Deforestation poses a critical global threat to Earth’s ecosystem and biodiversity, necessitating effective monitoring and mitigation strategies. The integration of deep learning with remote sensing offers a promising solution for precise deforestation segmentation and detection. This paper provides a comprehensive review of deep learning methodologies applied to deforestation analysis through satellite imagery. In the face of deforestation’s ecological repercussions, the need for advanced monitoring and surveillance tools becomes evident. Remote sensing, with its capacity to capture extensive spatial data, combined with deep learning’s prowess in recognizing complex patterns to enable precise deforestation assessment. Integration of these technologies through state-of-the-art models, including U-Net, DeepLab V3, ResNet, SegNet, and FCN, has enhanced the accuracy and efficiency in detecting deforestation patterns. The review underscores the pivotal role of satellite imagery in capturing spatial information and highlights the strengths of various deep learning architectures in deforestation analysis. Multiscale feature learning and fusion emerge as critical strategies enabling deep networks to comprehend contextual nuances across various scales. Additionally, attention mechanisms combat overfitting, while group and shuffle convolutions further enhance accuracy by reducing dominant filters’ contribution. These strategies collectively fortify the robustness of deep learning models in deforestation analysis. The integration of deep learning techniques into remote sensing applications serves as an excellent tool for deforestation identification and monitoring. The synergy between these fields, exemplified by the reviewed models, presents hope for preserving invaluable forests. As technology advances, insights from this review will drive the development of more accurate, efficient, and accessible deforestation detection methods, contributing to the sustainable management of the planet’s vital resources.
Deforestation is a significant environmental challenge affecting numerous regions of the world. In this modern era, deforestation has become one of the biggest, critical, and pressing environmental challenges with significant negative implications to climate change, biodiversity, and human wellbeing (Hansen et al., 2020; Bragagnolo et al., 2021). Monitoring the deforestation rate at a global scale is a challenging task, as it requires timely and accurate information about the spatial distribution and extent of forest cover that is crucial for its control and mitigation (Dostálová et al., 2018).
To effectively monitor and detect deforestation, the utilization of advanced remote sensing technologies is imperative. Remote sensing technologies, such as satellite imagery (Wieland et al., 2019; Pulella et al., 2020; Yu et al., 2020), Light Detection and Ranging (LiDAR) (Alonso et al., 2020; Hansen et al., 2020; Scepanovic et al., 2021), and aerial photography using drones or unmanned aerial vehicle (UAV) (Chen et al., 2021; Li et al., 2021), collectively offer a powerful tool for efficient and timely deforestation monitoring and detection. The increasing availability of high-resolution satellite imagery and LiDAR data has facilitated the monitoring and detection of deforestation over large areas, capturing detailed information of forest cover (Hansen et al., 2020) and topography (Puhm et al., 2020). However, traditional methods for image analysis such as manual identification of deforestation from maps can be time-consuming task with low accuracy performance (Li et al., 2021). Thus, it is impractical to manually identify the deforestation from large regions by analyzing large amounts of satellite data, LiDAR data, and aerial imagery.
Therefore, automated approaches, such as image segmentation through machine learning or deep learning techniques, have been proposed to establish the deforestation more efficiently and accurately (Bragagnolo et al., 2021). These automated techniques utilize advanced algorithms to analyze satellite imagery and other remote sensing data to enable the automated identification of deforested areas and the monitoring of deforestation patterns over time (Puhm et al., 2020). Image segmentation refers to the process of dividing an image into multiple segments, each representing a different class or region of interest (Wieland et al., 2019). Image segmentation plays a crucial role in detecting deforested areas, as it allows the separation of forest areas from other land-used classes, whereby the changes can be tracked over a period of time (Yu et al., 2020).
By utilizing machine learning algorithms, the segmented images can be further analyzed and classified, enabling the automated detection of deforestation patterns and the quantification of deforested areas (Wieland et al., 2019). Machine learning models can be trained on data to recognize specific features, indicative to the deforestation patterns, such as changes in vegetation cover or the presence of clear-cut patches (Alonso et al., 2020). Machine learning approach provides a scalable and efficient solution for monitoring deforestation on a large scale, enabling stakeholders to better understand the extent and spatial distribution of deforested areas and allows the authorized parties to make informed decisions for sustainable land management and conservation. Conventional machine learning algorithms such as Support Vector Machine (SVM) and Random Forest (RF), while effective, have limitations compared to deep learning algorithms in detecting the deforestation (Alonso et al., 2020). Deep learning, which is a subset of machine learning, leverages deep networks to automatically learn intricate patterns and representations from a large set of data. In the context of deforestation detection, deep learning models can capture complex relationships between various image features which represent deforestation, leading to more accurate detection results (Yu et al., 2020).
Deep learning, particularly convolutional neural networks (CNN), has been shown to be effective in automatically detecting deforestation based on remote sensing images (Chen et al., 2021). CNN-based approaches can extract features that are relevant for the detection of deforestation, such as texture, shape, and spectral information, enabling accurate segmentation of deforested areas (Wieland et al., 2019). In recent years, the emergence of deep learning-based image segmentation methods has provided a promising solution and demonstrated significant potential in addressing the challenge of automated deforestation detection and mapping. These techniques have shown significant promise in achieving higher accuracy and efficiency in the detection and segmentation of deforested areas. Deep learning-based image segmentation is a type of machine learning approach that can automatically classify each of the pixels in an image based on their own unique characteristics (Wieland et al., 2019). Deep learning-based image segmentation involves training a deep neural network to automatically learn features of interest, which is used to classify each pixel into different classes (Li et al., 2021). By training deep learning models on large datasets of satellite imagery, these methods can accurately and efficiently identify the deforested regions at a global scale (Chen et al., 2021). This approach has the potential to accurately detect and map deforested areas, enabling better monitoring and management of forests. This allows for precise identification of changes in landscape, such as forest cover changes.
Several studies have applied image segmentation and deep learning techniques in deforestation detection (Wieland et al., 2019; Yu et al., 2020; Bragagnolo et al., 2021). These studies have explored the potential use of deep learning-based image segmentation for deforestation detection. These studies have demonstrated the effectiveness of deep learning-based image segmentation methods in detecting and mapping deforestation areas. For example, Bragagnolo et al. (2021) used a deep learning approach to detect deforestation in the Brazilian Amazon rainforest, achieving high accuracy rates. Meanwhile, Scepanovic et al. (2021) proposed a convolutional neural network-based method for detecting deforestation in Finland, achieving an overall accuracy of 92.78%. On the other hand, the work in Yu et al. (2020) developed a deep learning-based framework for detecting deforestation in Greater Khingan Mountains in northeast China, achieving an overall accuracy of 93.60% by using direct method, while 93.80% by using indirect method.
The success of these approaches is due to the ability of deep learning methods to learn complex representations of features from large training data, enabling the identification of subtle and unique patterns in satellite imagery that are difficult to detect using conventional approaches. These techniques have also benefited from the availability of large, high-quality annotated datasets, such as those provided by the United States Geological Survey (USGS) Landsat Data Continuity Mission (LDCM) platform (Wieland et al., 2019). The use of deep learning-based image segmentation for deforestation detection has several advantages over conventional methods, primarily on improved accuracy and efficiency. Furthermore, it has the potential to fully automate the detection process, making the mapping process easier and faster. However, there are also challenges associated with this approach, such as the need for large amounts of training data and the difficulty of dealing with complex and heterogeneous forest environments.
The application of intelligent technology in forest monitoring systems has advanced significantly, specifically with the adoption of modern image processing techniques that include classification and segmentation methods for deforestation research. The implementation of the deep learning approach, which is the state-of-the-art machine learning technique has gained traction among researchers in the remote sensing field, especially for forestry applications. Several environmental researchers have shown their support to the usage of deep learning in deforestation prediction (Scepanovic et al., 2021). Additionally, many researchers have applied various classification techniques to remote sensing data to quantify forest areas, whereby CNN is the most used technique in image classification (Wieland et al., 2019). Furthermore, many researchers have also explored various aspects of automated forest monitoring systems that include pre-processing, feature extraction, ensemble learning, and classifier techniques. In order to benchmark the performance of the conventional methods of forest monitoring to the deep learning methods, several evaluation metrics such as accuracy, specificity, sensitivity, precision, and F-measure were used to validate the performance differences between the various forest monitoring systems.
One of the contemporary challenges in forest monitoring revolves around the effective utilization of satellite imaging data for automated deforestation detection across large areas. Despite advancements in image processing and classification techniques, this study addresses the existing problems, wherein the manual identification of forest areas remains a challenging task, even for experienced silviculturists and forest ecologists that could lead to potential misauthentication of non-forest areas. To address these issues, this study aims to contribute to the development of a more precise and automated approach for deforestation detection using satellite data through comparative evaluations of the reviewed models, showcasing the benefits of optimal feature selection and better class distribution among the training data. Therefore, this study sought to analyze the state-of-the-art automation algorithms for sub-modules in deforestation monitoring systems that include classification, segmentation, and basic image analysis techniques. Generally, researchers have developed various methods to tackle the previously mentioned challenges, aiming to improve the algorithm’s efficiency and accuracy. However, there is one unique trait that stands out among these algorithms, whereby the CNN-based method has been applied as the base model, either for classification or segmentation. Thus, the main objective of this study is to provide a comprehensive review based on an advanced search of related works on the classification techniques for deforestation using deep learning methods. A comprehensive analysis of the literature, as well as meticulous and advanced search processes have been executed that lead to the selection of 22 articles between 2018 and March 2022 for final thorough examination. Through this final analysis, valuable insights are gained, paving the way for more effective and precise automated deforestation monitoring algorithms. At its core, this study seeks to address the overarching research question: How can automation algorithms, particularly those leveraging deep learning techniques like CNN, elevate the efficiency and accuracy of deforestation monitoring, overcoming challenges associated with manual identification over large areas using satellite imaging data? The ultimate goal is to contribute valuable knowledge to the evolving landscape of deforestation detection methods.
In conclusion, the usage of deep learning-based segmentation technique, applied to satellite imagery has shown great potential for deforestation detection. The high accuracy and efficiency of these approaches make them useful tools for monitoring deforestation status, which can be used as part of the sustainable forest management systems. Further research is needed to address the remaining challenges, so that more robust and accurate models for deforestation detection.
This paper commences with an Introduction providing the study’s background, the research’s significance, and its objectives. Following the Introduction, Section 2 details the “Materials and methods” that are divided into four subsections: Identification Stage, Screening Stage, Eligibility Stage, and Data Abstraction and Analysis. These subsections succinctly discussed the systematic review process, utilizing the PRISMA method, and explaining the criteria for selecting relevant articles. Moving on to Section 3, the study presents “Results and findings,” structured into five subsections: Deforestation Classification based on Deep Learning Approach, Associated Impacts of Excessive Deforestation Activities, Remote Sensing Technology for Deforestation Detection, Data Construction for Deforestation Detection, and Deep Learning Architectures for Deforestation Detection. Each subsection provides concise summaries of the primary findings from the reviewed articles on the respective topics. Subsequently, Section 4 engages in a “Discussion” on the strengths and limitations of the current state-of-the-art methods for deforestation detection using deep learning and remote sensing. The paper is concluded in Section 5, providing the “Conclusion and future work.” This section summarizes the main contributions and implications of the review while suggesting a few future research directions.
Presently, there is a strong emphasis on using advanced evaluation when comparing between various works, which has driven us to adopt a comprehensive review approach that employ systematic flow methods (Hiebl, 2023). In this study, a structured review was conducted, incorporating a set of defined criteria to strategically discern patterns, trends, and critical evaluations within the literature concerning deforestation classification using deep learning techniques (Munn et al., 2018). After a thorough analysis and integration of the findings, additional literature findings were also incorporated to provide future research directions.
The full review process encompassed four systematic steps, following the guidelines of the Preferred Reporting Items for Systematic Reviews and Meta-Analyses (PRISMA) methodology (Cho and Shin, 2021), which provides a framework for systematically managing information during reviews. The initial step involved identifying the relevant research items that are aligned with the selected research questions, followed by a meticulous screening of the total searched papers, and subsequently evaluating the eligibility of each paper based on its abstract. Through this rigorous process, the scientific literature was comprehensively reviewed and summarized to identify, select, and evaluate various deforestation classification techniques.
As part of this study’s contribution, a few recommendations for future research direction are provided to address existing concerns, as such to align this paper’s findings with the best practice for conducting a comprehensive literature review. To ensure the accuracy and reliability of the review process, the researchers adhered to the publication rules. Furthermore, this study performed a systematic analysis of various studies considered within the review by utilizing the highly recognized Web of Science (WoS) and Scopus databases to examine the methodologies employed in the reviewed literatures.
The systematic review process involves four stages aimed at selecting relevant articles. The initial identification stage is crucial, focusing on articles relevant to our predetermined research questions on deforestation segmentation using deep learning methods. We employed specific keywords (“deforestation,” “segmentation,” “deep learning”) in search strings on the WoS and Scopus databases, resulting in the retrieval of 95 articles (70 from Scopus, 25 from WoS) between 2018 and 2022. These articles form the foundation for subsequent evaluation.
For transparency in our search strategy, details of search strings and databases are outlined in Table 1. This systematic approach ensures a comprehensive and structured search, enhancing the reliability and validity of our literature review. The meticulous screening process, particularly the exclusion of duplicates and refinement based on well-defined inclusion and exclusion criteria, further contributes to the rigor of our study.
Table 1. The search strings.
In the screening stage, the first crucial step is excluding duplicated papers, resulting in the removal of 15 articles. The subsequent step involves screening the remaining 80 articles using well-defined inclusion and exclusion criteria. Specifically, publication types such as systematic reviews, reviews, meta-analyses, meta-synthesis, book series, books, chapters, and conference proceedings were excluded. This review focuses exclusively on English-language studies within the 2018–2022 timeframe, ensuring relevance and validity, as detailed in Table 2. The refined selection aligned with our analytical objectives, resulting in the exclusion of 53 articles that did not meet the specified criteria. The final set comprises 27 relevant articles for further analysis and evaluation.
Table 2. The selection criterion for searching.
In the third stage, which is also known as the eligibility stage, the remaining 27 articles will undergo further consideration. During this critical phase, a thorough examination was conducted on the titles and their key contents to ensure they precisely met the inclusion criteria and were aligned with the research objectives of the present study. Through this meticulous scrutiny, 5 articles were excluded from the final selection, as they did not qualify as deforestation segmentation research, backed by the empirical evidence and they did not employ deep learning techniques.
As a result of this rigorous eligibility assessment, a set of 22 articles emerged as the final candidates for the subsequent comprehensive review and analysis. These selected articles demonstrate strong alignment with this study’s focus and have met the necessary criteria, providing a reliable and representative set of studies to represent the research on deforestation segmentation using deep learning techniques. This methodical approach enhances the credibility and validity of this study, ensuring that only high-quality and relevant research is included in the comprehensive review process.
In this study, an integrative analysis served as the main assessment strategy, encompassing various research designs such as quantitative, qualitative, and mixed methods. The primary goal is to identify pertinent topics and subtopics related to deforestation detection and classification. The data collection stage marked the initial step in the review article’s theme development. Figure 1 illustrates the meticulous analysis of 22 articles to extract relevant assertions and materials in line with the study’s focus by using PRISMA methodology. Subsequently, the authors thoroughly evaluated significant studies pertaining to deforestation classification, investigating the methodologies employed and their research outcomes.
Figure 1. The PRISMA flow diagram of the proposed searching study.
The themes were developed based on evidence specific to this study’s primary goals and context. Throughout the data analysis process, a comprehensive log was maintained to record analyses, viewpoints, questions, and other relevant thoughts for data interpretation. The results were carefully compared to identify any inconsistencies in the theme design process. In cases of conceptual disagreements internal discussions are organized among the authors to ensure the chosen themes are consistent.
To ensure the validity of the analysis, an expert in satellite imaging was involved in the analysis selection phase, in which the expert reviews the full process to ensure the clarity, importance, and suitability of each subtheme, further establishing the domain validity. By employing this robust approach, this study reinforced the reliability and rigor of its findings, providing valuable insights into deforestation classification.
The field of deforestation detection has witnessed a multitude of approaches from various researchers. To facilitate comparisons between these studies, the methodologies and outcomes of their approaches have been carefully summarized. This comprehensive summary is presented in Table 3, encompassing the prevailing works concerning the deforestation classification by utilizing deep learning techniques.
Table 3. Summary of prevailing and recent deep learning research works.
The findings can also be traced back to the considerable efforts made by previous researchers in the domain of deforestation segmentation. Among the top-performing approaches, CNN approach stands out as one of the most effective methods for the classification process. Previous studies have investigated various techniques that are based on CNN methodologies, such as U-Net, DeepLabV3, ResNet, SegNet, FCN, and others, showcasing the breadth of various research, which can be baseline for improving the deforestation detection performance using deep learning approach.
Figure 2 illustrates the application of deep learning in deforestation detection by considering the respective associated impacts. As a result, deep learning techniques have also been utilized to detect various aspects such as desertification, mining sites, forest fires, and deforestation itself.
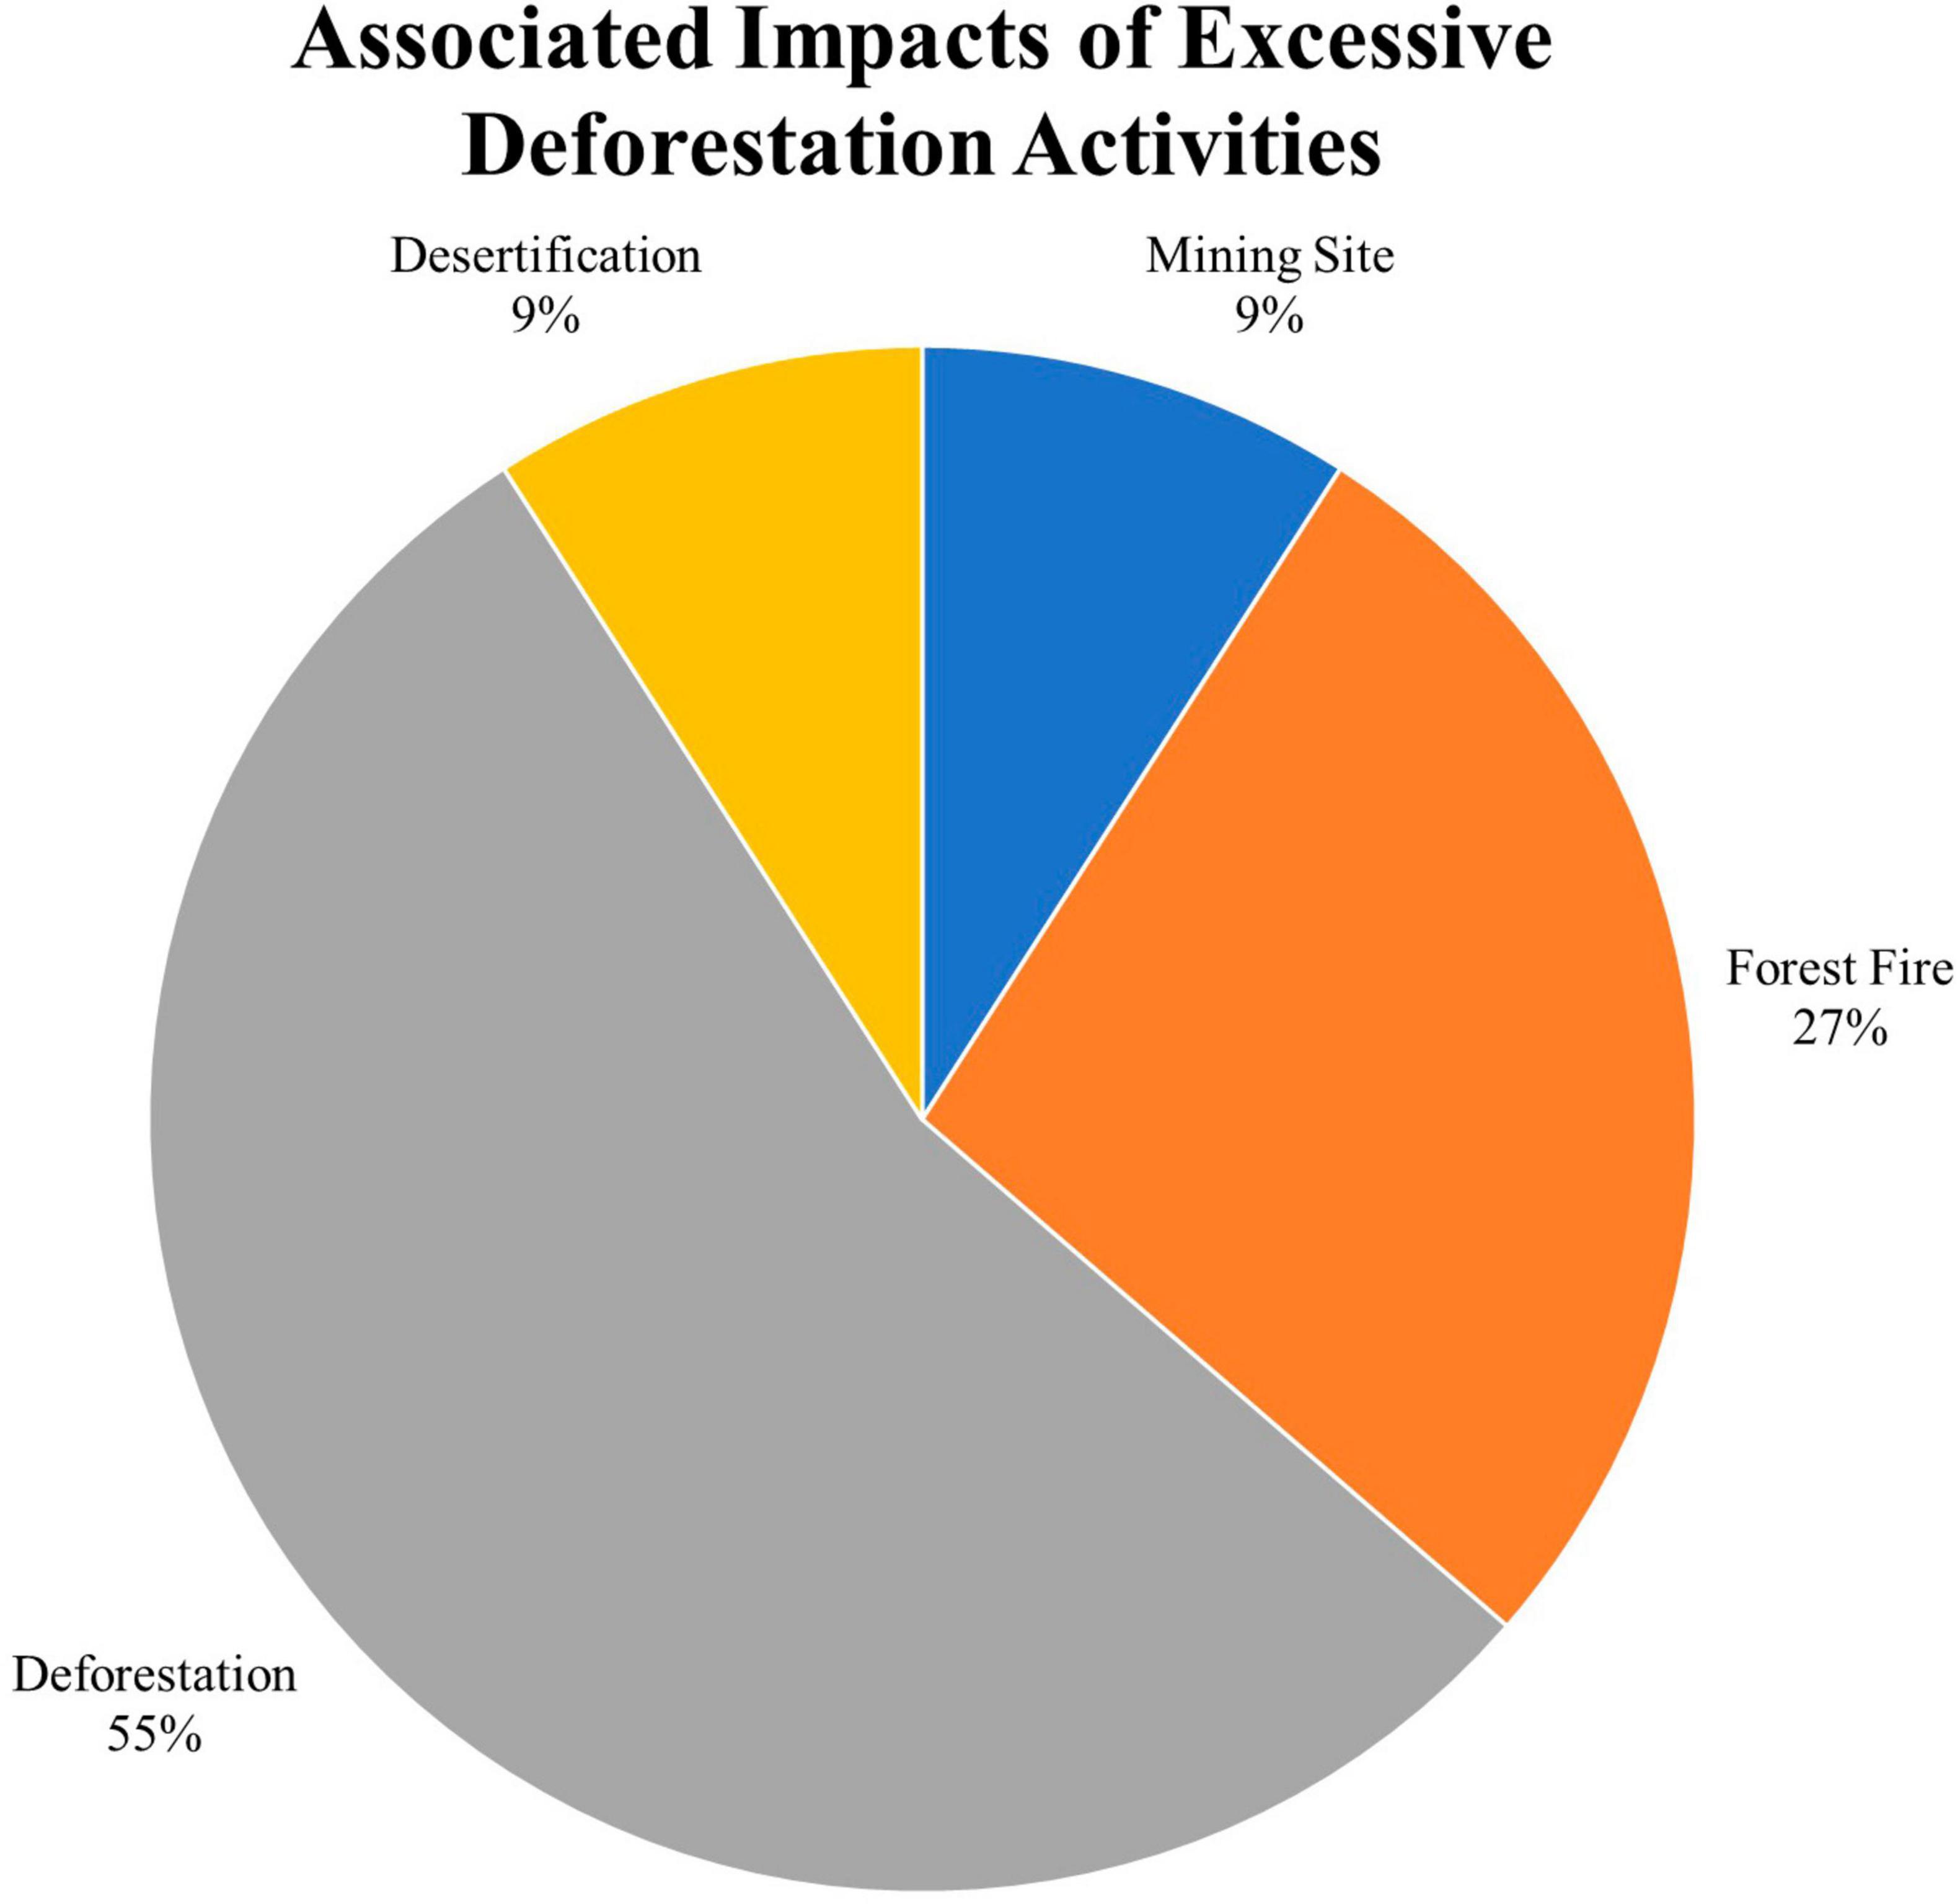
Figure 2. Related impacts on the deforestation detection using deep learning approach.
Desertification refers to the transformation of land into desert-like conditions, influenced by factors such as climate change, human activities, and natural disasters. Out of a total of 22 studies on deforestation detection using deep learning approaches, two studies (9%) have specifically focused on detecting desertification. Besides that, mining sites represent the areas where mineral extraction has occurred. Similarly, only two studies (9%) have concentrated on detecting mining sites within the realm of deforestation detection using a deep learning approach.
Furthermore, the detection of forest fires, which are uncontrolled fires in forested areas, has also been addressed using deep learning methods. A total of six studies (27%) have been dedicated to the detection of forest fires within the context of deforestation detection using a deep learning approach. Notably, the majority of the studies or 12 studies (55%) have specifically targeted the detection of deforestation itself using deep learning techniques. This highlights the significance of identifying deforestation as a primary concern and emphasizes the self-perpetuating nature of deforestation.
In conclusion, deforestation detection using deep learning involves the development of diverse strategies to detect various causes and impacts of deforestation, including desertification, mining sites, forest fires, and deforestation itself. Understanding these different aspects enables the formulation of effective approaches for mitigating the detrimental effects of excessive deforestation.
Remote sensing technology plays a vital role in collecting Earth surface data without the need for physical presence at the respective locations. In the context of deforestation detection, remote sensing enables data collection of areas of interest, so that the locations of the affected areas can be identified.
Figure 3 represents the distribution of deforestation detection approaches using UAVs and satellites. According to the Figure 3, UAVs are utilized in 36% of the cases for deforestation detection, while satellites account for the remaining 64%. One of the modalities used in remote sensing technology for deforestation detection is UAVs, which are pilotless aircraft that are employed due to their ability to fly at low altitudes and capture high-resolution images of the Earth’s surface. On the other hand, satellite imaging is the most popular remote sensing data used for deforestation detection, whereby it offers several advantages over using UAVs.
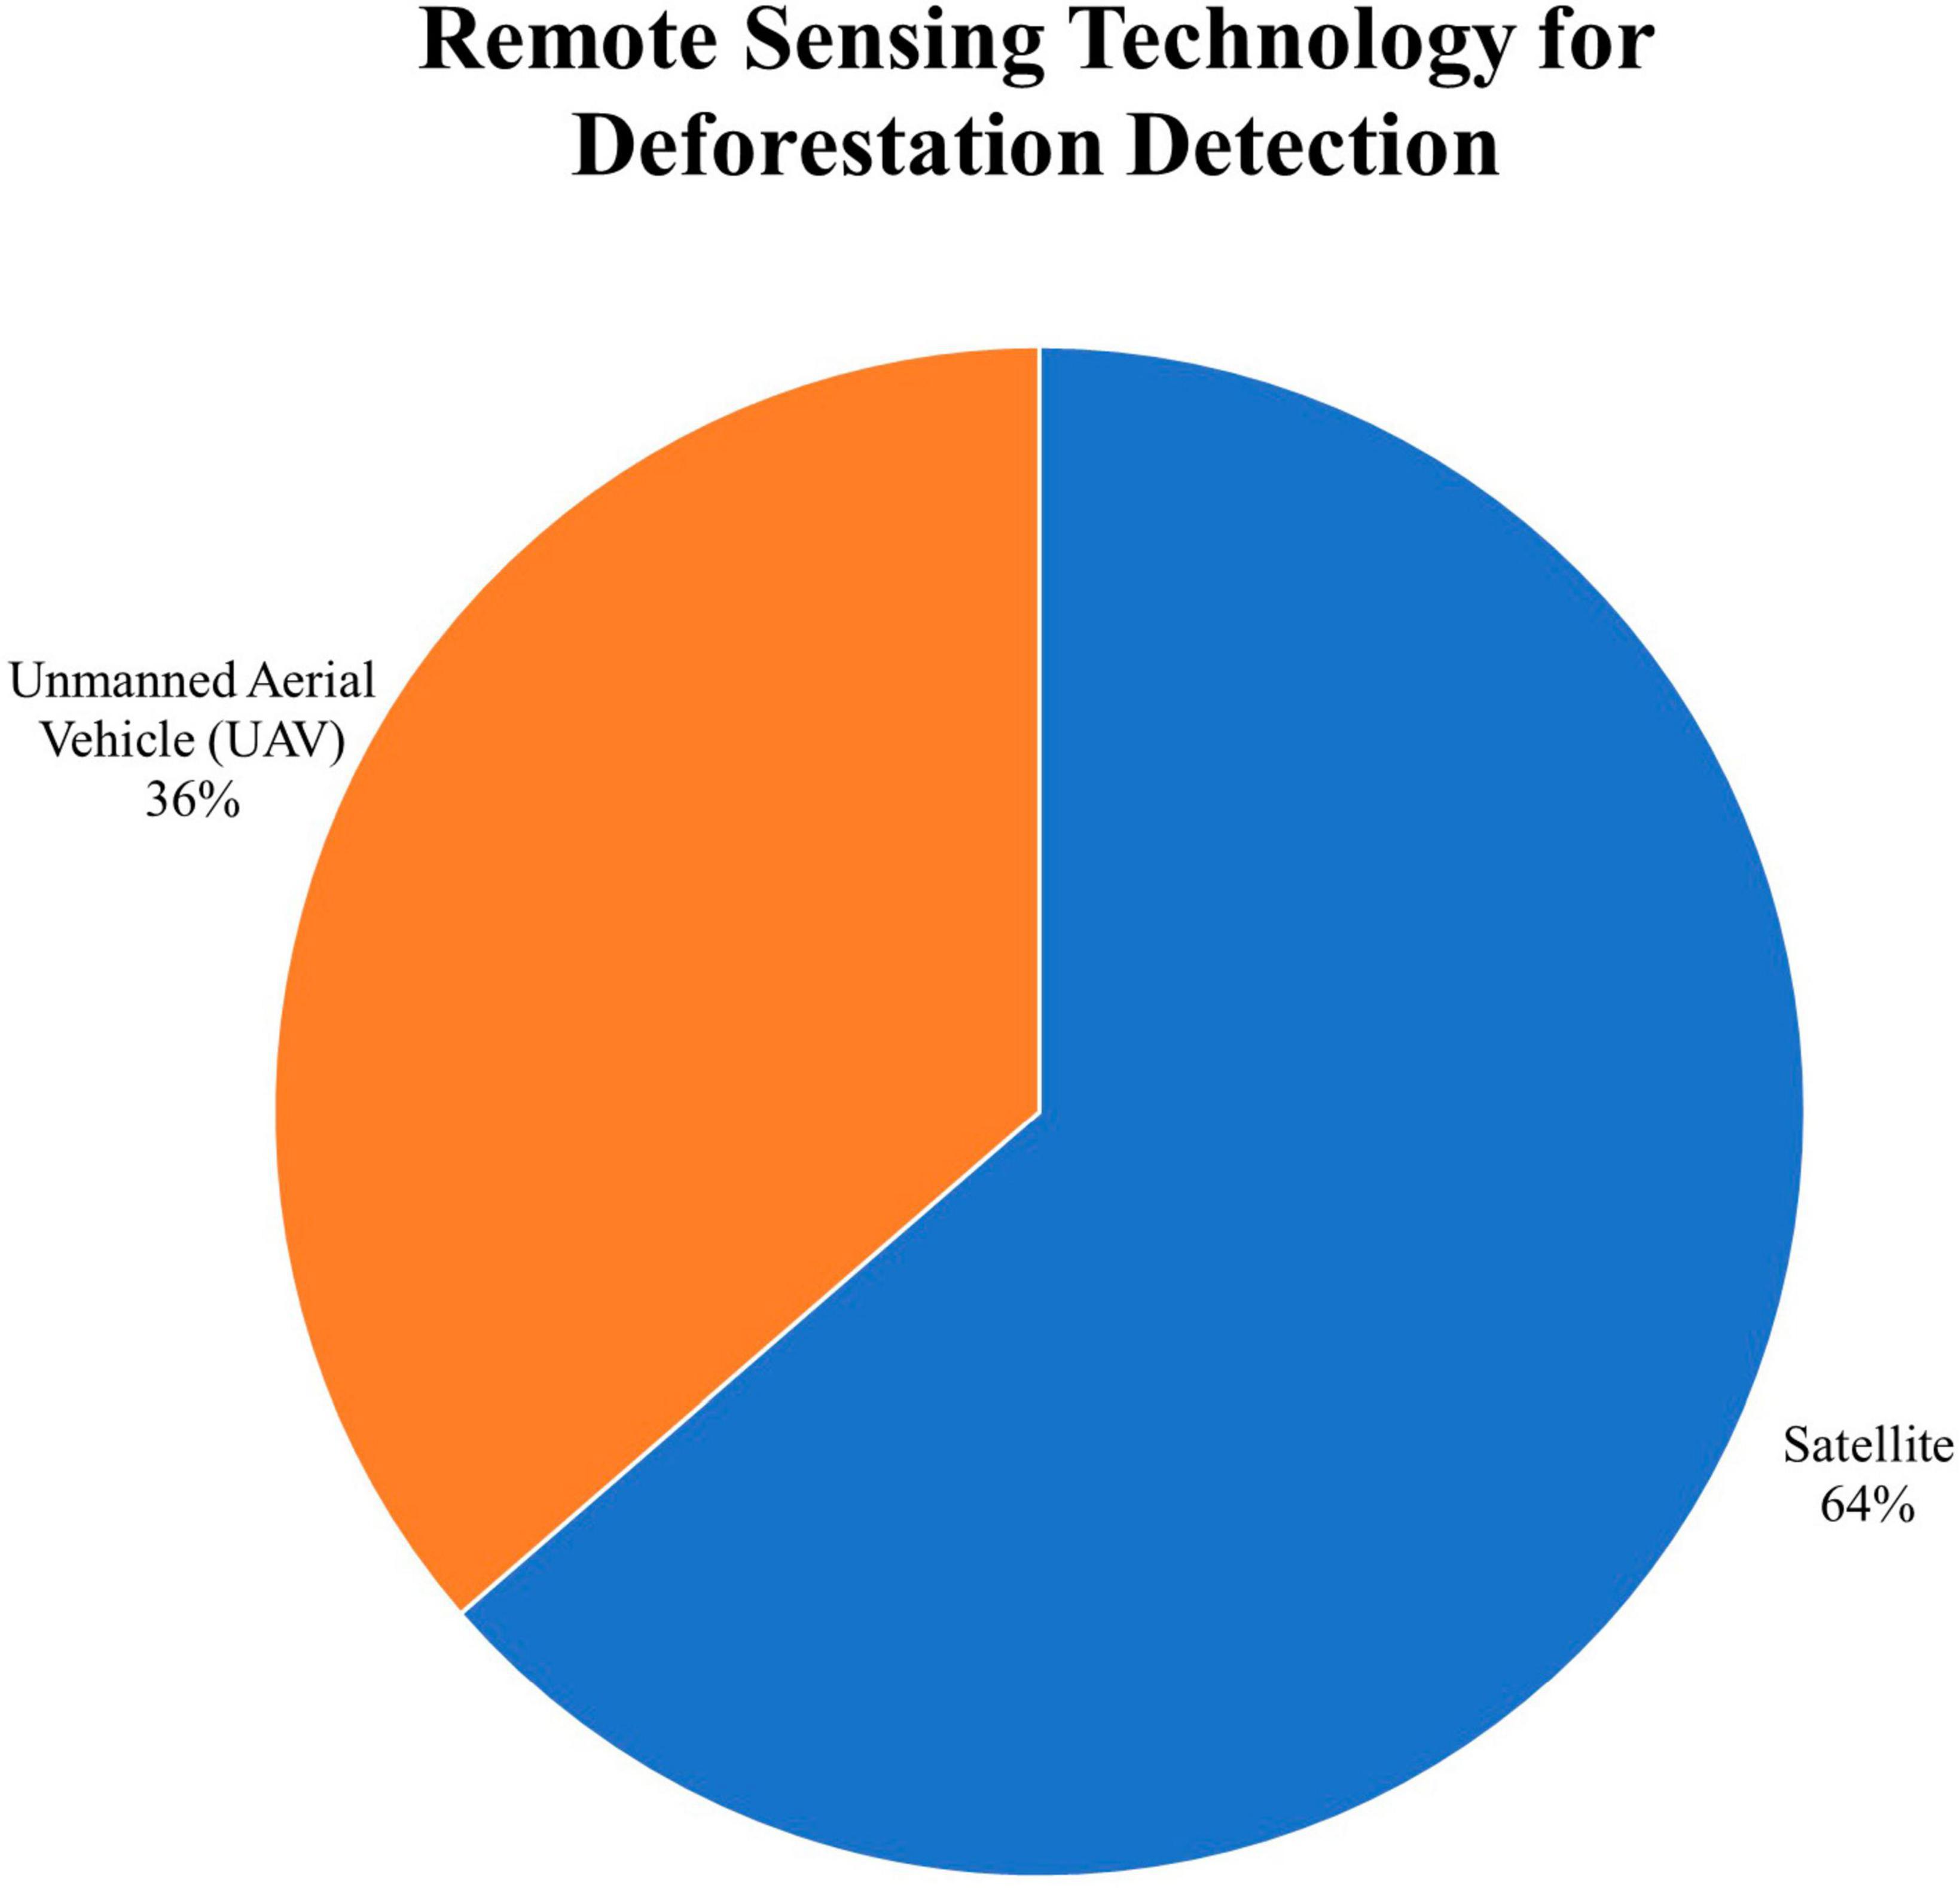
Figure 3. Remote sensing technology for deforestation detection.
Firstly, satellites provide a broader coverage area, allowing for the monitoring of large-scale deforestation across extensive regions. This is particularly beneficial for tracking deforestation trends on a global or regional scale. On the other hand, UAVs are limited in their range and can only capture data over a relatively smaller area compared to satellites.
Secondly, satellite imagery is readily accessible and can be obtained at regular intervals, providing a consistent and continuous monitoring capability. Satellites operate on pre-defined orbits and capture data systematically, allowing for frequent updates and the ability to detect changes in deforestation patterns over time. In contrast, UAV flights need to be scheduled and coordinated, which can be more time-consuming and logistically challenging.
Furthermore, satellite data offers consistent spatial resolution and image quality, ensuring uniformity in the detection and analysis of deforestation. UAV imagery, although capable of capturing high-resolution images, may vary in terms of image quality and spatial resolution depending on factors such as flight altitude and sensor capabilities.
Lastly, satellite-based monitoring systems are often part of long-term, established programs, providing a wealth of historical data for deforestation analysis and comparisons. This historical perspective enhances the understanding of deforestation dynamics and aids in assessing the effectiveness of conservation efforts and policies. UAV-based monitoring, on the other hand, may have limitations in terms of availability and continuity of the historical data.
Overall, while UAVs have their merits in specific applications, such as local-scale or targeted monitoring, satellite imaging offers a more practical and comprehensive solution for large-scale deforestation detection, thanks to their wide coverage, consistent data acquisition, and historical data availability.
The process of constructing a high-quality dataset for deforestation detection involves a meticulous approach to data construction, as highlighted by Lee et al. (2020). Developing robust datasets for deforestation detection encompasses both data acquisition and preprocessing methodologies. In the preceding sections, there is a delve into the intricacies of data acquisition, exploring the pivotal role of remote sensing technologies, including satellite and Unmanned Aerial Vehicle (UAV) imagery. Open access and publicly available databases, along with private sources, were examined, shedding light on the diverse strategies researchers employ to obtain critical imagery data.
Following this, the focus shifts to the critical phase of data preprocessing, emphasizing the intermediary steps crucial for molding raw data into a format conducive to training accurate and resilient deforestation detection models. From meticulous data annotation, which involves labeling acquired imagery to distinguish deforested areas, to the use of Geographic Information System (GIS) tools, manual and assisted annotation techniques, the groundwork for supervised learning is established. Additionally, data augmentation plays a pivotal role in diversifying datasets, mitigating overfitting risks, and enhancing model generalization through geometric transformations and adjustments in color spaces. Data partitioning further ensures a systematic division of the dataset into training, validation, and testing sets, facilitating robust model evaluation. While no standard ratio exists, studies showcased diverse approaches, underscoring the importance of strategic dataset subdivision for effective model training and evaluation.
In this comprehensive synthesis, the elucidation of the holistic process of data construction occurs, where the amalgamation of acquisition and preprocessing methodologies lays the groundwork for precise and effective deforestation detection models. The careful orchestration of data preprocessing steps, including data annotation, data augmentation, and data partitioning, ensures that the resulting datasets not only encapsulate the nuances of real-world scenarios but also empower deep learning models to contribute meaningfully to environmental monitoring and conservation efforts.
The utilization of remote sensing technology has become indispensable for acquiring crucial imagery data. These images, harnessed through both satellite and Unmanned Aerial Vehicle (UAV) technology, are systematically stored in databases, forming the backbone of analytical endeavors. In the context of satellite imagery, we define databases that can be broadly categorized into open access and publicly available databases, providing accessibility to a wide range of users. Open access databases, as we define them, offer imagery that can be accessed by anyone, while publicly available databases involve satellite imagery developed by authorized agencies but remain accessible to the public. On the other hand, private available satellite imagery, as we define it, is sourced through direct partnerships with satellite imagery owners or may be unspecified in the literature. Meanwhile, for UAV imagery databases, we define a distinction between publicly available ones, captured by authorized agencies but accessible to all, and private databases, indicating imagery captured by the researchers themselves. Understanding these nuances of remote sensing databases, as we define them, is paramount for comprehending the dynamics of deforestation detection methodologies and their applicability in deforestation detection. Figure 4 illustrates the database sources for data acquisition in deforestation detection.

Figure 4. Database sources for data acquisition in deforestation detection.
The open access satellite imagery database, utilized by 32%, is a valuable resource for deforestation detection researchers and practitioners. Notably, studies by Gallwey et al. (2020), Hu et al. (2021), Wahab et al. (2021), and John and Zhang (2022) exemplify the utilization of publicly available satellite imagery. Gallwey et al. (2020) and Hu et al. (2021) leverage Sentinel-2 Multi-Spectral Instrument (MSI) imagery from the European Space Agency’s (ESA) Sentinel-2 mission. Similarly, Zerrouki et al. (2021) and Zerrouki et al. (2022) employ satellite imagery sourced from the United States Geological Survey (USGS), focusing on a study area in Biskra, Algeria. On the other hand, Wahab et al. (2021) turn to Alaska Satellite Facility’s (ASF) data search page, concentrating on the Permanent Forest Reserve (HSK) in Peninsular Malaysia. John and Zhang (2022) delve into the SentinelHub, harnessing its open access platform to access three distinct datasets: RGB-converted images and deforestation masks of the Amazon Rainforest, a four-band dataset of the Amazon Rainforest, and another four-band dataset centered on the Atlantic Forest obtained from Sentinel-2 satellite sensor imagery. In a different context, Isaienkov et al. (2021) utilized an open access satellite imagery database consisting of multitemporal images of the forest-steppe zone from Copernicus Sentinel-2, concentrating on the Kharkiv region of Ukraine by using ArcGIS Pro and QGIS. These instances underscore the accessibility and versatility of open access satellite imagery databases, fostering collaborative efforts in understanding and addressing deforestation challenges globally.
Researchers in the field of deforestation detection have utilized publicly accessible satellite imagery databases, with a usage rate of 19%, to conduct their studies. Significantly, Torres et al. (2021) and de Andrade et al. (2022) employed satellite imagery from Landsat-8 and Sentinel-2, while Wagner et al. (2020) utilized data from GeoEye-1 satellite. Notably, all three studies centered their focus on the same Pará State, Brazil, within the Brazilian Legal Amazon (BLA) region. They employed datasets from the Amazon Deforestation Calculation Program (PRODES) and the Deforestation Detection System in Legal Amazon in Real-Time (DETER), both accessible through the TerraBrasilis portal developed by the National Institute for Space Research (INPE).
Notably, the PRODES and DETER datasets were accessed through different methods: de Andrade et al. (2022) directly accessed them through the INPE portal; Wagner et al. (2020) utilized QGIS software tools, and Torres et al. (2021) by leveraged Google Earth Engine (GEE). In a different context, Dal Molin and Rizzoli (2022) utilized the 2017 Finer Resolution Observation and Monitoring of Global Land Cover (FROM-GLC) database with satellite imagery from Sentinel-1 (S-1) Interferometric Synthetic Aperture Radar (InSAR) short time series (STS). Their study concentrated on Amazon River branches, wetlands, and urban areas. These diverse databases cater to specific study areas, showcasing the versatility of available resources in addressing deforestation challenges.
Lee et al. (2020) employed a private satellite imagery database obtained from High-resolution Komsat-3 images obtained through a direct partnership with the Korea Aerospace Research Institute (KARI) and other Korean government agencies. Their study focused on a landscape affected by deforestation, specifically in the mountainous area near Bonghwa-gun, Gyeongsangbuk-do, Republic of Korea. In a distinct approach, Prabowo et al. (2022) developed their own private satellite imagery database obtained from Landsat-8 satellite with unspecific details about their database, comprising 227 images, initially for their exclusive use. Subsequently, they chose to share this database publicly. In a similar vein, the work by Alzu’bi and Alsmadi (2022) focused on major forests in five regions of Jordan between 2010 and 2020 obtained from Landsat-8 satellite but did not disclose specific details about their database. These instances highlight diverse approaches, accounting for a later 13%, in the utilization and disclosure of private satellite imagery databases in deforestation detection research.
Regarding sources of UAV imagery, researchers have utilized various publicly available UAV databases, with a usage rate of 13%. Guan et al. (2022) and Wang et al. (2022) accessed the FLAME dataset, developed by Northern Arizona University, for their studies. In a different approach, Lu et al. (2022) employed a combination of publicly available UAV databases, including VisiFire, ForestryImages, FiSmo, BowFire, Firesense, and EFD, for their research. These diverse choices in UAV datasets underscore the importance of accessing varied sources to address the specific requirements of deforestation detection studies.
Researchers have utilized private UAV databases in diverse geographic contexts, accounting for 23% in deforestation detection. Giang et al. (2020) focused on a mining area in Daknong province, Vietnam, utilizing a Phantom 4 RTK. Their data underwent a meticulous six-step process in the OrthoEngine Tool in PCI Geomatica Banff Service Pack 1. Meanwhile, Tran et al. (2020) investigated forest fire occurrences in Andong, the Republic of Korea, in April 2020, capturing images with a Phantom 4 Pro V2.0 UAV at a filming height of 150 meters. In the North of Peru, Morales et al. (2018) concentrated on Mauritia flexuosa using various UAVs, including TurboAce, Mavic Pro, and SkyRanger. On the other hand, Chiang et al. (2020) generated a synthetic dataset by extracting raw data from over 300 images of dead trees in the Wood of Cree in Scotland. Lastly, Li et al. (2022) conducted boreal forest canopy mapping in Saihanba National Forest Park, Chengde, Northern China, employing a DJI Phantom 3 4K micro-quadcopter equipped with a stock RGB camera. These instances highlight the diverse applications and geographic scopes covered by private UAV databases in deforestation detection research.
In conclusion, the multifaceted landscape of data acquisition methodologies for deforestation detection underscores the pivotal role of satellite and Unmanned Aerial Vehicle (UAV) technologies. The accessibility and versatility of open access and publicly available satellite imagery databases, exemplified by missions like Sentinel-2 and Landsat-8, provide a global perspective and enable large-scale monitoring. The integration of UAVs introduces flexibility and high resolution for localized studies, with both publicly available and privately created datasets contributing to the wealth of information. Notably, the utilization of private satellite and UAV databases reflects diverse strategies, including partnerships, collaborations, and even synthetic data generation, showcasing the field’s adaptability to unique research needs. As technology evolves, the judicious selection of datasets tailored to specific objectives remains paramount for effective deforestation detection, promising continued advancements in environmental monitoring and conservation endeavors.
Following the culmination of the data acquisition phase, the subsequent critical step in the deforestation detection pipeline is data pre-processing. Data pre-processing serves as a pivotal intermediary stage between raw data acquisition and the subsequent model training process. This phase comprises several key steps that collectively contribute to the effectiveness of the subsequent model training process. Beginning with data annotation, where labeled information is added to the dataset, followed by data augmentation, which introduces variations to enhance model generalization, and concluding with data partitioning, which ensures a systematic division of the dataset for training, validation, and testing purposes, these processes collectively lay the groundwork for training accurate and resilient deforestation detection models.
Data annotation involves the meticulous process of labeling the acquired satellite or UAV imagery to distinguish areas affected by deforestation from those that remain unaffected. Data Annotation can be performed manually or with the assistance of automated tools. This step results in the creation of labeled datasets containing crucial information about the locations and extent of deforested regions. The annotated data acts as the foundation for training machine learning models to recognize patterns associated with deforestation, providing the necessary ground truth for supervised learning.
Researchers have employed various Geographic Information System (GIS) software tools to carry out manual annotation of datasets for satellite imagery to extract the ground truth. For instance, in the work conducted by Lee et al. (2020), multiple software tools such as ArcGIS ver. 10.3, ENVI ver. 5.1, and ERDAS Imagine 2015 were utilized for this purpose. Similarly, Isaienkov et al. (2021) employed software tools including ArcGIS Pro and QGIS, conducting manual labeling and outputting masks as GeoJSON files. Wahab et al. (2021) utilized QGIS software (version 3.10) for semantic labeling techniques. In the study by Wagner et al. (2020), GeoEye images were manually delineated in QGIS to exclude non-forested areas from the analysis.
In a different approach for manually annotated datasets focusing on UAV imagery, researchers often turn to the LabelMe software tools. This is evident in the works of Tran et al. (2020), where LabelMe software tools were used to extract ground truth for Forest fire data masks. Similarly, Guan et al. (2022) extracted ground truth for each image using LabelMe software tools from the Flame dataset. Lu et al. (2022) employed polygon annotation with LabelMe software tools to outline the flame target. However, GIS software tools, as demonstrated in the works by Chiang et al. (2020), were utilized for the manual annotation of datasets in UAV imagery. They employed the QGIS software and the Gridsplitter plugin, generating masks by filling random colors over dead trees and black for the background. The resulting annotations were then stored in a COCO format file.
Furthermore, in the domain of assisted annotation for satellite imagery, John and Zhang (2022) utilized GRASS-GIS 7.6.1 software tools. They employed a modified version of the k-means classification algorithm, repeatedly reclassifying images until the corresponding masks achieved a “satisfactory rating.” In contrast, for UAV imagery, Li et al. (2022) employed the CANEYE software tool with no gamma correction to assist in the annotation process. This involved classification into sky or canopy elements (stems, branches, and leaves) using the supervised threshold in excess blue index feature space for UAV LiDAR and in situ digital cover photography (DCP) images, resulting in a binary image output.
These diverse approaches showcase the flexibility in tool selection for data annotation in deforestation detection studies, highlighting the importance of choosing suitable tools based on specific project requirements and objectives. The referenced studies contribute valuable insights into the methodologies employed for manual annotation and emphasize the significance of accurately labeled datasets in training effective deep learning models for deforestation detection.
Data augmentation is a pivotal step in diversifying the dataset, mitigating the risk of model overfitting, and enhancing the model’s ability to generalize to unseen scenarios. Geometric transformations, such as 0 to 360° rotations, vertical horizontal and flips, and adjustments in the hue saturation, and brightness, play a crucial role in this process, as demonstrated in the works of Wagner et al. (2020). In study by de Andrade et al. (2022), training image patches were subjected to data augmentation by 90, 180, 270° rotated for both the original and rotated versions flipped vertically. Meanwhile, in Alzu’bi and Alsmadi (2022) study, images underwent augmentation, including a vertical and horizontal flip by 180 degrees, enabling the generation of new images from the originals. The concept of data augmentation, aimed at enriching datasets with a variety of perspectives to simulate real-world conditions, is further exemplified in the research by Gallwey et al. (2020). Here, the augmentation process involved reflections and random rotations ranging from 0 to 90°, generating 480,000 individual training patches from 16,000 fully labeled images. This approach ensures that the model is exposed to a diverse range of environmental variations, enhancing its robustness and adaptability when applied to different landscapes and deforestation scenarios.
Data partitioning involves the strategic division of the dataset into training, validation, and testing sets, a crucial step for accurately assessing the model’s performance. The training set, constituting the majority of the dataset, is dedicated to teaching the model to recognize patterns associated with deforestation. Simultaneously, the validation set assists in tuning hyperparameters and preventing overfitting during the training process. Finally, the testing set facilitates an unbiased evaluation of the model’s performance on unseen data, ensuring its generalization capability beyond the training data.
However, there is no standard ratio for dividing the dataset into these sets, as exemplified in various studies. For instance, Wang et al. (2022) randomly selected 80% of their data for training, 10% for validation, and 10% for testing from a 4200-image dataset. In contrast, Alzu’bi and Alsmadi (2022) split their dataset into 70% for training (3294 images), 10% for validation (366 images), and 20% for testing (912 images). Meanwhile, Morales et al. (2018) created a larger training set of 95% from a total of 25,248 image patches, allocating 2.5% for the validation set and 2.5% for the test set. On the other hand, Lee et al. (2020) only subdivided their dataset into 80% (50 images) for learning and 20% (13 images) for testing. Despite the absence of a standard ratio, data partitioning remains a crucial step in data pre-processing. Ensuring that the same data are not used across training, validation, and testing stages is imperative for robust model evaluation.
In contrast to the conventional approach of data annotation followed by data augmentation and then data partitioning, Torres et al. (2021), adopted a different sequence in their method. They initiated the process with data annotation, followed by data partitioning and then data augmentation. After annotating the data from PRODES and They partitioned the images by dividing them into 15 non-overlapping tiles of 715 × 734 for Landsat and 2145 × 2202 for Sentinel 2 datasets. These tiles were subsequently distributed into three groups: 20% for training, 5% for validation, and 75% for testing. Recognizing the inherent imbalance in both datasets, where the deforestation class constituted less than 1%, they addressed this challenge by applying data augmentation techniques. Specifically, they employed 90° rotations, as well as horizontal and vertical flip transformations, to enhance the diversity of patches containing deforestation spots. This innovative approach to data processing showcases the adaptability of methodologies in addressing specific challenges, such as class imbalance, in deforestation detection studies.
In essence, these data pre-processing steps collectively contribute to the creation of a well-structured and diverse dataset, setting the stage for the development of accurate and reliable deep learning models for deforestation detection. The careful execution of data annotation, data augmentation, and data partitioning ensures that the models are equipped to handle the intricacies of real-world deforestation scenarios and contribute meaningfully to environmental monitoring and conservation efforts.
There are various deep learning architectures employed in the context of deforestation detection. Deep learning, which is a subset of machine learning, focuses on training deep networks to learn and make predictions using extensive datasets. In the context of deforestation detection, the primary objective is to identify regions where trees have been cut down or removed, often leveraging satellite imagery input for analysis.
As shown in Figure 5, CNN-based methods, including U-Net, DeepLabV3, ResNet, SegNet, and FCN, stand out as the predominant architecture for deforestation detection, leveraging their roots in image recognition tasks. Designed originally for image recognition, these models exhibit remarkable efficacy in identifying deforested areas using satellite imaging data. By exposing CNNs to a large amount of labeled satellite imagery, these networks learn to extract hierarchical and spatial features, differentiating between forested and deforested regions. This training process enables CNNs to recognize patterns and structures associated with deforestation, facilitating accurate detection. In addition to these well-known architectures, other notable generative models such as Variational Autoencoder (VAE) and Generative Adversarial Network (GAN) have found success in image segmentation and classification tasks, harnessing deep learning for data generation. Despite the prevalence of CNN-based methods, conventional machine learning approaches like Early Fusion (EF), Multi-Task Learning (MTL), and Random Forest (RF) persist, offering valuable alternatives for specific applications within the broader context of deforestation detection.
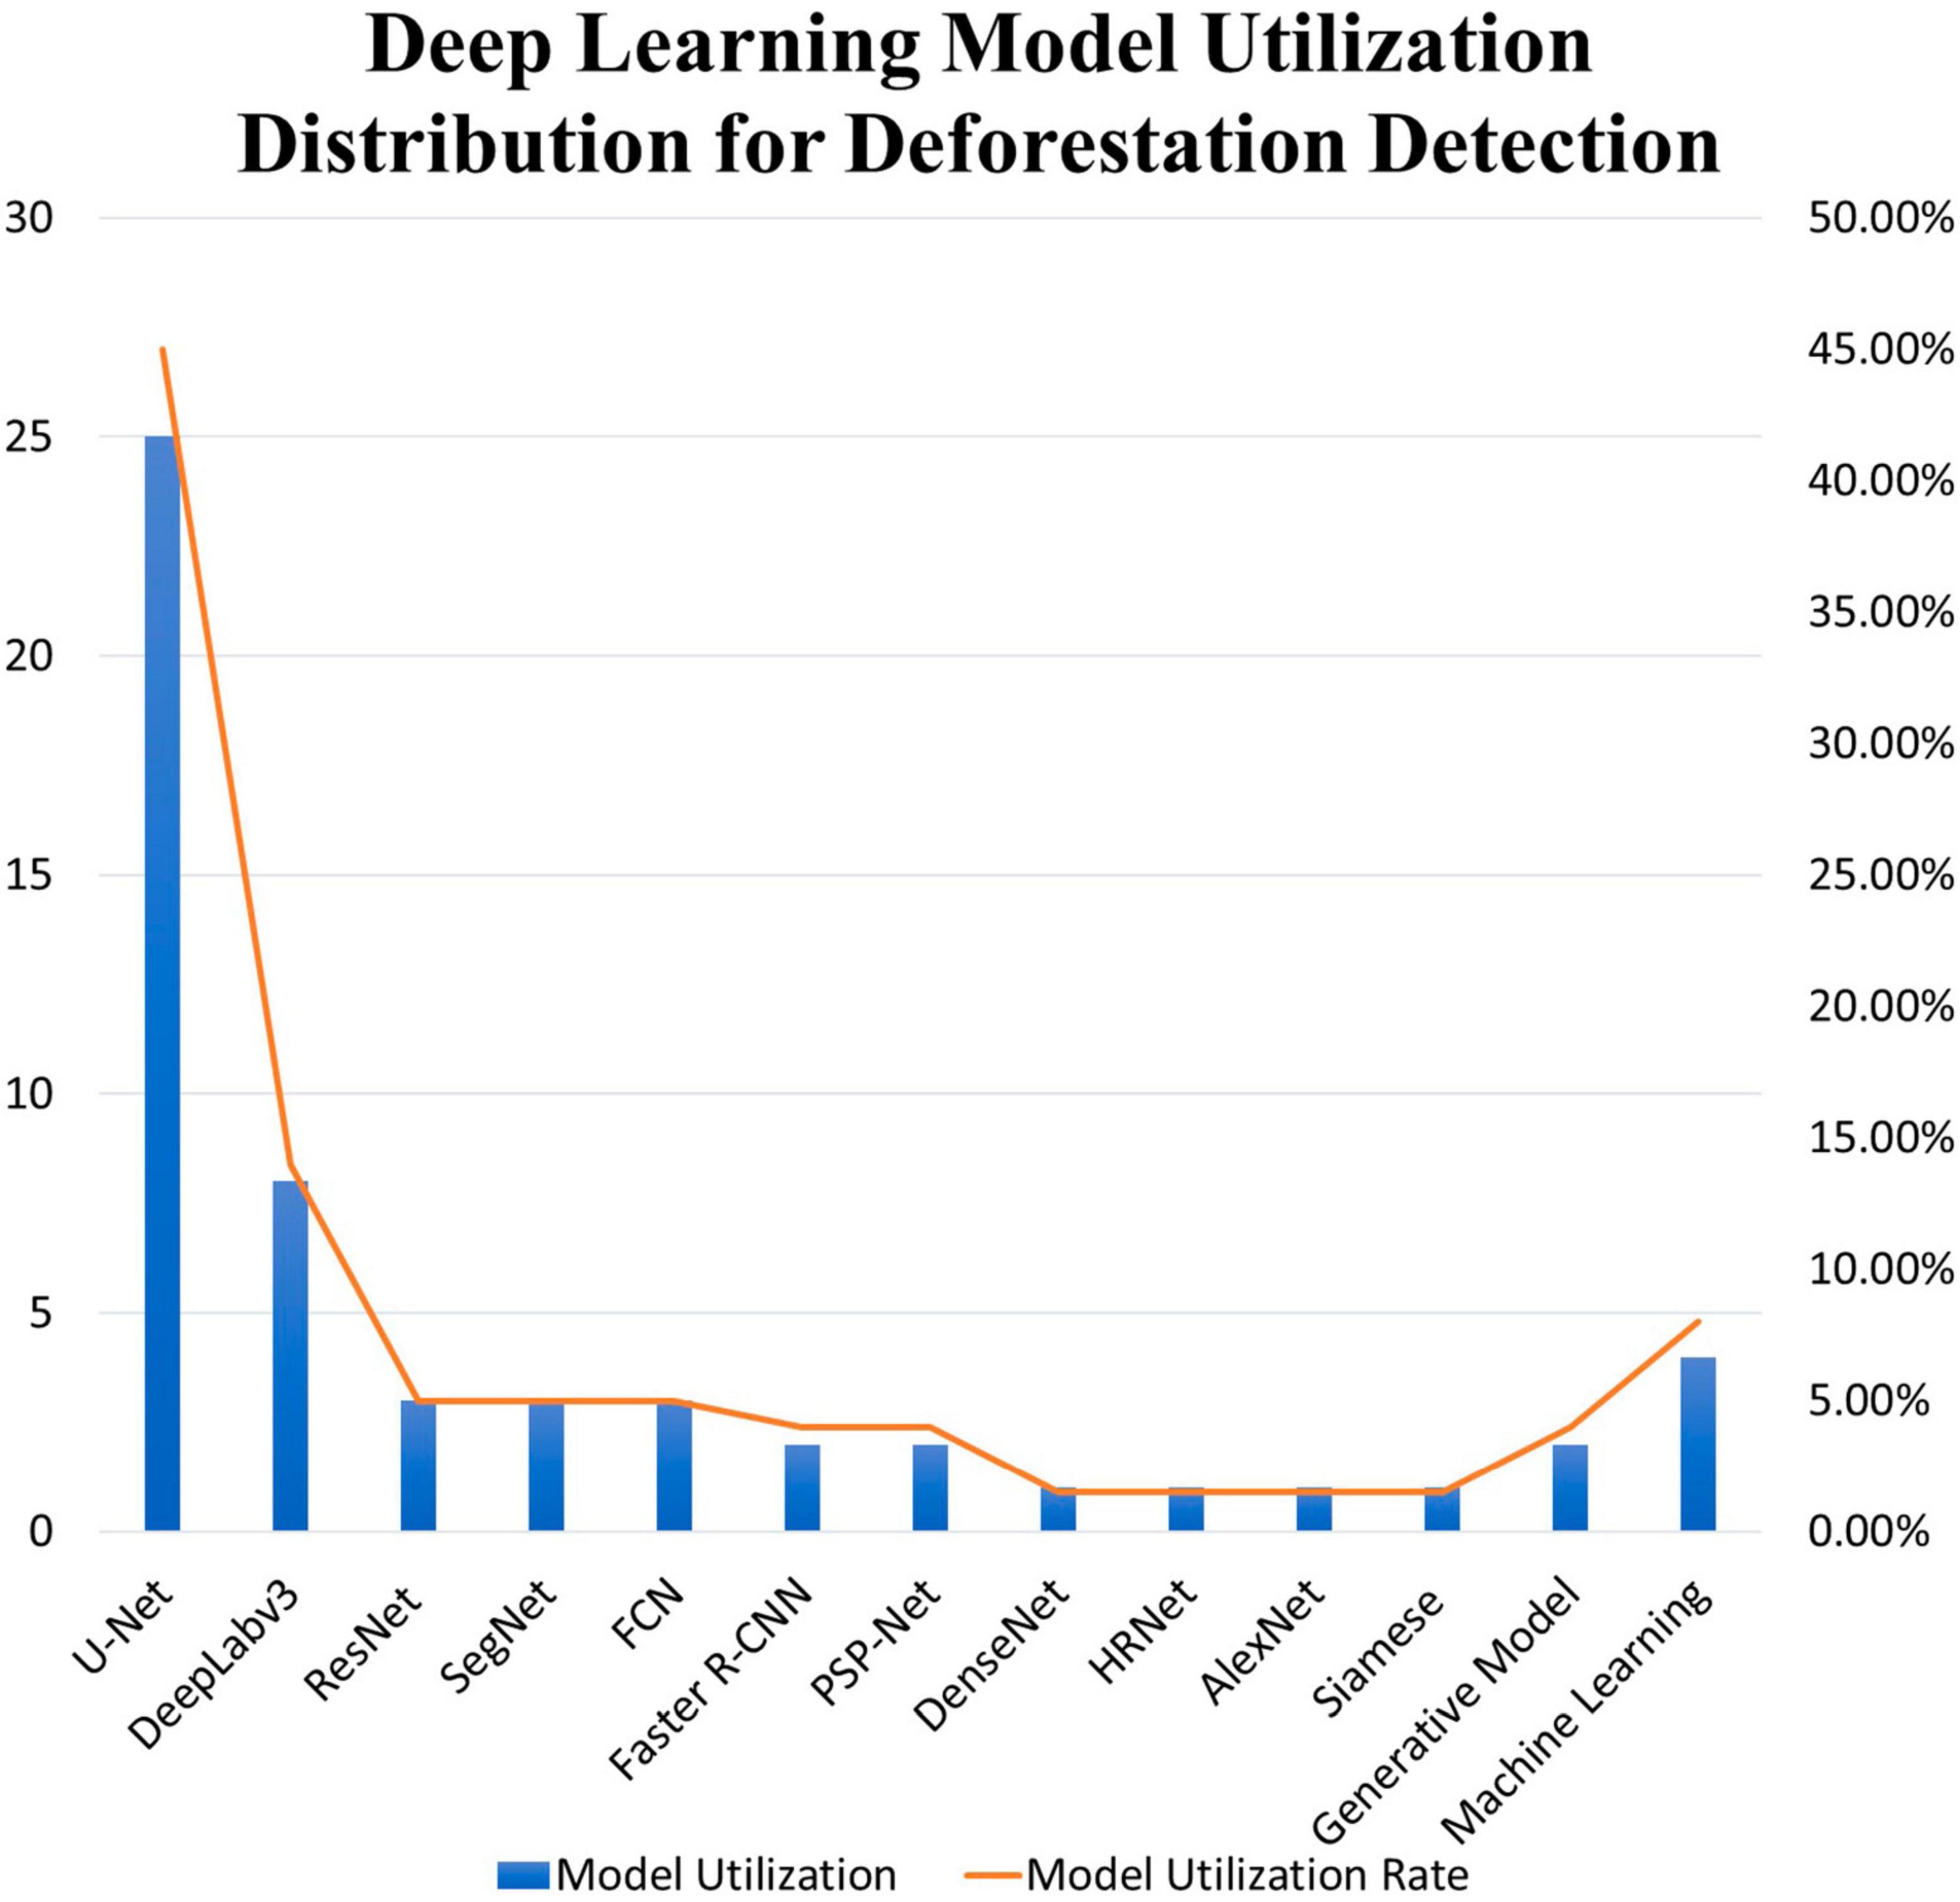
Figure 5. Deep learning architectures for deforestation detection.
Among the CNN models, U-Net and its variants have been extensively utilized for deforestation detection by 45% of the studies as either the primary architecture or as a benchmarking algorithm. The most remarkable performance was achieved by Wang et al. (2022), who have introduced a segmentation technique using U-Net model, coupled with ResNet50 as the backbone. Their approach outperformed other literature works in terms of accuracy. They demonstrated exceptional accuracy, achieving a remarkable 99.91%. Furthermore, they also reported a Mean Pixel Accuracy (mPA) of 92.81%, a Mean Intersection over Union (mIoU) of 89.24%, and a Frequency-Weighted Intersection over Union (FWIoU) of 99.89%. This impressive performance proves the effectiveness of their approach in accurately detecting deforested areas using satellite imaging data. Compared to other popular architectures, such as DeepLabv3 + and PSPNet, their results showed a notable improvement. Specifically, their method outperformed DeepLabv3 + by 0.02% and PSPNet by 0.1% in terms of accuracy. These findings are consistent with a prior study conducted by Torres et al. (2021), which also achieved similar levels of accuracy compared to Wang et al. (2022). They have employed a ResU-Net model that combined the advantages of both skip connections from U-Net and residual blocks from ResNet. This fusion of techniques has contributed to the promising results by extracting more finer patterns on the deforestation areas.
Besides U-Net CNN model, DeepLabV3 and its variant which is also a CNN model have emerged as notable contenders, in which 14% of the studies have utilized the model, both as a primary approach and as a benchmarking algorithm. Among the studies, the work by Morales et al. (2018) stands out with the most impressive results. Their work introduced a segmentation technique based on the DeepLabv3 + architecture, enhanced with additional complex layers, leading to superior performance compared to other benchmarked models. They have achieved remarkable results, demonstrating an accuracy of 98.143%, a specificity of 96.599%, and a sensitivity of 95.556%. These performances highlight the effectiveness of their approach in accurately identifying deforested areas using satellite input. Compared to the other four variants of U-Net, their findings showed substantial improvement, ranging from 0.354 to 2.063% in terms of accuracy increment. This underscores the competitive advantage of their DeepLabv3 + -based approach over the benchmarked architectures. The results reported in Morales et al. (2018) are also aligned with those from a previous study conducted in de Andrade et al. (2022), which also attained promising outcomes. However, it is worth to note that the work in de Andrade et al. (2022) utilized a different accuracy metric, which is F1-Score to assess their results. They employed a DeepLab-based Change Detection (DLCD-14) method, focusing on semantic segmentation for deforestation detection. There is consistent finding across these studies, in which they have highlighted the effectiveness and reliability of DeepLab-based approaches for deforestation detection. The remarkable accuracy, specificity, and sensitivity achieved by Morales et al. (2018) have demonstrated the potential of these techniques to contribute significantly to environmental monitoring and conservation efforts.
ResNet, SegNet, and FCN, along with their assorted variants constituting a comprehensive suite of CNN models, have each been featured in no fewer than three studies, collectively contributing to a 5% share per model in the research landscape included in this study. This triumvirate of architectures, established as the third most favored algorithms, is notably highlighted across a total of 9 studies. This combined impact amounts to a substantial 15% representation in the broader research domain, playing pivotal roles not only as main architectures but also as crucial benchmarking algorithms. Among these models, Guan et al. (2022) have achieved the best results using ResNet architecture. They introduced the DSA-ResNet model, comprising of three primary components: an input feature matrix, a feature extraction layer, and an output layer. The model also incorporates binary cross-entropy as a loss function to enhance network accuracy and evaluate the optimal weight matrices. Their results revealed that DSA-ResNet50 outperformed other models, including VGGNet, GoogleNet, the original ResNet, and an additional ResNet variant called SE-ResNet50. Specifically, DSA-ResNet50 achieved the best precision of 91.85%, recall percentage of 88.81%, F1-score of 90.30%, and a mean Intersection over Union (mIoU) of 82.31%. As for SegNet, the most impressive outcomes were reported by Torres et al. (2021). They have applied SegNet to two different datasets, namely Landsat-8 and Sentinel-2. For the Landsat-8 dataset, SegNet attained a Mean Overall Accuracy (OA) of 99.5%, recall of 52.7%, precision of 69.3%, and F1-score of 59.6%. On the other hand, for the Sentinel-2 dataset, SegNet achieved a Mean Overall Accuracy (OA) of 99.6%, recall of 55.4%, precision of 78.0%, and F1-score of 63.3%. Finally, Wang et al. (2022) reported the best results using the Fully Convolutional Network (FCN) model. They applied FCN with two different backbones, VGG16 and ResNet50. When VGG16 is used as the backbone network, FCN achieved a Pixel Accuracy (PA) of 99.67%, Mean Pixel Accuracy (Mean mPA) of 84.56%, mean Intersection over Union (mIoU) of 81.62%, and Frequency Weighted Intersection over Union (FWIoU) of 99.52%. On the other hand, when ResNet50 is used as the backbone network, FCN achieved a PA of 99.72%, Mean mPA of 84.74%, mIoU of 82.79%, and FWIoU of 99.63%.
In addition to the well-known deep learning architectures like U-Net, DeepLabV3, ResNet, and SegNet, there are other notable generative models that have been successfully employed for image segmentation and image classification tasks. Two such models are the Variational Autoencoder (VAE) and the Generative Adversarial Network (GAN), both of which leverage deep learning architectures for data generation tasks constituting a total 4% of the model usage over this literature study. In the study presented in Zerrouki et al. (2021), VAE demonstrated promising results with high accuracy, precision, and F1-Score, by achieving 98% accuracy, 98.9% precision, and a remarkable F1-Score of 98%. The True Positive Rate (TPR) was reported at 97.1%, indicating the model’s effectiveness in correctly identifying positive instances. Additionally, the False-Positive Rate (FPR) was notably low at 1.1%, suggesting the model’s ability to minimize false alarms. On the other hand, GAN, as described in Zerrouki et al. (2022), reported even more impressive performance. It achieved an accuracy of 99.3%, precision of 98.9%, and an outstanding F1-Score of 99.3%. The True Positive Rate (TPR) reached an impressive 99.7%, further highlighting the model’s capability to correctly identify positive instances. Similar to VAE, GAN also exhibited a high precision of 98.9% and a low False-Positive Rate (FPR) of 1.1%. Both VAE and GAN are generative models that offer distinct advantages in data generation tasks. VAE is known for its ability to generate new data samples while maintaining the underlying data distribution, making it valuable for data augmentation and generalization. On the other hand, GAN excels in generating synthetic data by training two competing neural networks, the generator, and the discriminator, leading to more realistic and diverse generated samples. These results demonstrated the potential of generative models in image segmentation and classification tasks. VAE and GAN can complement basic deep learning architectures, offering unique capabilities for data generation and expanding the possibilities of deep learning applications in various fields, including deforestation detection and environmental monitoring.
It is worth noting that conventional machine learning algorithms, such as Early Fusion (EF) (de Andrade et al., 2022), Multi-Task Learning (MTL) (Lu et al., 2022), and Random Forest (RF) (Dal Molin and Rizzoli, 2022), continue to be popular choices among researchers in the context of image segmentation, including for deforestation detection applications. These algorithms have been employed in 8% of the studies included in the final selection. However, it is important to highlight that, despite their popularity, none of the conventional machine learning algorithms performed better than the deep learning models used in the respective research. Among the machine learning algorithms, MTL stood out as it outperformed YOLOv5-s in several crucial metrics. Specifically, MTL achieved a significantly higher mean average precision (mAP) of 56.3%, average precision for small objects (APS) of 38.2%, and average recall for small objects (ARS) of 46.2%. These results indicate that MTL has a competitive advantage over YOLOv5-s in accurately detecting smaller objects, which is particularly relevant in tasks like deforestation detection, where identifying subtle changes in vegetation covers are essential.
Despite the strong performance of MTL, deep learning models remained the preferred choice due to their ability to automatically learn complex features from data and their proven success in image segmentation tasks. Deep learning architectures, such as the ones discussed previously (e.g., U-Net, DeepLabV3, ResNet, SegNet, and FCN), have consistently demonstrated state-of-the-art performance in deforestation detection, outperforming conventional machine learning algorithms. Furthermore, a study conducted by Lee et al. (2020) provided compelling evidence regarding the robustness of deep learning models in the context of deforestation detection. The research concluded that these deep learning models exhibit resilience and adaptability to changes in the aspect ratio of forest and non-forest images. This finding is significant as it highlights the versatility of deep learning models when analyzing satellite imagery with varying proportions of forested and non-forested areas. Such adaptability allows the models to effectively detect deforestation, even in scenarios where the spatial distribution of forests may differ substantially from the surrounding landscapes.
While these models demonstrate notable strengths, it’s essential to recognize their inherent limitations. Challenges such as the demand for extensive labeled datasets (Chiang et al., 2020), computational resources (Morales et al., 2018), and potential biases in training data (Lee et al., 2020) are common. Additionally, difficulties may arise in detecting deforestation within regions featuring irregularly shaped forests or highly variable land cover proportions (John and Zhang, 2022). The adaptability of deep learning models to handle diverse aspect ratios enhances their practical applicability in real-world scenarios, where satellite images may depict irregularly shaped forest regions or varying land cover proportions. These findings instill confidence in the reliability (Li et al., 2022) and generalizability (Gallwey et al., 2020) of deep learning-based models for deforestation detection systems, reinforcing their potential utility in environmental monitoring and conservation efforts. In conclusion, the discussed deep learning models provide a range of effective tools for deforestation detection. Understanding both their strengths and limitations is crucial for informed decision-making in environmental monitoring and conservation efforts. The ongoing evolution of these models, coupled with advancements in data generation techniques, promises exciting prospects for the future of deforestation detection and broader applications in environmental science.
The application of deep learning in deforestation detection showcases its suitability and potential in addressing various environmental challenges. The versatility of deep learning techniques is evident through their successful application in detecting deforestation, desertification, mining sites, and forest fires. The emphasis on directly detecting deforestation by a significant portion of the narrowed down researched studies (55%) underscores the urgency of combating deforestation incidences and the needs for effective monitoring methods.
Remote sensing through satellite imagery emerges as the preferred choice for large-scale deforestation detection and monitoring, constituting 64% of the utilized methods. The widespread coverage, frequent data updates, and cost-effectiveness of satellite imagery make it a powerful tool for understanding and managing deforestation at a regional or global scale. Conversely, UAVs offer valuable advantages for localized or targeted monitoring, providing high-resolution and detailed information for specific areas. Both remote sensing methods have their own advantages, and they can be deployed together to complement each other based on the study’s scope. However, for general monitoring purposes, satellite imagery proves superior in meeting the goals, budget, and spatial requirements of most deforestation monitoring projects.
In the evaluation of state-of-the-art deep learning models for deforestation detection, U-Net emerges as the most popular choice with a substantial 45% adoption rate and achieving the highest accuracy of 99.91%. Distinguished by its innovative use of skip connections, U-Net facilitates superior feature propagation within the segmentation network, rendering it exceptionally adept at handling limited labeled data and capturing intricate details. Following closely is DeepLabV3, the second most popular model at a 14% adoption rate, showcasing an impressive 98.143% accuracy in semantic segmentation tasks, particularly excelling in intricate landscapes such as forests. ResNet, SegNet, and FCN collectively shared the third position with each model contributing around 5% usage, respectively, highlighting their balanced representation in this research topic. ResNet utilization of residual blocks proves to be instrumental in enhancing the overall model precision to 91.85%. Meanwhile, SegNet’s encoder-decoder structure allows efficient memory usage that makes it suitable for resource-constrained environments, achieving a Mean Overall Accuracy (OA) of 99.5%. Despite FCN’s historic significance in advancing semantic segmentation with a Pixel Accuracy (PA) of 99.67%, the more recent architectures, U-Net and DeepLabV3, have outshone its performance in recent years. These results highlight the effectiveness of deep learning tools in addressing the complexities of deforestation detection and underscore the models’ versatility in tackling intricacies. They demonstrate not only high accuracy but also adaptability to specific challenges, providing valuable insights for developing resilient and efficient monitoring systems. This contribution significantly aids ongoing efforts to combat deforestation.
Two notable studies by Morales et al. (2018) and Torres et al. (2021) employed two distinct methodologies, showcasing diverse approaches and outcomes. Morales et al. (2018) utilized private UAV databases, incorporating images from TurboAce, Mavic Pro, and SkyRange. Using the DeepLabV3 model, they achieved an impressive 98.143% accuracy through 100 epochs of training with a learning rate of 0.003, a batch size of 16, and the Adaptive Moment Estimation (Adam) optimizer. In contrast, Torres et al. (2021) focused on the Amazon Forest, employing the Fully Convolutional Networks (FCN), U-Net, ResU-Net, SegNet, FC-DenseNet, Xception, and Deeplabv3 + models. Notably, SegNet demonstrated the best Mean Overall Accuracy of 99.5%. Their model was trained for 100 epochs with a learning rate of 0.0001, and a batch size of 16, utilizing the Adam optimizer with Weighted Cross-Entropy Loss. The comparative analysis reveals variations in data annotation, dataset selection, multiscale approaches, and data processing sequences, underscoring the adaptability of each methodology to specific challenges in forest monitoring and conservation.
For the comparison of deforestation detection algorithms based on UAV data, Wang et al. (2022) focused on evaluating the performance of popular deep models such as FCN, U-Net, PSPNet, and DeeplabV3 +. Their findings show that U-Net exhibited superior accuracy at 99.91%, emphasizing its efficacy in deforestation detection. Meanwhile, the FCN model demonstrated a robust accuracy performance of 99.67%, showcasing its effectiveness in accurately segmenting regions. The study employed consistent training configurations, utilizing a learning rate of 0.001, 600 epochs, a batch size of 8, and a binary cross-entropy loss function. In general, U-Net’s remarkable accuracy and FCN’s strong pixel accuracy underscore their potential suitability for deforestation detection tasks. Future research could delve deeper into individual model strengths and limitations, exploring considerations such as computational efficiency and resource requirements for real-world deployment.
Overall, deep learning, in combination with remote sensing technologies, offers powerful tools for accurately identifying and tracking deforestation activities. This improvement allows data-driven decision-making to be made for optimal conservation efforts, ultimately contributing to the preservation and sustainable management of our forests. As deep learning and remote sensing techniques continue to evolve, further enhancements are expected, providing even more effective solutions for addressing the critical issue of deforestation.
The emergence of Google Earth, incorporating Google Earth Engine (GEE), Google Earth Pro, and Google Maps, has ushered in a transformative era for deforestation assessment, forest redefinition, and global-scale monitoring. The intuitive interface of Google Earth provides a unique avenue for immersive exploration of high-resolution satellite imagery, fostering a profound understanding of deforestation dynamics. The capabilities of Google Earth are further amplified by GEE, offering on-demand access to an expansive repository of remote sensing data. This accessibility streamlines deforestation detection, exemplified by Alonso et al. (2020), who employed GEE to validate and verify findings using the PRODES and DETER databases from Landsat-8 Collection 1 Tier 1 and Sentinel-2 L1C. This integration not only streamlines evaluation but also contributes to the redefinition of forests at the national level, enabling countries to redefine and assess their forest boundaries with unprecedented precision, thanks to the aid of detailed imagery.
In a complementary vein, the study conducted by Hu et al. (2021) illuminates the diverse uses, benefits, and untapped potential of Google Earth in refining and augmenting data annotations. Utilizing visual analysis of Very High-Resolution (VHR) post-event optical images from Google Earth, the authors meticulously refined annotations, underscoring the platform’s versatility beyond a mere visualization tool. Leveraging the high-quality and up-to-date imagery offered by Google Earth, researchers enhanced the precision of their annotations, showcasing the platform’s utility for detailed and contextually rich analysis. This not only underscores immediate benefits in data refinement but also hints at the broader potential of Google Earth in enhancing various research methodologies across diverse domains. Hu et al.’s study sheds light on the multifaceted advantages and emerging possibilities associated with harnessing the capabilities of Google Earth in scientific endeavors.
Moreover, the global impact of forest loss is addressed through the scalability of assessments using Google Earth platforms. Dal Molin and Rizzoli (2022) illustration of the combination of different datasets, such as Sentinel-1 Interferometric Short Time Series (STS) and Landsat imagery, exemplifies the platform’s potential for global-scale mapping. The capability to superimpose footprints on aerial scenes using Google Earth images provides a comprehensive view of deforestation patterns on a larger scale. Furthermore, Google Earth Pro plays a pivotal role in ensuring the accuracy and reliability of deforestation assessments by enabling cross-referencing and validation of results against land use maps, as demonstrated by Wahab et al. (2021). This validation process enhances the robustness of deforestation assessments, providing a solid foundation for decision-making.
Looking toward the future, Giang et al. (2020) suggested that the usage of high-resolution imagery provided by Google Earth can further contribute to the improvements in land cover classification by using deep learning techniques. The platform provides detailed and up-to-date imagery, whereby it is perceived as a valuable resource for increasing the accuracy of training such models. The existence and integration of Google Earth platforms have not only streamlined deforestation assessments but also redefined the way nations approach their forest boundaries and enabled global-scale monitoring, marking a pivotal contribution to environmental monitoring and decision-making processes.
The primary hurdle encountered in training deep learning architectures lies in acquiring a substantial dataset. This challenge is exemplified in the work by de Andrade et al. (2022), where researchers have harnessed a staggering 1,716,000 images, comprising 40,392 deforestation-class samples and 1,675,608 non-deforestation samples. This approach aligns seamlessly with the methodology in (Gallwey et al., 2020), which employed a colossal set of 480,000 individual training images. However, the endeavor to amass a vast dataset needs not to be deemed as insurmountable, as manual augmentation techniques can be employed to further augment the dataset. Manual image augmentation techniques, as illustrated in Morales et al. (2018), involve basic rotation operators at 90°, 180°, and 270° angles. Furthermore, these rotated images can be further expanded by applying horizontal and vertical flipping, thereby significantly amplifying the dataset size.
Despite having access tested on extensive datasets, the state-of-the-art CNN-based deep learning models capability like U-Net, DeepLabV3, ResNet, SegNet, and FCN suffer from spatial-information loss and inadequate feature representation (Elizar et al., 2022). The fundamental cause of this issue primarily stems from their incapacity to comprehend the intricate contextual nuances across different scales, coupled with the omission of semantic insights, especially during pooling operations. As a CNN commences its operation, it initially encodes elementary semantic components such as edges and corners, progressively evolving to capture more intricate semantic attributes, exemplified by complex geometric shapes. In theory, enabling CNNs to extract features spanning various levels of semantic representation holds a significant advantage, as tasks like classification and segmentation greatly benefit from the fusion of both simple and complex feature maps. Consequently, the integration of multiscale capabilities across the entire network emerges as a pivotal factor, facilitating the comprehensive capture of diverse feature scales to effectively represent the intended task. This inherent multiscale representation empowers the network to seamlessly integrate low-level and high-level features from confined receptive fields, thereby significantly enhancing the overall performance of deep models.
A categorization of multiscale approaches in deep-learning networks, as classified in (Elizar et al., 2022), encompasses two main groups: Multiscale Feature Learning and Multiscale Feature Fusion. The former involves techniques such as Multiscale CNN, Spatial Pyramid Pooling, and Atrous Spatial Pyramid Pooling. The latter involves techniques such as Multiscale Feature Fusion, comprised of Image-level Fusion and Feature-level Fusion, whereby the latter further encompasses Early Fusion and Late Fusion. This comprehensive taxonomy of multiscale-deep-learning architecture is depicted in Figure 6.
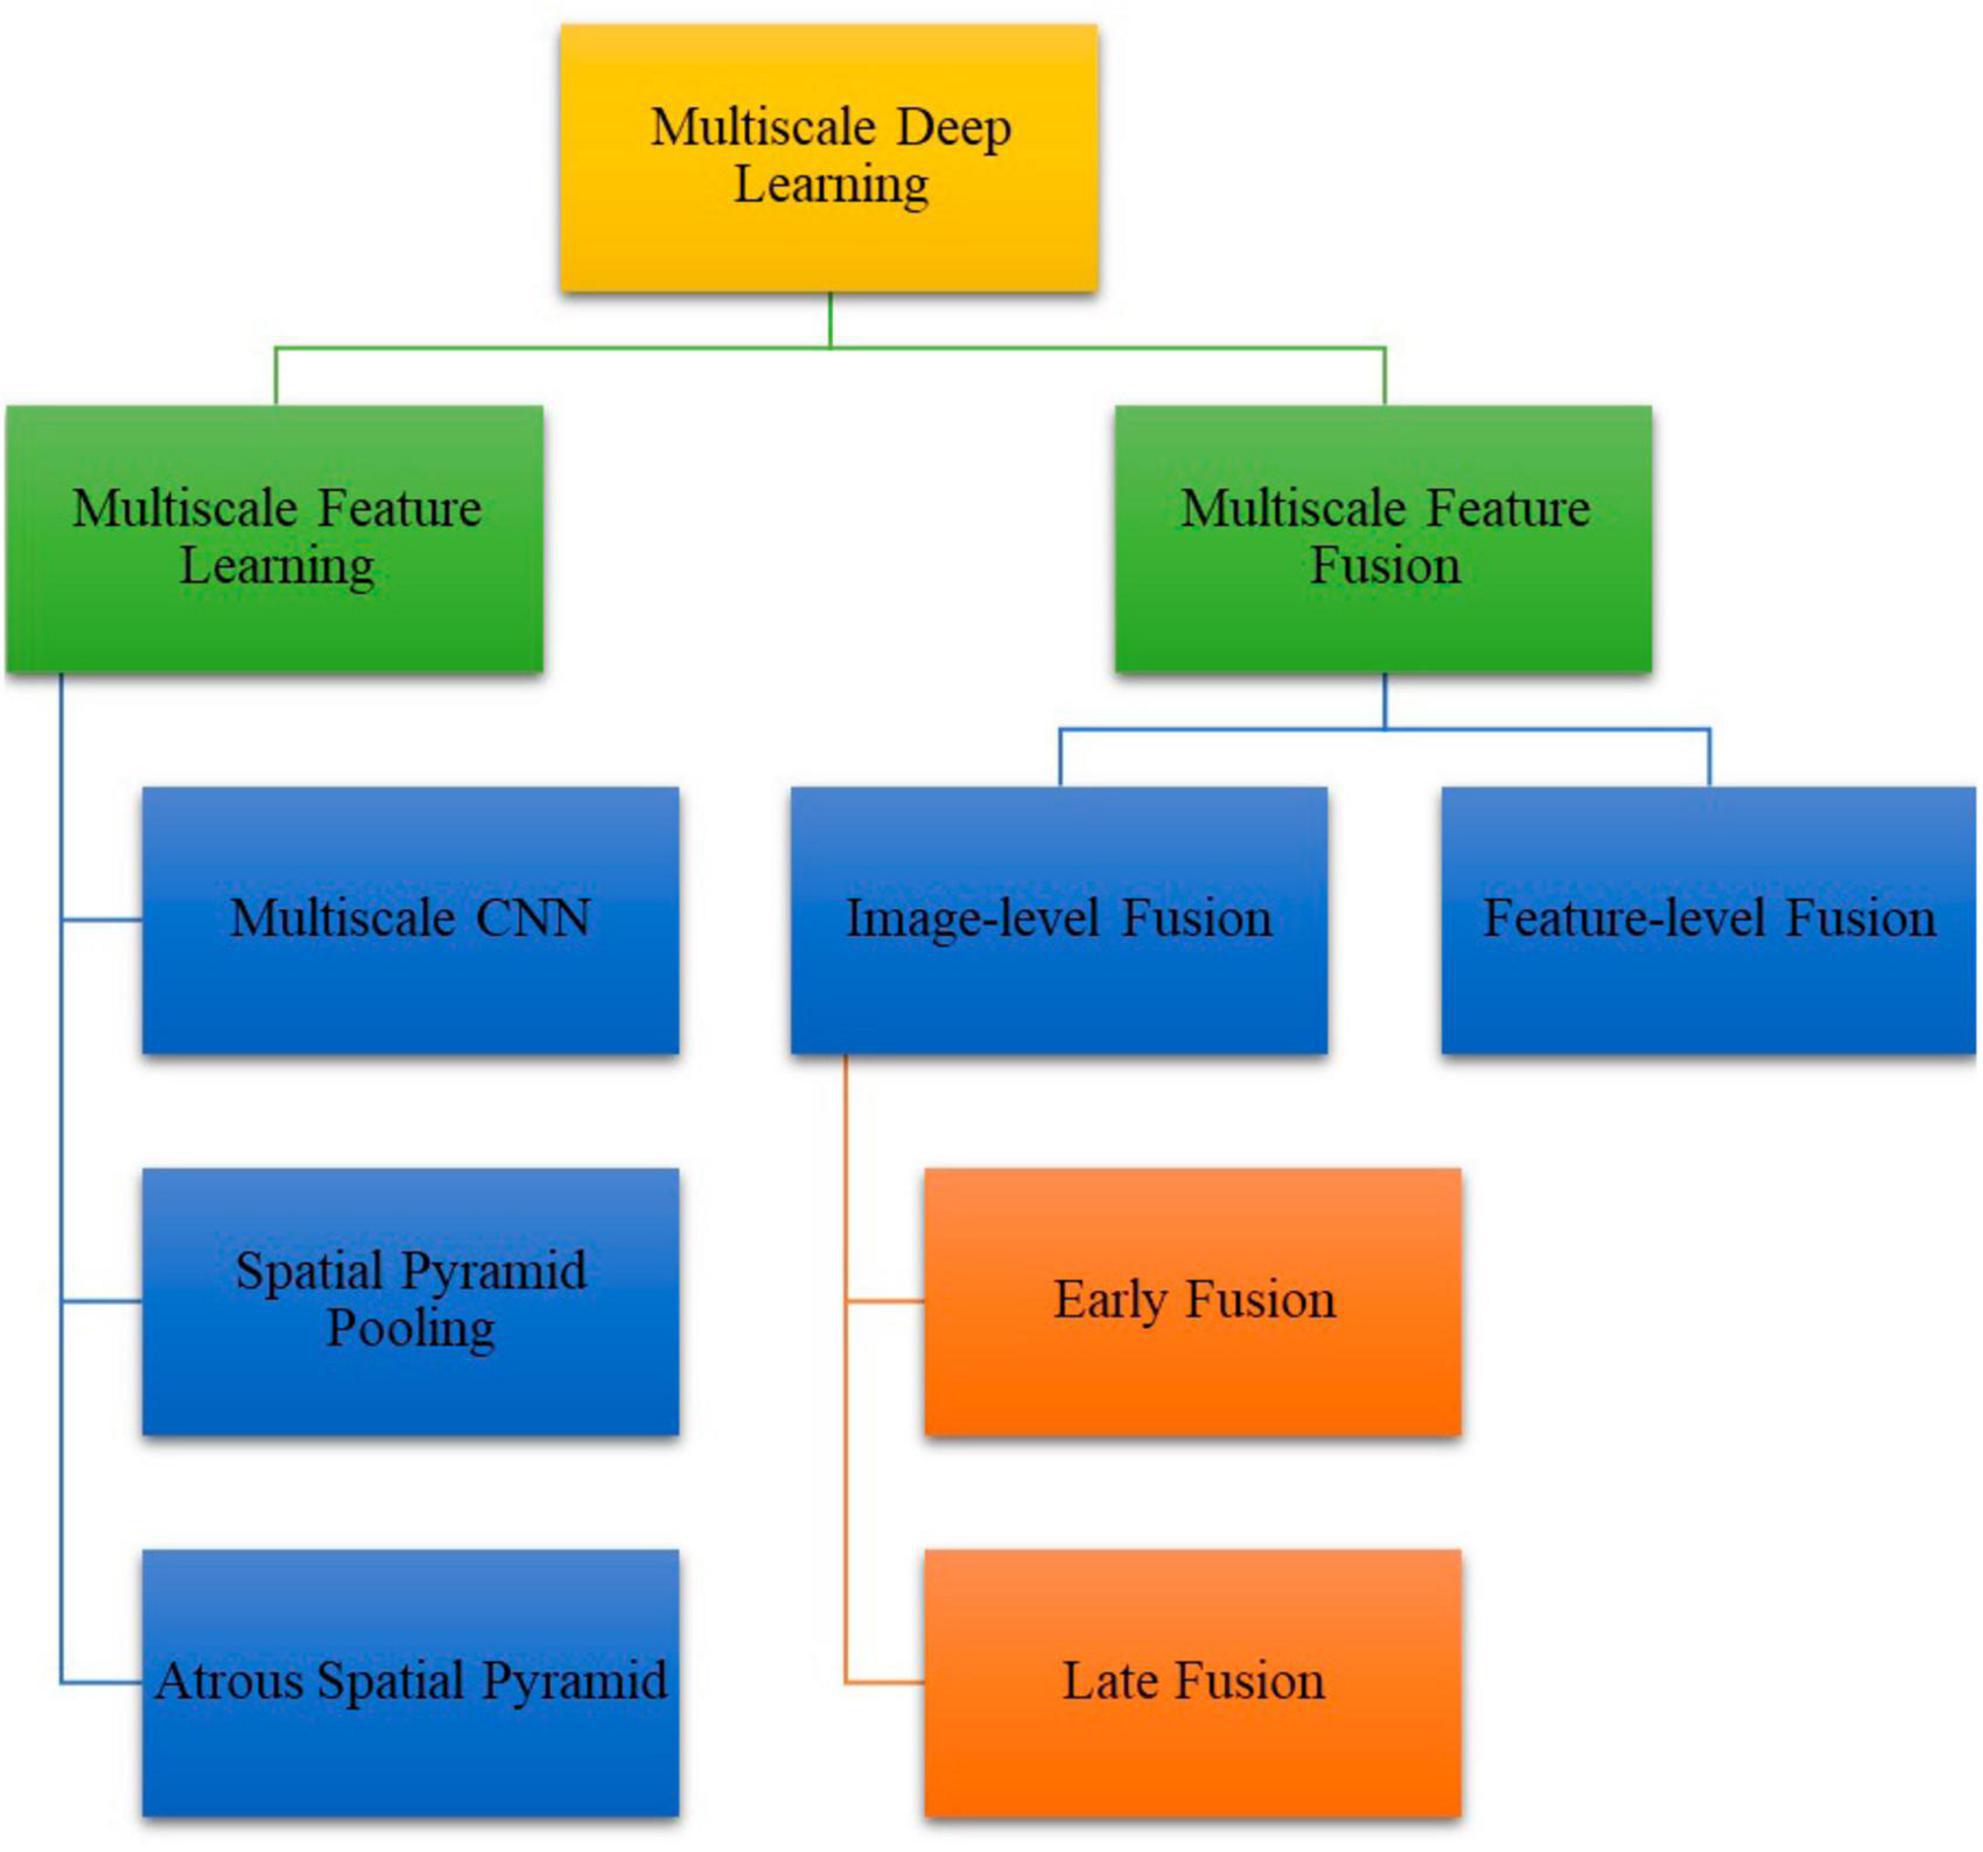
Figure 6. The comprehensive taxonomy of multiscale-deep-learning architecture employed for classification and segmentation objectives.
Of the diverse multiscale techniques, Atrous Spatial Pyramid Pooling (ASPP) and Spatial Pyramid Pooling (SPP) stand out prominently, a point underscored in Stofa et al. (2022). Building upon this, they introduced four innovative architectural variations based on ASPP and SPP, namely Direct Atrous Spatial Pyramid Pooling (DASPP-Net), Waterfall Atrous Spatial Pyramid Pooling (WASPP-Net), Direct Spatial Pyramid Pooling (DSPP-Net), and Waterfall Spatial Pyramid Pooling (WSPP-Net). Out of these four variants, WASPP-Net performs the best and shows the potential of strategically positioning the ASPP units can enhance the accuracy of leading-edge CNN architectures. Additionally, findings in (Ru et al., 2023) also indicate that a modified U-Net augmented with an SPP unit at the bottleneck layer demonstrated increased performance, yielding an accuracy of 86.71%, intersection over union (IoU) of 75.59%, and an F1-score of 82.88%. Of significance, the SPP unit placement is not optimized yet and there is a possibility of further performance increment through exploring different layers of the U-Net architecture for the SPP unit integration.
As a deep learning architecture achieves exceptional performance on training data through a substantial dataset and strategic multiscale unit placement, it may excel during training, but it may experience significant performance degradation during test phase. This is a pervasive issue in deep learning, referred to as overfitting, whereby a model becomes exceptionally proficient during training phase yet struggles to generalize effectively to new unseen data (Zulkifley et al., 2021). The overfit model inadvertently captures the noise and fluctuations present in the training data rather than the fundamental underlying patterns, representative of the intended problem. In essence, overfitting leads to the model memorizing training examples, including their noise and outliers, rather than discerning the fundamental relationships and features for accurate predictions on new data.
One approach to tackle overfitting challenge is by incorporating an attention mechanism into the deep learning architecture. In this context, the work in Zulkifley et al. (2021) introduced the Attention-Xception Network (AXNet), which strategically guides the network to allocate more weight to specific image regions by integrating it with the Xception architecture. The results underscore that implementing the attention mechanism enhances network capabilities by emphasizing weights on selected regions of interest, as evidenced by the attention maps.
Another effective approach to address overfitting involves the integration of group and shuffle techniques. In Abdani et al. (2021), the authors enhanced the FC-DenseNet-103 by embedding the group and shuffle convolution module to further increased segmentation accuracy. Group convolution enables training networks with distinct sets of filters, thereby preventing the network from converging into a few dominant filters. Concurrently, shuffle operation diversifies the input to the group convolutions, effectively shuffling channels across different groups. This integration of group and shuffle convolution modules bolsters the network capability in learning unique features, yielding better performance.
Both of these approaches’ present avenues for further exploration in enhancing existing CNN-based deep learning models. By integrating attention mechanisms and group shuffle convolution techniques, the potential for enhanced segmentation accuracy as well as reduced computational overhead might become feasible, and they merit further comprehensive investigation.
In conclusion, this comprehensive literature review has provided a detailed examination of the application of deep learning techniques in deforestation detection through classification and segmentation tasks based on satellite imaging input. The critical importance of monitoring deforestation for environmental preservation and conservation efforts cannot be overstated, and this review has shed light on the remarkable potential of deep learning models to address this pressing challenge.
The review showcased a range of state-of-the-art deep learning architectures, such as U-Net, DeepLabV3, ResNet, SegNet, and FCN, which have significantly advanced the accuracy and efficiency of deforestation detection. Through their adaptability to diverse landscapes and varying scales and proportions of forested and non-forested areas, these models have demonstrated their effectiveness in detecting deforestation even in complex and irregularly shaped forest regions. This adaptability feature holds promise for real-world application where accurate deforestation detection is vital.
The exploration of multiscale feature learning, attention mechanisms, and group convolution techniques further highlights the ongoing efforts to enhance the accuracy and generalization capability of deep learning models. These strategies not only address issues such as spatial-information loss and overfitting but also contribute to the development of more robust and reliable models for deforestation detection.
In the face of escalating environmental concerns, it is imperative that we harness the potential of cutting-edge technologies to counteract the effects of deforestation. The convergence of integrated remote sensing and deep learning technologies embody a promising avenue for creating a positive impact on global forest conservation. As we advance into the future, the knowledge gained from this review will undoubtedly contribute to the development of more accurate, efficient, and accessible methods for detecting and mitigating deforestation, thereby ensuring the sustainable management of our invaluable forest resources.
The original contributions presented in the study are included in the article/supplementary material, further inquiries can be directed to the corresponding author.
IM: Writing – original draft, Writing – review and editing. MZ: Writing – original draft, Writing – review and editing. MA: Writing – review and editing. MS: Writing – review and editing.
The author(s) declare financial support was received for the research, authorship, and/or publication of this article. This research was funded by Ministry of Higher Education Malaysia under the Fundamental Research Grant Scheme with grant number FRGS/1/2022/TK07/UKM/02/4 and Asia Pacific Telecommunity under the EBC-K Contribution Grant (KK-2022-026).
The authors declare that the research was conducted in the absence of any commercial or financial relationships that could be construed as a potential conflict of interest.
The author(s) declared that they were an editorial board member of Frontiers, at the time of submission. This had no impact on the peer review process and the final decision.
All claims expressed in this article are solely those of the authors and do not necessarily represent those of their affiliated organizations, or those of the publisher, the editors and the reviewers. Any product that may be evaluated in this article, or claim that may be made by its manufacturer, is not guaranteed or endorsed by the publisher.
Abdani, S. R., Zulkifley, M. A., and Zulkifley, N. H. (2021). Group and shuffle convolutional neural networks with pyramid pooling module for automated pterygium segmentation. Diagnostics 11:1104. doi: 10.3390/diagnostics11061104
Alonso, D., Quispe, J., and Sulla-Torres, J. (2020). Automatic building change detection on aerial images using convolutional neural networks and handcrafted features. Int. J. Adv. Comput. Sci. Appl. 11, 679–684. doi: 10.14569/IJACSA.2020.0110683
Alzu’bi, A., and Alsmadi, L. (2022). Monitoring deforestation in Jordan using deep semantic segmentation with satellite imagery. Ecol. Inform. 70:101745. doi: 10.1016/j.ecoinf.2022.101745
Bragagnolo, L., da Silva, R. V., and Grzybowski, J. M. V. (2021). Amazon forest cover change mapping based on semantic segmentation by U-Nets. Ecol. Inform. 62:101279. doi: 10.1016/j.ecoinf.2021.101279
Chen, S. Y., Lin, C., Li, G. J., Hsu, Y. C., and Liu, K. H. (2021). Hybrid deep learning models with sparse enhancement technique for detection of newly grown tree leaves. Sensors 21:2077. doi: 10.3390/s21062077
Chiang, C. Y., Barnes, C., Angelov, P., and Jiang, R. (2020). Deep learning-based automated forest health diagnosis from aerial images. IEEE Access 8, 144064–144076. doi: 10.1109/ACCESS.2020.3012417
Cho, S. H., and Shin, I. S. (2021). A reporting quality assessment of systematic reviews and meta-analyses in sports physical therapy: A review of reviews. Healthcare 9:1368. doi: 10.3390/healthcare9101368
Dal Molin, R., and Rizzoli, P. (2022). Potential of convolutional neural networks for forest mapping using sentinel-1 interferometric short time series. Remote Sens. 14:381. doi: 10.3390/rs14061381
de Andrade, R. B., Mota, G. L. A., and da Costa, G. A. O. P. (2022). Deforestation detection in the amazon using DeepLabv3+ semantic segmentation model variants. Remote Sens. 14:4694. doi: 10.3390/rs14194694
Dostálová, A., Wagner, W., Milenković, M., and Hollaus, M. (2018). Annual seasonality in Sentinel-1 signal for forest mapping and forest type classification. Int. J. Remote Sens. 39, 7738–7760. doi: 10.1080/01431161.2018.1479788
Elizar, E., Zulkifley, M. A., Muharar, R., Zaman, M. H. M., and Mustaza, S. M. (2022). A review on multiscale-deep-learning applications. Sensors 22:7384. doi: 10.3390/s22197384
Gallwey, J., Robiati, C., Coggan, J., Vogt, D., and Eyre, M. (2020). A Sentinel-2 based multispectral convolutional neural network for detecting artisanal small-scale mining in Ghana: Applying deep learning to shallow mining. Remote Sens. Environ. 248:111970. doi: 10.1016/j.rse.2020.111970
Giang, T. L., Dang, K. B., Le, Q. T., Nguyen, V. G., Tong, S. S., and Pham, V. M. (2020). U-net convolutional networks for mining land cover classification based on high-resolution UAV imagery. IEEE Access 8, 186257–186273. doi: 10.1109/ACCESS.2020.3030112
Guan, Z., Miao, X., Mu, Y., Sun, Q., Ye, Q., and Gao, D. (2022). Forest fire segmentation from aerial imagery data using an improved instance segmentation model. Remote Sens. 14:3159. doi: 10.3390/rs14133159
Hansen, J. N., Mitchard, E. T. A., and King, S. (2020). Assessing forest/non-forest separability using sentinel-1 C-band synthetic aperture radar. Remote Sens. 12:1899. doi: 10.3390/rs12111899
Hiebl, M. R. W. (2023). Sample selection in systematic literature reviews of management research. Organ. Res. Methods 26, 229–261. doi: 10.1177/1094428120986851
Hu, X., Ban, Y., and Nascetti, A. (2021). Uni-temporal multispectral imagery for burned area mapping with deep learning. Remote Sens. 13:1509. doi: 10.3390/rs13081509
Isaienkov, K., Yushchuk, M., Khramtsov, V., and Seliverstov, O. (2021). Deep learning for regular change detection in ukrainian forest ecosystem with sentinel-2. IEEE J. Select. Top. Appl. Earth Obs. Remote Sens. 14, 364–376. doi: 10.1109/JSTARS.2020.3034186
John, D., and Zhang, C. (2022). An attention-based U-Net for detecting deforestation within satellite sensor imagery. Int. J. Appl. Earth Obs. Geoinform. 107:102685. doi: 10.1016/j.jag.2022.102685
Lee, S. H., Han, K. J., Lee, K., Lee, K. J., Oh, K. Y., and Lee, M. J. (2020). Classification of landscape affected by deforestation using high-resolution remote sensing data and deep-learning techniques. Remote Sens. 12:3372. doi: 10.3390/rs12203372
Li, G., Han, W., Huang, S., Ma, W., Ma, Q., and Cui, X. (2021). Extraction of sunflower lodging information based on uav multi-spectral remote sensing and deep learning. Remote Sens. 13:2721. doi: 10.3390/rs13142721
Li, L., Mu, X., Chianucci, F., Qi, J., Jiang, J., Zhou, J., et al. (2022). Ultrahigh-resolution boreal forest canopy mapping: Combining UAV imagery and photogrammetric point clouds in a deep-learning-based approach. Int. J. Appl. Earth Obs. Geoinform. 107:102686. doi: 10.1016/j.jag.2022.102686
Lu, K., Huang, J., Li, J., Zhou, J., Chen, X., and Liu, Y. (2022). MTL-FFDET: A multi-task learning-based model for forest fire detection. Forests 13:1448. doi: 10.3390/f13091448
Morales, G., Kemper, G., Sevillano, G., Arteaga, D., Ortega, I., and Telles, J. (2018). Automatic segmentation of Mauritia flexuosa in unmanned aerial vehicle (UAV) imagery using deep learning. Forests 9:736. doi: 10.3390/f9120736
Munn, Z., Peters, M. D. J., Stern, C., Tufanaru, C., McArthur, A., and Aromataris, E. (2018). Systematic review or scoping review? Guidance for authors when choosing between a systematic or scoping review approach. BMC Med. Res. Methodol. 18:143. doi: 10.1186/s12874-018-0611-x
Prabowo, Y., Sakti, A. D., Pradono, K. A., Amriyah, Q., Rasyidy, F. H., Bengkulah, I., et al. (2022). Deep learning dataset for estimating burned areas: Case study. Indonesia. Data 7:78. doi: 10.3390/data7060078
Puhm, M., Deutscher, J., Hirschmugl, M., Wimmer, A., Schmitt, U., and Schardt, M. (2020). A near real-time method for forest change detection based on a structural time series model and the Kalman filter. Remote Sens. 12:3135. doi: 10.3390/RS12193135
Pulella, A., Santos, R. A., Sica, F., Posovszky, P., and Rizzoli, P. (2020). Multi-temporal sentinel-1 backscatter and coherence for rainforest mapping. Remote Sens. 12:847. doi: 10.3390/rs12050847
Ru, F. X., Zulkifley, M. A., Abdani, S. R., and Spraggon, M. (2023). Forest segmentation with spatial pyramid pooling modules: A surveillance system based on satellite images. Forests 14:405. doi: 10.3390/f14020405
Scepanovic, S., Antropov, O., Laurila, P., Rauste, Y., Ignatenko, V., and Praks, J. (2021). Wide-area land cover mapping with sentinel-1 imagery using deep learning semantic segmentation models. IEEE J. Select. Top. Appl. Earth Obs. Remote Sens. 14, 10357–10374. doi: 10.1109/JSTARS.2021.3116094
Stofa, M. M., Zulkifley, M. A., and Zainuri, M. A. A. M. (2022). Micro-expression-based emotion recognition using waterfall Atrous spatial pyramid pooling networks. Sensors 22, 4634. doi: 10.3390/s22124634
Torres, D. L., Turnes, J. N., Vega, P. J. S., Feitosa, R. Q., Silva, D. E., Marcato Junior, J., et al. (2021). Deforestation detection with fully convolutional networks in the amazon forest from landsat-8 and sentinel-2 images. Remote Sens. 13:5084. doi: 10.3390/rs13245084
Tran, D. Q., Park, M., Jung, D., and Park, S. (2020). Damage-map estimation using uav images and deep learning algorithms for disaster management system. Remote Sens. 12:4169. doi: 10.3390/rs12244169
Wagner, F. H., Dalagnol, R., Casapia, X. T., Streher, A. S., Phillips, O. L., Gloor, E., et al. (2020). Regional mapping and spatial distribution analysis of Canopy palms in an Amazon Forest using deep learning and VHR images. Remote Sens. 12:2225. doi: 10.3390/rs12142225
Wahab, M. A. A., Surin, E. S. M., Nayan, N. M., and Rahman, H. (2021). Mapping deforestation in permanent forest reserve of peninsular malaysia with multi-temporal SAR imagery and U-Net based semantic segmentation. Malaysian J. Comput. Sci. 2021, 15–34. doi: 10.22452/mjcs.sp2021no2.2
Wang, Z., Peng, T., and Lu, Z. (2022). Comparative research on forest fire image segmentation algorithms based on fully convolutional neural networks. Forests 13:1133. doi: 10.3390/f13071133
Wieland, M., Li, Y., and Martinis, S. (2019). Multi-sensor cloud and cloud shadow segmentation with a convolutional neural network. Remote Sens. Environ. 230:111203. doi: 10.1016/j.rse.2019.05.022
Yu, H., Ni, W., Zhang, Z., Sun, G., and Zhang, Z. (2020). Regional forest mapping over mountainous areas in northeast China using newly identified critical temporal features of sentinel-1 backscattering. Remote Sens. 12:1485. doi: 10.3390/RS12091485
Zerrouki, N., Dairi, A., Harrou, F., Zerrouki, Y., and Sun, Y. (2022). Efficient land desertification detection using a deep learning-driven generative adversarial network approach: A case study. Concurr. Comput. 34, 1–14. doi: 10.1002/cpe.6604
Zerrouki, Y., Harrou, F., Zerrouki, N., Dairi, A., and Sun, Y. (2021). Desertification detection using an improved variational autoencoder-based approach through ETM-landsat satellite data. IEEE J. Select. Top. Appl. Earth Obs. Remote Sens. 14, 202–213. doi: 10.1109/JSTARS.2020.3042760
Zulkifley, M. A., Mohamed, N. A., Abdani, S. R., Kamari, N. A. M., Moubark, A. M., and Ibrahim, A. A. (2021). Intelligent bone age assessment: An automated system to detect a bone growth problem using convolutional neural networks with attention mechanism. Diagnostics 11:765. doi: 10.3390/diagnostics11050765
Keywords: deforestation, segmentation, deep learning, remote sensing, satellite imagery
Citation: Md Jelas I, Zulkifley MA, Abdullah M and Spraggon M (2024) Deforestation detection using deep learning-based semantic segmentation techniques: a systematic review. Front. For. Glob. Change 7:1300060. doi: 10.3389/ffgc.2024.1300060
Received: 29 September 2023; Accepted: 22 January 2024;
Published: 02 February 2024.
Edited by:
Ce Zhang, University of Bristol, United KingdomCopyright © 2024 Md Jelas, Zulkifley, Abdullah and Spraggon. This is an open-access article distributed under the terms of the Creative Commons Attribution License (CC BY). The use, distribution or reproduction in other forums is permitted, provided the original author(s) and the copyright owner(s) are credited and that the original publication in this journal is cited, in accordance with accepted academic practice. No use, distribution or reproduction is permitted which does not comply with these terms.
*Correspondence: Mohd Asyraf Zulkifley, YXN5cmFmLnp1bGtpZmxleUB1a20uZWR1Lm15
Disclaimer: All claims expressed in this article are solely those of the authors and do not necessarily represent those of their affiliated organizations, or those of the publisher, the editors and the reviewers. Any product that may be evaluated in this article or claim that may be made by its manufacturer is not guaranteed or endorsed by the publisher.
Research integrity at Frontiers
Learn more about the work of our research integrity team to safeguard the quality of each article we publish.