 Margot Vanhellemont
 Anja Leyman
 Leen Govaere
 Luc De Keersmaeker1
 Kris Vandekerkhove
94% of researchers rate our articles as excellent or good
Learn more about the work of our research integrity team to safeguard the quality of each article we publish.
Find out more
ORIGINAL RESEARCH article
Front. For. Glob. Change, 06 February 2024
Sec. Forest Management
Volume 7 - 2024 | https://doi.org/10.3389/ffgc.2024.1236203
This article is part of the Research TopicNatural Forests for a Safe Climate: Enhancing Ecosystem Integrity, Biodiversity and Adaptive Capacity for Climate MitigationView all 11 articles
Introduction: In situ carbon sequestration in forests is important in the context of climate change mitigation, and setting aside managed forests has been proposed as an option for increased carbon sequestration. Comparing set-aside and managed forests may provide insights and rules of thumb on the potential for additional in situ carbon sequestration in set-aside forest.
Methods: In an observational study, we compared re-inventory data from the network of set-aside forest reserves in Flanders, which have been unmanaged for 17–66 years (2 surveys with a 10 years interval), with re-inventory data from the regional forest inventory, representing the overall forest area in Flanders (2 surveys with a 15 years interval).
Results: The aboveground carbon pools and sequestration rates were higher in the set-aside forests compared to the average forest in Flanders. In the average Flemish forest, the aboveground carbon pool increased from 64.7 to 85.1 tC ha−1, over a period of 15 years. In the set-aside forests, the mean pool was higher at the first measurement and further increased from 84.8 to 102.4 tC ha−1, over a period of 10 years. The mean aboveground annual carbon sequestration rate was 1.3 tC ha−1 year−1 in the average forest in Flanders and 1.8 tC ha−1 year−1 in the set-aside forests. The stocks and fluxes depended on the soil conditions and were higher in set-aside forests on silt and sandy silt sites compared to wet and sand sites. The set-aside forests on dry sites showed additionality in in situ aboveground carbon sequestration. We saw no indication of approaching a culmination point in the first decades following set-aside: plots with high carbon pools did not show lower carbon sequestration. In conclusion, set-aside forests can combine high carbon pools with high sequestration rates on suitable sites. Under the current management policy, we expect Flemish forests—regular and set-aside—to further increase their carbon pools in the coming decades.
The Fit for 55 package of the European Union set ambitious net carbon removal targets in the land use, land use change and forestry (LULUCF) sector, i.e., minimum 310 Mt. CO2 equivalent by 2030. The European Union primarily relies on its forests to reach this target. Forests represent important carbon stocks (Luyssaert et al., 2008), providing carbon sequestration in situ, both above- and belowground (Pregitzer and Euskirchen, 2004). As such, forests can be used as carbon offsets to reach carbon neutrality, and carbon sequestration has become an important forest management objective. However, the impact of forest management and the potential of forests as carbon sinks is not yet fully understood (Hoover et al., 2012; Ameray et al., 2021), and carbon stocks and sequestration do differ between forest types and regions (Hoover and Smith, 2021; Matuszkiewicz et al., 2021).
In their concept of proforestation, Moomaw et al. (2019) advocated setting aside existing forests to further develop as unmanaged ecosystems as a low-cost approach with immediate effect to increase sequestration of atmospheric carbon. Yet, the role of set-aside forests in carbon removal is debated. The capacity for carbon sequestration in biomass, combining storage in situ and ex situ, has been argued to be higher under intensive forest management, in the short term (Ameray et al., 2021), and old unmanaged forests have long been considered carbon neutral, containing a large carbon stock but providing little or no significant carbon sink (Seedre et al., 2015; Nord-Larsen et al., 2019; Meyer et al., 2021). However, carbon stocks have been found to increase with forest stand age in all biomes (Pregitzer and Euskirchen, 2004), and even unmanaged primary forests have been demonstrated to still steadily accumulate carbon for centuries (Luyssaert et al., 2008). In the debate on the role of managed vs. unmanaged forests in climate change mitigation, a forest’s potential to accumulate or sequester carbon and its capacity to store carbon in carbon stocks are complementary and should be assessed separately. Aboveground carbon stocks in unmanaged compared to managed forest stands have been found to be either larger (Mund, 2004; Nunery and Keeton, 2010; Burton et al., 2013; Keith et al., 2014; Ford and Keeton, 2017; Glatthorn et al., 2018; Matuszkiewicz et al., 2021) or similar (Mund, 2004; Ford and Keeton, 2017; Schaedel et al., 2017; Glatthorn et al., 2018; Bouriaud et al., 2019), depending on the silvicultural management studied. Ameray et al. (2021), in their review of forest carbon management, found extensive forest management to be an intermediate compromise between the high short-term carbon sequestration of intensive forest management and the greater carbon stocks in conservation forests.
In regions with a long history of intensive forest management and no remaining primary forests (e.g., north-western or central Europe), the aboveground carbon stock in forests is expected to be distinctively lower than the natural ecosystem carbon carrying capacity (Keith et al., 2009; Moomaw et al., 2019; Nagel et al., 2023). Forests in these regions thus represent a high potential for carbon storage. Carbon sequestration will only slow down, with the carbon stocks reaching a dynamic steady state (Bormann and Likens, 1994), when the carrying capacity is approached (Nord-Larsen et al., 2019; Stillhard et al., 2022). In the absence of primary forest reference sites, however, we have no clear indication of the forests’ ecosystem carbon carrying capacity. Forests set aside from active management may gradually provide an estimate of the carbon sink potential of forests at specific site conditions (Hoover et al., 2012; Meyer et al., 2021; Nagel et al., 2023).
The comparison of carbon stocks and fluxes in managed vs. set-aside forests is relevant in the context of carbon removal certification regulations. A carbon removal project may be eligible for certification if the carbon stocks and sequestration rates are significantly higher than the baseline value of business as usual, i.e., if the project provides “additionality” in carbon removal. In this observational study, we focused on Flanders (northern Belgium), an area heavily altered by human activity with no remaining primary forest and in which forests are currently extensively managed after a long history of intensive harvesting. We aimed to establish whether the set-aside forests in Flanders provide additional in situ aboveground carbon sequestration compared to the average Flemish forest. For this purpose, we quantified mean aboveground carbon stocks and carbon stock change rates for a number of set-aside forests and the overall forest in Flanders. To take into account the local site conditions that determine forest productivity and dynamics, we distinguished five site types. The site-specific comparison of carbon stocks will provide guideline values for the carbon sink potential of forests in Flanders.
Flanders is a densely populated lowland area with a mild Atlantic climate: mean annual temperature 9°C–11°C, mean annual precipitation 600–900 mm. Forests cover approximately 140,000 ha of Flanders, i.e., 10% of the total area, spanning a range in forest and soil types from nutrient poor oak-pine forests on sandy soils to ash-alder forests on moist loamy soils. Only 16% of the forest is considered ancient woodland, and more than 50% of the forest is the result of reafforestations from the 20th century (De Keersmaeker et al., 2015). All forests have been intensively managed in the past, mainly for wood production. As recreation and nature conservation have become more prominent forest functions, forest management and harvests have become more extensive over the past decades (Vandekerkhove, 2013). The current wood harvest ratio is relatively low. In forests managed by the Flemish government, for instance, about 30% of the annual increment is harvested (Govaere and Leyman, 2020). Since 1995, specific forest areas have been legally protected and officially set aside in a network of strict, i.e., non-intervention forest reserves, covering the different forest types present in Flanders. In this study, we compare aboveground carbon stocks and carbon stock change rates of set-aside forests with the average Flemish forest, which represents managed stands as well as some unmanaged forests, based on data from the monitoring program of the forest reserves and the regional forest inventory.
The regional forest inventory of Flanders is based on a systematic sampling on a geo-referenced grid of 1 km × 0.5 km, with nested circular inventory plots on the grid intersections that are located in forest. The first inventory (further called NFI1) was performed in a short measuring campaign in 1997–1999. The second inventory (NFI2), in 2009–2018, was a continuous monitoring with 10% of the grid intersections visited per year. NFI1 consisted of 2,423 plots, NFI2 of 2,479 plots. During NFI1, the position of the plot center was determined using descriptive maps and marked underground in the field. As no accurate GPS was used during NFI1, location of the plots during NFI2 was challenging and retracing a plot center strongly relied on the position of remaining large trees in the plot. Only 841 of the original plots could be paired in NFI2, and the paired plots are biased towards older stands with large trees. In order to represent the average Flemish forest, we used the full datasets of NFI1 and NFI2, i.e., including both paired and unpaired plots. The strict forest reserves in Flanders are monitored using circular nested plots similar to the NFI, but located on a tight systematic grid of 50 m × 50 m within the forest reserve, with plots on alternately selected grid intersections. In forests that are hard to access, e.g., swamp forests, only a core area is monitored. For this study, we used circular plot data from 11 strict forest reserves (n = 607 circular plots) and core area data from two waterlogged forest reserves (n = 3 core areas), which had been monitored two times with a mean monitoring interval of 10 years in the period 2000–2017. At the time of the first monitoring, the forests had been left unmanaged for 7–56 years (see Supplementary Table S1). Dendrometric data on standing live trees and standing and lying dead wood are collected in a similar way in the forest inventory and in the forest reserves (see Supplementary Table S2 for details).
To account for the impact of different site conditions, we applied the typology of the Potential Natural Vegetation map of Flanders of De Keersmaeker et al. (2013), which is a site classification based on the Belgian soil map that recognizes seven Potential Natural Vegetation site types for forests in Flanders. We assigned a site type to each plot of the forest inventory and forest reserve datasets. The five site types used in this study are waterlogged soils, wet alluvial soils, moist and dry silt or sandy silt soils, and sand soils (see Supplementary Table S3 for details). The two other site types of De Keersmaeker et al. (2013), i.e., spring and outer dike habitats, have a limited share in the forest area of Flanders and any plots on these site types were included in the site type “waterlogged soil” in our study. In a region with a long history of forest management, such as Flanders, the actual tree species composition may differ quite considerably from the potential natural vegetation at a site. The mean tree species composition of the forests on each site type in the forest inventory and forest reserve datasets is shown in Supplementary Table S4. We did not consider the effect of stand age in our study, although relevant for carbon stocks (cf. Pregitzer and Euskirchen, 2004), as no data on stand age is included in the NFI and several set-aside and NFI forest stands are multi-aged.
First, we determined the aboveground carbon stock in living tree biomass for each plot following the method described in the national forestry accounting plan of Belgium (Perin et al., 2019):
with Cstock_LT the total aboveground carbon stock of the living trees in a plot in tC ha−1; Vstem the volume of the merchantable stem of a tree, i.e., the part of the stem with diameter >7 cm, in m3 ha−1; VEF a species-specific volume expansion factor to expand merchantable volume to total aboveground tree volume; Vstump the volume of the bottom part of the stem, which is not included in the merchantable timber, in m3 ha−1; WD a species-specific wood density value (t m−3); and CF the carbon fraction of dry matter in tC per t dry biomass. We calculated the merchantable stem volume—Vstem—for each tree based on its diameter and height using species-specific two-entry tariffs (see Supplementary Table S2) and used volume expansion factors—VEF—modeled as a function of diameter, height and species according to Longuetaud et al. (2013). We calculated the stump volume—Vstump—as a cylinder with height 10 cm and radius derived from the tree’s diameter and height using taper functions of Dagnelie et al. (2013). We used the species-specific wood density values—WD—from the national forestry accounting plan of Belgium (Perin et al., 2019; Supplementary Table S5) and the default carbon fraction—CF—of 0.5 as in Penman et al. (2003). As we focus on aboveground carbon stocks only, we did not use a root-to-shoot ratio (i.e., factor R in Eq. 3.2.3 of the IPCC Good Practice Guidance for LULUCF; Penman et al., 2003) to derive the belowground volume of living trees from the aboveground volumes.
Then, we calculated the aboveground dead wood carbon stock for each plot as the sum of the carbon stocks of standing dead trees, snags and logs:
with Cstock_WD the total aboveground carbon stock of dead wood in a plot in tC ha−1; Vtrees the volume of the standing dead trees in the plot in m3 ha−1; Vsnags the volume of the snags in m3 ha−1; Vlogs the volume of the lying dead wood in m3 ha−1; and CC the carbon content in tC m−3. The volumes of the different dead wood categories—Vtrees, Vsnags, Vlogs —were calculated slightly differently, depending on the available dead wood data for the two forest inventories and the forest reserves (for details see Supplementary Table S2). We multiplied the total aboveground volume of dead wood in each plot with a site-specific factor of carbon content per wood volume—CC, based on the main tree species composition per site type and species-specific dead wood density and carbon content values for mid-stage decayed wood from Stakėnas et al. (2020) and Přívětivý and Šamonil (2021) (see Supplementary Tables S6, S7).
Thereafter, to assess the total aboveground carbon stock in each plot, we summed the plot-level aboveground carbon stocks of living trees and dead wood. We then calculated the mean of the plot-level total aboveground carbon stocks for each site type and for each inventory. We used the 95% confidence intervals of these means to evaluate whether the mean carbon stock significantly differed between the set-aside and average forests, i.e., using the dataset of the forest reserves and the dataset of the NFI, and between the five site types, i.e., comparing the different site types within each of the two datasets. We considered the mean carbon stock to differ significantly between two groups, i.e., between the two forest types or between two of the site types, when the confidence intervals of the two means under consideration did not overlap.
Finally, to determine an aboveground carbon stock representative for either the average or the set-aside forests in Flanders, we calculated the overall mean carbon stocks of NFI1 and NFI2, which represent a systematic sampling across Flanders, and weighted mean carbon stocks for the first and second forest reserve monitoring, weighting the plot-level carbon stocks of each site type by the site type’s relative share in the forest area of Flanders, i.e., the number of plots of each site type in the regional forest inventory, using the functions weighted.mean from the stats library and wtd.var. from the Hmisc library. We inspected the 95% confidence intervals of the means and considered the mean carbon stocks to differ significantly between the set-aside forests and the average Flemish forest when the confidence intervals of the means did not overlap.
We calculated the annual change in aboveground carbon stock as the difference between the stock at the second and first inventory or monitoring, divided by the time interval between both:
For the forest inventory data, which contain both paired and unpaired plots in the two inventories, we assessed carbon stock change rate at the site type level, using the mean stock at the first and second inventory for each site type and the mean time interval of 15 years between both inventories. For the permanent plots of the forest reserve monitoring, we first calculated carbon stock change rate at plot level, using the plot-level carbon stock of each survey and the reserve-specific time interval between the two monitoring campaigns, and then calculated the mean carbon stock change rate for each of the five site types using the plot-level stock change rates. We used the 95% confidence intervals of the means to evaluate whether the mean annual carbon stock change rates significantly differed between site types and between set-aside forests and the average forest in Flanders. For the forest inventory data, we derived the confidence intervals based on the approach of Derrick et al. (2017) for comparing samples that contain both paired and independent observations.
Similar to the carbon stocks, we determined a carbon stock change rate of an average or set-aside forest representative for the whole of Flanders. For the forest inventory data, we calculated the overall stock change rate as the difference between the mean stocks of the entire first and second inventory divided by the mean time interval of 15 years between both inventories. For the forest reserves data, we weighted the plot-level carbon stock change rates of each site type by the site type’s relative share in the forest area of Flanders, i.e., the number of plots of each site type in the regional forest inventory. We used the 95% confidence intervals of the overall carbon stock change rates to evaluate whether the mean annual carbon stock change rate significantly differed between the set-aside forests and the average Flemish forest.
To check whether the set-aside forests were approaching their ecosystem carbon carrying capacity, we plotted the annual carbon stock change rate in relation to the stock at the first survey. All calculations were done in R version 4.2.1 (R Core Team, 2022); graphs were made with ggplot2 (Wickham, 2016).
Our calculations showed that the aboveground carbon stocks—for living trees, dead wood and the total aboveground biomass—increased between the first and second survey, differed between the average Flemish forest and the set-aside forests, and varied among the five site types (Figure 1 and Table 1; more details in Supplementary Tables S8, S9). The annual carbon stock change rates also differed between regular and set-aside forests and among the site types (Figure 2 and Table 1; details in Supplementary Tables S8, S9).
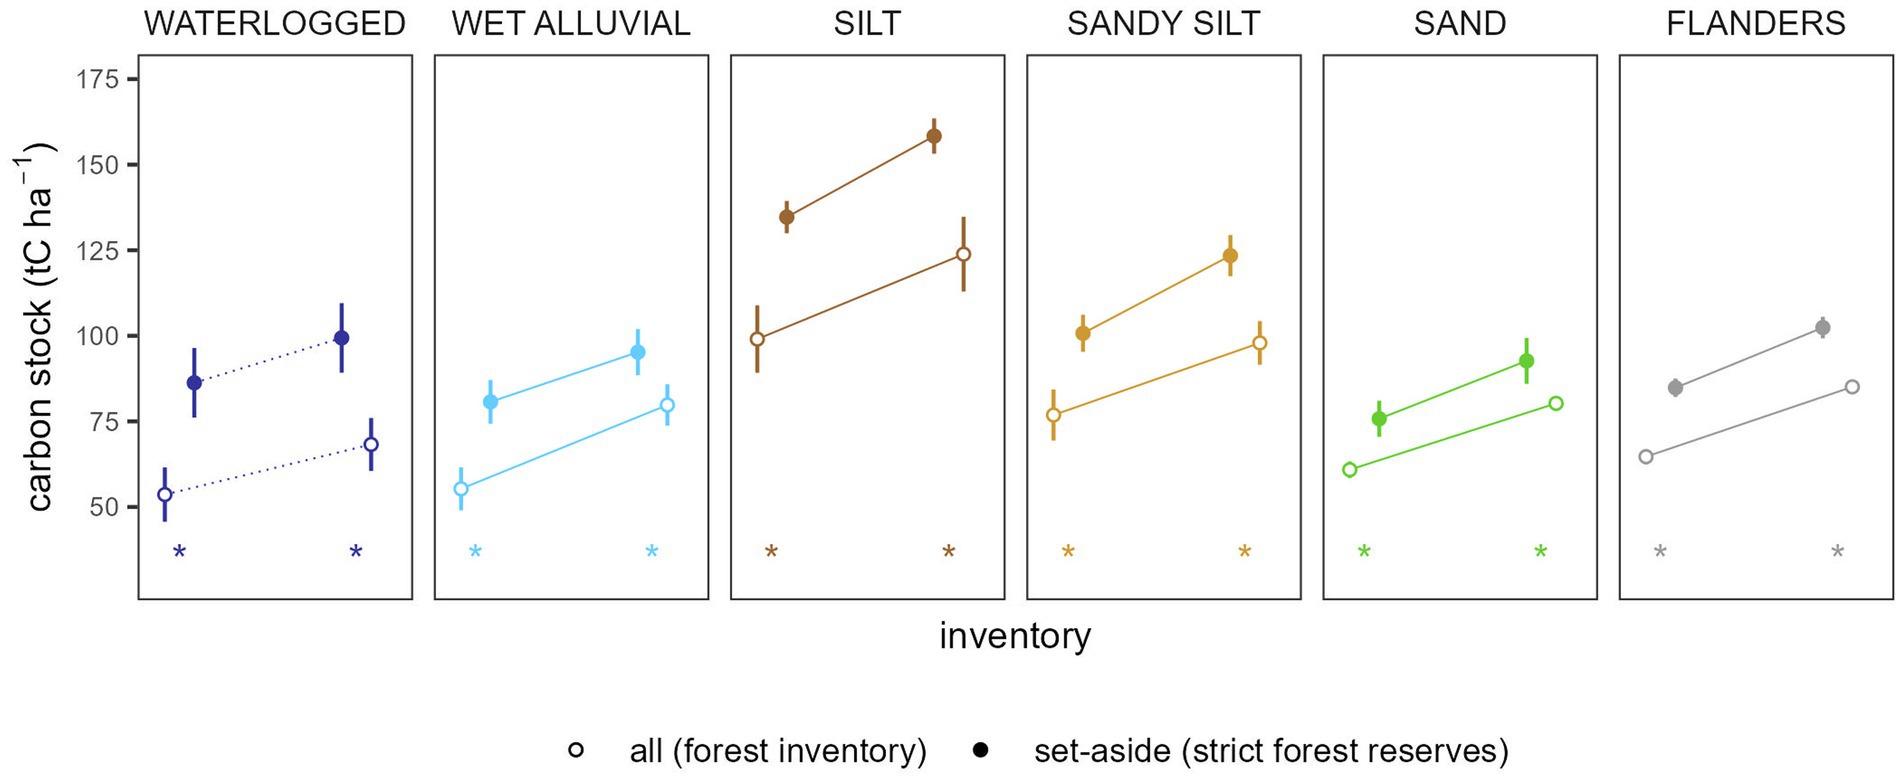
Figure 1. The aboveground carbon stocks (tC ha−1) at the first and second inventory in the average Flemish forest and the set-aside forests, for each of the five site types and for the whole of Flanders (mean and 95% confidence interval). The mean interval between the first and second inventory was 15 years for the regional forest inventories and 10 years for the forest reserves. Solid lines indicate a significant increase over time; asterisks indicate a significant difference between the average and set-aside forests per inventory. See Supplementary Table S3 for more details on the site types.
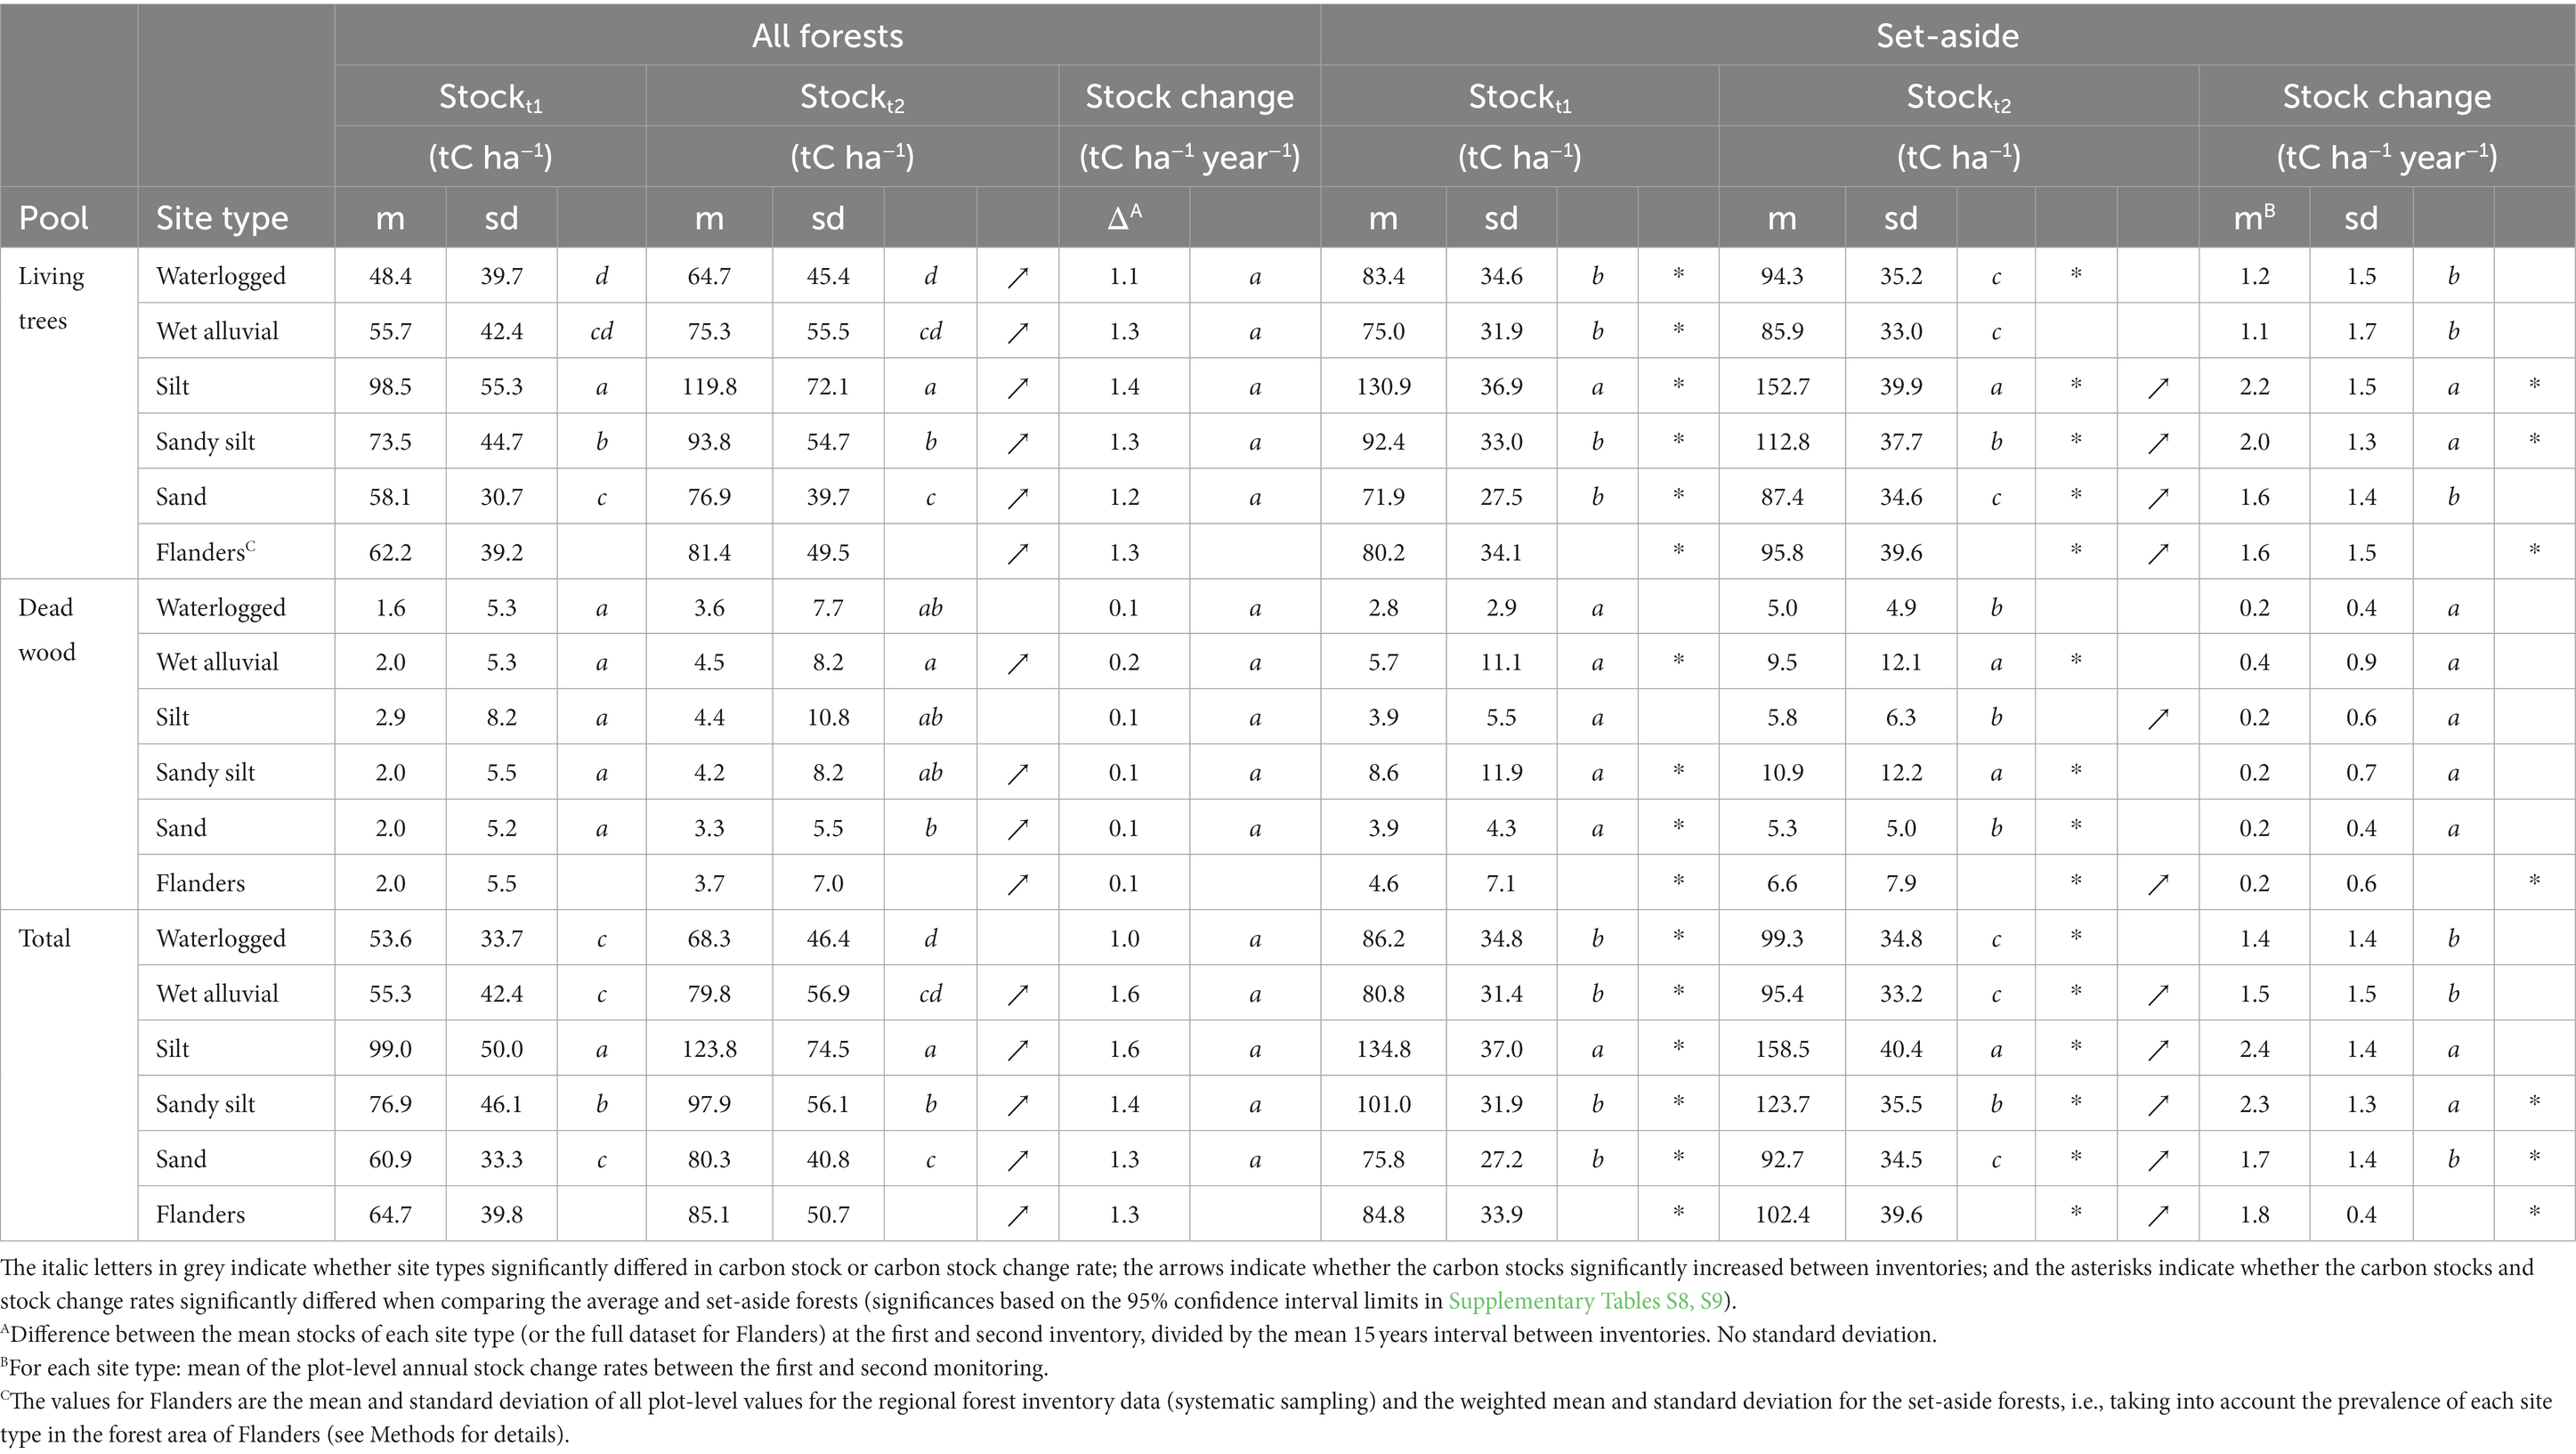
Table 1. The aboveground carbon stock (mean m and standard deviation sd, tC ha−1) at the first and second inventory and the annual carbon stock change between both inventories (with standard deviation sd, tC ha−1 year−1) in average and set-aside forest in Flanders, specified for the five site types in this study and for the whole of Flanders.
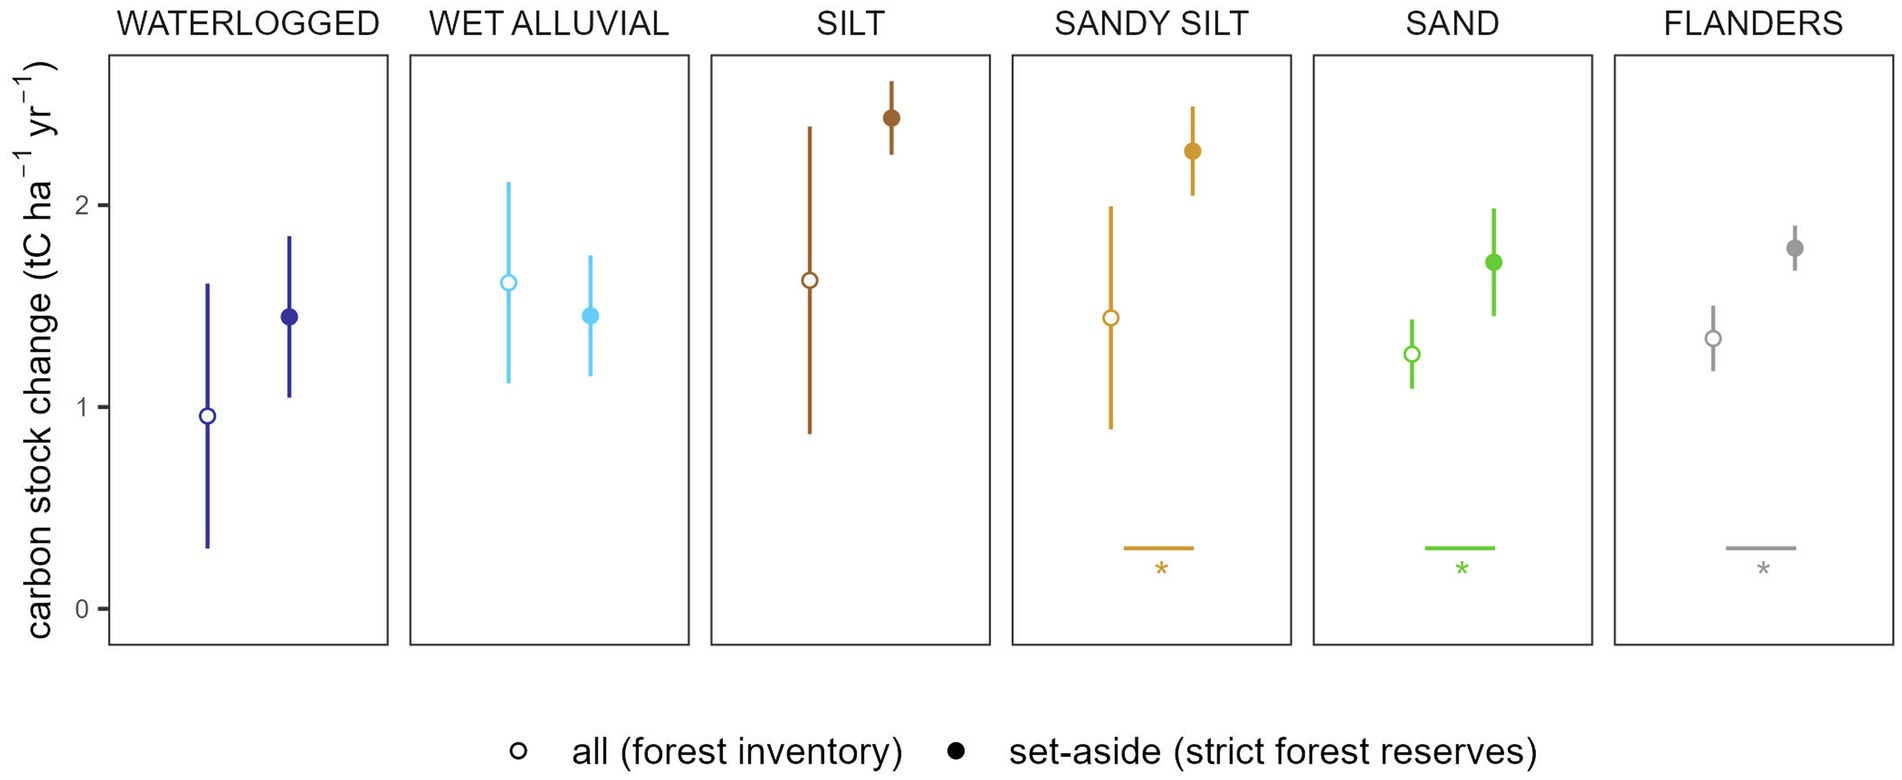
Figure 2. The annual carbon stock change (tC ha−1 year−1) between the two inventories in the average Flemish forest and the set-aside forests, for each of the five site types and for Flanders as a whole (mean and 95% confidence interval). Asterisks indicate a significant difference between the average and set-aside forests. See Supplementary Table S3 for more details on the site types.
Overall, the aboveground carbon stocks were significantly higher in the set-aside forests than in the average forest in Flanders (see the asterisks in Figure 1 and Table 1). The mean total aboveground carbon stock significantly increased from 64.7 to 85.1 tC ha−1 over a 15 years period for the average Flemish forest, and from 84.8 to 102.4 tC ha−1 over a 10 years period in the set-aside forests. The carbon stock in living tree biomass significantly increased from 62.2 to 81.4 tC ha−1 for the average Flemish forest, and from 80.2 to 95.8 tC ha−1 in set-aside forests; the carbon stock in dead wood significantly increased from 2.0 to 3.7 tC ha−1 for the average Flemish forest and from 4.6 to 6.6 tC ha−1 in the set-aside forests.
The carbon stocks significantly differed among the site types in both the average Flemish forest and the set-aside forests, except for dead wood at the first inventory (see the grey italic letters in Table 1). The total aboveground carbon stock and the aboveground carbon stock in living trees were highest on the silt soils, followed by the sandy silt soils, and then the sand, wet alluvial and waterlogged sites. The aboveground carbon stock in dead wood was highest on wet alluvial sites and lowest on sand sites, for both the average Flemish forests and the set-aside forests at the second inventory. For the set-aside forests at the second inventory, dead wood carbon stocks were also significantly higher on sandy silt soils than on waterlogged and silt soils. The total aboveground carbon stock significantly increased between inventories in all site types except the waterlogged sites, in both the set-aside forests and the average Flemish forest (Figure 1; see the arrows in Table 1). The carbon stock in living trees significantly increased on the dry sites for both the set-aside and average forests and on the wet sites for the average Flemish forests only. The dead wood carbon stocks showed a different pattern for the set-aside and average forests, with significant increases over time on silt sites for the set-aside forest and on wet alluvial, sandy silt and sand sites for the average forest.
The total aboveground carbon stocks were significantly higher in the set-aside forests than in the average forests on all site types and for both inventories (asterisks in Figure 1 and Table 1). The carbon stocks in living trees were higher in set-aside forests on all site types except on the wet alluvial sites at the second inventory, and the carbon stocks in dead wood were significantly higher in set-aside forests on wet alluvial, sandy silt and sand sites (asterisks in Table 1).
The overall stock change rates were significantly higher in the set-aside forests than in the average Flemish forest (asterisks in Figure 2 and Table 1). The mean annual change rate of total aboveground carbon in Flanders was 1.3 tC ha−1 year−1 for the average Flemish forest and 1.8 tC ha−1 year−1 in the set-aside forests. For the living trees, the mean annual aboveground carbon stock change rates were 1.2 tC ha−1 year−1 for the average Flemish forest and 1.6 tC ha−1 year−1 in the set-aside forests; for dead wood, the values were 0.1 tC ha−1 year−1 for the average Flemish forest and 0.2 tC ha−1 year−1 in the set-aside forests.
The carbon stock change rates differed between the site types in the set-aside forests, except for dead wood (see the grey italic letters in Table 1). For total aboveground carbon and aboveground carbon in living trees, the stock change rates were significantly higher on the silt and sandy silt sites compared to the sand, wet alluvial and waterlogged sites.
The total aboveground carbon stock change rates were significantly higher in the set-aside forests compared to the average forests on sandy silt and sand soils (asterisks in Figure 2 and Table 1) and the aboveground carbon stock change rates in living trees were significantly higher in the set-aside forests on silt and sandy silt sites (asterisks in Table 1).
For the studied plots in the set-aside forests, the annual carbon stock change rates were mostly positive and independent of the initial aboveground carbon stock (Figure 3). We saw no slow-down in carbon sequestration for plots with high initial carbon stock levels.
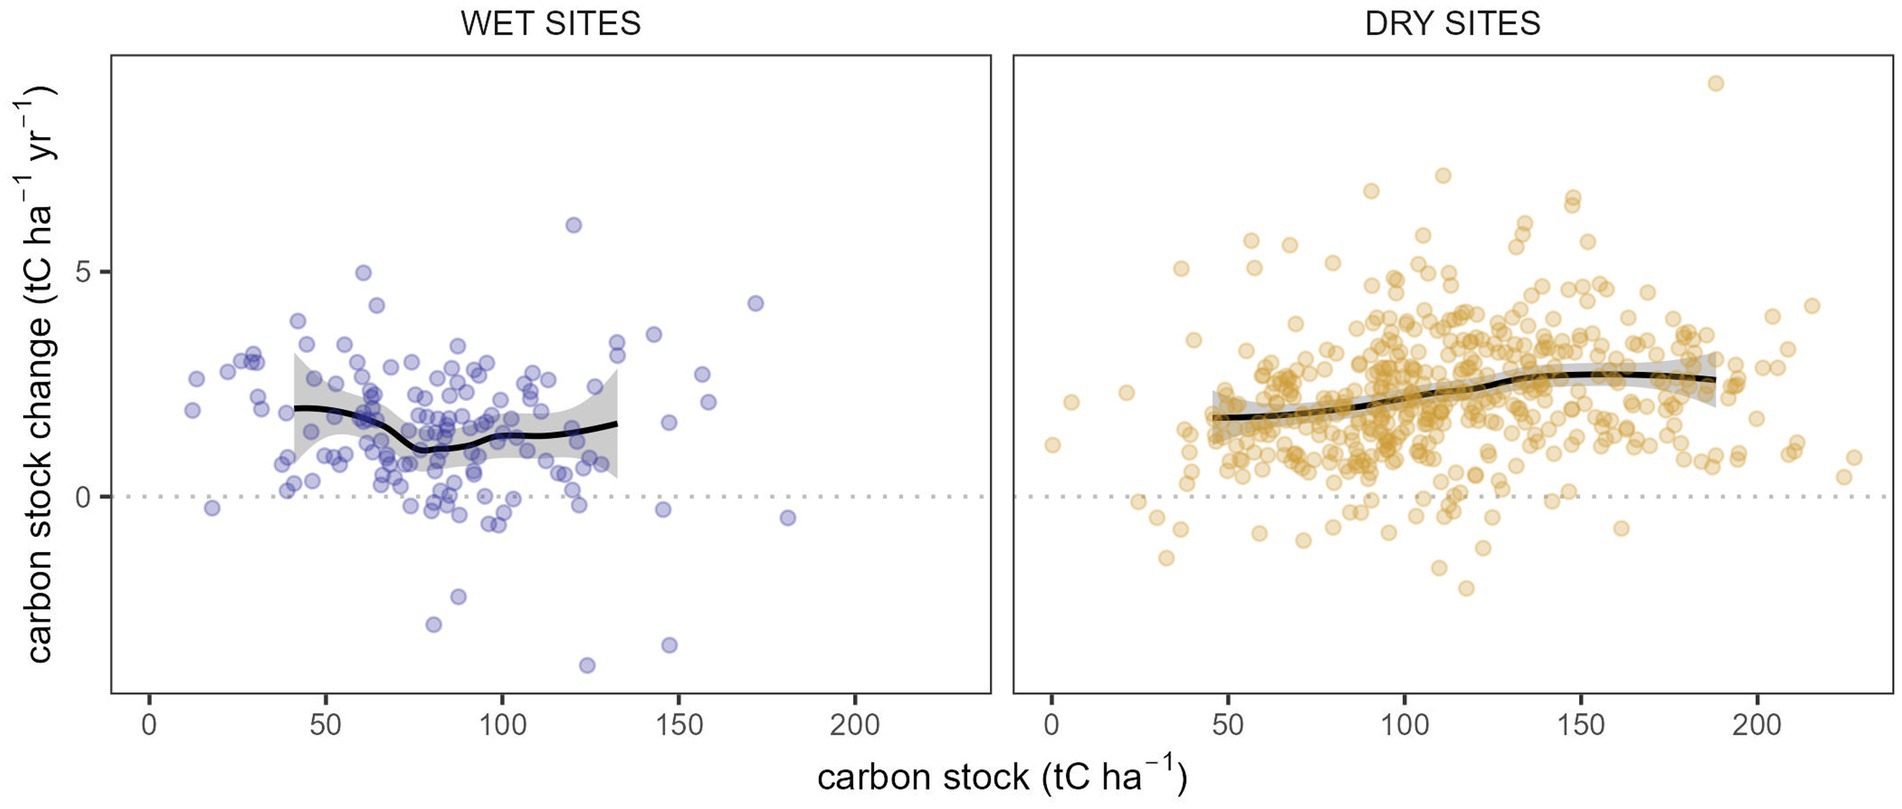
Figure 3. The annual aboveground carbon stock change rate (tC ha−1 year−1) plotted against the aboveground carbon stock at the first monitoring (tC ha−1) for the set-aside forests on wet and dry sites. The lines represent LOESS smoothing functions and the ribbons 95% confidence intervals.
We used datasets originating from two monitoring networks, i.e., the regional forest inventory and the strict forest reserve monitoring, to calculate and compare statistics on aboveground carbon stocks for the average and set-aside forests in Flanders. We acknowledge that caution is needed when comparing carbon stocks among studies and countries because of differences in definitions and calculation approach, e.g., with regard to diameter thresholds (Cienciala et al., 2008), stem volume estimates (Gschwantner et al., 2019, 2022), allometric biomass functions or biomass expansion factors (Neumann et al., 2016), wood density and carbon content (Vande Walle et al., 2005; Weggler et al., 2012). For our comparison, we applied the same wood volume tariffs, volume expansion factors, wood density values, and carbon content to convert the inventory data to carbon stocks. Despite small differences in the data collection protocols (see Supplementary Table S2), we consider our dataset suitable for reliable assessment and comparison of aboveground carbon stocks and carbon stock change rates. Besides providing an overall mean representative for either the average forest or the set-aside forests in the whole of Flanders, we also looked at the effect of the local soil conditions by distinguishing five site types. Below, we consider differences in management history, stand composition, and stand age in discussing our results.
The mean overall aboveground carbon stock for the average forest in Flanders was 64.7 tC ha−1, with 95% confidence interval 62.4–66.9 tC ha−1, in the first survey between 1997–1999 and 85.1 tC ha−1, with 95% confidence interval 83.0–87.1 tC ha−1, in the recent inventory between 2009–2018. Recent forest inventories in neighboring countries showed slightly lower (69 tC ha−1, France, IGN, 2023), similar (85 tC ha−1, the Netherlands, Arets and Schelhaas, 2019) or higher (101 tC ha−1, Germany, 2017 Carbon Inventory: bwi.info) total aboveground carbon stocks. In other countries in western and central Europe, the total aboveground carbon stock in 2020 ranged from 71–75 tC ha−1 (United Kingdom, Ireland), over 84 tC ha−1 (Austria, Czech Republic) to 105 tC ha−1 (Switzerland) (Forest Europe, 2020: Annex 8, Table 13). For the carbon stock in living aboveground biomass, integrated figures for forests in central-west Europe (75 tC ha−1 in Korhonen et al., 2020; 85 tC ha−1 - converted from biomass by multiplying by 0.5—in Avitabile et al., 2023) are similar to our value for Flanders (79–83 tC ha−1). In sum, the aboveground carbon stock for the average forest in Flanders was comparable to the stocks in other temperate European forests. The relatively large increase between the first and second inventory indicates that the forest carbon stocks in Flanders are catching up or keeping pace with other countries in temperate Europe (see section 4.2). This is remarkable as most forests in Flanders are quite young, i.e., 77% of the forests are afforestations of heathland and grassland that originated after 1850 (De Keersmaeker et al., 2015), and older forests have a long history of intensive management, often as coppice (Vandekerkhove et al., 2009, 2011). The gradual buildup of the stock levels is probably the combined result of the transformation of coppice to high forest since the 1950s, the loss of a sales market for pine timber, and the shift towards close-to-nature selective harvest systems during the last decades because of the decline in the economic function of forests in favor of recreation and conservation (Vandekerkhove et al., 2009; Vandekerkhove, 2013). The aboveground carbon stocks differed among the site types in our study. Forests on the fertile, silt and sandy silt sites generally showed higher aboveground carbon stocks, because of their higher productivity and a high share of well-preserved older forest stands, i.e., former hunting grounds. Forests on wet and sand sites had lower stocks. On the wet sites, the lower stocks were probably due to a more recent history of coppice management and high mortality combined with fast dead wood decay in poplar stands. For the sand soils, the lower stocks can be related to low site productivity and a high share of relatively young pine stands.
The set-aside forests in Flanders showed significantly higher mean overall aboveground carbon stocks than the average Flemish forest at both inventories, i.e., 84.8 tC ha−1, with 95% confidence interval 82.1–87.5 tC ha−1, at the first survey between 2000–2007 and 102.4 tC ha−1, with 95% confidence interval 99.3–105.6 tC ha−1, at the recent monitoring between 2010–2017. Most set-aside forests in our study originated from structure-rich mature forests with a rather high aboveground standing wood volume at the moment they were set aside as forest reserves. The higher initial stock in the set-aside forests, combined with a higher stock change rate (see section 4.2), resulted in an amplified difference in final stocks. The higher stocks in set-aside forests are in line with other studies that also found higher aboveground carbon stocks in set-aside vs. managed stands, e.g., in German beech forest (Mund, 2004) and the Białowieża biosphere reserve (Matuszkiewicz et al., 2021). Similar to the average Flemish forests, the aboveground carbon stocks in our set-aside forests were highest on fertile silt and sandy silt sites.
The dead wood carbon stocks in the studied set-aside forests were larger than in the average Flemish forests (Supplementary Table S9), particularly in the forests on wet alluvial soils, with a dead wood share of 10%, and the forests on sandy silt soils, with a dead wood share of 9%. These high dead wood shares may be because of a high dieback of Populus in the forests on wet alluvial soils and of light-demanding tree species in the beech forests on sandy silt soils. The overall share of dead wood in the aboveground carbon stocks of the average and set-aside forests in our study was similar to the share of dead wood in other studies in managed (Mund, 2004; Glatthorn et al., 2018) and set-aside (Mund, 2004; Den Ouden et al., 2020; Förster et al., 2021; Meyer et al., 2021) stands in western and central Europe. The mean dead wood volumes in the studied set-aside forests on the dry site types (i.e., 27–54 m3 ha−1, Supplementary Table S11) were also in line with the median values reported for set-aside beech and oak forests in northwestern and central Europe (53 m3 ha−1; Vandekerkhove et al., 2009).
The mean overall aboveground carbon stock change rate for the average forest in Flanders was 1.3 tC ha−1 year−1, with 95% confidence interval 1.2–1.5 tC ha−1 year−1, similar to recent forest inventory values in the Netherlands (1.2 tC ha−1 year−1, Arets and Schelhaas, 2019) and Germany (1.1 tC ha−1 year−1, 2017 Carbon Inventory: bwi.info), above the range reported in the 2019 National Inventory Reports for countries in central-west Europe (−1.4 to 1.0 tC ha−1 year−1, Günther and Gniffke, 2022), and much higher than recent figures for France (0.5 tC ha−1 year−1, IGN, 2023). Korhonen et al. (2020) reported a steady increase in carbon stocks in forest biomass in the European Union between 1990 and 2020, with forest growth exceeding cutting and mortality. In central-west Europe, the total living forest biomass showed an annual increase of 1.2% between 1990 and 2020 (Korhonen et al., 2020). In Flanders, the increase in living tree biomass reached more than 25% over a mean interval of 15 years, or more than 1.5% per year between 1998 and 2014. The relatively low overall harvest ratio in forests in Flanders (Govaere and Leyman, 2020), the high potential for additional carbon storage (see section 4.3), and the absence of large-scale stand-replacing disturbances, such as bark beetle outbreaks, lead to the relatively high carbon stock change rates for Flanders.
In set-aside forests in Flanders, the mean annual carbon stock change rate ranged from 1.4 to 2.4 tC ha−1 year−1 for the different site types, with an overall mean for Flanders of 1.8 tC ha−1 year−1 and the 95% confidence interval between 1.7 and 1.9 tC ha−1 year−1. The carbon stock change rates in set-aside forests in Flanders were hence similar to or larger than the global values for primary forests (0.8–1.4 tC ha−1 year−1, Luyssaert et al., 2008). In general, the carbon stock change rates in the studied set-aside forests were also significantly higher than for the average Flemish forest, which was expected: no biomass is removed in set-aside forests and the studied set-aside forests have not yet reached their carbon carrying capacity (see section 4.3). Ford and Keeton (2017) also found higher aboveground carbon fluxes in unmanaged set-aside compared to managed northern hardwood-conifer forests. On the wet alluvial sites, however, we saw similar carbon stock change rates in the set-aside and average Flemish forests, which may be related to high dieback and fast dead wood decay of poplar in the set-aside forests. Moreover, forests on wet alluvial sites are often left unmanaged also outside official set-aside areas as harvesting wood on wet sites is difficult or restricted by legal constraints. When looking at the carbon stock change rates for specific site conditions, our values for set-aside forests on sand soils (1.7 tC ha−1 year−1) were comparable to set-aside pine forests on poor soils in the Netherlands (1.4 tC ha−1 year−1; Den Ouden et al., 2020), and our values for set-aside forests on silt and sandy silt soils (2.4 and 2.3 tC ha−1 year−1) were in line with set-aside forests on relatively fertile soils in Germany (mixed oak: 0.9–2.3 tC ha−1 year−1; beech and mixed beech: 1.1–3.4 tC ha−1 year−1; converted from biomass by multiplying by 0.5; Meyer et al., 2021) but lower than set-aside beech forests on loamy soils in the Netherlands (3.2 tC ha−1 year−1; Den Ouden et al., 2020).
The mean accumulation of dead wood in the set-aside forests was 1.1 m3 ha−1 year−1, similar to the mean volume change rate in set-aside beech forests in Germany (1.1 m3 ha−1 year−1, Meyer and Schmidt, 2011) but lower than the median accumulation rate in set-aside oak and beech forests across Europe (1.64 m3 ha−1 year−1, Vandekerkhove et al., 2009).
In the average Flemish forest on fertile sites, we found total aboveground carbon stocks of 97.9 tC ha−1 for the sandy silt sites and 123.8 tC ha−1 for the silt sites, much lower than the values reported for well-stocked managed beech forests in Slovakia (170 tC ha−1, Glatthorn et al., 2018), Germany (178 tC ha−1, Mund, 2004), or France (209 and 220 tC ha−1, Lecointe et al., 2006). In the set-aside forests on fertile sites, the observed total aboveground carbon stocks, i.e., 123.7 tC ha−1 on sandy silt and 158.5 tC ha−1 on silt, were higher than in the average Flemish forest, but also still lower than in reference set-aside beech forests in Germany (174 tC ha−1, Nagel et al., 2023; 238 tC ha−1, Meyer et al., 2021; 247 tC ha−1, Mund, 2004) or the Netherlands (252 tC ha−1, Den Ouden et al., 2020) or in set-aside mixed broadleaved forests in Germany (166 and 216 tC ha−1, Meyer et al., 2021) and Denmark (244 tC ha−1, Nord-Larsen et al., 2019). The total aboveground carbon stocks observed in the set-aside forests on sand soils, i.e., 92.7 tC ha−1, were also lower than in oak and beech forests in northern Germany (117 tC ha−1 and 158 tC ha−1, Förster et al., 2021). Aboveground volumes in old unmanaged oak and beech forests on rich and poor sites in central and northwestern Europe (Vandekerkhove et al., 2009) are generally 1.1–1.8 times higher than in the set-aside forests on silt, sandy silt and sand in Flanders. In the set-aside forests on waterlogged and wet alluvial sites, the carbon stocks, i.e., 99 and 95 tC ha−1, or aboveground volumes, i.e., 353 and 369 m3 ha−1 (Supplementary Table S11), were also well below the potential carbon stock of 165 tC ha−1 observed for alder forests in the Białowieża Biosphere Reserve (Matuszkiewicz et al., 2021) or the 690 m3 ha−1 in primary alluvial forest in the Czech Republic (Janik et al., 2008).
The significantly higher carbon stocks and carbon stock change rates in set-aside forests indicate the additionality for in situ carbon sequestration of the measure of setting aside forests in the framework of carbon removal. This additionality may last for several decades. The studied set-aside forests appeared to be still below the ecosystem’s carbon carrying capacity: the carbon stock change rates were not lower for plots with high initial carbon stocks (no clear trend in Figure 3), indicating that the carbon accumulation did not yet slow down and the carbon stock continued to increase in forests that already built up a large carbon stock over time. Studies in German set-aside forests indeed indicated that the in situ carbon sequestration—and hence additionality of setting aside forests—remains high during at least the first 50 years after set aside, before they approach their ecological carrying capacity and related dynamic steady-state level (Meyer et al., 2021; Nagel et al., 2023).
The share of set-aside forests in the overall forest area is and will remain relatively small. To reach the carbon removal targets of the Fit for 55 package of the European Union, it will be essential to complement setting aside forests with sustainable management in the remaining forest area, combining biodiversity, wood production and recreation goals with a gradual increase of the forests’ carbon stocks (cf. Nunery and Keeton, 2010; Triviño et al., 2015; Law et al., 2018).
In the average forest in Flanders, owing to a relatively low harvest intensity, the aboveground carbon accumulation was similar to neighboring countries such as Germany and the Netherlands and high compared to several other European countries. In the set-aside forests in Flanders, the initial stocks and the carbon accumulation were significantly higher than in the average Flemish forest and similar to set-aside and previously managed forests in neighboring countries. The additionality in aboveground carbon depended on the soil conditions, with in situ aboveground carbon sequestration similar in set-aside and average forests on wet sites and higher in the set-aside than in the average forests on dry sites. Furthermore, there was no indication that the carbon stocks approached the carbon carrying capacity of the set-aside forests in the first decades following set-aside. Considering the relatively low aboveground carbon stocks in Flemish forests compared to reference forests elsewhere in Europe, the potential for additional in situ carbon sequestration in Flemish forests, managed and set-aside, remains high.
The raw data supporting the conclusions of this article will be made available by the authors, without undue reservation.
LK and KV contributed to the conception and design of the study. AL and LG organized the databases and performed the calculations. MV wrote the first draft of the manuscript. All authors contributed to the article and approved the submitted version.
The authors thank the fieldwork teams of the forest reserve monitoring network (Marc Esprit, Stefaan Goessens, and Peter Van de Kerckhove) and of the regional forest inventory (Anke Balleux, Steven Bocklandt, Bart Christiaens, Johan Coenjaerts, Bert D’Hondt, Lode De Beck, Wouter De Mey, Marc De Vrieze, Patrick Deckers, Rudy Dolfen, Wouter Huygens, Roeland Libbrecht, Jan Meulemans, Jo Packet, Peter Sannen, Elfriede Schotsmans, Luc Schrey, Raf Schrey, Harry Thys, Wim Van Roey, Alex Vandebon, Vivianne Vandenbossche, Frank Verhoeven, and Guido Vervaet) for the data collection, and the colleagues from the Biometry team (Els Lommelen, Hans Van Calster, and Toon Westra) for their advice on data processing and analysis. The authors thank the two reviewers for their comments that helped us to improve the manuscript.
The authors declare that the research was conducted in the absence of any commercial or financial relationships that could be construed as a potential conflict of interest.
All claims expressed in this article are solely those of the authors and do not necessarily represent those of their affiliated organizations, or those of the publisher, the editors and the reviewers. Any product that may be evaluated in this article, or claim that may be made by its manufacturer, is not guaranteed or endorsed by the publisher.
The Supplementary material for this article can be found online at: https://www.frontiersin.org/articles/10.3389/ffgc.2024.1236203/full#supplementary-material
Ameray, A., Bergeron, Y., Valeria, O., Montoro Girona, M., and Cavard, X. (2021). Forest carbon management: a review of silvicultural practices and management strategies across boreal, temperate and tropical forests. Curr. For. Rep. 7, 245–266. doi: 10.1007/s40725-021-00151-w
Arets, E., and Schelhaas, M.-J. (2019). National Forestry Accounting Plan. Submission of the forest reference level 2021–2025 for the Netherlands. Wageningen: Wageningen Environmental Research.
Avitabile, V., Baldoni, E., Baruth, B., Bausano, G., Boysen-Urban, K., et al. (2023). Biomass production, supply, uses and flows in the European Union. Integrated assessment. Luxembourg: Publications Office of the European Union.
Bormann, F. H., and Likens, G. E. (1994). Pattern and process in a forested ecosystem. Berlin: Springer-Verlag.
Bouriaud, O., Don, A., Janssens, I. A., Marin, G., and Schulze, E.-D. (2019). Effects of forest management on biomass stocks in Romanian beech forests. For. Ecosyst. 6:19. doi: 10.1186/s40663-019-0180-4
Burton, J. I., Ares, A., Olson, D. H., and Puettmann, K. J. (2013). Management trade-off between aboveground carbon storage and understory plant species richness in temperate forests. Ecol. Appl. 23, 1297–1310. doi: 10.1890/12-1472.1
Cienciala, E., Tomppo, E., Snorrason, A., Broadmeadow, M., Colin, A., Dunger, K., et al. (2008). Preparing emission reporting from forests: use of National Forest Inventories in European countries. Silva Fenn. 42, 73–88. doi: 10.14214/sf.265
Dagnelie, P., Palm, R., and Rondeux, J. (2013). Cubage des arbres et des peuplements forestiers. Tables et équations. Gembloux: Presses agronomiques.
De Keersmaeker, L., Onkelinx, T., De Vos, B., Rogiers, N., Vandekerkhove, K., Thomaes, A., et al. (2015). The analysis of spatio-temporal forest changes (1775–2000) in Flanders (northern Belgium) indicates habitat-specific levels of fragmentation and area loss. Landsc. Ecol. 30, 247–259. doi: 10.1007/s10980-014-0119-7
De Keersmaeker, L., Rogiers, N., Vandekerkhove, K., De Vos, B., Roelandt, B., Cornelis, J., et al. (2013). Application of the ancient forest concept to potential natural vegetation mapping in Flanders, a strongly altered landscape in northern Belgium. Folia Geobot. 48, 137–162. doi: 10.1007/s12224-012-9135-z
Den Ouden, J., Schelhaas, M. J., Van Duuren, R., Clerkx, A. P. P. M., De Waal, R. W., and Lerink, B. J. W. (2020). Kan uitstel van houtoogst bijdragen aan CO2-mitigatie? Wageningen: Wageningen Environmental Research.
Derrick, B., Russ, R., Toher, D., and White, P. (2017). Test statistics for the comparison of means for two samples that include both paired and independent observations. J. Mod. Appl. Stat. Methods 16, 137–157. doi: 10.22237/jmasm/1493597280
Ford, S. E., and Keeton, W. S. (2017). Enhanced carbon storage through management for old-growth characteristics in northern hardwood-conifer forests. Ecosphere 8:e01721. doi: 10.1002/ecs2.1721
Forest Europe (2020). Bratislava: Ministerial Conference on the Protection of Forests in Europe. State of Europe’s forests 2020.
Förster, A., Culmsee, H., and Leuschner, C. (2021). Thinned northern German scots pine forests have a low carbon storage and uptake potential in comparison to naturally developing beech forests. For. Ecol. Manag. 479:118575. doi: 10.1016/j.foreco.2020.118575
Glatthorn, J., Feldmann, E., Pichler, V., Hauck, M., and Leuschner, C. (2018). Biomass stock and productivity of primeval and production beech forests: greater canopy structural diversity promotes productivity. Ecosystems 21, 704–722. doi: 10.1007/s10021-017-0179-z
Govaere, L., and Leyman, A. (2020). Nieuwe cijfers over de groei van bomen in Vlaanderen. Bosrevue 90a, 1–8.
Gschwantner, T., Alberdi, I., Balázs, A., Bauwens, S., Bender, S., Borota, D., et al. (2019). Harmonisation of stem volume estimates in European National Forest Inventories. Ann. For. Sci. 76:24. doi: 10.1007/s13595-019-0800-8
Gschwantner, T., Alberdi, I., Bauwens, S., Bender, S., Borota, D., Bosela, M., et al. (2022). Growing stock monitoring by European National Forest Inventories: historical origins, current methods and harmonisation. For. Ecol. Manag. 505:119868. doi: 10.1016/j.foreco.2021.119868
Günther, D., and Gniffke, P. (2022). National inventory report for the German greenhouse gas inventory 1990–2020. Federal Environment Agency.
Hoover, C. M., Leak, W. B., and Keel, B. G. (2012). Benchmark carbon stocks from old-growth forests in northern New England, USA. For. Ecol. Manag. 266, 108–114. doi: 10.1016/j.foreco.2011.11.010
Hoover, C. M., and Smith, J. E. (2021). Current aboveground live tree carbon stocks and annual net change in forests of conterminous United States. Carbon Balance Manag. 16:17. doi: 10.1186/s13021-021-00179-2
IGN (2023). Indicators for the sustainable management of French metropolitan forests. Available at: https://foret.ign.fr/IGD/
Janik, D., Adam, D., Vrska, T., Hort, L., Unar, P., Kral, K., et al. (2008). Tree layer dynamics of the Cahnov–Soutok near-natural floodplain forest after 33 years (1973–2006). Eur. J. For. Res. 127, 337–345. doi: 10.1007/s10342-008-0210-1
Keith, H., Lindenmayer, D., Mackey, B., Blair, D., Carter, L., McBurney, L., et al. (2014). Managing temperate forests for carbon storage: impacts of logging versus forest protection on carbon stocks. Ecosphere 5, 1–34. doi: 10.1890/ES14-00051.1
Keith, H., Mackey, B. G., and Lindenmayer, D. (2009). Re-evaluation of forest biomass carbon stocks and lessons from the world’s most carbon-dense forests. Proc. Natl. Acad. Sci. U.S.A. 106, 11635–11640. doi: 10.1073/pnas.0901970106
Korhonen, K., Stahl, G., and Cienciala, E. (2020). “Indicator 1.4 Forest carbon” in State of Europe’s forests 2020 (Forest Europe), 45–47.
Law, B. E., Hudiburg, T. W., Berner, L. T., Kent, J. J., Buotte, P. C., and Harmon, M. E. (2018). Land use strategies to mitigate climate change in carbon dense temperate forests. Proc. Natl. Acad. Sci. U.S.A. 115, 3663–3668. doi: 10.1073/pnas.1720064115
Lecointe, S., Nys, C., Walter, C., Forgeard, F., Huet, S., Recena, P., et al. (2006). Estimation of carbon stocks in a beech forest (Fougères Forest—W. France): extrapolation from the plots to the whole forest. Ann. For. Sci. 63, 139–148. doi: 10.1051/forest:2005106
Longuetaud, F., Santenoise, P., Mothe, F., Senga Kiessé, T., Rivoire, M., Saint-André, L., et al. (2013). Modeling volume expansion factors for temperate tree species in France. For. Ecol. Manag. 292, 111–121. doi: 10.1016/j.foreco.2012.12.023
Luyssaert, S., Schulze, E.-D., Börner, A., Knohl, A., Hessenmöller, D., Law, B. E., et al. (2008). Old-growth forests as global carbon sinks. Nature 455, 213–215. doi: 10.1038/nature07276
Matuszkiewicz, J. M., Affek, A. N., and Kowalska, A. (2021). Current and potential carbon stock in the forest communities of the Białowieża biosphere reserve. For. Ecol. Manag. 502:119702. doi: 10.1016/j.foreco.2021.119702
Meyer, P., Nagel, R., and Feldmann, E. (2021). Limited sink but large storage: biomass dynamics in naturally developing beech (Fagus sylvatica) and oak (Quercus robur, Quercus petraea) forests of North-Western Germany. J. Ecol. 109, 3602–3616. doi: 10.1111/1365-2745.13740
Meyer, P., and Schmidt, M. (2011). Dead wood accumulation in abandoned beech (Fagus sylvatica L.) forests in northwestern Germany. For. Ecol. Manag. 261, 342–352. doi: 10.1016/j.foreco.2010.08.037
Moomaw, W. R., Masino, S. A., and Faison, E. K. (2019). Intact forests in the United States: proforestation mitigates climate change and serves the greatest good. Front. For. Glob. Change 2:27. doi: 10.3389/ffgc.2019.00027
Mund, M. (2004). “Carbon pools of European beech forests (Fagus sylvatica) under different silvicultural management” in Dissertation. (Göttingen: Georg-August-Universität Göttingen)
Nagel, R., Meyer, P., Blaschke, M., and Feldmann, E. (2023). Strict forest protection: a meaningful contribution to climate-smart forestry? An evaluation of temporal trends in the carbon balance of unmanaged forests in Germany. Front. For. Glob. Change 6:1099558. doi: 10.3389/ffgc.2023.1099558
Neumann, M., Moreno, A., Mues, V., Härkönen, S., Mura, M., Bouriaud, O., et al. (2016). Comparison of carbon estimation methods for European forests. For. Ecol. Manag. 361, 397–420. doi: 10.1016/j.foreco.2015.11.016
Nord-Larsen, T., Vesterdal, L., Bentsen, N. S., and Larsen, B. J. (2019). Ecosystem carbon stocks and their temporal resilience in a semi-natural beech-dominated forest. For. Ecol. Manag. 447, 67–76. doi: 10.1016/j.foreco.2019.05.038
Nunery, J. S., and Keeton, W. S. (2010). Forest carbon storage in the northeastern United States: net effects of harvesting frequency, post-harvest retention, and wood products. For. Ecol. Manag. 259, 1363–1375. doi: 10.1016/j.foreco.2009.12.029
Penman, J., Gytarsky, M., Hiraishi, T., Krug, T., Kruger, D., Pipatti, R., et al. (2003). Good practice guidance for land use, land-use change and forestry. IPCC report Hayama: Institute for Global Environmental Strategies.
Perin, J., Bauwens, S., Pitchugin, M., Lejeune, P., and Hébert, J. (2019). National forestry accounting plan of Belgium. Gembloux: University of Liège.
Pregitzer, K. S., and Euskirchen, E. S. (2004). Carbon cycling and storage in world forests: biome patterns related to forest age. Glob. Chang. Biol. 10, 2052–2077. doi: 10.1111/j.1365-2486.2004.00866.x
Přívětivý, T., and Šamonil, P. (2021). Variation in downed deadwood density, biomass, and moisture during decomposition in a natural temperate forest. Forests 12:1352. doi: 10.3390/f12101352
R Core Team (2022). R: A language and environment for statistical computing. R Foundation for Statistical Computing, Vienna, Austria. Available at: https://www.R-project.org/
Schaedel, M. S., Larson, A. J., Affleck, D. L. R., Belote, R. T., Goodburn, J. M., and Page-Dumroese, D. S. (2017). Early forest thinning changes aboveground carbon distribution among pools, but not total amount. For. Ecol. Manag. 389, 187–198. doi: 10.1016/j.foreco.2016.12.018
Seedre, M., Kopáček, J., Janda, P., Bače, R., and Svoboda, M. (2015). Carbon pools in a montane old-growth Norway spruce ecosystem in bohemian Forest: effects of stand age and elevation. For. Ecol. Manag. 346, 106–113. doi: 10.1016/j.foreco.2015.02.034
Stakėnas, V., Varnagirytė-Kabašinskienė, I., Sirgedaitė-Šėžienė, V., Armolaitis, K., Araminienė, V., Muraškienė, M., et al. (2020). Dead wood carbon density for the main tree species in the Lithuanian hemiboreal forest. Eur. J. For. Res. 139, 1045–1055. doi: 10.1007/s10342-020-01306-3
Stillhard, J., Hobi, M. L., Brang, P., Brändli, E.-B., Korol, M., Pokynchereda, V., et al. (2022). Structural changes in a primeval beech forest at the landscape scale. For. Ecol. Manag. 504:119836. doi: 10.1016/j.foreco.2021.119836
Triviño, M., Juutinen, A., Mazziotta, A., Miettinen, K., Podkopaev, D., Reunanen, P., et al. (2015). Managing a boreal forest landscape for providing timber, storing and sequestering carbon. Ecosyst. Serv. 14, 179–189. doi: 10.1016/j.ecoser.2015.02.003
Vande Walle, I., Van Camp, N., Perrin, D., Lemeur, R., Verheyen, K., Van Wesemael, B., et al. (2005). Growing stock-based assessment of the carbon stock in the Belgian forest biomass. Ann. For. Sci. 62, 853–864. doi: 10.1051/forest:2005076
Vandekerkhove, K. (2013). “Integration of nature protection in forest policy in Flanders (Belgium)” in INTEGRATE country report (Freiburg: EFICENT-OEF)
Vandekerkhove, K., De Keersmaeker, L., Menke, N., Meyer, P., and Verschelde, P. (2009). When nature takes over from man: dead wood accumulation in previously managed oak and beech woodlands in north-western and central Europe. For. Ecol. Manag. 258, 425–435. doi: 10.1016/j.foreco.2009.01.055
Vandekerkhove, K., De Keersmaeker, L., Walleyn, R., Köhler, F., Crevecoeur, L., Govaere, L., et al. (2011). Reappearance of old-growth elements in lowland woodlands in northern Belgium: do the associated species follow? Silva Fenn. 45, 909–935. doi: 10.14214/sf.78
Weggler, K., Dobbertin, M., Jüngling, E., Kaufmann, E., and Thüring, E. (2012). Dead wood volume to dead wood carbon: the issue of conversion factors. Eur. J. For. Res. 131, 1423–1438. doi: 10.1007/s10342-012-0610-0
Keywords: carbon storage, aboveground biomass, dead wood, forest inventory, forest reserve
Citation: Vanhellemont M, Leyman A, Govaere L, De Keersmaeker L and Vandekerkhove K (2024) Site-specific additionality in aboveground carbon sequestration in set-aside forests in Flanders (northern Belgium). Front. For. Glob. Change. 7:1236203. doi: 10.3389/ffgc.2024.1236203
Edited by:
William R. Moomaw, Tufts University, United StatesReviewed by:
Any Mary Petritan, National Institute for Research and Development in Forestry Marin Dracea (INCDS), RomaniaCopyright © 2024 Vanhellemont, Leyman, Govaere, De Keersmaeker and Vandekerkhove. This is an open-access article distributed under the terms of the Creative Commons Attribution License (CC BY). The use, distribution or reproduction in other forums is permitted, provided the original author(s) and the copyright owner(s) are credited and that the original publication in this journal is cited, in accordance with accepted academic practice. No use, distribution or reproduction is permitted which does not comply with these terms.
*Correspondence: Kris Vandekerkhove, a3Jpcy52YW5kZWtlcmtob3ZlQGluYm8uYmU=
Disclaimer: All claims expressed in this article are solely those of the authors and do not necessarily represent those of their affiliated organizations, or those of the publisher, the editors and the reviewers. Any product that may be evaluated in this article or claim that may be made by its manufacturer is not guaranteed or endorsed by the publisher.
Research integrity at Frontiers
Learn more about the work of our research integrity team to safeguard the quality of each article we publish.