 Basile Luse Belanganayi1,2,3*
 Bhely Angoboy Ilondea4
 Christophe Mbungu Phaka4
 Félix Laurent2,5
 Brice Y. Djiofack2,5
 Chadrack Kafuti5Richard L. Peters1Nils Bourland2
 Hans Beeckman2
 Tom De Mil1
- 1Forest is Life, TERRA Teaching and Research Centre, Gembloux Agro-Bio Tech, University of Liege, Gembloux, Belgium
- 2Service of Wood Biology, Royal Museum for Central Africa (RMCA), Tervuren, Belgium
- 3Department of Biology and Environment, Université Officielle de Ruwenzori, Nord-Kivu, Democratic Republic of Congo
- 4Institut National pour l’Etude et la Recherche Agronomiques, Kinshasa, Democratic Republic of Congo
- 5Department of Forest and Water Management, Gent University, Ghent, Belgium
Introduction: The Congo Basin forests, a crucial global carbon sink, are expected to face increased challenges of climate change by 2027, with an expected temperature rise of 1.5°C above pre-industrial levels, accompanied by increased humidity conditions. However, studies that try to understand their functioning and untangle the species-specific responses about how weather conditions impact secondary growth dynamics are still rare.
Methods: Here we present the results of a study on diel and annual stem growth in 17 trees, belonging to 11 most abundant species, both canopy and understory, in the Mayombe forest (Congo Basin) in the Democratic Republic of the Congo (DRC). We measured highly-resolved radial stem size variations and weather conditions, to comprehend the ongoing patterns of secondary growth and examine the potential influence of projected weather conditions on them.
Results: We found that at the diel scale, trees probably grow mainly from 6pm to 9am, and that at the annual scale, they grow mainly during the rainy season, from October to May. Some trees grow year-round, while others stop growing for a period ranging from 1 to 4 months. This growth cessation typically occurs during the dry season from June to September. A generalized linear mixed-effect model revealed that annual radial stem growth is positively related to rainfall.
Discussion: Our results suggest that trees in the study site have a significant potential to cope with the projected 1.5°C increase in global temperature and an additional 50 mm of local rainfall. Trees of the species T. superba exhibited improved growth under the projected scenarios. For the other tree species, no significant difference in growth was observed between the predicted and observed scenarios. We believe that much remains to be done to better understand the tree growth-climate interaction of the large variety of tree species in the Congo Basin.
1 Introduction
Tropical forests host over half of world species richness (Lewis et al., 2015) and contain 55% of the global terrestrial carbon (Pan et al., 2011). They are particularly rich in other facets of biodiversity, including various patterns of wood anatomy, phenology and tree-growth periodicity (Lowman and Moffett, 1993; Beeckman, 2016; Hubau et al., 2019, 2020). Recent studies have shown that climate change is causing notable shifts in tropical forest ecosystems. Specifically, there is an increase in deciduous canopy species with intermediate light demand and a concurrent decline in evergreen sub-canopy and shade-tolerant species (Fauset et al., 2012). Moreover, higher temperatures (Sullivan et al., 2020), higher Vapor Pressure Deficit (VPD) (Grossiord et al., 2020) and precipitation disturbances, corresponding to dry areas becoming drier and wet areas becoming wetter (Trenberth, 2011; Tsalefac et al., 2015), are expected in tropical regions. This would result to a reduction in their carbon storage capacity and possible vegetation dieback (Holm et al., 2017; Hubau et al., 2020). A recent pan-tropical study clarifies that stem growth variability positively responds to rainfall, and that stem growth of tropical trees is reduced (i.e., smaller ring width) in years when the dry season is warmer and drier than normal (Zuidema et al., 2022). This provides further evidence that the global warmer condition might induce a decline in annual growth (Locosselli et al., 2020; Artaxo et al., 2022). Studying the impact of changing environmental conditions on tree growth and its variability is critical for improving our predictions on the dynamics of forest productivity and their impact on the global carbon cycle (Bonan, 2008; Friedlingstein et al., 2019). It is therefore absolutely necessary to focus current research on understanding their growth dynamics and how they respond to current climate change, and even predict their future responses (Cavaleri et al., 2015; Albert et al., 2019).
As inherently self-scaling, tree secondary growth is a widely used proxy for whole tree growth (Bowman et al., 2013; Ortega Rodriguez et al., 2023). Analyzing secondary growth provides us with the opportunity to understand the direct constraints of environmental variables on tree growth (Friend et al., 2019). To assess tree growth in a detailed way, four approaches exist depending on the timescale: (1) Weekly/biweekly: regular analysis of the cambial zone trough periodic sampling (Rossi et al., 2006a, 2006b), (2) Monthly: decoding periodic information in wood due to the rhythmic anatomical marks by the means of artificial wounding of the cambial zone (Seo et al., 2007; De Mil et al., 2017), (3) Inter-annual: dendrochronology and radiocarbon dating (Groenendijk et al., 2014; Pompa-García and Camarero, 2020; Giraldo et al., 2023), (4) all timescales: direct measurement of changes in girth or in stem radial axis using automatic dendrometers (Drew and Downes, 2009; Deslauriers et al., 2011; Steppe et al., 2015).
The Congo Basin forests constitute the second largest continuous area of tropical rainforest in the world, however, they are still underrepresented in studies of species-specific tree growth performance and resilience in the context of global climate change (Couralet et al., 2013). The studies conducted are more focused on wood anatomy (Couralet et al., 2010; Tarelkin et al., 2016, 2019), leaf phenology (Gond et al., 2013; Fétéké et al., 2017; Angoboy Ilondea et al., 2021), and forest dynamics (Morin-Rivat et al., 2017; Forni et al., 2019; Réjou-Méchain et al., 2021). Often, these studies are based on low-frequency measurements from permanent plots. Very few studies have looked at cambial phenology and radial growth at a high temporal resolution (De Mil et al., 2017, 2019). However, cambial activity and xylem enlargement occur on a short time scale (Deslauriers et al., 2008). As result, it is still particularly unclear how long the growing season lasts in the Congo basin, and whether there is a dormancy period in carbon storage processes.
Due to various physiological processes in trees, such as sap flow and turgor pressure variation in relation to their hydraulic status, tree stems continuously (i.e., daily) fluctuate between shrinking and swelling (Peters et al., 2021), providing insights on water use and hydric stress as the response of sub-daily environmental conditions (Drew and Downes, 2009; Herrmann et al., 2016).
Despite the use of high temporal resolution dendrometers for several decades (Klepper et al., 1971) to measure stem diameter changes on time scales ranging from minutes to years, it has not been easy to completely separate irreversible stem radial growth from elastic tension-driven and elastic osmotically driven changes in bark water content, on a diel scale, although several approaches have been proposed (Deslauriers et al., 2011; Chan et al., 2016; Zweifel, 2016; Zweifel et al., 2016). Two approaches have provided important insights into this subject. First there is the zero growth (ZG) concept (Zweifel et al., 2016), which is based on high-resolution dendrometer measurements, taken on bark only. That approach assumes that growth starts when the stem radius exceeds the previous maxima and ends when the stem starts to shrink again (Zweifel et al., 2021). Secondly, there is the Mencuccini approach (Mencuccini et al., 2017), more precise, which is based on the simultaneous use of high-resolution point dendrometer measurements, taken from both xylem and bark, sap flow measurements and theoretical and statistical models. Despite the higher precision of their approach, Mencuccini et al. (2017) recognize that although not identical, their approach and that of Zweifel et al. (2016) can, under certain conditions, provide similar answers to the question of growth isolation. Thus, the use of ZG theory seems to be the best approximation for isolating growth on a diel basis, when only dendrometer measurements from the bark are available.
According to a new update issued by the World Meteorological Organization (WMO), global near-surface temperatures are very likely to exceed pre-industrial levels by 1.5°C for at least 1 year between 2023 and 2027 and wetter-than-usual conditions in much of Asia and Central Africa (WMO, 2023). The main objective of this study was to gain insights into the existing dynamics of secondary growth, enabling an understanding of the potential influence of weather conditions, particularly under projected scenarios. Assuming we reach the 1.5°C level in the study area and that the precipitation will increase by 2027, we sought to assess how tree growth could be modified with such projected climate changes. We therefore examined: (1) the swelling-shrinking process on a diel basis; (2) the current pattern of annual stem growth; (3) how will weather conditions impact secondary growth dynamics during the phenological year, under projected conditions?
Here we present the results of the first study of diel and annual stem changes in 17 trees, belonging to 11 most abundant species (both canopy and understory, and evergreen and deciduous) of the Mayombe forest (Congo Basin), based on high-resolved continuous measurements of radial stem variations and weather conditions.
2 Materials and methods
2.1 Study site
The study was conducted in Nkula Park, situated in the Luki Man and Biosphere reserve (MAB), which is part of the Mayombe forest in the Congo Basin. The Luki MAB reserve is in the province of Kongo Central at the southwestern part of the Democratic Republic of the Congo (DRC), within latitudes 05°35′S and 05°43′S, and longitudes 13°07′E and 13°15′E (Figure 1). It is classified as a tropical semi-evergreen forest of the Guineo-Congolian rainforest domain. It consists of a mixture of evergreen and deciduous species in the upper-stratum and mostly evergreen species in the understory. Its hilly landscape, with altitude ranged from 150 to 500 m above sea level (Monteiro, 1962), consists of moist green valleys and drier tops (Lubini, 1997). The soil is heterogeneous but has been described as generally ferrallitic, acid and chemically poor (Couralet et al., 2013). Climatic data available from Luki Weather Station (5°38′N, 13°7′E) from 1981 to 2021 shows annual averages of temperature and rainfall estimated at 25°C ± 1.14 and 1,298 ± 353 mm, respectively. The rainfall regime is marked by a distinct dry period of less than 50 mm of monthly rainfall, from May to September. The average minimum and maximum annual temperatures are 19.5°C and 27.9°C, respectively, (Figure 1). The amplitude of the average daily temperature varies monthly from 6.3°C to 11.8°C. It tends to be lower in wetter months and higher in drier months. However, its variation is more marked during rainy months than during relatively dry months. The Nkula park which is located at 13°04′00″E and − 5°38′59′′S, is a protected long-term tree monitoring park (since 1948 until present) where the trees are being monitored for tree growth and phenology (Hubau et al., 2019). A Recent study reveals a total of 218 woody species grouped into 41 families in the Luki MAB reserve. The average tree density is estimated at 433 ± 13 trees per hectare. The families Sterculiaceae, Fabaceae, Ebenaceae, Olacaceae, Rubiaceae, Annonaceae, Myristicaceae, Meliaceae and Sapotaceae have the highest specific importance index values. The diametrical tree distribution is characterized by a predominance of small-diameter trees, and the vertical tree distribution by a predominance of trees in lower strata, between 10 and 20 meters high. These structural features testify to the good natural regeneration capacity of these forests (Bienu et al., 2023).
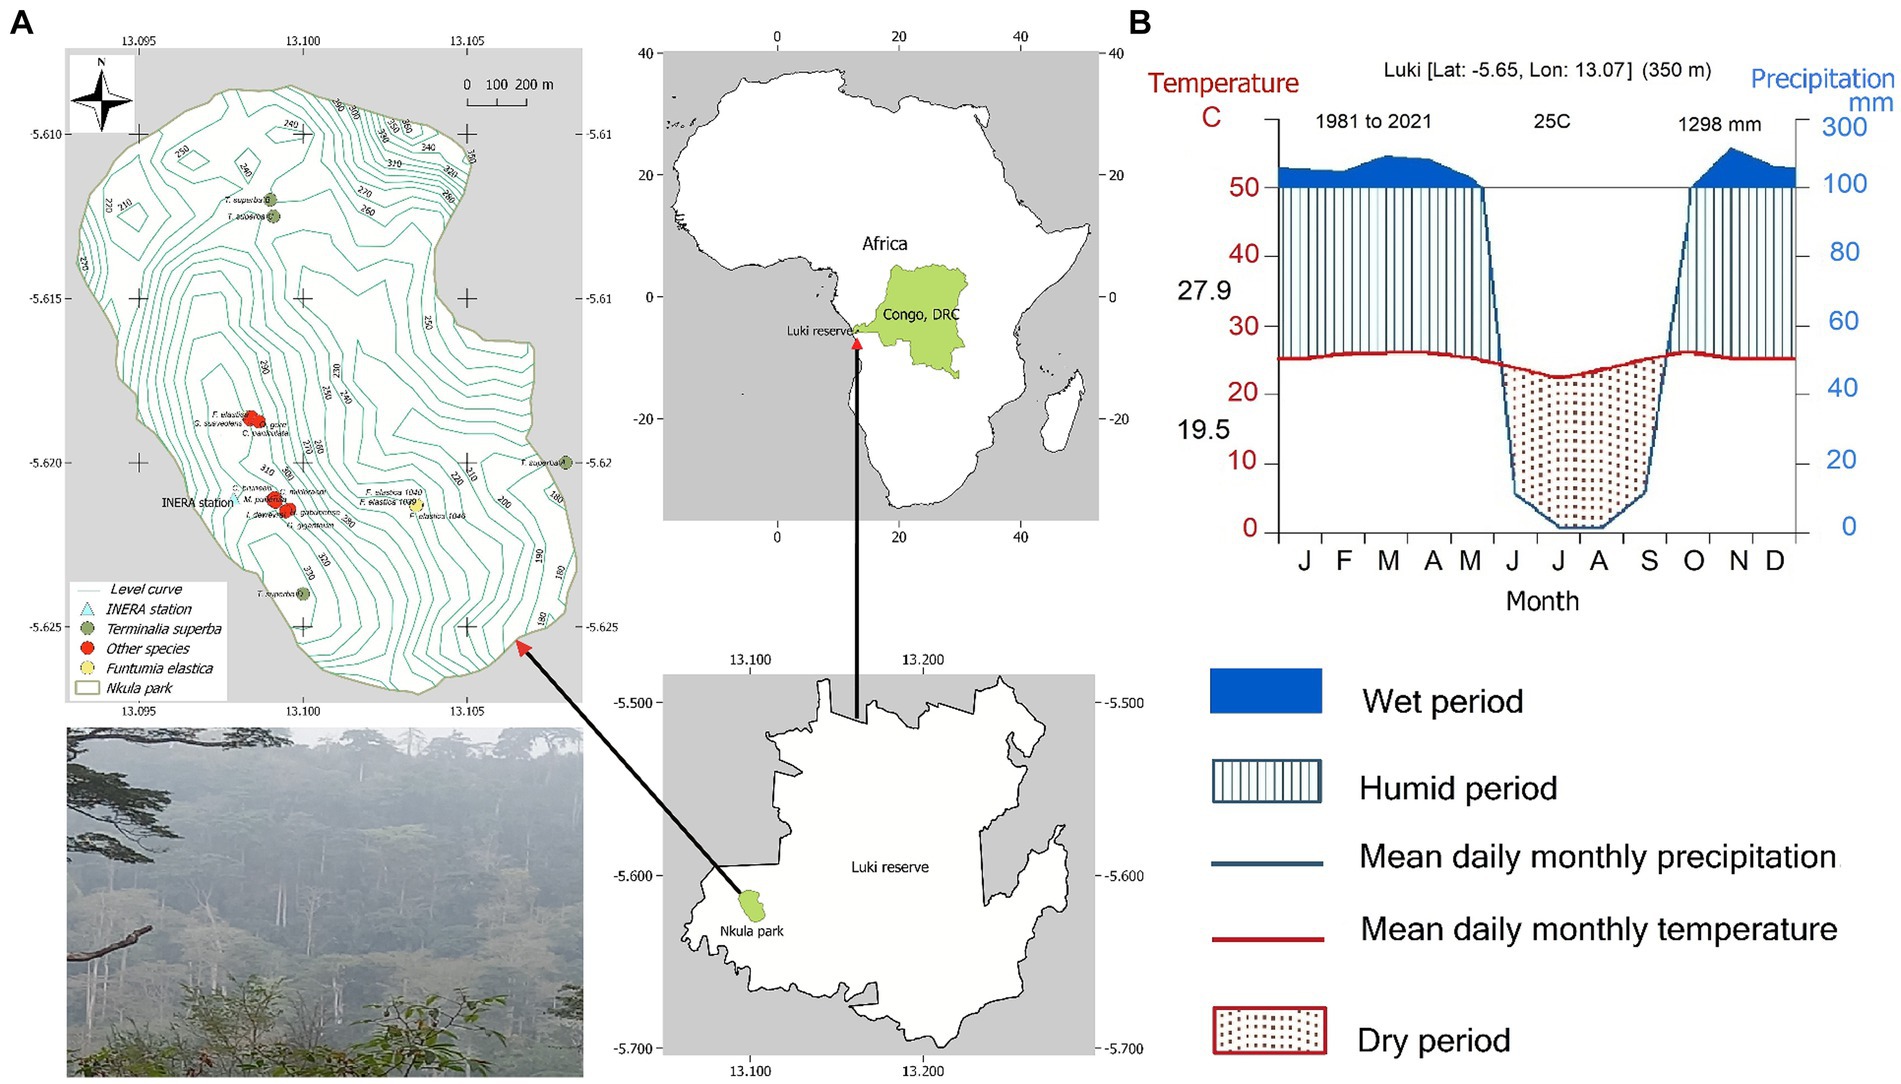
Figure 1. (A) Location of study trees in the Nkula park, and a photo of a part of the Luki Man and the Biosphere Reserve, showing the hilly landscape. (B) Walter-Lieth Climate Diagram of the Luki Man and the Biosphere reserve from 1981 to 2021. The blue line indicates rainfall curve, the red line indicates the temperature curve, the dry season is shown in dashed red. The blue stripes indicate the humid period, and the blue area shows the wet period. Temperatures in black (19.5°C and 27.9°C), on the left axis, represent the average minimum temperature of the coldest month and the average maximum temperature of the warmest month, respectively. The annual average temperature and annual rainfall are shown in the upper right corner of the diagram.
2.2 Monitoring set-up and measurements
Seventeen healthy trees of eleven species, among the most represented, in the Nkula park forest, without apparent stem deformations or morphological anomalies, and within a dbh range of 11–83 cm, were selected and equipped with a point dendrometer (model DR1, Ecomatik, Munich, resolution 0.2 μm, accuracy ±0.1% of reading) at approximately breast height (1.3 m above the ground). Data from 4 trees (Terminalia superba) were taken from a previous study (De Mil et al., 2019) and dendrometers were installed above the buttresses, at 4-5 m height, approximately 30 cm above the buttresses (Rondeux, 1999). Tree heights were measured with a Nikon Forestry pro. Metadata of the monitored trees are given in Table 1.
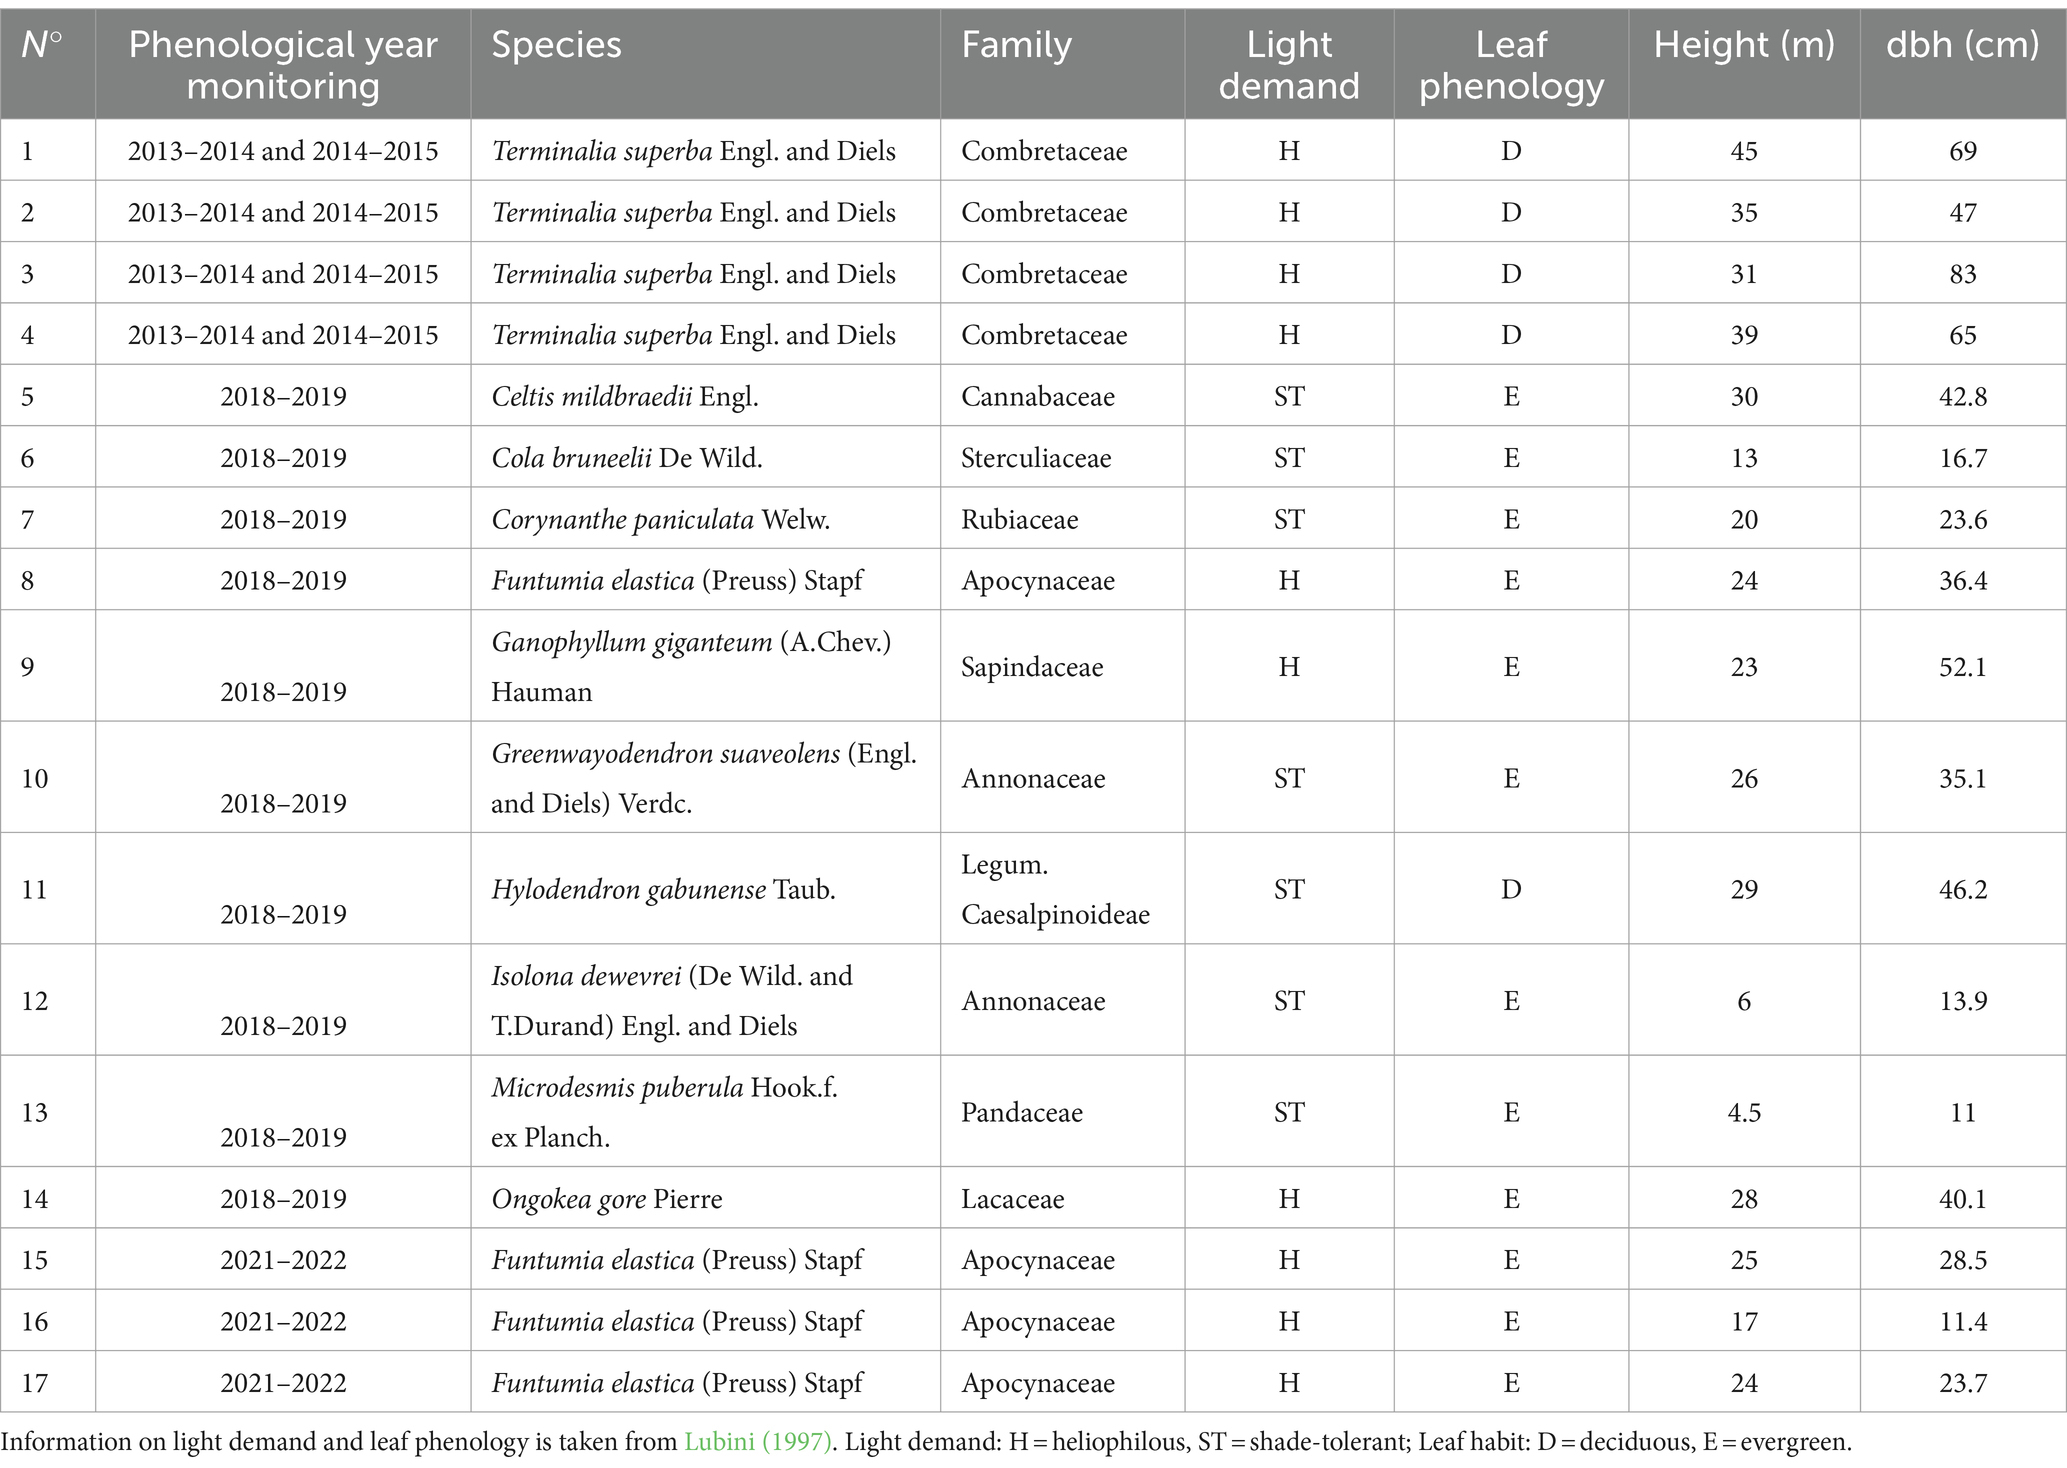
Table 1. Characteristics of 17 trees monitored in Nkula Park.
Measurement of stem-radius daily changes were performed during the phenological years 2013–2014, 2014–2015, 2018–2019, and 2021–2022, at the resolution of 30 min. We evaluated the growth for the period from October 1 (previous year) to September 30 (current year), which we consider to be the beginning and end of the phenological year, respectively. In the following, we will use the terms “year” or “phenological year” indistinctly when referring to this period. And the term “annual” will always refer to the phenological year. We counted the days in days of the phenological year (DOPhY).
During the study period, direct monitoring of air temperature and relative humidity (RH) was performed with a HOBO U23-001 Pro v2 data logger (ONSET, United States), resolution of 30 min, placed at 1.5 m height, under the canopy, in the INERA (Institut National pour l’Étude et la Recherche Agronomiques) weather station site, less than 500 m from the tree’s location. Rainfall data were obtained from https://power.larc.nasa.gov/data-access-viewer/.
The VPD (in kPa) was calculated from the temperature T (in °C) and RH (in %) according to this formula: (Dai et al., 1992; Day, 2000; Grossiord et al., 2020).
2.3 Data analysis and statistical methods
All basic analyses and plots were performed using R studio statistical software (RStudio Team, 2022), although we occasionally used XLSTAT (trial version) and ‘Past 4.11’ (Hammer et al., 2001) to perform some complementary analyses. The package treenetproc (Knüsel et al., 2021), in R studio 4.2.1 (RStudio Team, 2022), was used to clean data of outliers, offsets and erroneous jumps, process and display highly resolved time series of dendrometer data. Based on the ZG theory, the package offers functions to extract the day of the year of the onset and the end of the growing season as well as several characteristics of shrinkage and swelling phases.
To describe the diel characteristics of tree stem shrinkage and swelling, we first calculated an hourly increment rate based on the principle of ZG (Zweifel et al., 2016) as in previous studies (Hogan et al., 2019; Etzold et al., 2022; Kaewmano et al., 2022). According to this principle, cumulative growth increases during periods when the stem radius surpasses its previous maximum. During the remaining time, the stems either shrink or expand below this maximum, with the deviation from the maximum referred to as tree water deficit (TWD). Alternatively, the stem radius may exactly meet its previous maximum (Zweifel et al., 2021). TWD values can also be interpreted as temporal shrinkage rates, based on the considered timescale.
The raw recordings from the dendrometer corresponded to the variation in stem radius, in μm, every 30 min. Using the R package treenetproc, we compiled them over regular 60-min time intervals, then relativized them so that the initial record, corresponding to time t0, was equal to zero. To achieve this, the initial value was subtracted from all records.
On this new data set, if the initial value x0, is not exceeded, it is considered to be the value for all subsequent hours. At these hours, the hourly increment rate is zero. Once the dendrometer registers a value xa, in a given hour ha, such that xa > x0, we consider that a radius variation has occurred equal to xa - x0, corresponding to the increment rate of that hour a. Again, as long as the xa value is not exceeded, all subsequent hours are considered to have an hourly increment rate equal to zero. The hour hb, whose record xb is such that xb > xa, will be associated with a rate of increase xb-xa, and so on. In this way, we were able to obtain hourly increment rates over a full phenological year for each tree. The different values x0, xa, xb, etc., which are such that x0 < xa < xb, are defined as swelling peaks (Figure 2).
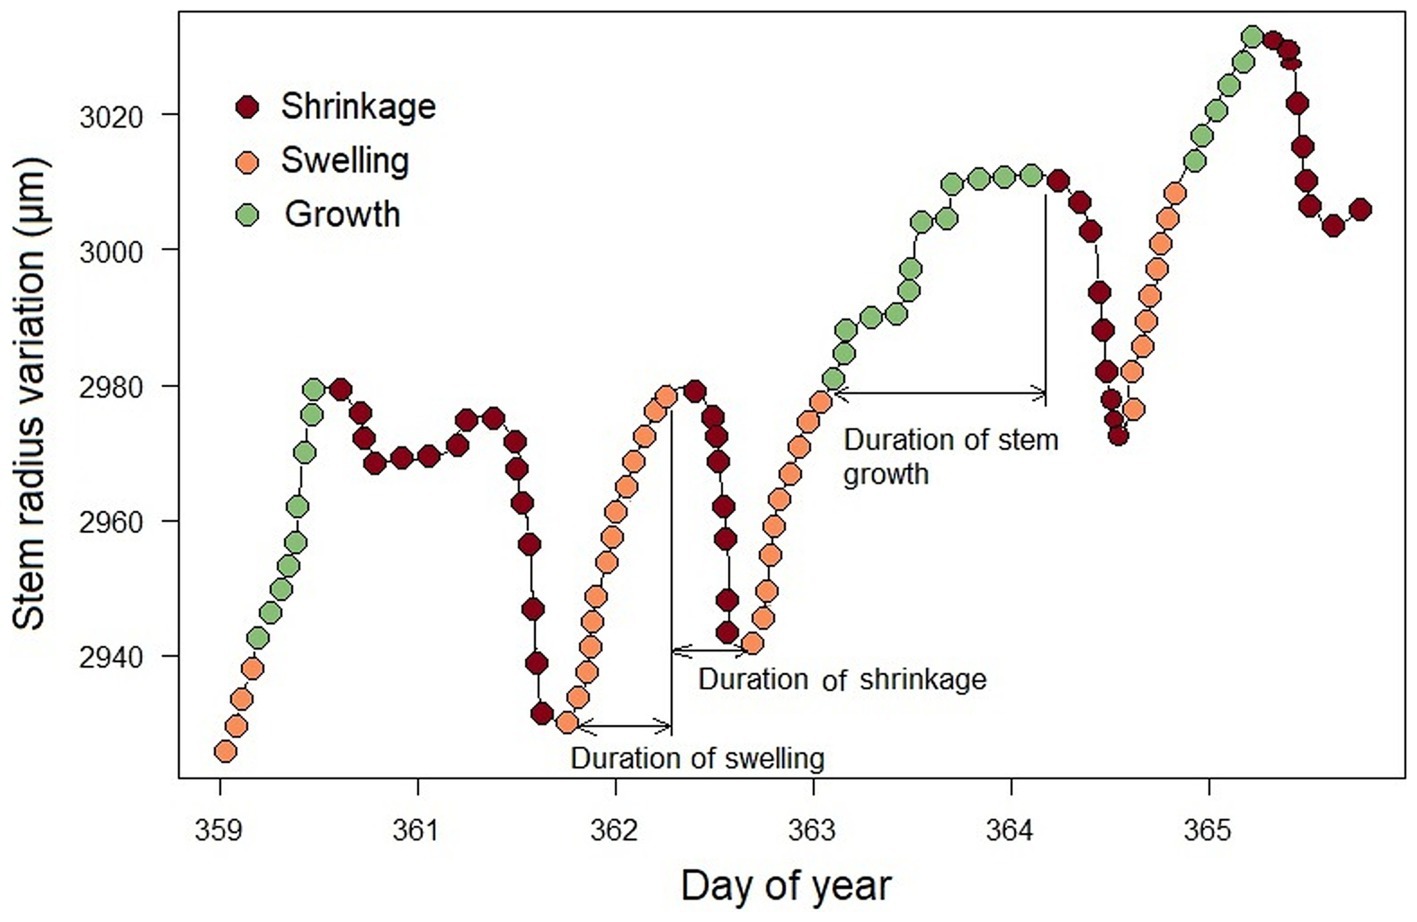
Figure 2. The stem radius variation, divided into three distinct phases of shrinkage (brown dots), swelling (orange and green dots) and stem radius growth (green dots). All points represent dendrometer recordings in μm/h.
The increment rate calculated in this way corresponds to the growth rate (GR), in μm, as defined by Zweifel et al. (2021). However, we do not consider that irreversible stem growth occurs undoubtedly at the times when these rates are reached by the stems. We therefore considered the increment rate to be the difference between the highest swelling peak (in μm), reached at the time under consideration, and the previous swelling peak. This is because, at small time scales, such as sub-diurnal and diurnal, it is difficult to separate, from dendrometer over-bark measurements, irreversible growth from swellings due to the water dynamic in the bark (Mencuccini et al., 2017). On the other hand, convinced that the bi-weekly scale was sufficient to detect irreversible stem growth (D’Orangeville et al., 2022), we calculated biweekly GR based on the ZG principle. The data gathered was then used as a basis for analyzing the response of trees to biweekly environmental variables (mean temperature, mean RH, and sum of rainfall) on an annual scale.
To examine how the radial variation dynamics of tree stems change throughout the day, we analyzed the hourly increment rates of each tree individual plotted against the hours of the day (Figure 3). The data were then organized into boxplots to illustrate the distribution (Figure 3A) and further averaged to show the overall trend for each tree (Figure 3B). The relative hourly shrinkage rate, quantified as the contribution of the average hourly TWD to the total annual TWD, was examined, using the Gaussian RBF kernel model, within the measured space of VPD and diel time for each tree species separately during the rainy season (Figure 3C) and the dry season (Figure 3D).
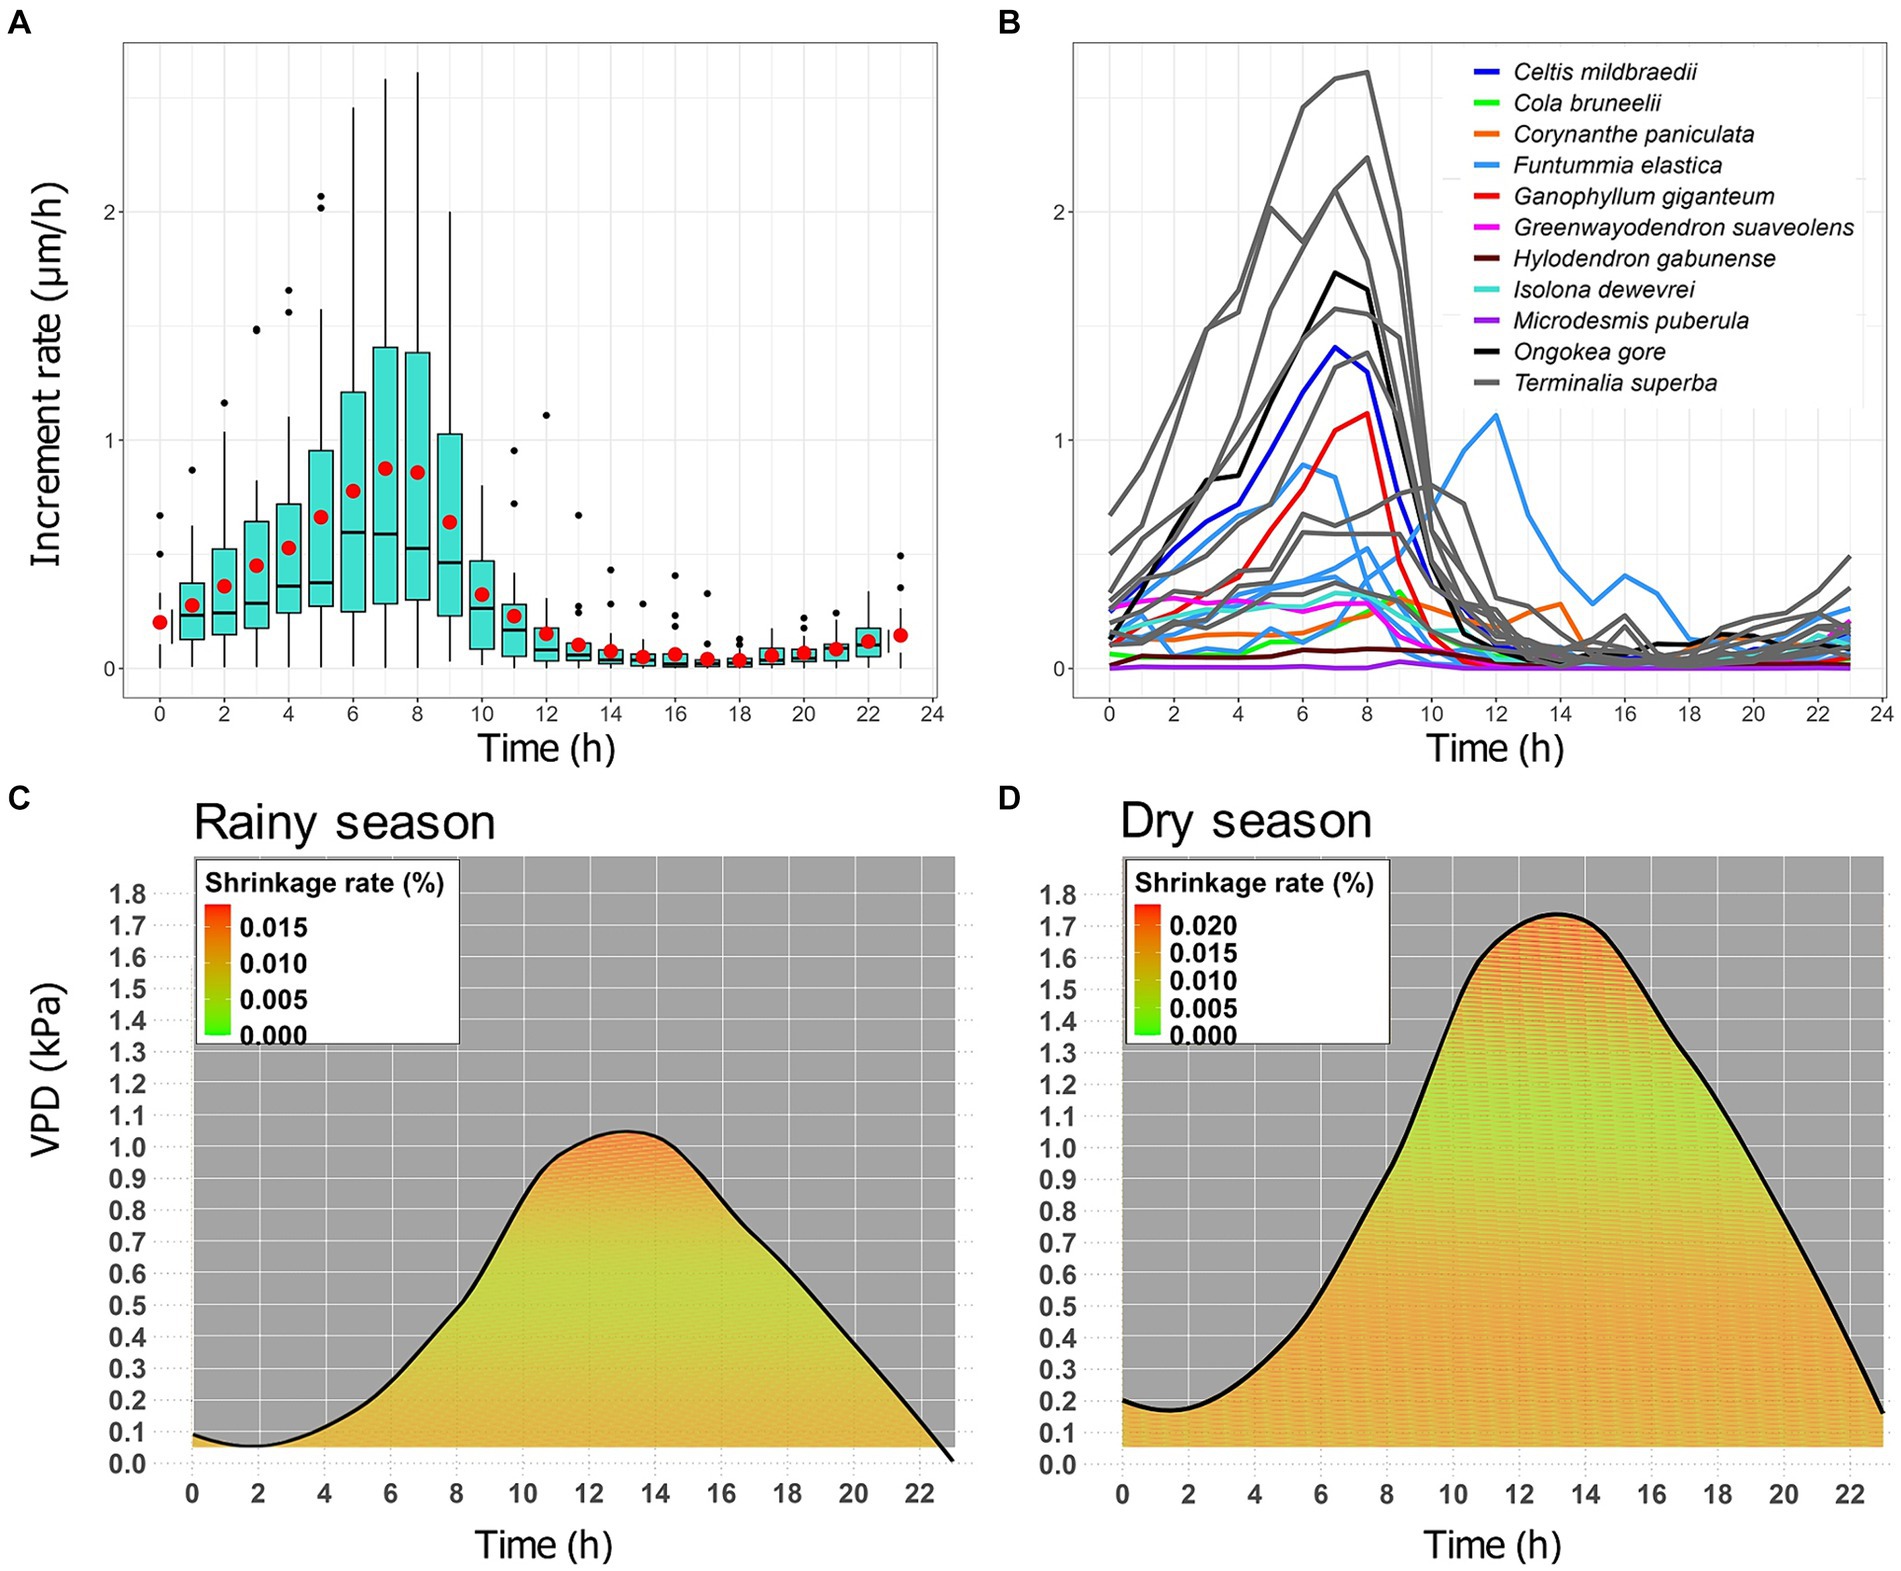
Figure 3. Diel stem change of 17 tropical trees belonging to 11 species. The dataset, shown in figure, consists of hourly increment rates, quantified as the radial increase in μm per hour according to the ZG principle. (A) Boxplots display the median (horizontal line inside the box), 25th and 75th percentiles (horizontal bases of the box) of the pooled data for all tree individuals. The vertical lines attached to the box represent the minimum and maximum values, the red dot represents mean values, and black dots indicate outliers. (B) The lines show the average hourly increment rates for each tree species. (C) and (D) Diel shrinkage rate in relation to VPD and time for all trees individual. The dataset consists of the relative contribution of hourly TWD to the total annual TWD, representing the average hourly shrinkage rate in the rainy season (C) and the dry season (D). It is colored-coded and ranges from green (low shrinkage), through orange (moderate shrinkage) to red (high shrinkage). The black line indicates the average VPD for hours with shrinkage.
To evaluate the potential differences in diurnal and nocturnal levels of environmental variables and their probable influence on the distribution of hourly increment rates during daytime and nighttime periods, we conducted a two-way analysis of variance (two-way ANOVA). This analysis was applied separately to temperature, vapor pressure deficit (VPD), and relative humidity (RH), each categorized into two groups: one comprising data recorded during daytime hours (6 a.m. to 5 p.m.) and the other encompassing data recorded during nighttime hours (6 p.m. to 5 a.m.). Daytime was defined as the period corresponding to the light phase of the day, whereas nighttime referred to the dark phase of the day. Classical clustering was used to compare the onset and end time of growing period, as well as the duration of growth, between different individuals.
To conduct a comparative analysis of diel radial increment rates (Inc_rate) between days characterized by minimal shrinkage and days with more pronounced shrinkage, a generalized linear mixed-effect model (glmer) was fitted using the R package ‘lme4’ (Bates et al., 2024). The model incorporated DOPhY and VPD group as fixed effects, while considering tree individual (Tree_ind) as a random effect. The model was formulated as follows:
Incr_rate ~ DOPhY * VPD_group (1|Tree_ind).
VPD was categorized into two groups: low VPD (<0.7 kPa) and high VPD (≥0.7 kPa). The threshold for defining VPD as low, set at less than 0.7 kPa, was derived from the outcomes of the Gaussian RBF model implemented in this study. This model, which correlated biweekly growth rates with VPD and rainfall, revealed that biweekly growth rates were maximized when VPD values were below 0.7 kPa (Fig S1, and table S1).
To assess the variation of GR of individual trees throughout the year, as dependent to their inherent traits and environmental conditions, we fitted a ‘glmer’ using the R ‘lme4’ package. The species and the environmental variables rainfall, RH, temperature, and their derivative VPD were evaluated as fixed effects. The individual tree and the individual tree nested in species were evaluated as random effect. The full models evaluated were as follows:
1. GR ~ Temp*Prec + Temp*RH + Tree + (1|Species)
2. GR ~ Temp*Prec + RH + Tree + (1|Species)
3. GR ~ Temp*Prec + Tree + (1|Species)
4. GR ~ Temp*Prec + Tree + (1|Tree/Species)
5. GR ~ VPD*Prec + Tree + (1|Tree/Species)
6. GR ~ Temp*RH + Tree + (1|Tree/Species)
The best model fit was selected by comparing Akaike Information Criterion (AIC; Burnham and Anderson, 2002). Using the “predict” function of the ‘lme4’ package, we examined two possible scenarios of the best model: (1) Temperature increase of 1.5°C and biweekly rainfall increase of 25 mm. (2) Temperature increase of 1.5°C and biweekly rainfall increase of 50 mm. We considered a limit of a 50 mm increase in rainfall over each fortnight (2 weeks), as this roughly coincides with a doubling of annual rainfall in the study area. This is a worst-case projection that we imagine occurring in the short term based on WMO forecasts.
Subsequently, we performed a two-way ANOVA test to compare GRs from the projected scenarios with those from observed scenario within each species.
We used the Gaussian Radial Basis Function (RBF) (Shi and Choi, 2011) of the R package Plotly (Sievert et al., 2024), to plot GR in the measured space of environmental variables.
3 Results
3.1 General pattern of stem change
On a diel basis, the majority of trees begin to increase their increment rate from 6 p.m, as soon as sunset. Increment rates peak between 6 and 9 a.m, then decline sharply until 12 p.m. and remain near zero during the day and afternoon. This is the time of day when the most significant shrinkage occurs (Figure 3).
Annual variability in stem radius is, in general, characterized by rapid growth in the rainy season (which theoretically extends from September 15 to May 15), a sharp decrease in growth for some trees, and a complete cessation of growth for others, during the dry season (Figure 4A). We therefore noticed that the majority of trees (14 trees) ceased to grow during the dry season, while F. elastica, G. giganteum and G. suaveolens trees remained active throughout the phenological year (Figures 4A,B). Mainly, growth begins in October and then fluctuates between October and April, depending on the phenological year and the tree species (Figure 4A). From April to June, there is a decline, then from June to September, the majority of trees exhibit limited growth, those that do not experience growth cessation showing reduced growth rates (Figure 4B). The growth cessation was generally longer and clearer in trees of deciduous species than in those of evergreen species. This means that deciduous species (T. superba and H. gabunense) tended to stop growing completely during the dry season and resume growth when the rains return, while evergreen species tended to have only a brief interruption or slowing of radial growth during the dry season (Figures 4A,B). The timing of growth onset and cessation, as well as the duration of the stem growth period are compared in Supplementary Figure S2.
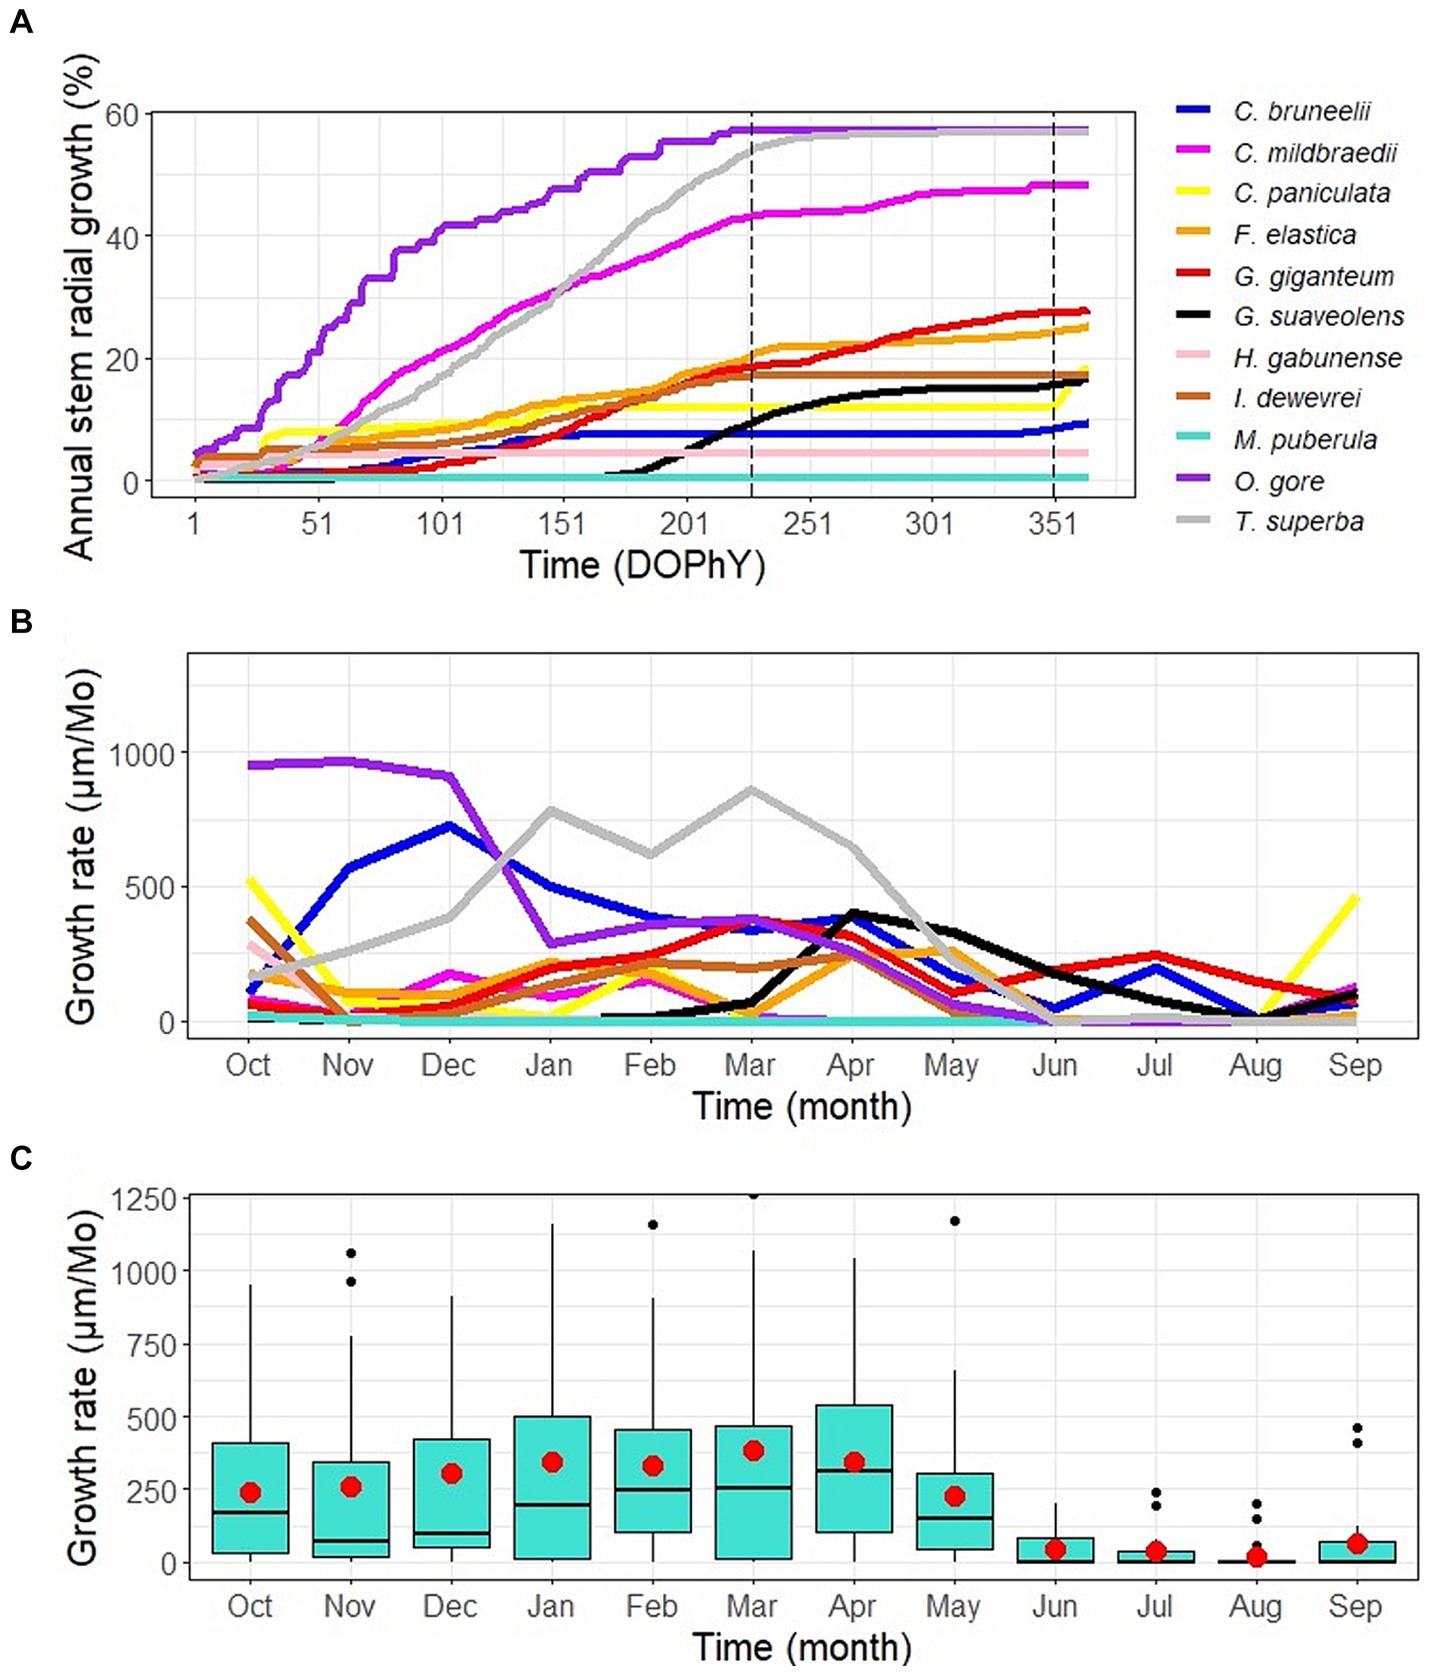
Figure 4. Annual stem radial growth dynamics. (A) Cumulative annual growth. The data set consists of cumulative diel increment rates, quantified as the diel contribution to the total annual growth (in percent). Each curve represents a given tree individual or averaged data for F. elastica and P. superba. The time is in days of the phenological year (DOPhY), with the first day of the phenological year on October 1 and the last day on September 30. The two vertical dashed lines represent the theoretical beginning and end of the dry season, respectively, on May 15 and September 15. (B and C) Annual variation of monthly growth rate of study species trees. (B) The lines show the median monthly growth rate for each species, quantified as the radial increase in micrometers per month. (C) Boxplots show the median monthly growth rate (horizontal line inside the box), 25 and 75 percentiles (horizontal bases of the box) of the pooled data for all tree individuals. Red dots represent mean values, while black dots are outliers.
Understory trees grew slower than dominant statue trees: tree height showed a fairly strong significantly positive correlation (Adjusted R2 = 0.43) with annual growth (Supplementary Figure S3). In particular, the M. puberula tree is too slow growing, with annual growth approaching zero (31.24 μm/year). This tree also has an atypical and short growing period of 33 days. Small-diameter trees have a lower annual growth than large-diameter trees. Indeed, tree diameter showed a moderate significant positive correlation (Adjusted R2 = 0.17) with annual growth (Supplementary Figure S4).
3.2 Stem changes in relation with environmental variables
On a diel basis, stem increment rates were highest at times when VPD was lowest (low temperature and high RH), i.e., from 6 pm to 9 am. The two-way ANOVA conducted to evaluate potential disparities between diurnal and nocturnal levels of environmental variables revealed statistically significant differences in Temperature, VPD, and RH values across all phenological years. During the nighttime, VPD and temperatures exhibited lower values compared to the daytime, whereas RH displayed higher values during the nighttime than during the daytime (Supplementary Figure S5). When the VPD and temperature starts to get low (at 6 pm), trees begin to maximize their radial growth rate, peaking between 6 and 9 am. At around 9 a.m., when the VPD and temperature starts to rise, the increment rate begins to decrease and remains near zero throughout the morning and the afternoon (Figures 3A,B).
VPD tends to be higher during the day than at night, regardless of the time of year. However, it has been observed that VPD values are generally higher during the dry season than during the rainy season (black curve in Figures 3C,D). The Gaussian RBF kernel model showed that VPD accounts for 23% of diel shrinkage in the dry season and 39% in the rainy season. During the rainy season, periods of low shrinkage (colored areas ranging from green to pale orange, Figure 3C) tend to occur for VPD values from 0.2 to 0.7 kPa, with these values most frequently recorded between 9 p.m. and 5 a.m. This suggests that growth tends to predominantly occur during these hours. Conversely, during the dry season, periods of low shrinkage (colored areas ranging from green to pale orange, Figure 3D) occur at higher VPD values, from 0.8 to 1.4 kPa, most often recorded between 8 p.m. and 7 a.m. This implies that growth occurs within a longer time frame compared to the rainy season.
The glmer fitted to analyze daily radial increment rates with DOPhY and VPD, and to compare days characterized by minimal shrinkage and days with more pronounced shrinkage, exhibited a weak explanatory capacity (conditional R2 = 0.02). Within this model, the following observations were noted: The effect of DOPhY was statistically significant and negative [beta = −7.55e-04, 95% CI (−1.13e-03, −3.78e-04), t (7659) = −3.92, p < 0.001; Std. beta = −0.07, 95% CI (−0.11, −0.04)]. The effect of VPD group [Low VPD] was statistically significant and positive [beta = 0.19, 95% CI (0.08, 0.31), t (7659) = 3.23, p < 0.001; Std. beta = 0.06, 95% CI (0.09, 0.19)]. The interaction effect of DOPhY and VPD, when VPD group was “Low VPD,” was statistically significant and negative [beta = −9.82e-03, 95% CI (−0.02, −1.13e-03), t (7659) = −2.22, p = 0.027; Std. beta = −0.06, 95% CI (3.03e-03, 0.11)].
The total explanatory power of the model, indicated by the conditional R-squared (0.02), suggests that the model explains about 2% of the variance in the radial increment rate when considering both fixed and random effect, which is low. The standardized beta coefficient for DOPhY indicates a moderate effect on the diel radial increment rate, but insinuating that as the phenological season progresses, the diel radial increment rate decreases. The standardized beta coefficient for VPD group indicates that during periods characterized by low VPD, the radial increment rate is estimated to increase by 0.19%. The interaction between DOPhY and VPD group indicates that the influence of VPD on radial growth rate varies throughout the phenological year. During the initial phase, characterized by low VPD, i.e., rainy season days, there is an increase in growth rates. However, in the subsequent phase, characterized by high VPD, i.e., as dry season days, growth rates tend to decrease.
On an annual basis, the start of growth does not coincide with the return of the rain, which occurs in the second half of September. Instead, it shifts toward October. Similarly, the end of growth does not occur immediately at the beginning of the dry season, in May. Instead, it occurs around June (Figure 4). The temperature curve has the same tendency as the rainfall curve (Figure 1B). Thus, growth cessation or slowdown occurs during the coldest period of the year. These observations are discussed in detail in the paragraphs that follow.
3.3 Modeling tree’s responses to the environmental variables change
The gmler to predict GR variation throughout the year including the variables temperature, rainfall, RH, and tree as fixed effects and the variable species as random effect, produced the best fit formulated as follows:
GR ~ Temp*Prec + Temp*RH + Tree + (1|Species).
The model’s total explanatory power was substantial (conditional R2 = 0.32) and the part related to the fixed effects alone (marginal R2) was 0.31. A significant positive effect of rainfall [beta = 12.78, 95% CI (5.47, 20.09), t (543) = 3.44, p < 0.001; Std. beta = 0.21, 95% CI (0.08, 0.33)] was found. The interaction between temperature and rainfall was significant and negative [beta = −0.51, 95% CI (−0.81, −0.21), t (543) = −3.37, p < 0.001; Std. beta = −0.24, 95% CI (−0.37, −0.10)].
Temperature and RH showed a non-significant negative effect, while their interaction was non-significant and positive. The effects of different trees varied considerably, emphasizing differences in their growth patterns. Similarly, the random effects for the variable species indicated that the model accounted for variation among tree species.
The results of two-way ANOVA (see Supplementary file) comparing the effects of different temperature-increase scenarios on GR suggest that both tree and scenario variables, along with their interaction, have a significant main effect on GR (p < 0.05). This assumes that the effect of scenario on GR varies across trees. Pairwise comparisons, which provide a better understanding of the specific differences between the effects of the scenarios on each tree, reveal that trees of the T. superba species would be significantly sensitive to the scenarios predicting a temperature increase of 1.5°C associated with an increase in rainfall. This sensitivity appears as a stabilization throughout the year of the biweekly GR around a value of 197 μm with a standard deviation of 60 μm (Supplementary Figure S6). This would imply continuous growth throughout the year. No statistically significant disparity was observed between the effects of the two predicted scenarios and the observed scenario for the rest of the trees in the database.
In the Gaussian RBF model, fitting the observed annual growth pattern, the highest biweekly-resolved annual growth was generally observed at a mean temperature of 21.9 to 25.5°C coupled with rainfall of 80 to 160 mm, corresponding to the greenish to yellow zone in Figure 5. Minimal growth (pale purple to dark areas) is observed in rainfall ranges below 60 mm coupled with temperatures below 23°C, and in a few isolated areas corresponding to temperatures above 25°C and rainfall above 80 mm. The rest of the temperature-rainfall space is occupied by intermediate GR.
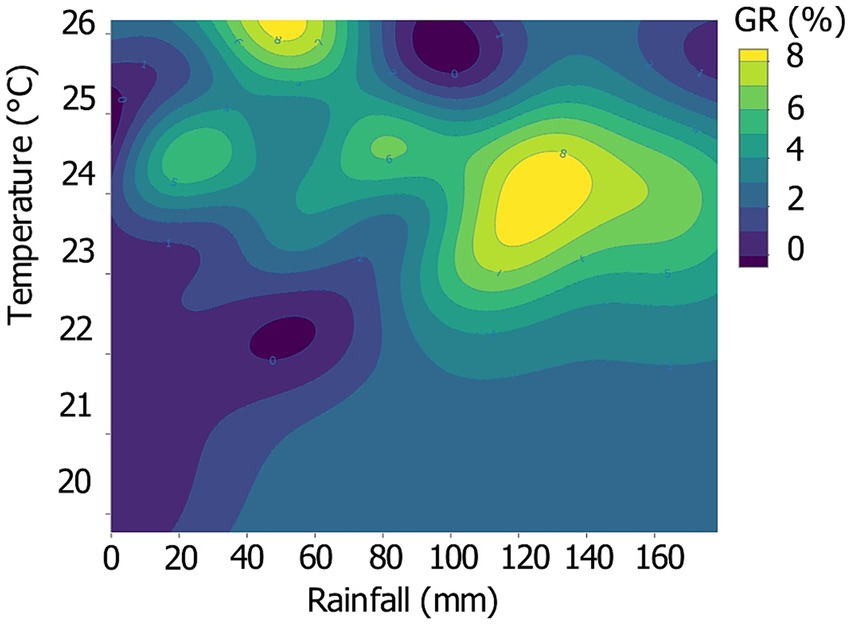
Figure 5. Biweekly-resolved, radial annual GR in the measured space of temperature and rainfall across all individual trees. GR was quantified as the relative annual contribution to the total annual growth for each tree and ranged from dark purple (no growth, 0%), over yellow (marginal growth, ≥ 8%).
4 Discussion
4.1 Diel patterns of stem radial growth
We found that trees begin to maximize their increment rate from 6 pm (Figure 3A), that is to say from sunset, with individual-specific increment rate peaks between 6 am and 12 am (Figure 3B). This period of the day corresponds to the time when trees are assumed to be better supplied with water and therefore likely to provide the best conditions for exceeding the turgor threshold for cell division and expansion (Taiz and Zeiger, 2010; Steppe et al., 2015; Cabon et al., 2020; Zweifel et al., 2021). We are therefore convinced that it is in this time interval that trees grow preferentially on a diel scale. But given the nature of our data, we cannot say with certainty that all the increment rate peaks we observed corresponded to reversible stem growth.
Photosynthesis is the starting point for tree growth. Its primary phase, which requires light, occurs during the daytime. Chlorophyll, the green pigment in leaves, absorbs light energy and converts carbon dioxide from the air and water from the soil into glucose and oxygen. During cellular respiration, the glucose produced during the day is oxidized and broken down into water and carbon dioxide, releasing energy that is used for growth and other cellular functions (Hart, 2012).
While trees respire continuously, both day and night, the respiration process is more noticeable and can appear to be higher at night. During the daylight period, the oxygen produced by photosynthesis can mask the respiration process because it is being released as a byproduct. At night, the production of glucose and oxygen ceases because there is no light to drive photosynthesis. As a result, respiration becomes the primary metabolic activity and is more pronounced. Trees still require energy for maintenance and growth, which comes from breaking down the glucose produced during the day (Eberhard et al., 2008).
4.2 Annual patterns of stem radial growth
The timing of radial growth onset as well as the timing of its end and the length of the stem radius growth period, fluctuates between trees. The classical clustering designed to highlight the difference between tree behavior is shown in Supplementary Figure S7. The onset of radial growth occurs mainly from the beginning of October to mid-November, while the end occurs mainly from mid-May to mid-June. This is in accordance with the observation made by Angoboy Ilondea et al. (2021) on P. balsamifera. A few trees, however, are exceptions to this rule, some remaining active for the whole of the 2018–2019 phenological year, or most of it (e.g., C. mildbraedii, G. giganteum and F. elastica) and others, mainly found in understory, growing for only a few days of the season (e.g., M. puberula, H. gabunense). Taking into account that several disturbances can be observed in a tree due to its presence in the lower strata of a forest (Hladik and Blanc, 1987; De Mil et al., 2017; Hubau et al., 2019), we believe that the abnormal behavior observed on this tree is due to its presence in the understory. This is accordance with previous studies (Ouédraogo et al., 2013; De Mil et al., 2017; Hubau et al., 2019). The understory is a forest layer with a different energy flow, nutrient cycling, biodiversity and regeneration capacity (Hladik and Blanc, 1987; Gilliam, 2007). It is an environment that can be particularly poor in solar radiation so that the chances of survival can be very reduced for some plants (Hladik and Blanc, 1987; Torti et al., 2001).
The few trees that do not stop growing in dry season, are all evergreen, while all individuals of the deciduous species T. superba and H. gabunense have a clear growth cessation.
We found that large-diameter trees exhibited higher total annual growth compared to small- diameter trees (Supplementary Figure S4). However, it’s widely recognized that, within one species, that young, small-diameter trees typically have higher cumulative GR than larger trees: when the diameter of a tree is analyzed, ring-width decreases in size over the years of formation (Speer, 2010). When comparing different species with different life history strategies, numerous other factors come into play. In the present study, small-diameter trees belonged to slower-growing understory species, while large-diameter trees were predominantly from faster-growing canopy species, which tend to form relatively wide growth rings.
The observed trend in cumulative annual growth variation with dbh can be attributed to the differences in the ecological strategies of the species. Understory trees, characterized by smaller diameters, generally experience lower growth due to reduced light availability, which affects their photosynthetic rate and subsequently cambium activity (Van den Berg et al., 2012). This is especially true for light-demanding species, where individuals in the understory (smaller diameters) are exposed to lower light regimes, resulting in decreased cambium activity and growth (Brienen et al., 2010).
4.3 Climatic driving stem radial growth
We found that, on a diel basis, growth preferentially occurs between sunset and early morning. This is a cooler time of day, with little to no sunshine, more humid under the lowest VPD values (Zweifel et al., 2021), while on annual basis, the growth period roughly coincides with the rainy season, the hottest period of the year. This is in accordance with the results of previous studies on tree growth in a seasonal tropical climate (Trouet et al., 2006; Couralet et al., 2010). Basically, plant growth is largely attributed to a conjunction of climatic variables including, mainly, precipitation, temperature, RH, VPD, solar radiation, atmospheric gases (Wagner et al., 2014), etc. Previous experiments have shown that the rate of photosynthesis is critically dependent on variables such as temperature and light intensity (Feeley et al., 2020; Perez and Feeley, 2020). It is well known that the temperature dependence of photosynthesis varies with the growing environment and species. For each environment, there is a temperature range in which photosynthetic enzymes function at their optimal level, resulting in high rates of photosynthesis. At temperatures outside this range, the enzymes that carry out photosynthesis do not function efficiently, which decreases the rate of photosynthesis (Medlyn et al., 2002; Perez and Feeley, 2020). Although trees form new cells using the carbohydrates produced during photosynthesis, it is not primarily the availability of carbohydrates that limits their growth, but the water tension within them. This is mainly due to the humidity of the air, which is higher at nighttime than during the daytime. Even on moist soils, trees grow mainly at night, because the drier daytime air inhibits their growth (Zweifel et al., 2021).
On a diel basis, during the light phase of photosynthesis, which takes place during the daytime, plants need sunlight and CO2. During the dark phase, which takes place at night, plants have to open their stomata and simultaneously assimilate the glucose synthesized during the light phase. This requires a decrease in temperature and an increase in relative humidity, as high temperature induces transpiration which reduces water potential and turgor pressure in the cambium, both essential for cambial cell division and expansion (Peters et al., 2021). The observed diel patterns in VPD and its correlation with growth dynamics can be attributed to a combination of environmental and physiological factors. The higher VPD during the day compared to nighttime is a consequence of solar radiation and temperature fluctuations. During daylight hours, solar radiation, and temperatures typically peak, leading to increased evapotranspiration rates and subsequently higher VPD. Conversely, at night, without the influence of direct sunlight, temperatures drop, leading to lower evapotranspiration rates and consequently lower VPD (Grossiord et al., 2020; Peters et al., 2021). The Gaussian RBF kernel model indicates that VPD is a significant factor in both seasons. However, its influence is more pronounced during the rainy season. The disparity in VPD values between the dry and rainy seasons can be primarily attributed to differences in atmospheric moisture content. During the dry season, characterized by reduced rainfall and lower relative humidity, the atmosphere holds less moisture, resulting in higher VPD values. Conversely, during the rainy season, increased rainfall and higher humidity levels contribute to lower VPD values. Periods of low shrinkage occur over a longer nighttime duration during the dry season compared to the rainy season, because the dry season in Luki is characterized by lower temperatures than the rainy season. This results in an extended period of cooler diel temperatures conducive to low evapotranspiration.
We obtained significant findings regarding the correlation between weather conditions and tree growth by examining how temperature, rainfall, RH, and VPD influence radial stem growth throughout the phenological year, while considering the effects of individual trees. The model we fitted accounts for a substantial part of the observed variability in radial growth, underlining the importance of environmental variables and individual trees and species effects on tree growth.
Our results revealed that rainfall had a significant positive effect on tree growth, suggesting that higher levels of rainfall promote tree growth. This is often observed in tropical forests with a marked dry season as attested in the pre-existing literature (Worbes, 1999; Vieira et al., 2004; Brienen and Zuidema, 2005; Gliniars et al., 2013). The essential role of rainfall in tree growth explains the time lag between the start of the dry season and the initiation of tree growth, as well as between the end of the dry season and the end of tree growth. However, sensitivity to water stress varies among tree species, depending on their phenological-functional group. While individuals of evergreen species show a certain variability in their sensitivity to drought, individuals of deciduous species appear to be more sensitive to both air and soil drought, as supported by De Souza et al. (2020). For trees that experience growth cessation, this occurs between June and September, the period when the water potential is lowest (Worbes, 1999). Even trees that are continuously active throughout the whole year experience growth decrease during the dry period. However, we found that radial growth starts soon after the beginning of the rainy season and continues until some days or weeks after the beginning of the dry season (Figure 4). This is in accordance with previous research (Worbes, 1999; Angoboy Ilondea et al., 2021) and can be explained as follows: Decrease in rainfall during the dry season leads to a decrease in soil water potential (Spanner et al., 2022). As the dry season progresses, the soil water content decreases and so does the water potential (Kursar et al., 1995). Because of this decrease in water potential, tree growth reduces, depending on the resistance to water deficit of each one. At the most severe part of the dry period, tree water potential reaches a minimum and trees enter a period of cambial dormancy (Worbes, 1999).
The effect of temperature was statistically non-significant and negative on radial tree growth. This indicates that due to its current low variability in Luki, temperature (Couralet et al., 2010) has no effect on tree growth. However, if it were to increase, it might attenuate the beneficial positive effects of rainfall on tree growth, as demonstrated in several previous studies (Doughty, 2011; Locosselli et al., 2020). This explains why we found a statically significant negative effect of the interaction between temperature and rainfall on radial stem growth. Numerous others studies show that certain tropical tree already responds negatively to temperature (Schippers et al., 2015; Anderson-Teixeira et al., 2022). It therefore appears that tropical forests do not react homogeneously to temperature increase, as their reactions vary considerably based on species, sites and geographical regions (Bauman et al., 2022; Chowdhury et al., 2023).
By simulating temperature increases of 1.5°C along with two levels of biweekly rainfall augmentation (25 mm and 50 mm), we highlighted the differing sensitivities of tree species to climate change. Trees of the T. superba species exhibited notable sensitivity to the projected scenarios, unlike trees of the other species: their annual GR remains close to an average value throughout the year (Supplementary Figure S6). It seemed that the rise in rainfall enhanced growth as anticipated, while the rise in temperature continued to show no impact on growth. This implies that if the temperature and rainfall increase forecasted by the WMO were to occur in similar proportions to the scenarios we examined, it could potentially benefit the growth of specific species in Luki, particularly deciduous species. This would allow them to mitigate water stress during the dry season, which had previously hindered their growth.
The study revealed statistically non-significant effects of RH on tree growth. Luki’s hilly landscape and proximity to the Atlantic Ocean results in persistent mists yearlong. In the driest months, a dense cloud cover obstructs solar radiation, leading to a decrease in temperature. These conditions compensate partially for rainfall shortage and maintain a RH favorable to tree growth throughout the year (Sénéchal et al., 1989; Lubini, 1997). Consequently, despite relatively low annual rainfall during the three to 4 months of the dry season (less than 60 mm of rain per month), plants do not suffer severe water stress (Lubini, 1997; Couralet et al., 2013).
The distribution of GR values in the temperature-rainfall space (Figure 5) underscores the impact of the dry season (rainfall below 60 mm), where low GRs are prevalent, sometimes reaching zero. This clearly indicates that not all trees cease growth during this period. Conversely, it also emphasizes the modest growth observed at temperatures exceeding 25°C, despite adequate rainfall levels. These findings are further supported by the observation that the annual growth curves of some trees peak during the dry season (Figure 4) and confirm the inclination of Luki’s trees to cope with the projected rise in temperature and rainfall. Paleoecological data from Africa indicate a non-linear and spatially heterogeneous response to climate change, i.e., little change until a certain threshold is crossed, followed by rapid ecosystem change. It appears that the tropical rainforests of West and Central Africa have remained largely resilient over the last 1,000 years in the face of moderate climate change. Their resilience can be attributed to the diverse and complex natural processes inherent to these ecosystems. It is, rather, the current increase in human impacts and pressures that would assign them an uncertain and unpredictable potential future (Giresse et al., 2023). There is every reason to believe that if trees were to experience growth disturbances in Luki’s forests, deciduous species would be more vulnerable than evergreen species (De Souza et al., 2020).
4.4 Potential limitations of the results
There are some limitations to this study. We maximized species covering and the number of replicates per species is low. Logistically, it was not possible to consider several other factors that could enable to better describe the secondary growth dynamics of the Congo Basin trees under a changing climate. These include the microclimate of each tree, forest stratum (understory or canopy), soil parameters such as soil moisture, rooting depth, simultaneous measurements of stem radius variation on both xylem and bark, and the monitoring of several individuals for each species. We believe that studies over several phenological year, including a larger number of trees per species and combining precision dendrometer monitoring with analysis of cambial activity and leaf phenology monitoring, are needed to provide a better understanding of secondary growth dynamics in the Congo Basin. Emphasis should be placed on understanding the intraspecific heterogeneity of growth responses to as many environmental variables as possible, to identify species or populations that may be more resistant or vulnerable to changing environmental conditions.
5 Conclusion
Our results demonstrate that on a diel basis, tropical trees preferentially grow between sunset and early morning, and on an annual basis, mainly during the rainy season.
The annual growth pattern indicates an overlap of the growing season with the rainy season for most trees. Furthermore, our study highlighted the fact that Luki’s unique weather conditions, due to its hilly relief and proximity to the Atlantic Ocean, shelters the trees from severe water stress and high temperatures, particularly during the dry season. We showed that trees in the Luki Man and the Biosphere reserve possess considerable chance to cope with the predicted increase in global temperature and local rainfall.
Data availability statement
The original contributions presented in the study are included in the article/Supplementary material, further inquiries can be directed to the corresponding author.
Author contributions
BL, HB, NB, and TM designed the study. BL, BA, BD, CM, FL, CK, and TM collected the data in the field. BL analyzed the data and wrote the manuscript. TM, HB, and RP reviewed the manuscript.
Funding
This research was carried out thanks to a grant awarded by the Royal Museum for Central Africa within the framework of the PilotMAB project, which is funded by the Directorate General for Development Cooperation and Humanitarian Aid (DGD). Additional funding was obtained from the non-profit association NATURE PLUS. The Belgian Directorate General for Development Cooperation and Humanitarian Aid (DGD).
Acknowledgments
We are grateful to the management of the Royal Museum for Central Africa, The Regional Post-Graduate Training School on Integrated Management of Tropical Forests and Lands (ERAIFT), and the Institut National pour l’Etude et la Recherche Agronomiques - Luki (INERA-Luki).
Conflict of interest
The authors declare that the research was conducted in the absence of any commercial or financial relationships that could be construed as a potential conflict of interest.
Publisher’s note
All claims expressed in this article are solely those of the authors and do not necessarily represent those of their affiliated organizations, or those of the publisher, the editors and the reviewers. Any product that may be evaluated in this article, or claim that may be made by its manufacturer, is not guaranteed or endorsed by the publisher.
Supplementary material
The Supplementary material for this article can be found online at: https://www.frontiersin.org/articles/10.3389/ffgc.2024.1185225/full#supplementary-material
References
Albert, L. P., Restrepo-Coupe, N., Smith, M. N., Wu, J., Chavana-Bryant, C., Prohaska, N., et al. (2019). Cryptic phenology in plants: case studies, implications, and recommendations. Glob. Chang. Biol. 25, 3591–3608. doi: 10.1111/gcb.14759
Anderson-Teixeira, K. J., Herrmann, V., Rollinson, C. R., Gonzalez, B., Gonzalez-Akre, E. B., Ped-erson, N., et al. (2022). Joint effects of climate, tree size, and year on annual tree growth derived from tree-ring records of ten globally distributed forests. Glob. Chang. Biol. 28, 245–266. doi: 10.1111/gcb.15934
Angoboy Ilondea, B., Beeckman, H., Van Acker, J., Van den Bulcke, J., Fayolle, A., Couralet, C., et al. (2021). Variation in onset of leaf unfolding and wood formation in a central African tropical tree species. Front. For. Glob. Change 4:152. doi: 10.3389/ffgc.2021.673575
Artaxo, P., Hansson, H.-C., Andreae, M. O., Bäck, J., Alves, E. G., Barbosa, H. M. J., et al. (2022). Tropical and boreal Forest – atmosphere interactions: a review. Tellus B 74:24. doi: 10.16993/tellusb.34
Bates, D., Maechler, M., Bolker, B., Walker, S., Christensen, R. H. B., Singmann, H., et al. (2024). lme4: Linear Mixed-Effects Models using “Eigen” and S4 (1.1–35.3). Available at: https://cran.r-project.org/web/packages/lme4/index.html
Bauman, D., Fortunel, C., Cernusak, L. A., Bentley, L. P., McMahon, S. M., Rifai, S. W., et al. (2022). Tropical tree growth sensitivity to climate is driven by species intrinsic growth rate and leaf traits. Glob. Chang. Biol. 28, 1414–1432. doi: 10.1111/gcb.15982
Beeckman, H. (2016). Wood anatomy and trait-based ecology. IAWA J. 37, 127–151. doi: 10.1163/22941932-20160127
Bienu, S. A., Lubalega, T. K., Khasa, D. P., kaviriri, D. K., Yang, L., Yuhua, L., et al. (2023). Floristic diversity and structural parameters on the forest tree population in the Luki biosphere reserve, Democratic Republic of Congo. Glob. Ecol. Conserv. 44:e02489. doi: 10.1016/j.gecco.2023.e02489
Bonan, G. B. (2008). Forests and climate change: forcings, feedbacks, and the climate benefits of forests. Science 320, 1444–1449. doi: 10.1126/science.1155121
Bowman, D. M. J. S., Brienen, R. J. W., Gloor, E., Phillips, O. L., and Prior, L. D. (2013). Detecting trends in tree growth: not so simple. Trends Plant Sci. 18, 11–17. doi: 10.1016/j.tplants.2012.08.005
Brienen, R. J. W., and Zuidema, P. A. (2005). Relating tree growth to rainfall in Bolivian rain forests: a test for six species using tree ring analysis. Oecologia 146, 1–12. doi: 10.1007/s00442-005-0160-y
Brienen, R. J. W., Zuidema, P. A., and Martínez-Ramos, M. (2010). Attaining the canopy in dry and moist tropical forests: strong differences in tree growth trajectories reflect variation in growing conditions. Oecologia 163, 485–496. doi: 10.1007/s00442-009-1540-5
Burnham, K. P., and Anderson, D. R. (2002). Model selection and multimodel inference. New York: Springer.
Cabon, A., Fernández-de-Uña, L., Gea-Izquierdo, G., Meinzer, F. C., Woodruff, D. R., Martínez-Vilalta, J., et al. (2020). Water potential control of turgor-driven tracheid enlargement in scots pine at its xeric distribution edge. New Phytol. 225, 209–221. doi: 10.1111/nph.16146
Cavaleri, M. A., Reed, S. C., Smith, W. K., and Wood, T. E. (2015). Urgent need for warming experiments in tropical forests. Glob. Chang. Biol. 21, 2111–2121. doi: 10.1111/gcb.12860
Chan, T., Hölttä, T., Berninger, F., Mäkinen, H., Nöjd, P., Mencuccini, M., et al. (2016). Separating water-potential induced swelling and shrinking from measured radial stem variations reveals a cambial growth and osmotic concentration signal. Plant Cell Environ. 39, 233–244. doi: 10.1111/pce.12541
Chowdhury, T., Islam, M., and Rahman, M. (2023). Long-term growth and xylem hydraulic responses of Al-bizia procera (Roxb.) Benth. To climate in a moist tropical forest of Bangladesh. PPEES 61:125762. doi: 10.1016/j.ppees.2023.125762
Couralet, C., Sterck, F. J., Sass-Klaassen, U., Van Acker, J., and Beeckman, H. (2010). Species-specific growth responses to climate variations in understory trees of a central African rain forest. Biotropica 42, 503–511. doi: 10.1111/j.1744-7429.2009.00613.x
Couralet, C., Van den Bulcke, J., Ngoma, L., Van Acker, J., and Beeckman, H. (2013). Phenology in functional groups of central African rainforest trees. J. Trop. For. Sci. 25, 361–374.
D’Orangeville, L., Itter, M., Kneeshaw, D., Munger, J. W., Richardson, A. D., Dyer, J. M., et al. (2022). Peak radial growth of diffuse-porous species occurs during periods of lower water availability than for ring-porous and coniferous trees. Tree Physiol. 42, 304–316. doi: 10.1093/treephys/tpab101
Dai, Z., Edwards, G. E., and Ku, M. S. B. (1992). Control of photosynthesis and stomatal conductance in Ricinus communis L. (Castor bean) by leaf to air vapor pressure deficit. Plant Physiol. 99, 1426–1434. doi: 10.1104/pp.99.4.1426
Day, M. E. (2000). Influence of temperature and leaf-to-air vapor pressure deficit on net photosynthesis and stomatal conductance in red spruce (Picea rubens). Tree Physiol. 20, 57–63. doi: 10.1093/treephys/20.1.57
De Mil, T., Angoboy Ilondela, B., Maginet, S., Duvillier, J., Van Acker, J., Beeckman, H., et al. (2017). Cambial activity in the understory of the Mayombe forest, DR Congo. Trees 31, 49–61. doi: 10.1007/s00468-016-1454-x
De Mil, T., Hubau, W., Angoboy Ilondea, B., Rocha Vargas, M. A., Boeckx, P., Steppe, K., et al. (2019). Asynchronous leaf and cambial phenology in a tree species of the Congo Basin requires space–time conversion of wood traits. Ann. Bot. 124, 245–253. doi: 10.1093/aob/mcz069
De Souza, B. C., Carvalho, E. C. D., Oliveira, R. S., de Araujo, F. S., de Lima, A. L. A., and Rodal, M. J. N. (2020). Drought response strategies of deciduous and evergreen woody species in a seasonally dry neotropical forest. Oecologia 194, 221–236. doi: 10.1007/s00442-020-04760-3
Deslauriers, A., Rossi, S., Anfodillo, T., and Saracino, A. (2008). Cambial phenology, wood formation and temperature thresholds in two contrasting years at high altitude in southern Italy. Tree Physiol. 28, 863–871. doi: 10.1093/treephys/28.6.863
Deslauriers, A., Rossi, S., Turcotte, A., Morin, H., and Krause, C. (2011). A three-step procedure in SAS to analyze the time series from automatic dendrometers. Dendrochronologia 29, 151–161. doi: 10.1016/j.dendro.2011.01.008
Doughty, C. E. (2011). An in situ leaf and branch warming experiment in the Amazon. Biotropica 43, 658–665. doi: 10.1111/j.1744-7429.2010.00746.x
Drew, D. M., and Downes, G. M. (2009). The use of precision dendrometers in research on daily stem size and wood property variation: a review. Dendrochronologia 27, 159–172. doi: 10.1016/j.dendro.2009.06.008
Eberhard, S., Finazzi, G., and Wollman, F.-A. (2008). The dynamics of photosynthesis. Annu. Rev. Genet. 42, 463–515. doi: 10.1146/annurev.genet.42.110807.091452
Etzold, S., Sterck, F., Bose, A. K., Braun, S., Buchmann, N., Eugster, W., et al. (2022). Number of growth days and not length of the growth period determines radial stem growth of temperate trees. Ecol. Letters 25, 427–439. doi: 10.1111/ele.13933
Fauset, S., Baker, T. R., Lewis, S. L., Feldpausch, T. R., Affum-Baffoe, K., Foli, E. G., et al. (2012). Drought-induced shifts in the floristic and functional composition of tropical forests in Ghana. Ecol. Letters 15, 1120–1129. doi: 10.1111/j.1461-0248.2012.01834.x
Feeley, K., Martinez-Villa, J., Perez, T., Silva Duque, A., Triviño Gonzalez, D., and Duque, A. (2020). The thermal tolerances, distributions, and performances of tropical montane tree species. Front. For. Glob. Change 3:25. doi: 10.3389/ffgc.2020.00025
Fétéké, F., Fayolle, A., Dainou, K., Bourland, N., Dié, A., Lejeune, P., et al. (2017). Variations saisonnières de la croissance diamétrique et des phénologies foliaire et reproductive de trois espèces ligneuses commerciales d’afrique centrale. Bois For. Trop. 330:3. doi: 10.19182/bft2016.330.a31315
Forni, E., Rossi, V., Gillet, J.-F., Bénédet, F., Cornu, G., Freycon, V., et al. (2019). Dispositifs permanents de nouvelle génération pour le suivi de la dynamique forestière en Afrique centrale: bilan en République du Congo. Bois For. Trop. 341, 55–70. doi: 10.19182/bft2019.341.a31760
Friedlingstein, P., Allen, M., Canadell, J. G., Peters, G. P., and Seneviratne, S. I. (2019). Comment on “the global tree restoration potential.” Science 366:6463. doi: 10.1126/science.aay8060
Friend, A. D., Eckes-Shephard, A. H., Fonti, P., Rademacher, T. T., Rathgeber, C. B. K., Richardson, A. D., et al. (2019). On the need to consider wood formation processes in global vegetation models and a suggested approach. Ann. For. Sci. 76:49. doi: 10.1007/s13595-019-0819-x
Gilliam, F. S. (2007). The ecological significance of the herbaceous layer in temperate forest ecosystems. Bioscience 57, 845–858. doi: 10.1641/B571007
Giraldo, J. A., Del Valle, J. I., González-Caro, S., David, D. A., Taylor, T., Tobón, C., et al. (2023). Tree growth periodicity in the ever-wet tropical forest of the americas. J. Ecol. 111, 889–902. doi: 10.1111/1365-2745.14069
Giresse, P., Maley, J., and Chepstow-Lusty, A. (2023). A focus on the last 1000 years of natural environmental changes in the tropical rainforests of west and Central Africa. Can we detect anthropogenic disturbances? Glob. Planet. Change 220:103995. doi: 10.1016/j.gloplacha.2022.103995
Gliniars, R., Becker, G. S., Braun, D., and Dalitz, H. (2013). Monthly stem increment in relation to climatic variables during 7 years in an east African rainforest. Trees 27, 1129–1138. doi: 10.1007/s00468-013-0863-3
Gond, V., Fayolle, A., Pennec, A., Cornu, G., Mayaux, P., Camberlin, P., et al. (2013). Vegetation structure and greenness in Central Africa from Modis multi-temporal data. Philos. Trans. R. Soc. Lond. Ser. B Biol. Sci. 368:20120309. doi: 10.1098/rstb.2012.0309
Groenendijk, P., Sass-Klaassen, U., Bongers, F., and Zuidema, P. A. (2014). Potential of tree-ring analysis in a wet tropical forest: a case study on 22 commercial tree species in Central Africa. For. Ecol. Manag. 323, 65–78. doi: 10.1016/j.foreco.2014.03.037
Grossiord, C., Buckley, T. N., Cernusak, L. A., Novick, K. A., Poulter, B., Siegwolf, R. T. W., et al. (2020). Plant responses to rising vapor pressure deficit. New Phytol. 226, 1550–1566. doi: 10.1111/nph.16485
Hammer, Ø., Harper, D. A. T., and Ryan, P. D. (2001). PAST: paleontological statistics software package for education and data analysis. Palaeontol. Electron. 4, 1–9.
Herrmann, V., McMahon, S. M., Detto, M., Lutz, J. A., Davies, S. J., Chang-Yang, C.-H., et al. (2016). Tree circumference dynamics in four forests characterized using automated dendrometer bands. PLoS One 11:e0169020. doi: 10.1371/journal.pone.0169020
Hladik, A., and Blanc, P. (1987). Croissance des plantes en sous-bois de forêt dense humide (Makokou, Gabon). Rev. Ecol. (Terre Vie) 42, 209–234. doi: 10.3406/revec.1987.5404
Hogan, J. A., McMahon, S. M., Buzzard, V., Michaletz, S. T., Enquist, B. J., Thompson, J., et al. (2019). Drought and the interannual variability of stem growth in an aseasonal, everwet forest. Biotropica 51, 139–154. doi: 10.1111/btp.12624
Holm, J. A., Kueppers, L. M., and Chambers, J. Q. (2017). Novel tropical forests: response to global change. New Phytol. 213, 988–992. doi: 10.1111/nph.14407
Hubau, W., De Mil, T., Van den Bulcke, J., Phillips, O. L., Angoboy Ilondea, B., Van Acker, J., et al. (2019). The persistence of carbon in the African forest understory. Nat. Plants 5, 133–140. doi: 10.1038/s41477-018-0316-5
Hubau, W., Lewis, S. L., Phillips, O. L., Affum-Baffoe, K., Beeckman, H., Cuní-Sanchez, A., et al. (2020). Asynchronous carbon sink saturation in African and Amazonian tropical forests. Nature 579, 80–87. doi: 10.1038/s41586-020-2035-0
Kaewmano, A., Fu, P.-L., Fan, Z.-X., Pumijumnong, N., Zuidema, P. A., and Bräuning, A. (2022). Climatic influences on intra-annual stem radial variations and xylem formation of Toona ciliata at two Asian tropical forest sites with contrasting soil water availability. Agric. For. Meteorol. 318:108906. doi: 10.1016/j.agrformet.2022.108906
Klepper, B., Browning, V. D., and Taylor, H. M. (1971). Stem diameter in relation to plant water status. Plant Physiol. 48, 683–685. doi: 10.1104/pp.48.6.683
Knüsel, S., Peters, R. L., Haeni, M., Wilhelm, M., and Zweifel, R. (2021). Processing and extraction of seasonal tree physiological parameters from stem radius time series. Forests 12:765. doi: 10.3390/f12060765
Kursar, T. A., Wright, S. J., and Radulovich, R. (1995). The effects of the rainy season and irrigation on soil water and oxygen in a seasonal Forest in Panama. J. Trop. Ecol. 11, 497–515. doi: 10.1017/S0266467400009044
Lewis, S. L., Edwards, D. P., and Galbraith, D. (2015). Increasing human dominance of tropical forests. Science 349, 827–832. doi: 10.1126/science.aaa9932
Locosselli, G. M., Brienen, R. J. W., Leite, M. D. S., Gloor, M., Krottenthaler, S., Oliveira, A. A., et al. (2020). Global tree-ring analysis reveals rapid decrease in tropical tree longevity with temperature. Proc. Natl. Acad. Sci. 117, 33358–33364. doi: 10.1073/pnas.2003873117
Lowman, M. D., and Moffett, M. (1993). The ecology of tropical rain forest canopies. Trends Ecol. Evol. 8, 104–107. doi: 10.1016/0169-5347(93)90061-S
Lubini, A. (1997). La végétation de la Réserve de biosphère de Luki au Mayombe (Zaïre). Meise, Belgium: Jardin botanique national de Belgique.
Medlyn, B. E., Dreyer, E., Ellsworth, D., Forstreuter, M., Harley, P. C., Kirschbaum, M. U. F., et al. (2002). Temperature response of parameters of a biochemically based model of photosynthesis. II. A review of experimental data. Plant Cell Environ. 25, 1167–1179. doi: 10.1046/j.1365-3040.2002.00891.x
Mencuccini, M., Salmon, Y., Mitchell, P., Hölttä, T., Choat, B., Meir, P., et al. (2017). An empirical method that separates irreversible stem radial growth from bark water content changes in trees: theory and case studies. Plant Cell Environ. 40, 290–303. doi: 10.1111/pce.12863
Monteiro, R. F. R. (1962). Le massif forestier du Mayumbe Angolais. Bois For. Trop. 82, 3–17. doi: 10.19182/bft1962.82.a18862
Morin-Rivat, J., Fayolle, A., Favier, C., Bremond, L., Gourlet-Fleury, S., Bayol, N., et al. (2017). Present-day central African forest is a legacy of the 19th century human history. eLife 6:e20343. doi: 10.7554/eLife.20343
Ortega Rodriguez, D. R., Sánchez-Salguero, R., Hevia, A., Granato-Souza, D., Cintra, B. B. L., Hornink, B., et al. (2023). Climate variability of the southern Amazon inferred by a multi-proxy tree-ring approach using Cedrela fissilis Vell. Sci. Total Environ. 871:162064. doi: 10.1016/j.scitotenv.2023.162064
Ouédraogo, D.-Y., Mortier, F., Gourlet-Fleury, S., Freycon, V., and Picard, N. (2013). Slow-growing species cope best with drought: evidence from long-term measurements in a tropical semi-deciduous moist forest of Central Africa. J. Ecol. 101, 1459–1470. doi: 10.1111/1365-2745.12165
Pan, Y., Birdsey, R. A., Fang, J., Houghton, R., Kauppi, P. E., Kurz, W. A., et al. (2011). A large and persistent carbon sink in the World’s forests. Science 333, 988–993. doi: 10.1126/science.1201609
Perez, T. M., and Feeley, K. J. (2020). Photosynthetic heat tolerances and extreme leaf temperatures. Funct. Ecol. 34, 2236–2245. doi: 10.1111/1365-2435.13658
Peters, R. L., Steppe, K., Cuny, H. E., De Pauw, D. J. W., Frank, D. C., Schaub, M., et al. (2021). Turgor – a limiting factor for radial growth in mature conifers along an elevational gradient. New Phytol. 229, 213–229. doi: 10.1111/nph.16872
Pompa-García, M., and Camarero, J. J. (Eds.) (2020). Latin American Dendroecology: Combining tree-ring sciences and ecology in a megadiverse territory. Cham, Switzerland: Springer.
Réjou-Méchain, M., Mortier, F., Bastin, J.-F., Cornu, G., Barbier, N., Bayol, N., et al. (2021). Unveiling African rainforest composition and vulnerability to global change. Nature 593, 90–94. doi: 10.1038/s41586-021-03483-6
Rondeux, J. (1999). La mesure des arbres et des peuplements forestiers (2ème édition). Gembloux, Belgium: Les Presses agronomiques de Gembloux.
Rossi, S., Anfodillo, T., and Menardi, R. (2006a). Trephor: a new tool for sampling microcores from tree stems. IAWA J. 27, 89–97. doi: 10.1163/22941932-90000139
Rossi, S., Deslauriers, A., and Anfodillo, T. (2006b). Assessment of cambial activity and Xylogenesis by microsampling tree species: an example at the alpine timberline. IAWA J. 27, 383–394. doi: 10.1163/22941932-90000161
Schippers, P., Sterck, F., Vlam, M., and Zuidema, P. A. (2015). Tree growth variation in the tropical forest: understanding effects of temperature, rainfall and CO2. Glob. Chang. Biol. 21, 2749–2761. doi: 10.1111/gcb.12877
Sénéchal, J., Kabala, M., and Fournier, F. (1989). Revue des connaissances sur le Mayombe. Paris, France: UNESCO-PNUD.
Seo, J.-W., Eckstein, D., and Schmitt, U. (2007). The pinning method: from pinning to data preparation. Dendrochronologia 25, 79–86. doi: 10.1016/j.dendro.2007.04.001
Shi, J. Q., and Choi, T. (2011). Gaussian process regression analysis for functional data. Chapman and Hall: CRC.
Sievert, C., Parmer, C., Hocking, T., Chamberlain, S., Ram, K., Corvellec, M., et al. (2024). Create Interactive Web Graphics via “plotly.js” [R package plotly version 4.10.4]. Comprehensive R Archive Network (CRAN). Available at: https://CRAN.R-project.org/package=plotly
Spanner, G. C., Gimenez, B. O., Wright, C. L., Menezes, V. S., Newman, B. D., Collins, A. D., et al. (2022). Dry season transpiration and soil water dynamics in the Central Amazon. Front. Plant Sci. 13:13. doi: 10.3389/fpls.2022.825097
Steppe, K., Sterck, F., and Deslauriers, A. (2015). Diel growth dynamics in tree stems: linking anatomy and ecophysiology. Trends Plant Sci. 20, 335–343. doi: 10.1016/j.tplants.2015.03.015
Sullivan, M. J. P., Lewis, S. L., Affum-Baffoe, K., Castilho, C., Costa, F., Sanchez, A. C., et al. (2020). Long-term thermal sensitivity of Earth’s tropical forests. Science 368, 869–874. doi: 10.1126/science.aaw7578
Tarelkin, Y., Delvaux, C., Ridder, M. D., Berkani, T. E., Cannière, C. D., and Beeckman, H. (2016). Growth-ring distinctness and boundary anatomy variability in tropical trees. IAWA J. 37, 275–S7. doi: 10.1163/22941932-20160134
Tarelkin, Y., Hufkens, K., Hahn, S., Van den Bulcke, J., Bastin, J.-F., Ilondea, B. A., et al. (2019). Wood anatomy variability under contrasted environmental conditions of common deciduous and evergreen species from central African forests. Trees 33, 893–909. doi: 10.1007/s00468-019-01826-5
Torti, S. D., Coley, P. D., and Kursar, T. A. (2001). Causes and consequences of monodominance in tropical lowland forests. Am. Nat. 157, 141–153. doi: 10.1086/318629
Trenberth, K. E. (2011). Changes in precipitation with climate change. Clim. Res. 47, 123–138. doi: 10.3354/cr00953
Trouet, V., Coppin, P., and Beeckman, H. (2006). Annual growth ring patterns in Brachystegia spiciformis reveal influence of precipitation on tree growth. Biotropica 38, 375–382. doi: 10.1111/j.1744-7429.2006.00155.x
Tsalefac, M., Hiol-Hiol, F., Mahé, G., Laraque, A., Sonwa, D. J., Scholte, P., et al. (2015). “Climate of Central Africa: Past, present and future” in The Forests of the Congo Basin: Forests and climate change. eds. C. D. M. Wasseige, T. R. Eba’a-Atyi and C. Doumenge. CIFOR, 37–52.
van den Berg, E., Chazdon, R., and Corrêa, B. S. (2012). Tree growth and death in a tropical gallery forest in Brazil: understanding the relationships among size, growth, and survivorship for understory and canopy dominant species. Plant Ecol. 213, 1081–1092. doi: 10.1007/s11258-012-0067-8
Vieira, S., de Camargo, P. B., Selhorst, D., da Silva, R., Hutyra, L., Chambers, J. Q., et al. (2004). Forest structure and carbon dynamics in Amazonian tropical rain forests. Oecologia 140, 468–479. doi: 10.1007/s00442-004-1598-z
Wagner, F., Rossi, V., Aubry-Kientz, M., Bonal, D., Dalitz, H., Gliniars, R., et al. (2014). Pan-tropical analysis of climate effects on seasonal tree growth. PLoS One 9:e92337. doi: 10.1371/journal.pone.0092337
WMO (2023). WMO global annual to decadal climate update (target years: 2023–2027). Geneva, Switzerland: World Meteorological Organization.
Worbes, M. (1999). Annual growth rings, rainfall-dependent growth and long-term growth patterns of tropical trees from the Caparo Forest Reserve in Venezuela. J. Ecol. 87, 391–403. doi: 10.1046/j.1365-2745.1999.00361.x
Zuidema, P. A., Babst, F., Groenendijk, P., Trouet, V., Abiyu, A., Acuña-Soto, R., et al. (2022). Tropical tree growth driven by dry-season climate variability. Nat. Geosci. 15, 269–276. doi: 10.1038/s41561-022-00911-8
Zweifel, R. (2016). Radial stem variations – a source of tree physiological information not fully exploited yet. Plant Cell Environ. 39, 231–232. doi: 10.1111/pce.12613
Zweifel, R., Haeni, M., Buchmann, N., and Eugster, W. (2016). Are trees able to grow in periods of stem shrinkage? New Phytol. 211, 839–849. doi: 10.1111/nph.13995
Keywords: high-resolution dendrometer, shrinkage-swelling pattern, stem growth rate, secondary growth, Central Africa forests, tropical forests
Citation: Luse Belanganayi B, Angoboy Ilondea B, Mbungu Phaka C, Laurent F, Djiofack BY, Kafuti C, Peters RL, Bourland N, Beeckman H and De Mil T (2024) Diel and annual rhythms of tropical stem size changes in the Mayombe forest, Congo Basin. Front. For. Glob. Change. 7:1185225. doi: 10.3389/ffgc.2024.1185225
Edited by:
Göran Wallin, University of Gothenburg, SwedenReviewed by:
Daigard Ricardo Ortega Rodriguez, University of São Paulo, BrazilJiri Dolezal, University of South Bohemia, Czechia
Copyright © 2024 Luse Belanganayi, Angoboy Ilondea, Mbungu Phaka, Laurent, Djiofack, Kafuti, Peters, Bourland, Beeckman and De Mil. This is an open-access article distributed under the terms of the Creative Commons Attribution License (CC BY). The use, distribution or reproduction in other forums is permitted, provided the original author(s) and the copyright owner(s) are credited and that the original publication in this journal is cited, in accordance with accepted academic practice. No use, distribution or reproduction is permitted which does not comply with these terms.
*Correspondence: Basile Luse Belanganayi, Yi5sdXNlQGRvY3QudWxpZWdlLmJl